Embed Size (px)
Citation preview
CLIMATE CHANGE AND MINNESOTA FORESTS
CLIMATE-INFORMED FOREST MANAGEMENT FORUM GRAND RAPIDS, MN
MAY 7, 2014
What’s so special about Minnesota?
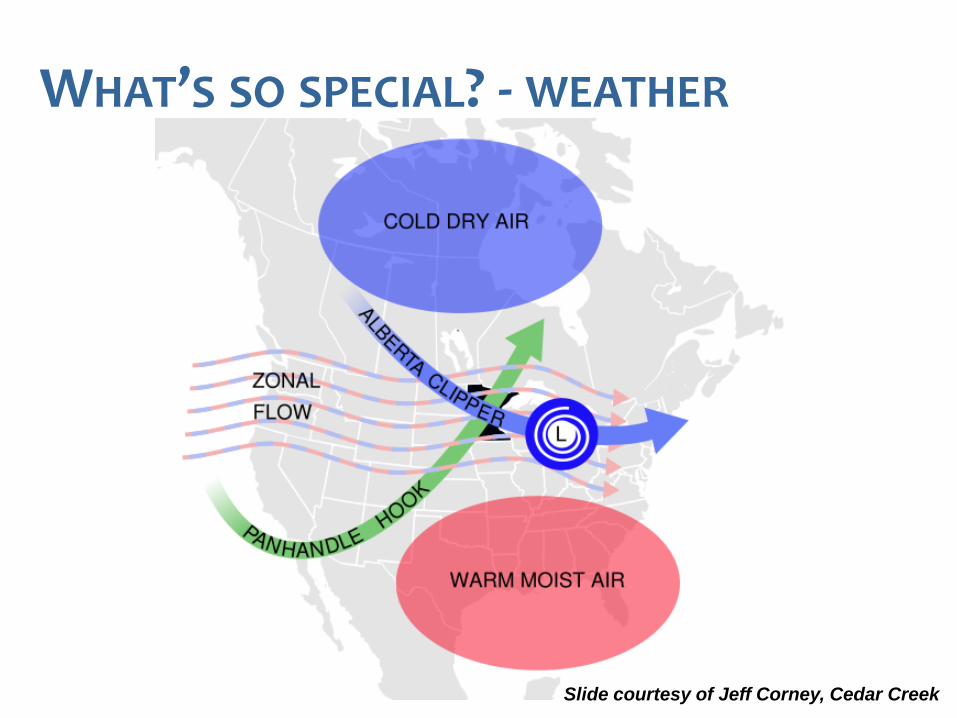
WHAT’S SO SPECIAL? - WEATHER
Slide courtesy of Jeff Corney, Cedar Creek
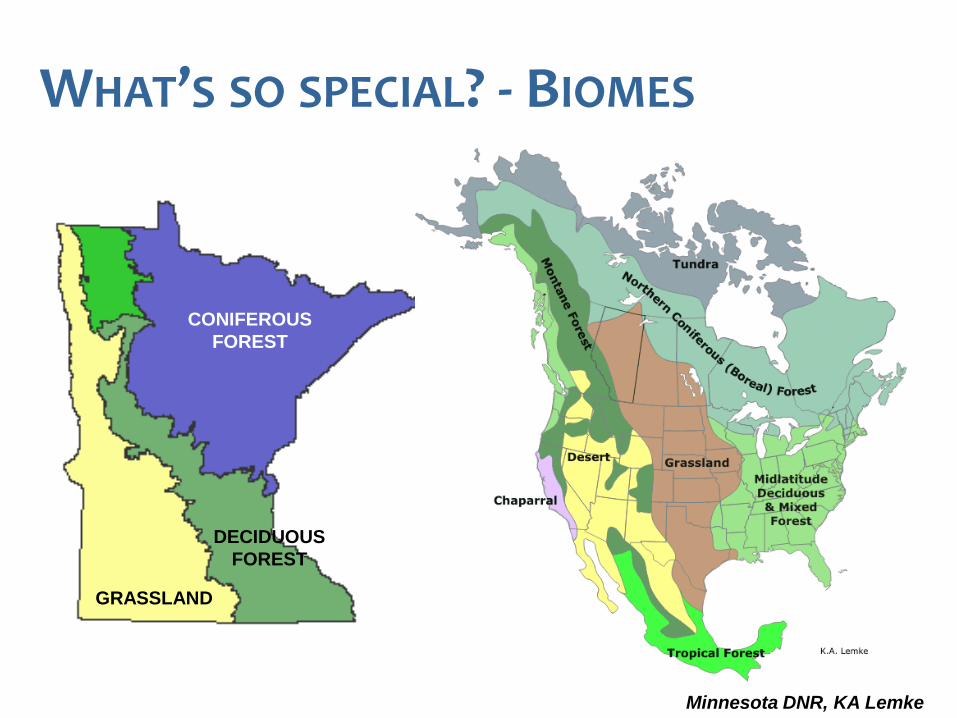
WHAT’S SO SPECIAL? - BIOMES
CONIFEROUS FOREST
DECIDUOUS FOREST
GRASSLAND
Minnesota DNR, KA Lemke
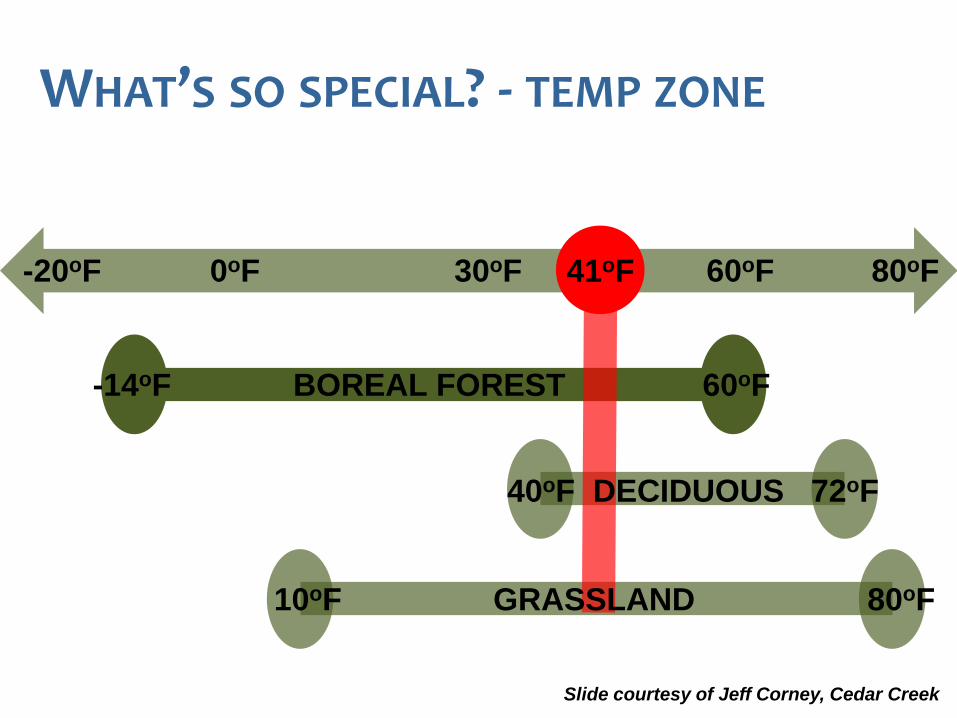
WHAT’S SO SPECIAL? - TEMP ZONE
Slide courtesy of Jeff Corney, Cedar Creek
-14oF BOREAL FOREST 60oF
-20oF 0oF 30oF 41oF 60oF 80oF 41oF
10oF GRASSLAND 80oF
40oF DECIDUOUS 72oF
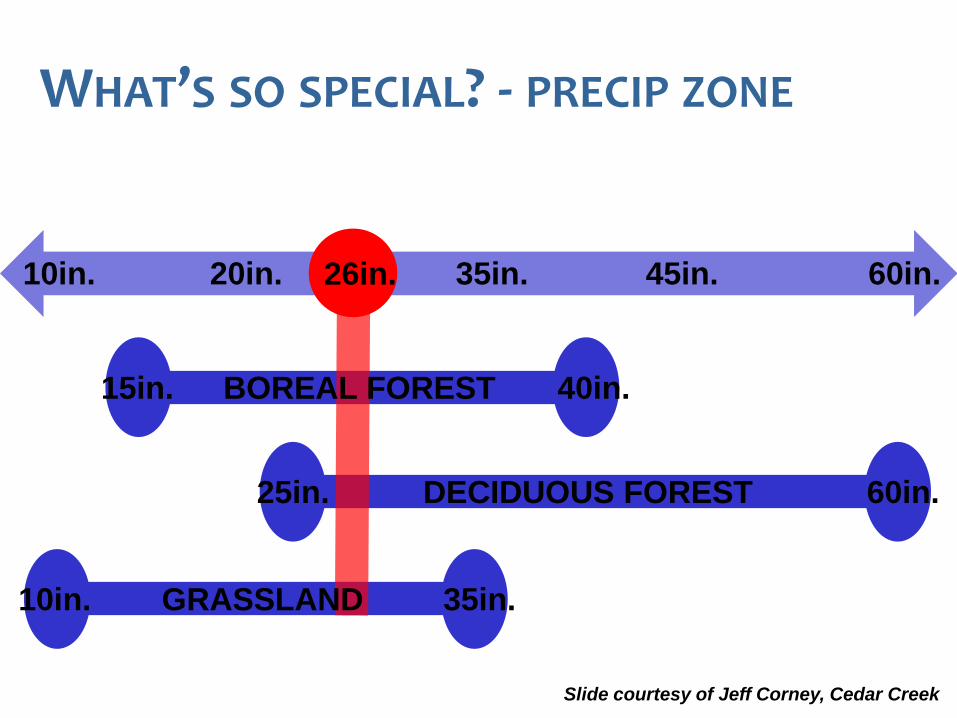
WHAT’S SO SPECIAL? - PRECIP ZONE
Slide courtesy of Jeff Corney, Cedar Creek
10in. 20in. 35in. 45in. 60in. 26in.
25in. DECIDUOUS FOREST 60in.
15in. BOREAL FOREST 40in.
10in. GRASSLAND 35in.
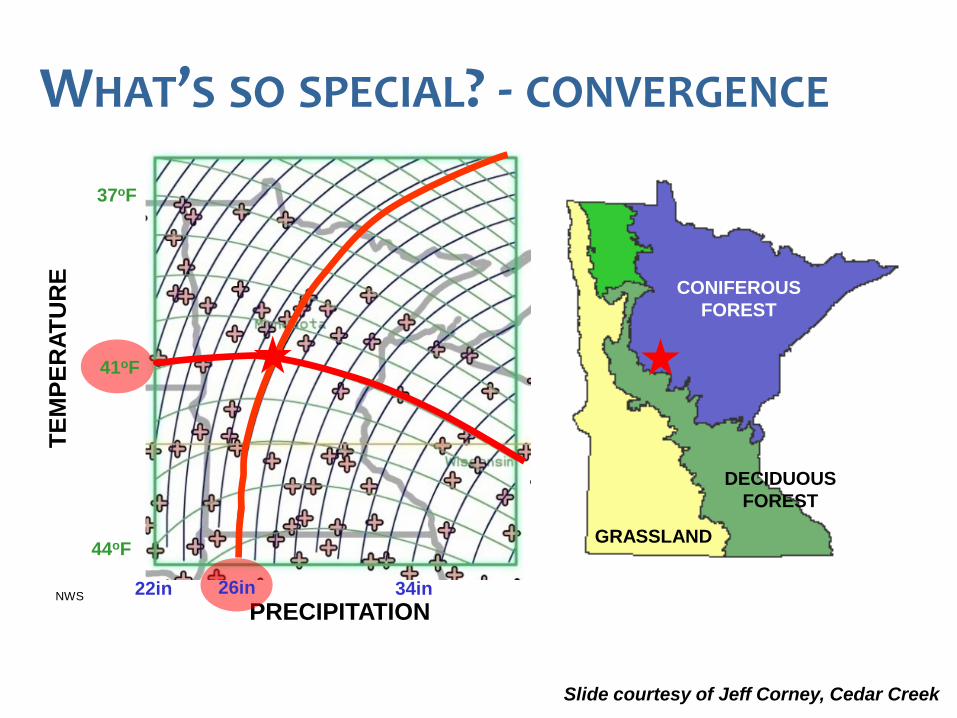
WHAT’S SO SPECIAL? - CONVERGENCE
Slide courtesy of Jeff Corney, Cedar Creek
PRECIPITATION
TEM
PER
ATU
RE
44oF
37oF
41oF
22in 34in 26in NWS
CONIFEROUS FOREST
DECIDUOUS FOREST
GRASSLAND
What’s so special about Minnesota?
• Minnesota’s climate is shaped by several converging atmospheric processes.
• The climate is one of the driving forces that defines biomes and ecosystem types.
• Local factors determine local vegetation. Minnesota will always be special – but not static.

Hasn’t the climate stopped changing in the last 15 years?
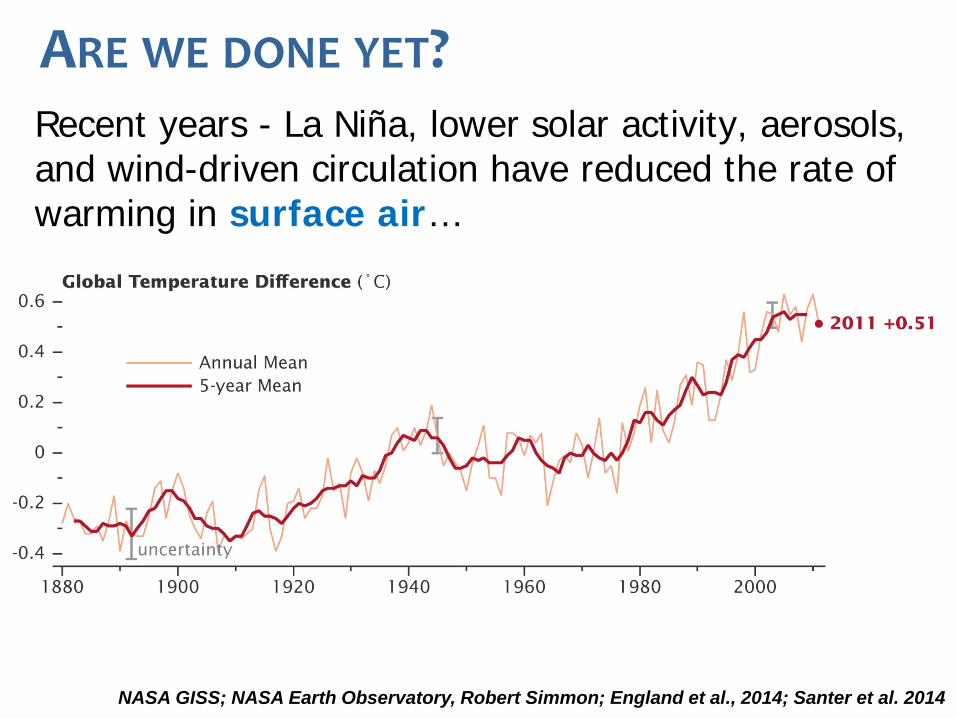
ARE WE DONE YET?
NASA GISS; NASA Earth Observatory, Robert Simmon; England et al., 2014; Santer et al. 2014
Recent years - La Niña, lower solar activity, aerosols, and wind-driven circulation have reduced the rate of warming in surface air…
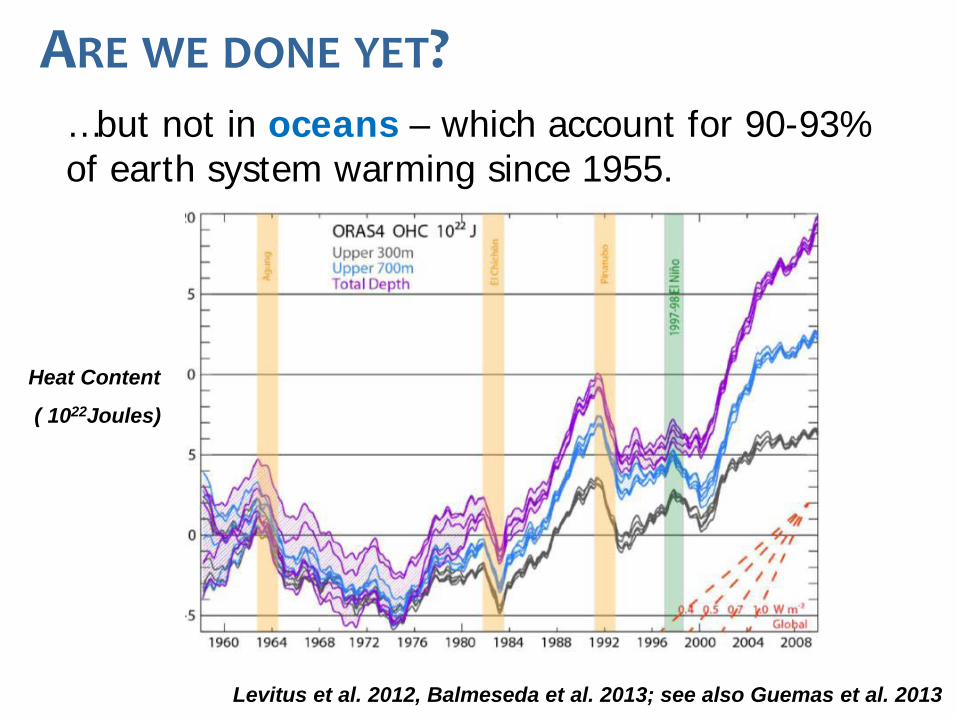
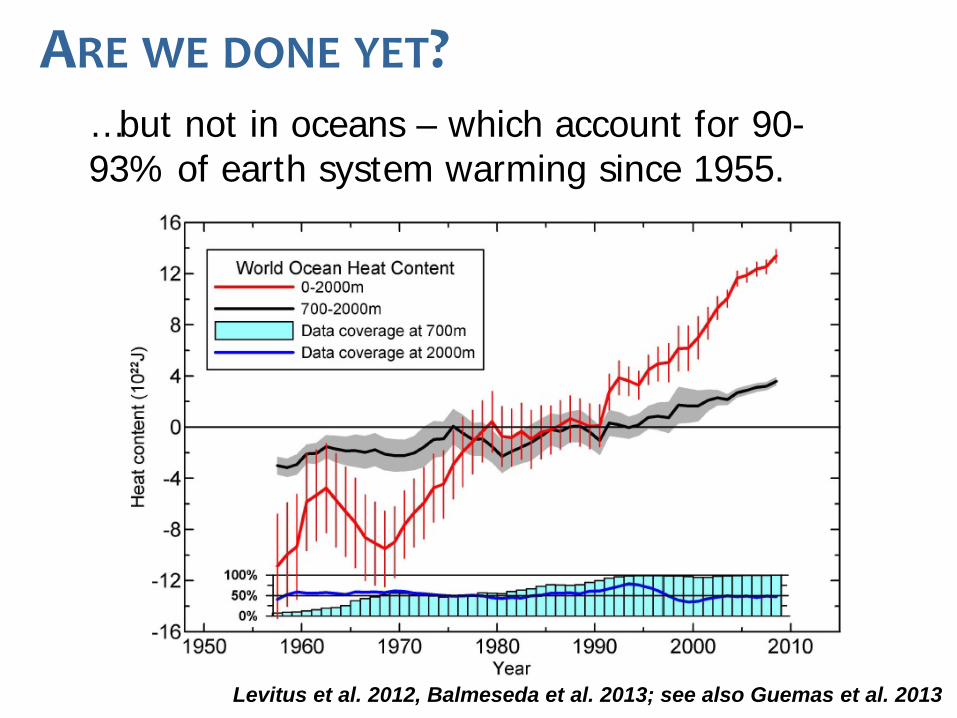
ARE WE DONE YET?
Levitus et al. 2012, Balmeseda et al. 2013; see also Guemas et al. 2013
…but not in oceans – which account for 90-93% of earth system warming since 1955.
Heat Content
( 1022Joules)
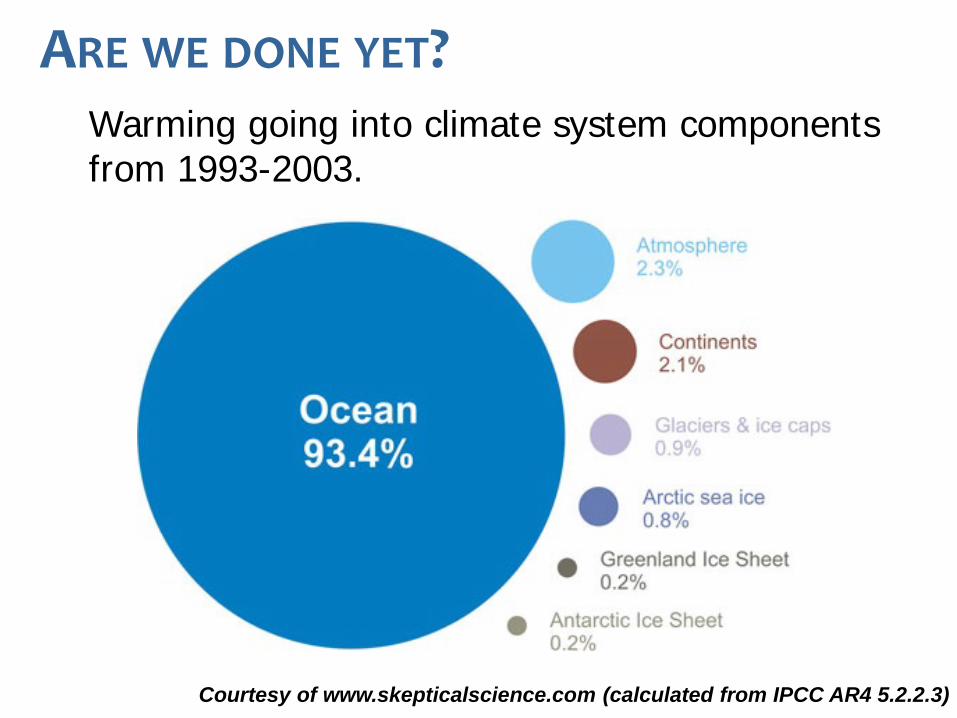
ARE WE DONE YET?
Courtesy of www.skepticalscience.com (calculated from IPCC AR4 5.2.2.3)
Warming going into climate system components from 1993-2003.
Hasn’t the climate stopped changing in the last 15 years?
• Global surface air warming has slowed, but continued.
• The oceans continue to absorb heat. • The oceans have absorbed >90% of warming
since 1955.
No – the earth is still warming.
Has Minnesota’s climate changed?
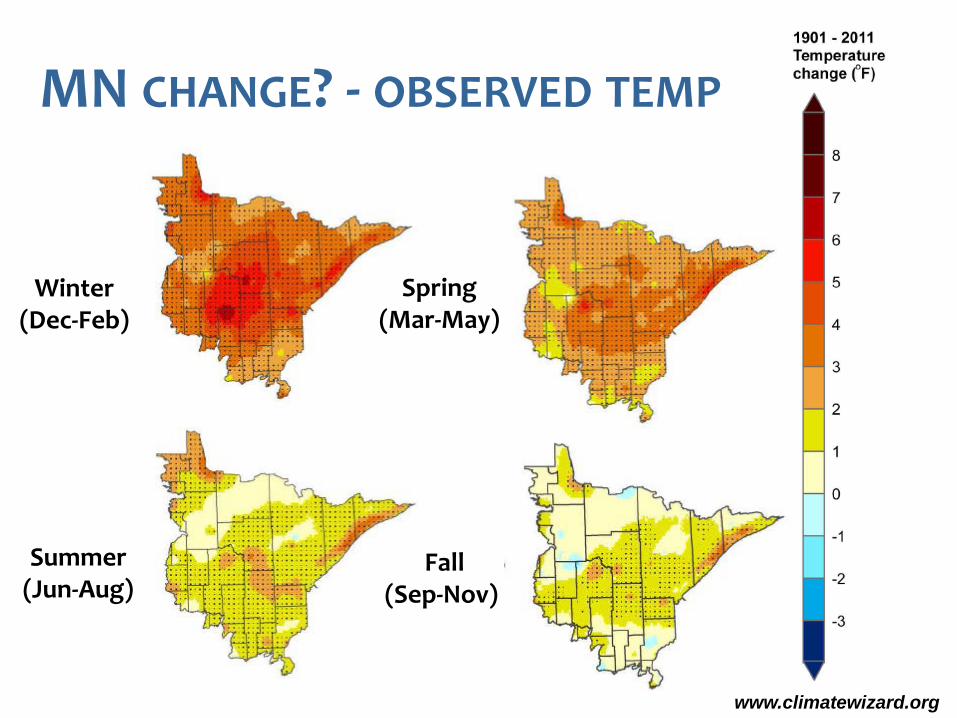
MN CHANGE? - OBSERVED TEMP
Winter (Dec-Feb)
Summer (Jun-Aug)
Spring (Mar-May)
Fall (Sep-Nov)
www.climatewizard.org
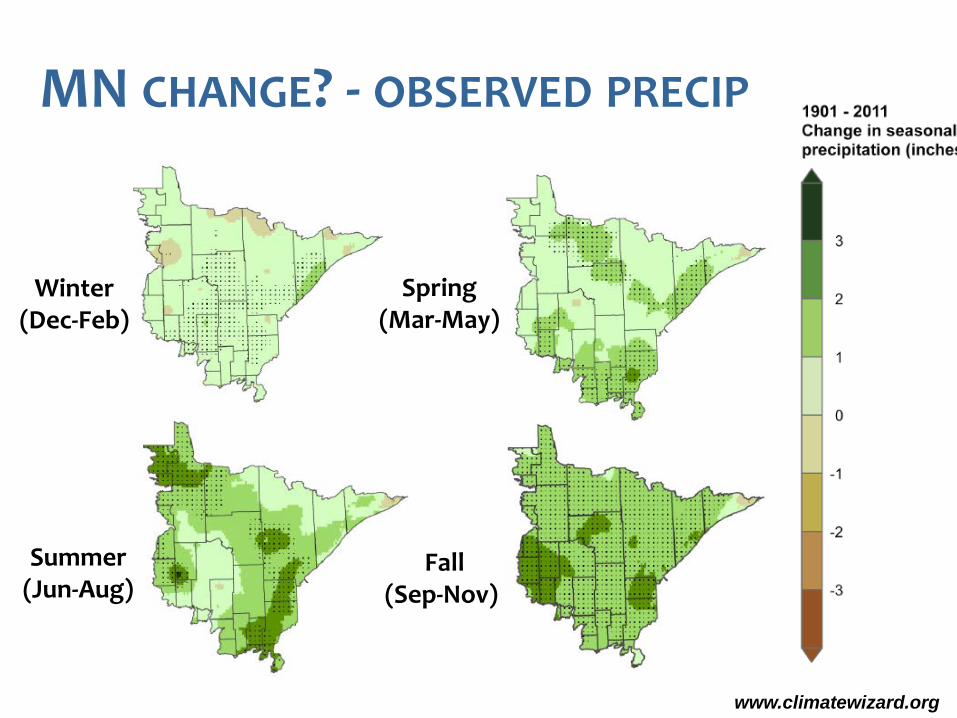
www.climatewizard.org
MN CHANGE? - OBSERVED PRECIP
Winter (Dec-Feb)
Summer (Jun-Aug)
Spring (Mar-May)
Fall (Sep-Nov)
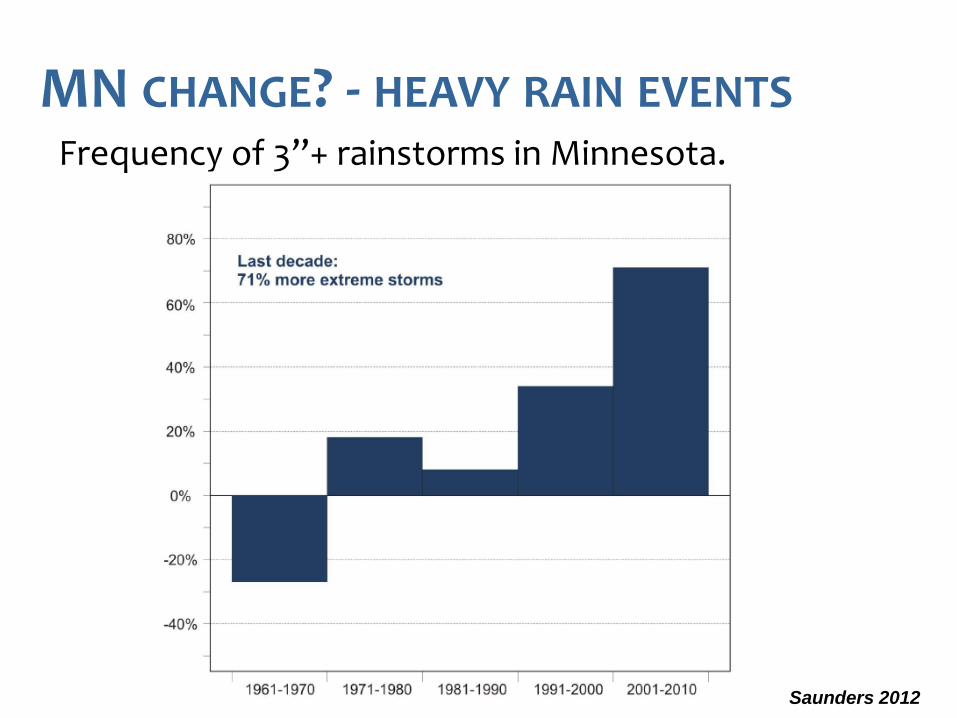
MN CHANGE? - HEAVY RAIN EVENTS Frequency of 3”+ rainstorms in Minnesota.
Saunders 2012
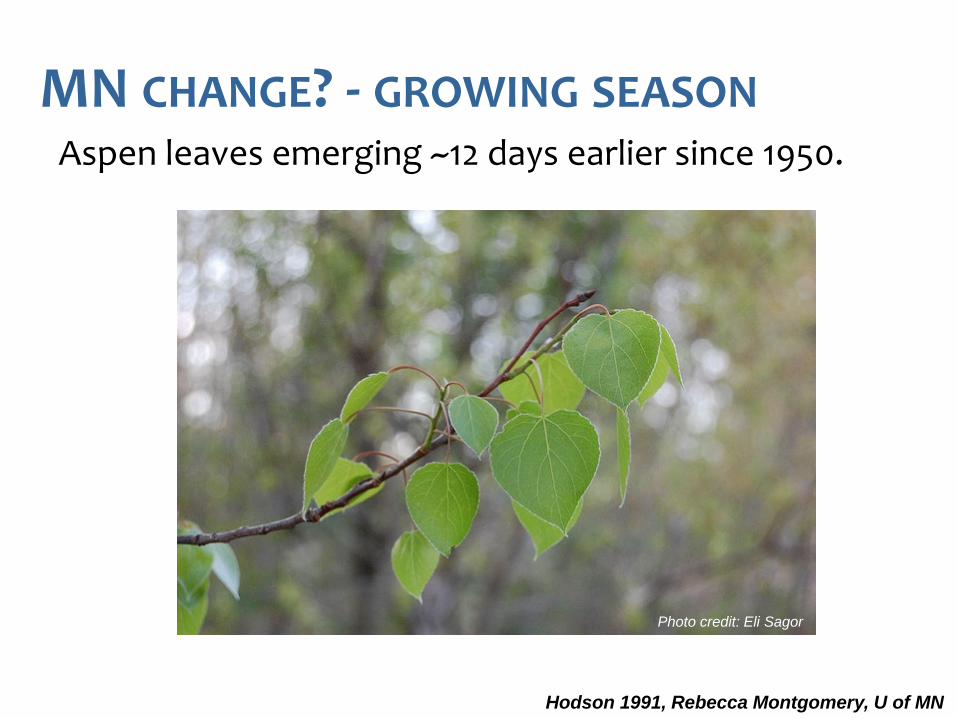
MN CHANGE? - GROWING SEASON Aspen leaves emerging ~12 days earlier since 1950.
Hodson 1991, Rebecca Montgomery, U of MN
Photo credit: Eli Sagor
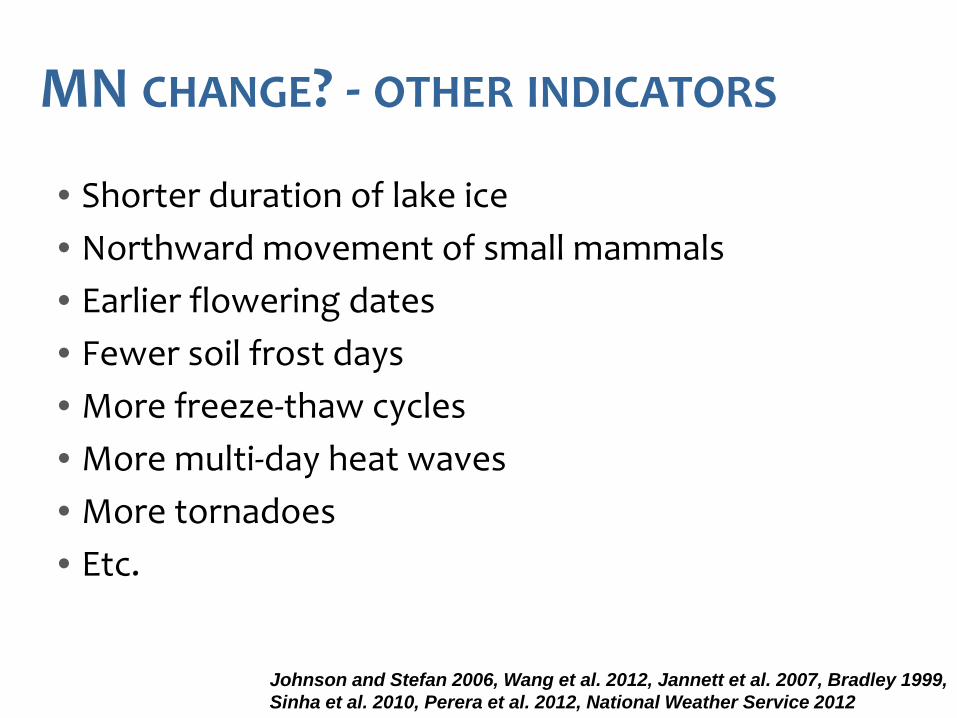
MN CHANGE? - OTHER INDICATORS
• Shorter duration of lake ice • Northward movement of small mammals • Earlier flowering dates • Fewer soil frost days • More freeze-thaw cycles • More multi-day heat waves • More tornadoes • Etc.
Johnson and Stefan 2006, Wang et al. 2012, Jannett et al. 2007, Bradley 1999, Sinha et al. 2010, Perera et al. 2012, National Weather Service 2012
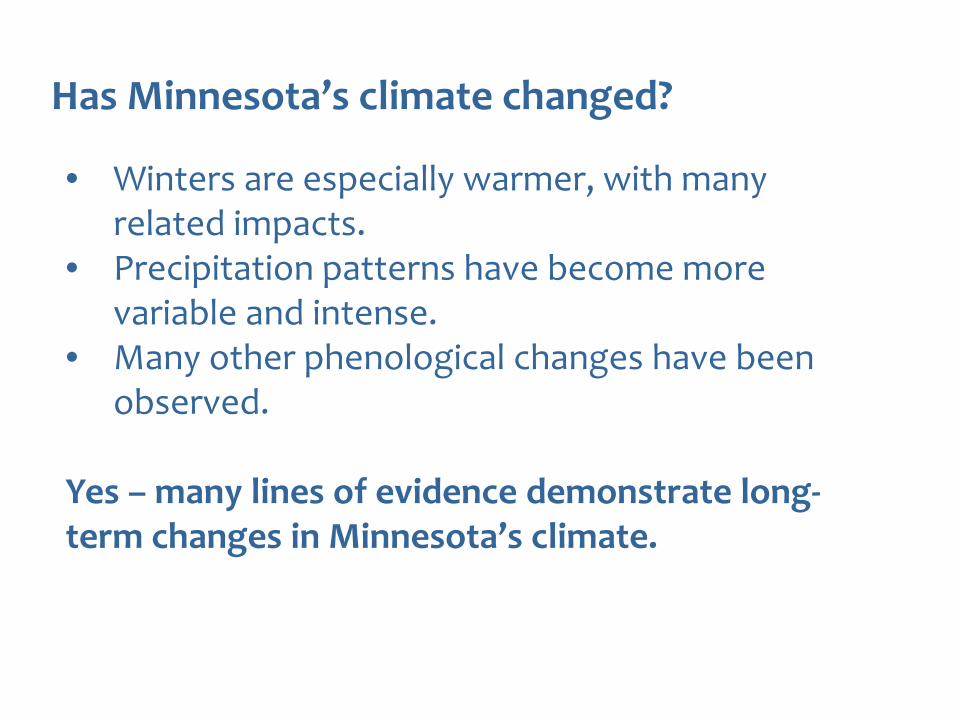
Has Minnesota’s climate changed?
• Winters are especially warmer, with many related impacts.
• Precipitation patterns have become more variable and intense.
• Many other phenological changes have been observed.
Yes – many lines of evidence demonstrate long-term changes in Minnesota’s climate.
I don’t trust models.
(Future projections are too uncertain.)
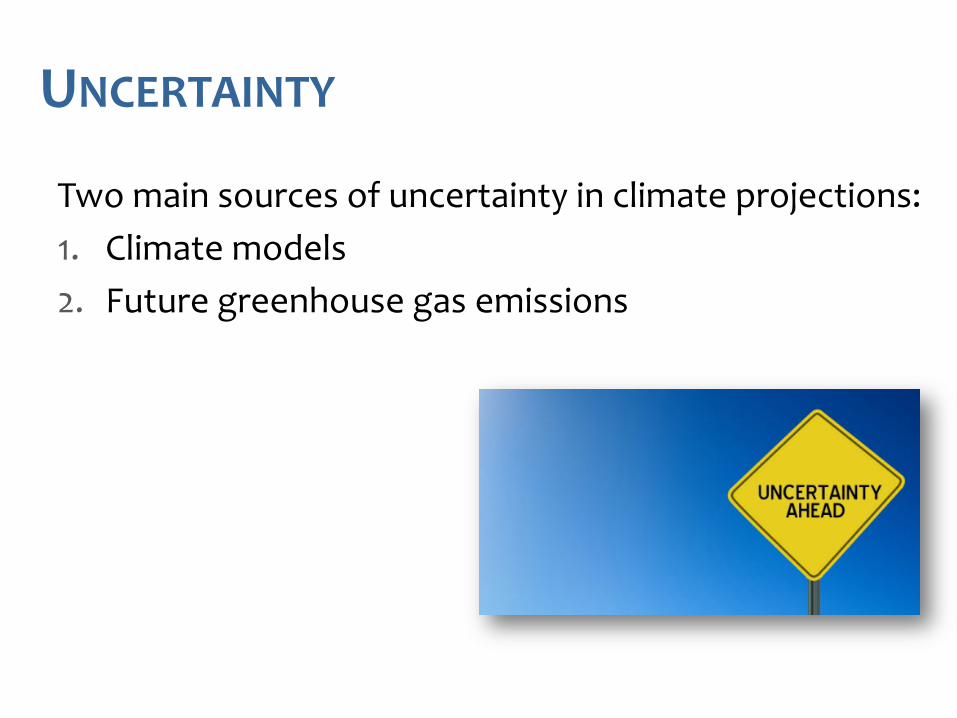
UNCERTAINTY
Two main sources of uncertainty in climate projections: 1. Climate models 2. Future greenhouse gas emissions
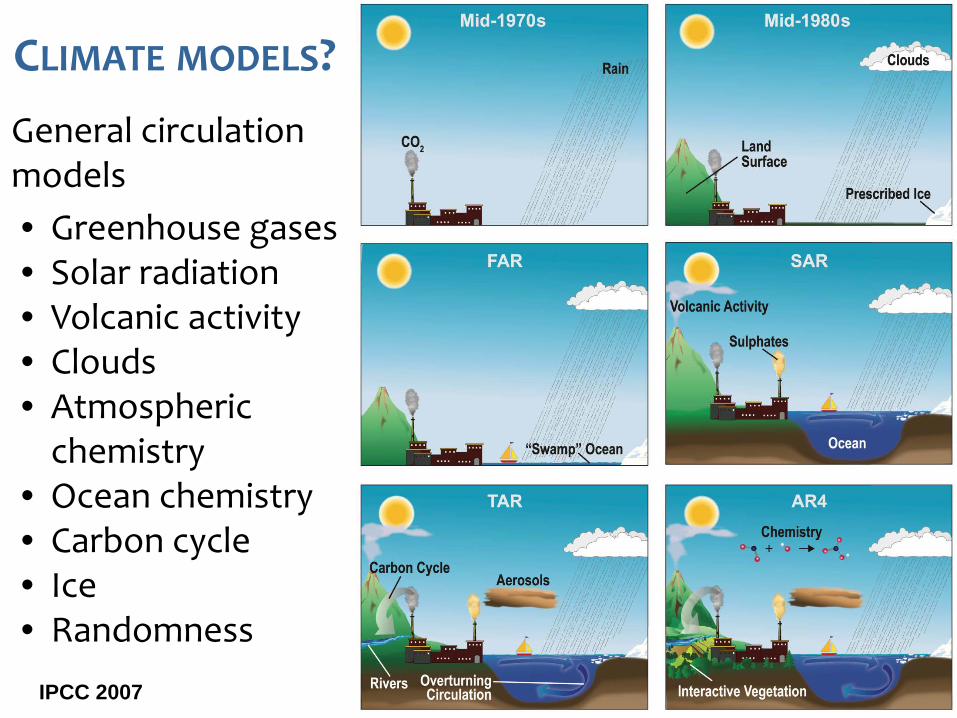
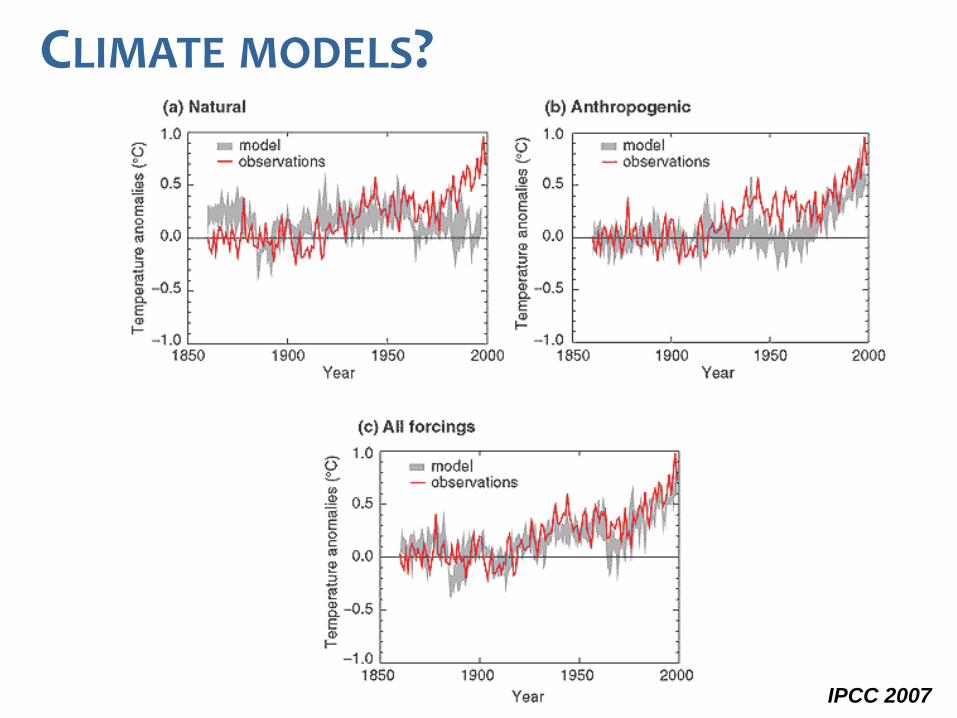
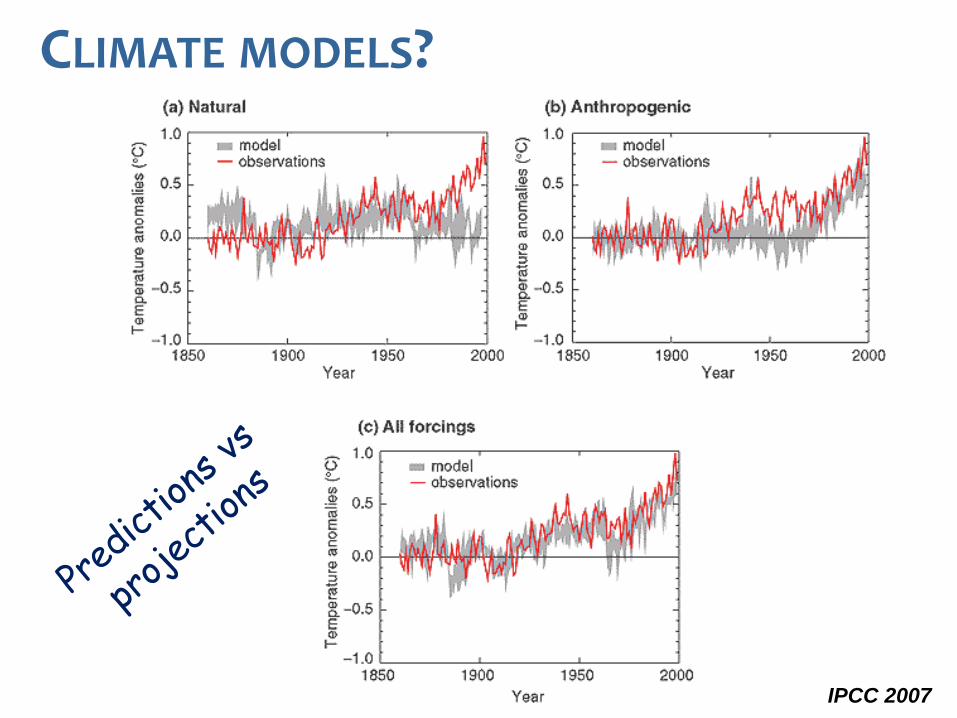
CLIMATE MODELS?
IPCC 2007
• Greenhouse gases • Solar radiation • Volcanic activity • Clouds • Atmospheric
chemistry • Ocean chemistry • Carbon cycle • Ice • Randomness
General circulation models
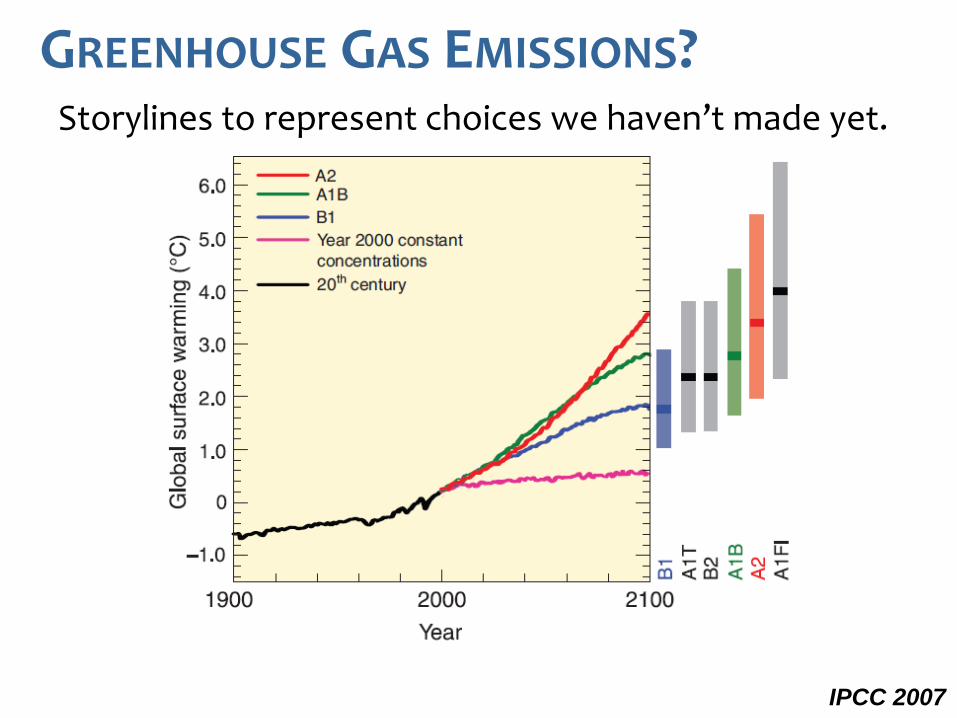
IPCC 2007
GREENHOUSE GAS EMISSIONS? Storylines to represent choices we haven’t made yet.
CLIMATE MODELS?
IPCC 2007
A2 A1B B1
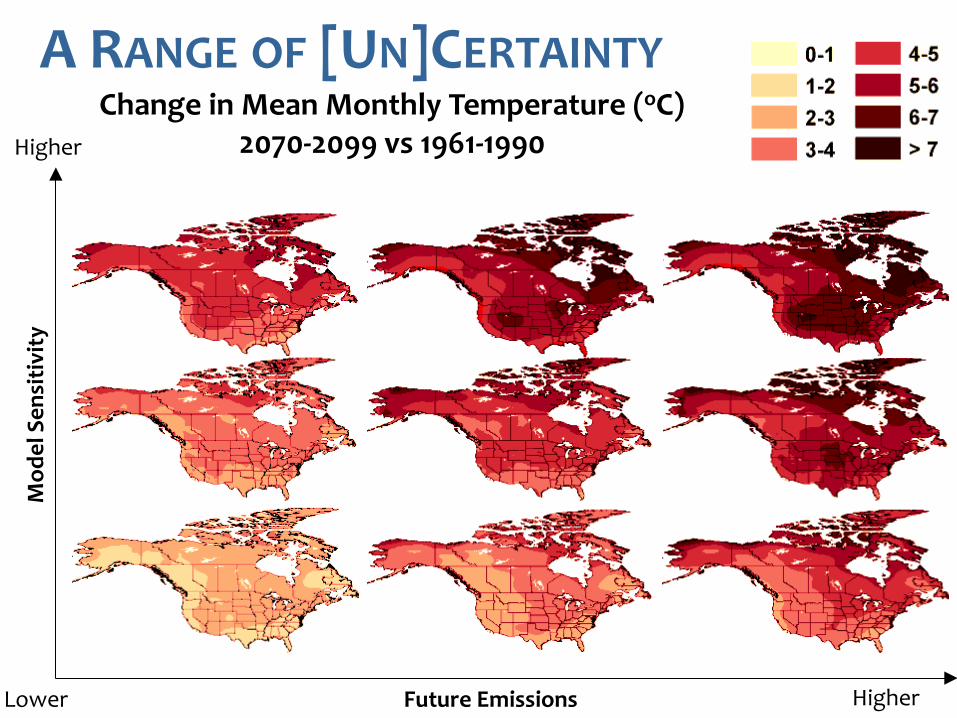
Change in Mean Monthly Temperature (oC) 2070-2099 vs 1961-1990
Future Emissions Lower Higher
CSIRO
MIROC
HAD
Higher
Mod
el S
ensi
tivity
A RANGE OF [UN]CERTAINTY
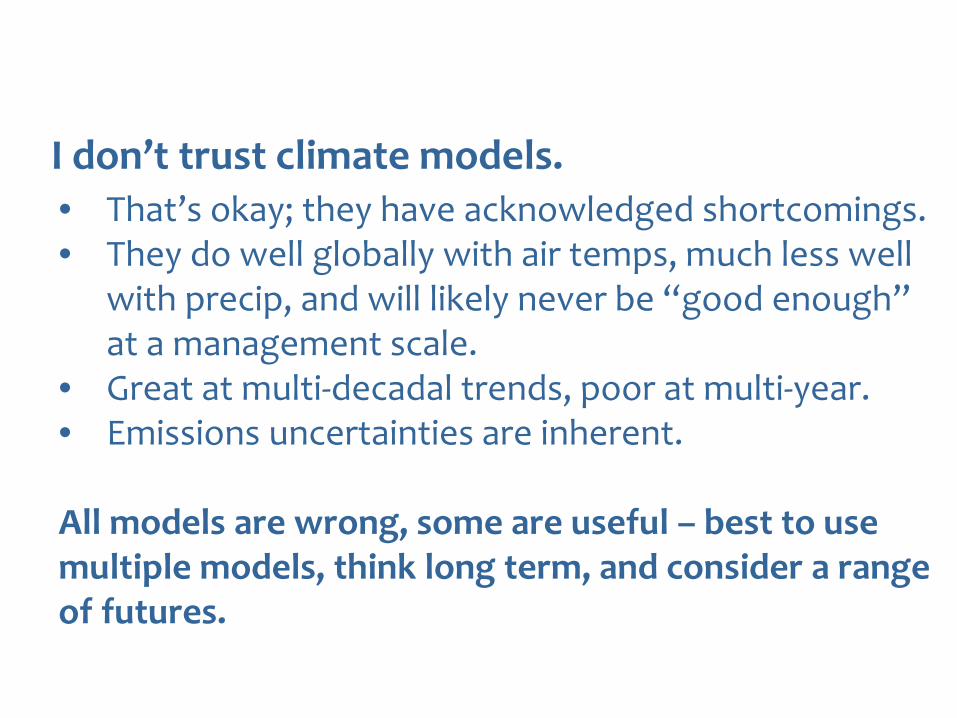
I don’t trust climate models. • That’s okay; they have acknowledged shortcomings. • They do well globally with air temps, much less well
with precip, and will likely never be “good enough” at a management scale.
• Great at multi-decadal trends, poor at multi-year. • Emissions uncertainties are inherent.
All models are wrong, some are useful – best to use multiple models, think long term, and consider a range of futures.
I get it already. So what is the range of climate projections for Minnesota?
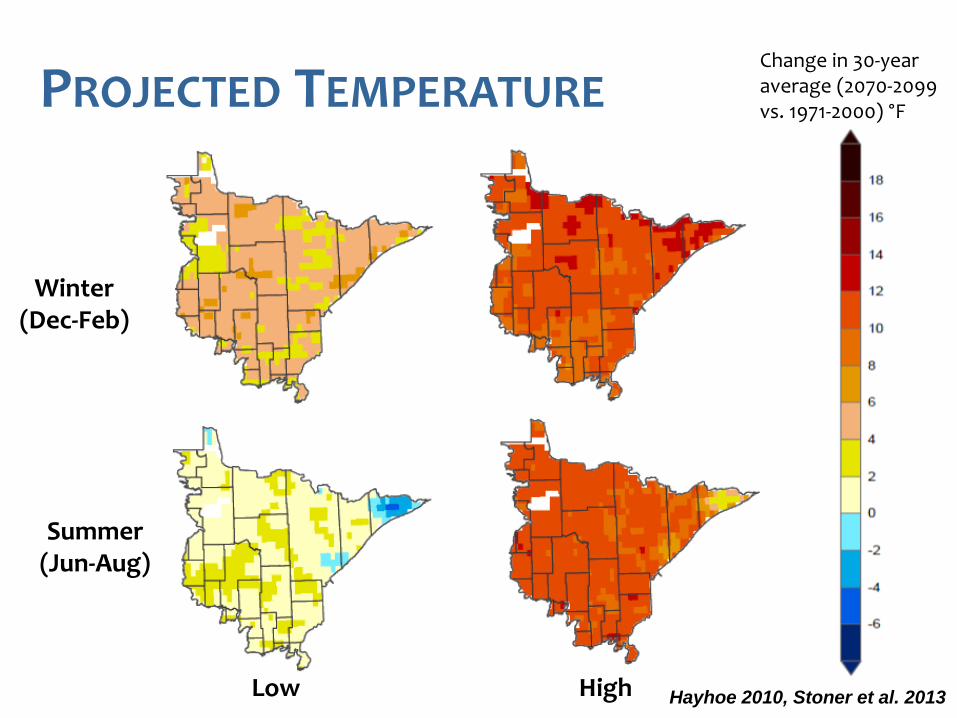
PROJECTED TEMPERATURE
Winter (Dec-Feb)
Summer (Jun-Aug)
High Low
Change in 30-year average (2070-2099 vs. 1971-2000) °F
Hayhoe 2010, Stoner et al. 2013
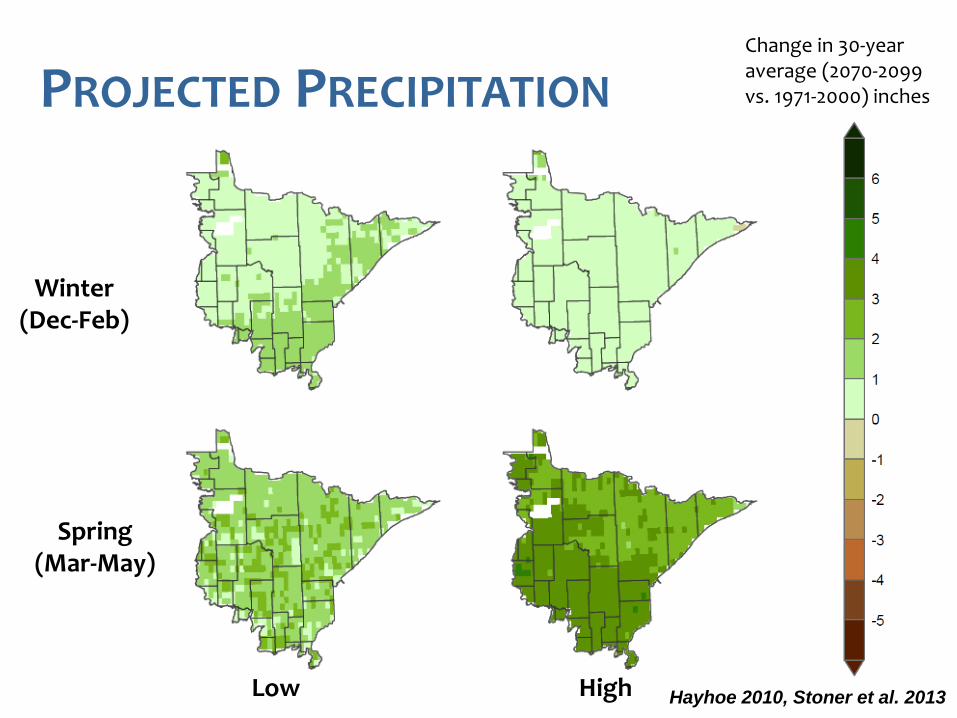
PROJECTED PRECIPITATION
Winter (Dec-Feb)
High Low
Change in 30-year average (2070-2099 vs. 1971-2000) inches
Spring (Mar-May)
Hayhoe 2010, Stoner et al. 2013
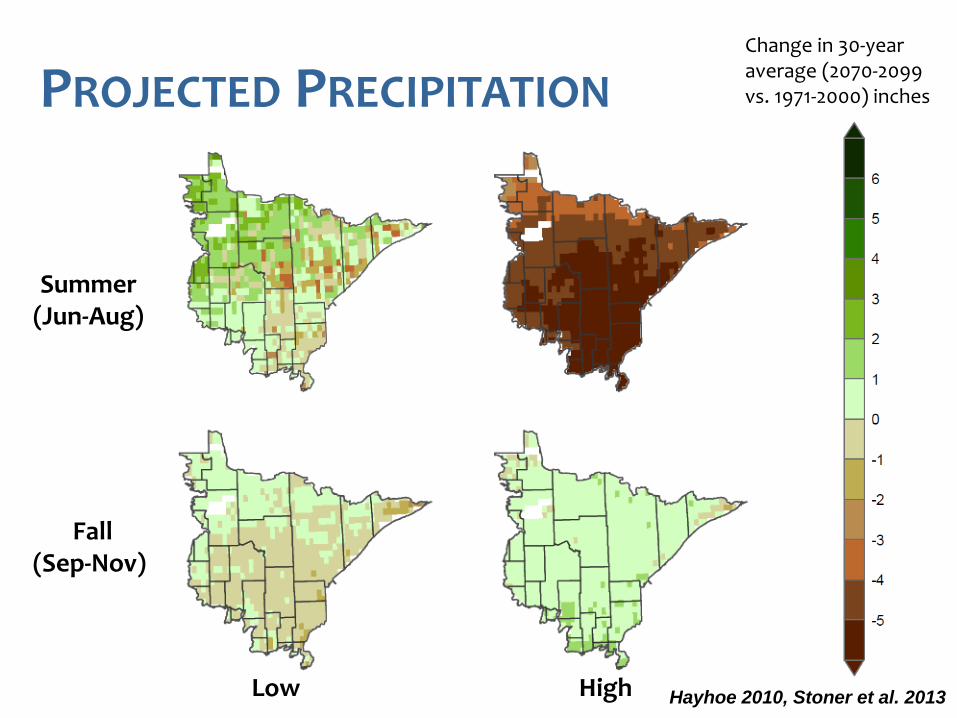
PROJECTED PRECIPITATION
Summer (Jun-Aug)
High Low
Change in 30-year average (2070-2099 vs. 1971-2000) inches
Fall (Sep-Nov)
Hayhoe 2010, Stoner et al. 2013
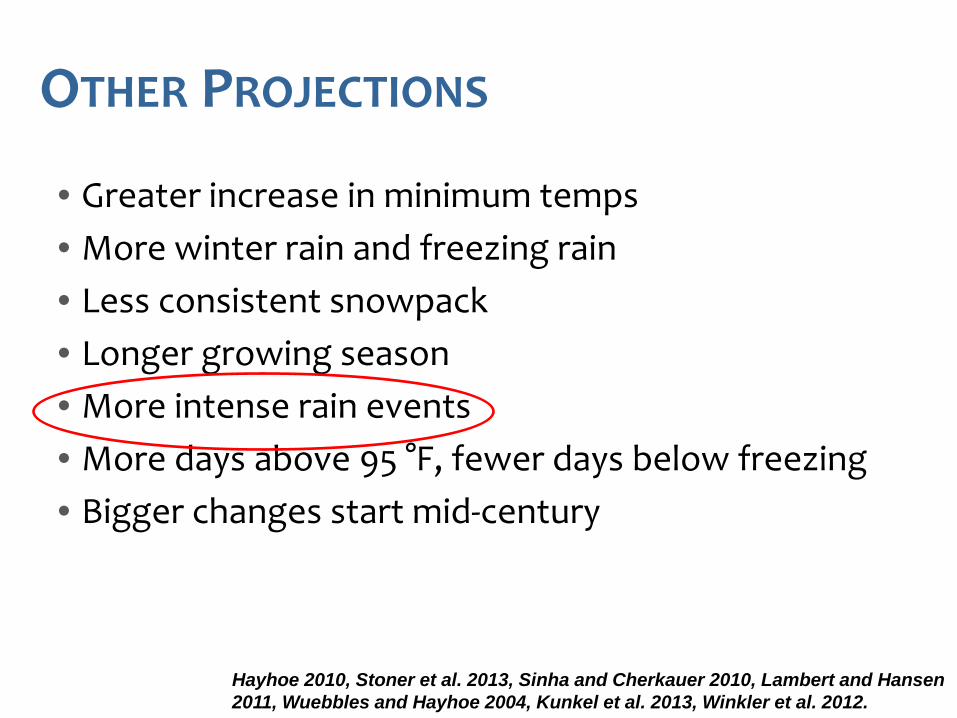
OTHER PROJECTIONS
• Greater increase in minimum temps • More winter rain and freezing rain • Less consistent snowpack • Longer growing season • More intense rain events • More days above 95 °F, fewer days below freezing • Bigger changes start mid-century
Hayhoe 2010, Stoner et al. 2013, Sinha and Cherkauer 2010, Lambert and Hansen 2011, Wuebbles and Hayhoe 2004, Kunkel et al. 2013, Winkler et al. 2012.
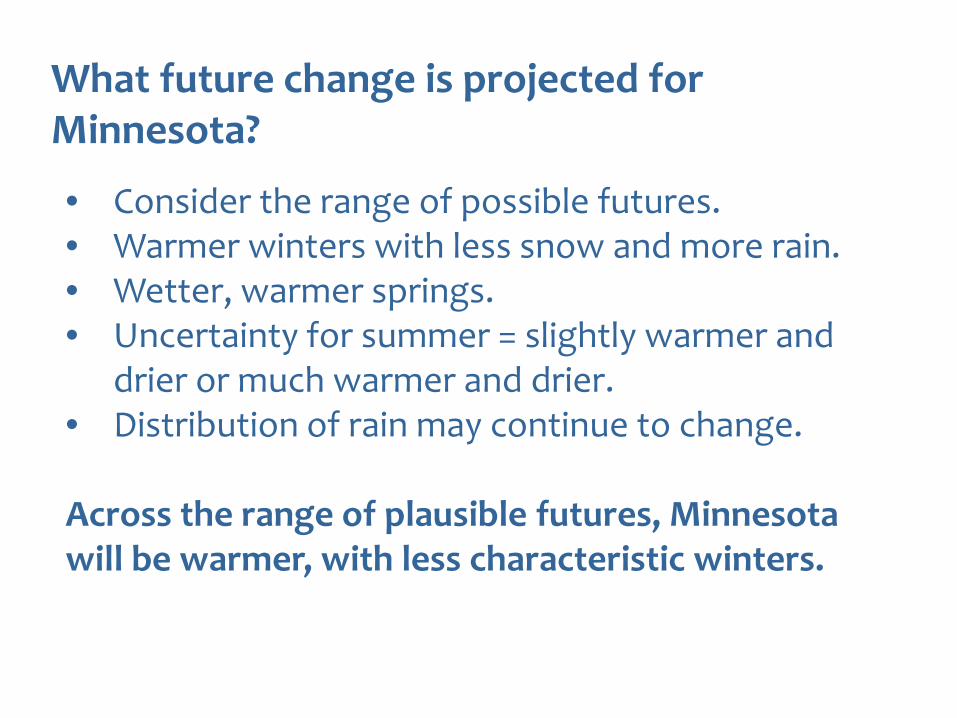
What future change is projected for Minnesota?
• Consider the range of possible futures. • Warmer winters with less snow and more rain. • Wetter, warmer springs. • Uncertainty for summer = slightly warmer and
drier or much warmer and drier. • Distribution of rain may continue to change. Across the range of plausible futures, Minnesota will be warmer, with less characteristic winters.
What will this mean for Minnesota’s forests?
MN FORESTS? - POTENTIAL BENEFITS
It’s not all bad….
MN FORESTS? - POTENTIAL BENEFITS
• Longer growing seasons • Increased precipitation in some seasons • CO2 fertilization • Potential increase in some species • Longer operability window in dry conditions
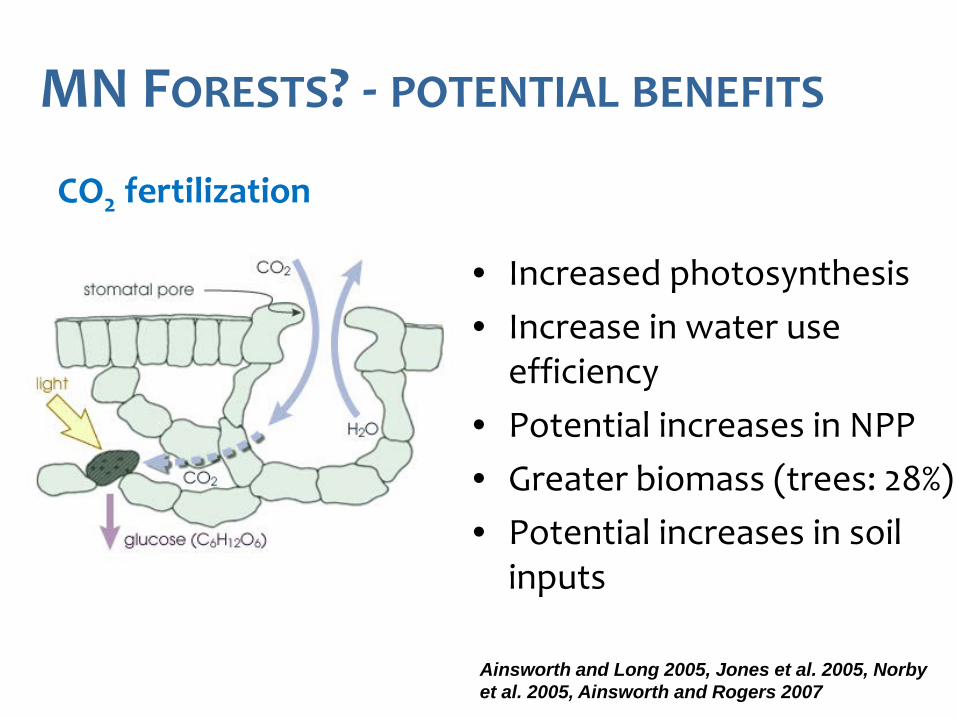
MN FORESTS? - POTENTIAL BENEFITS
CO2 fertilization
• Increased photosynthesis • Increase in water use
efficiency • Potential increases in NPP • Greater biomass (trees: 28%) • Potential increases in soil
inputs
Ainsworth and Long 2005, Jones et al. 2005, Norby et al. 2005, Ainsworth and Rogers 2007
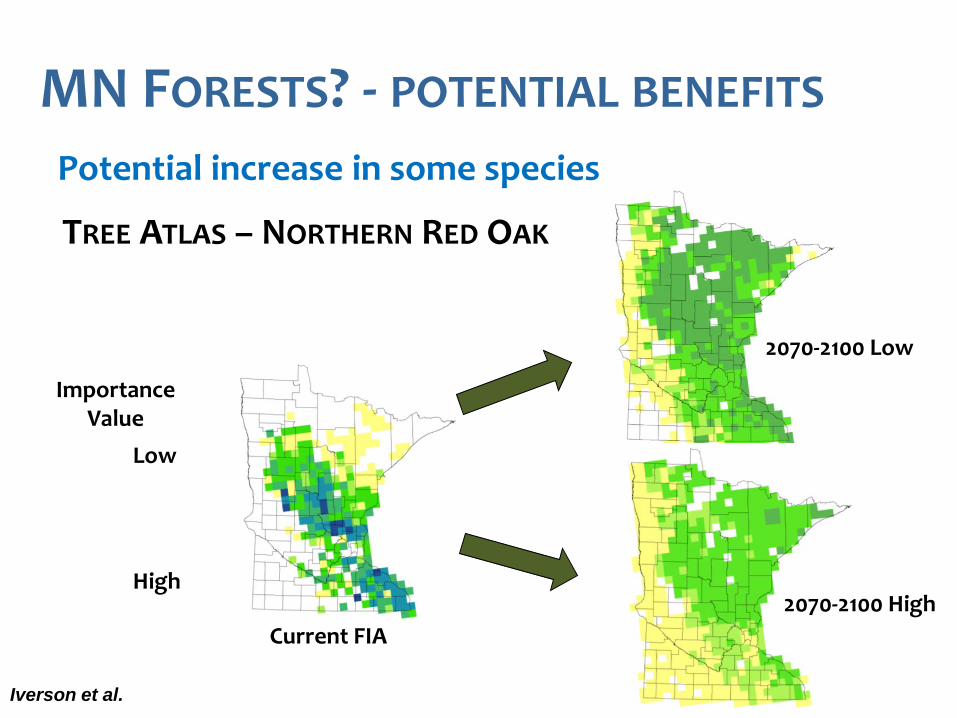
MN FORESTS? - POTENTIAL BENEFITS Potential increase in some species
TREE ATLAS – NORTHERN RED OAK
Importance Value
Low
High
2070-2100 Low
2070-2100 High
Iverson et al.
Current FIA
MN FORESTS? - POTENTIAL STRESSES
It’s not all good….
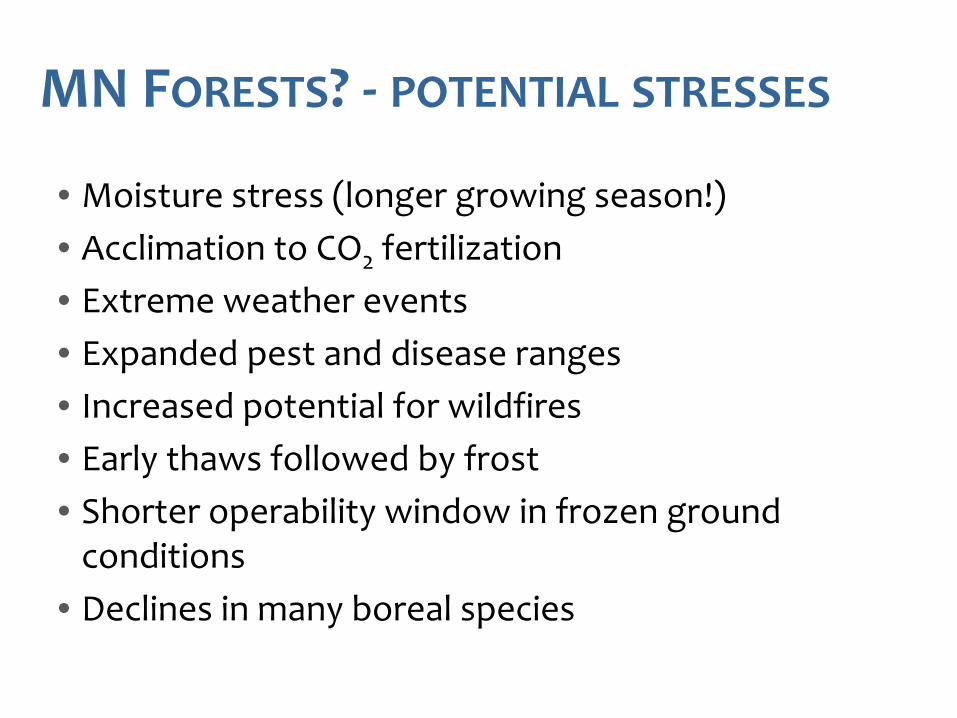
MN FORESTS? - POTENTIAL STRESSES
• Moisture stress (longer growing season!) • Acclimation to CO2 fertilization • Extreme weather events • Expanded pest and disease ranges • Increased potential for wildfires • Early thaws followed by frost • Shorter operability window in frozen ground
conditions • Declines in many boreal species
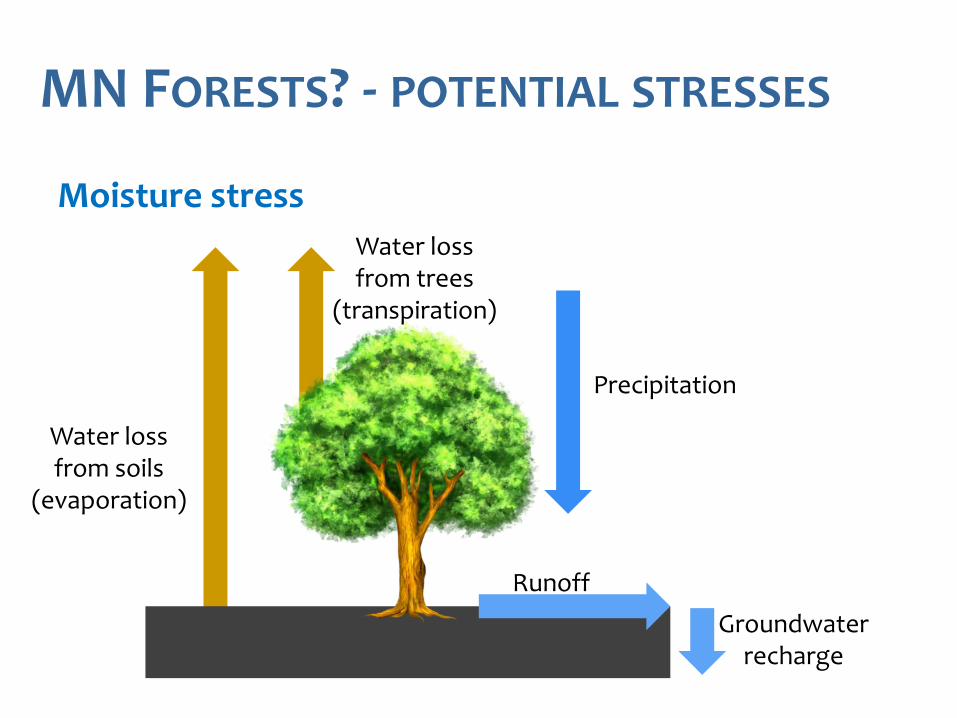
MN FORESTS? - POTENTIAL STRESSES
Moisture stress
Water loss from soils
(evaporation)
Water loss from trees
(transpiration)
Groundwater recharge
Runoff
Precipitation
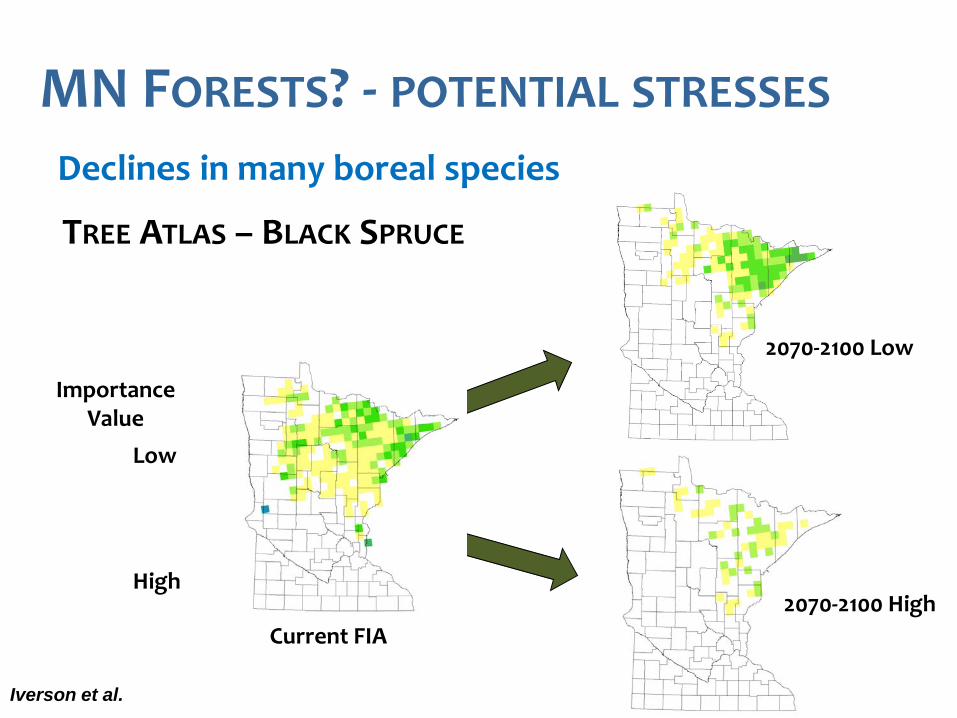
MN FORESTS? - POTENTIAL STRESSES Declines in many boreal species
TREE ATLAS – BLACK SPRUCE
Importance Value
Low
High
2070-2100 Low
2070-2100 High
Iverson et al.
Current FIA
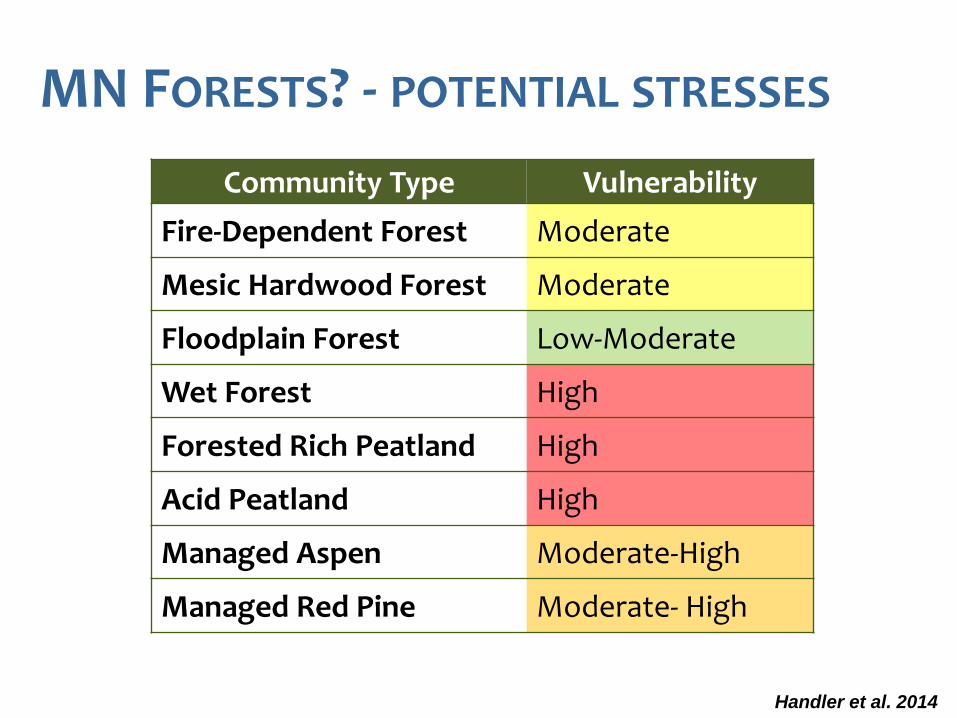
MN FORESTS? - POTENTIAL STRESSES
Handler et al. 2014
Community Type Vulnerability Fire-Dependent Forest Moderate
Mesic Hardwood Forest Moderate
Floodplain Forest Low-Moderate
Wet Forest High
Forested Rich Peatland High
Acid Peatland High
Managed Aspen Moderate-High
Managed Red Pine Moderate- High
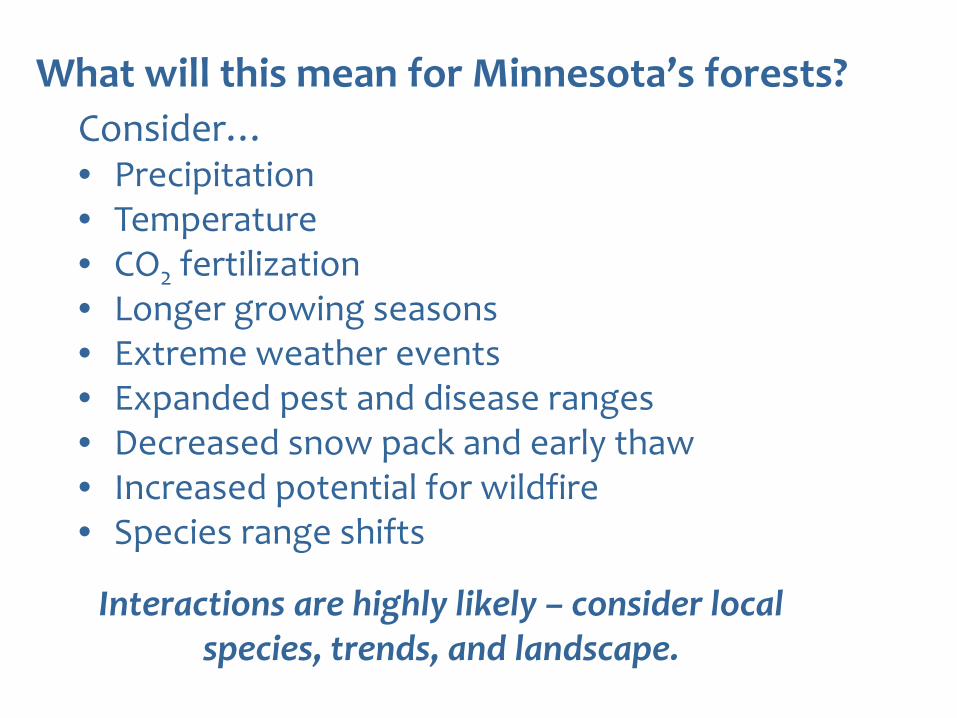
Consider… • Precipitation • Temperature • CO2 fertilization • Longer growing seasons • Extreme weather events • Expanded pest and disease ranges • Decreased snow pack and early thaw • Increased potential for wildfire • Species range shifts
Interactions are highly likely – consider local species, trends, and landscape.
What will this mean for Minnesota’s forests?

I fell asleep while you were talking…where can I learn more?
VULNERABILITY ASSESSMENT
Handler et al. 2014
www.nrs.fs.fed.us/niacs/climate/draft_docs
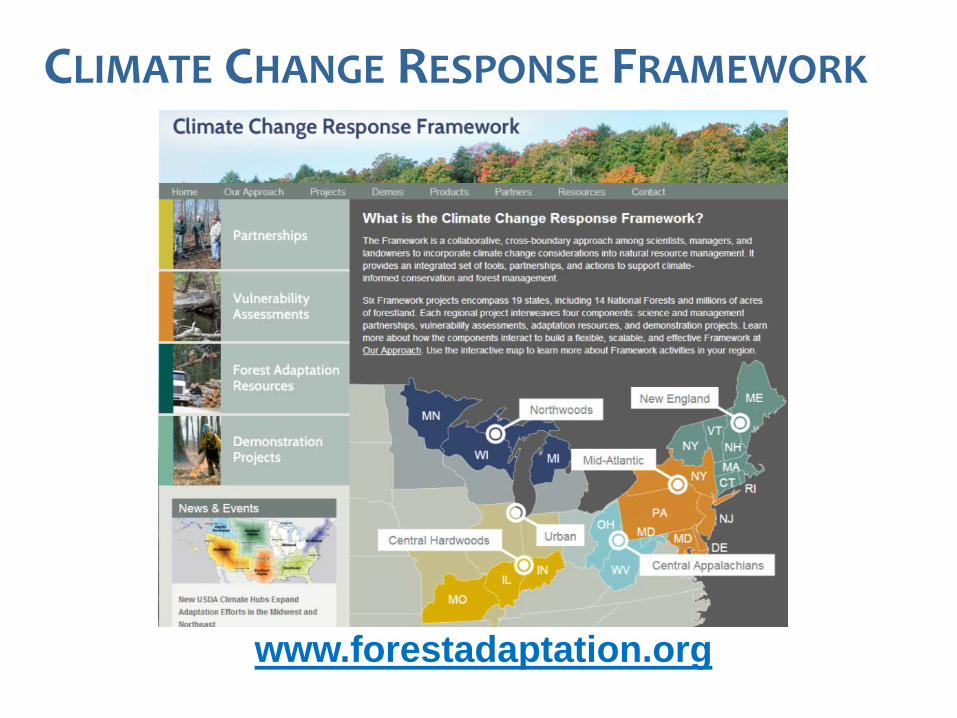
CLIMATE CHANGE RESPONSE FRAMEWORK
www.forestadaptation.org
CLIMATE CHANGE RESOURCE CENTER
www.fs.fed.us/ccrc
ARE WE DONE YET? …but not in oceans – which account for 90-93% of earth system warming since 1955.
Levitus et al. 2012, Balmeseda et al. 2013; see also Guemas et al. 2013

Hasn’t climate always changed? Why worry now?
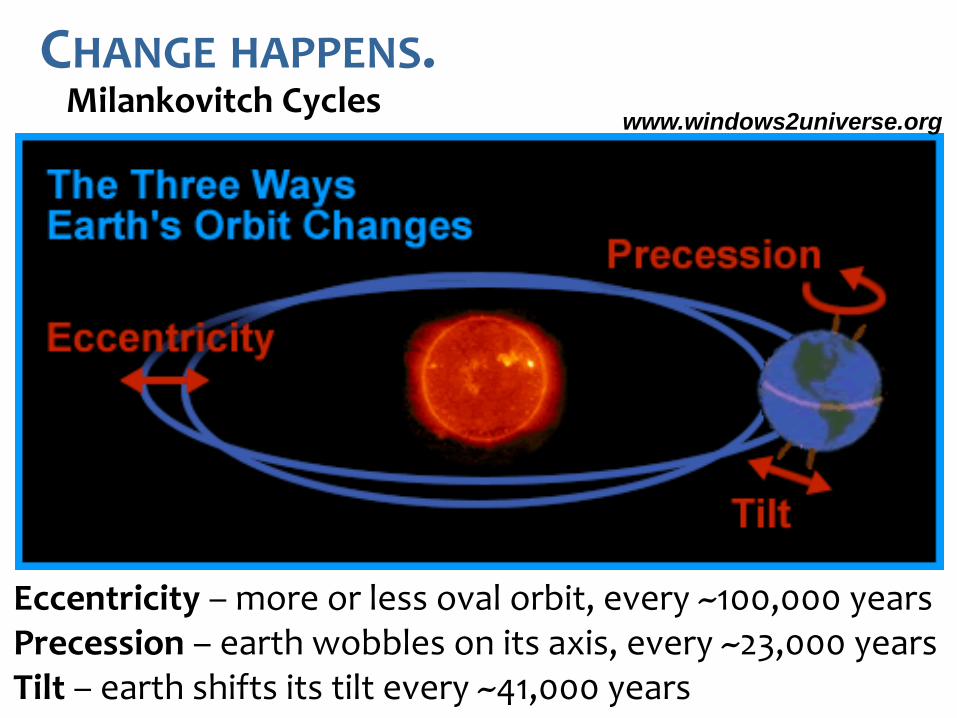
CHANGE HAPPENS.
Eccentricity – more or less oval orbit, every ~100,000 years Precession – earth wobbles on its axis, every ~23,000 years Tilt – earth shifts its tilt every ~41,000 years
Milankovitch Cycles www.windows2universe.org
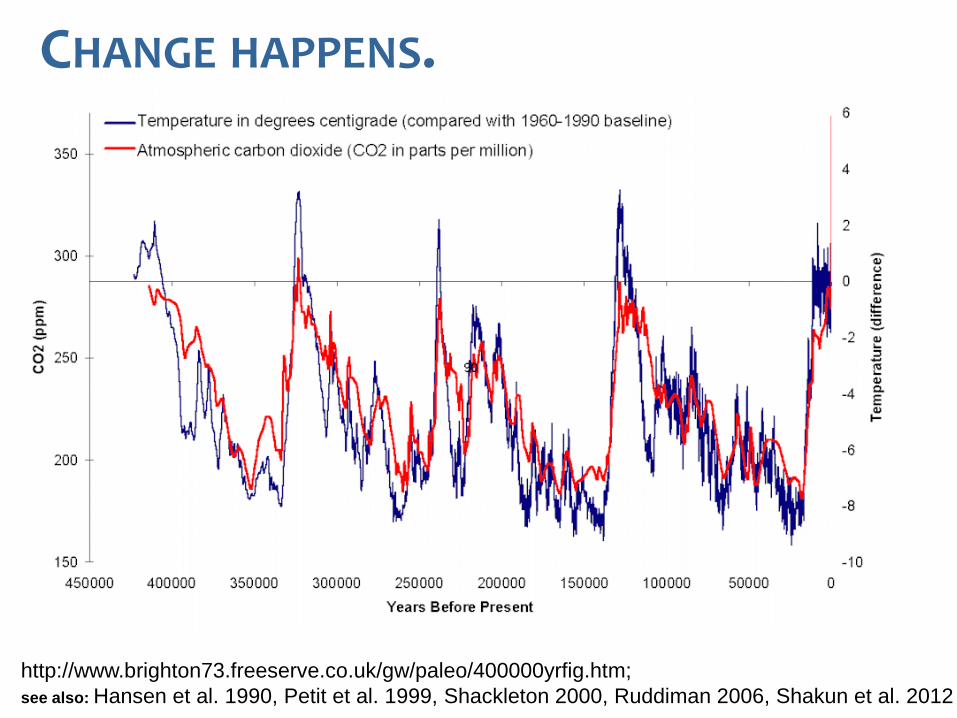
http://www.brighton73.freeserve.co.uk/gw/paleo/400000yrfig.htm; see also: Hansen et al. 1990, Petit et al. 1999, Shackleton 2000, Ruddiman 2006, Shakun et al. 2012
CHANGE HAPPENS.
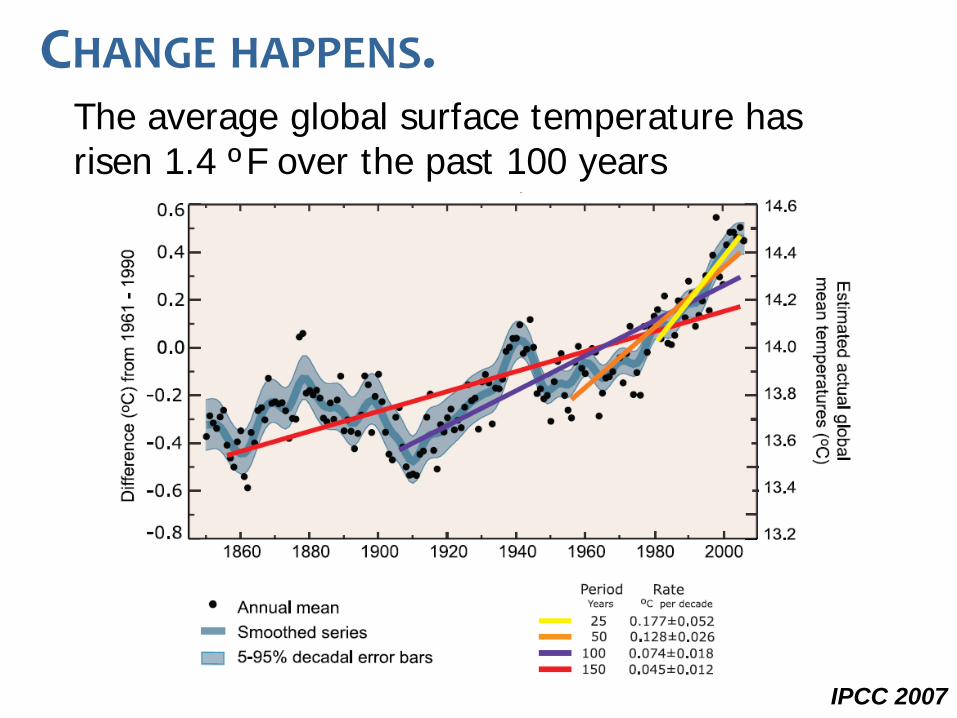
IPCC 2007
The average global surface temperature has risen 1.4 ºF over the past 100 years
CHANGE HAPPENS.
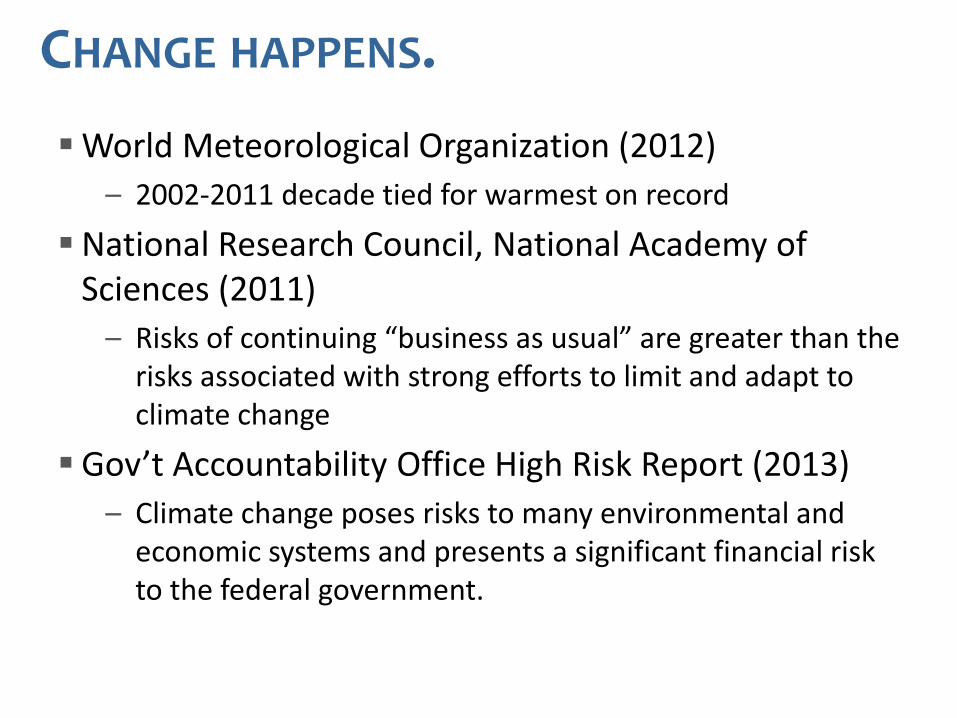
CHANGE HAPPENS. World Meteorological Organization (2012)
– 2002-2011 decade tied for warmest on record
National Research Council, National Academy of Sciences (2011)
– Risks of continuing “business as usual” are greater than the risks associated with strong efforts to limit and adapt to climate change
Gov’t Accountability Office High Risk Report (2013) – Climate change poses risks to many environmental and
economic systems and presents a significant financial risk to the federal government.
Hasn’t the climate always changed? Why worry now? • Milankovitch cycles have previously driven
climate changes. • Humans are driving the current change. • The change is very rapid.
The rapidity and potential severity of climate change will affect forestry, agriculture, infrastructure, demographics, economies, …virtually everything.
Scientists still disagree about climate change, right? So who am I supposed to believe?
DISAGREEMENT? Intergovernmental Panel on Climate Change (2007) • Evidence for climate change is “unequivocal” • It is “extremely likely” that humans are major
contributors • Future changes depend partly on human actions
18 National Academies have endorsed the consensus position in IPCC 2007 • National Academy of Sciences (USA) • Royal Society of Canada
DISAGREEMENT?
Scientists still disagree about climate change, right? So who am I supposed to believe? • No scientific debate on “if”. • Current scientific debate revolves around how
much, how fast, and feedback mechanisms. • Most climate scientists agree humans are a driver.
A practical risk assessment may be a better strategy than belief.
The atmosphere is massive, how can we actually change it?
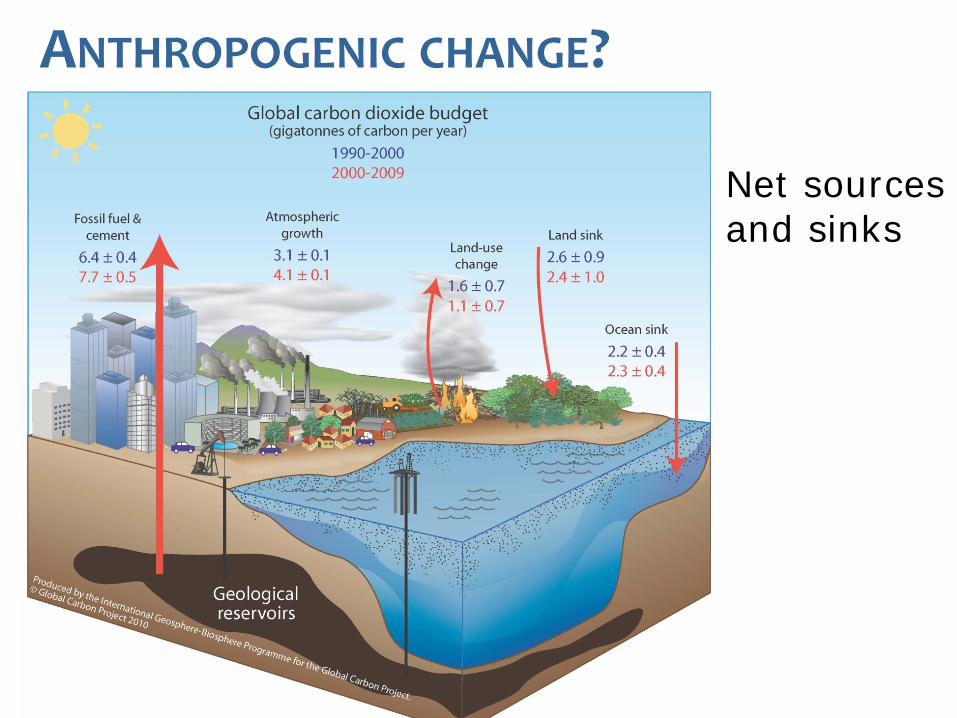
ANTHROPOGENIC CHANGE?
Net sources and sinks
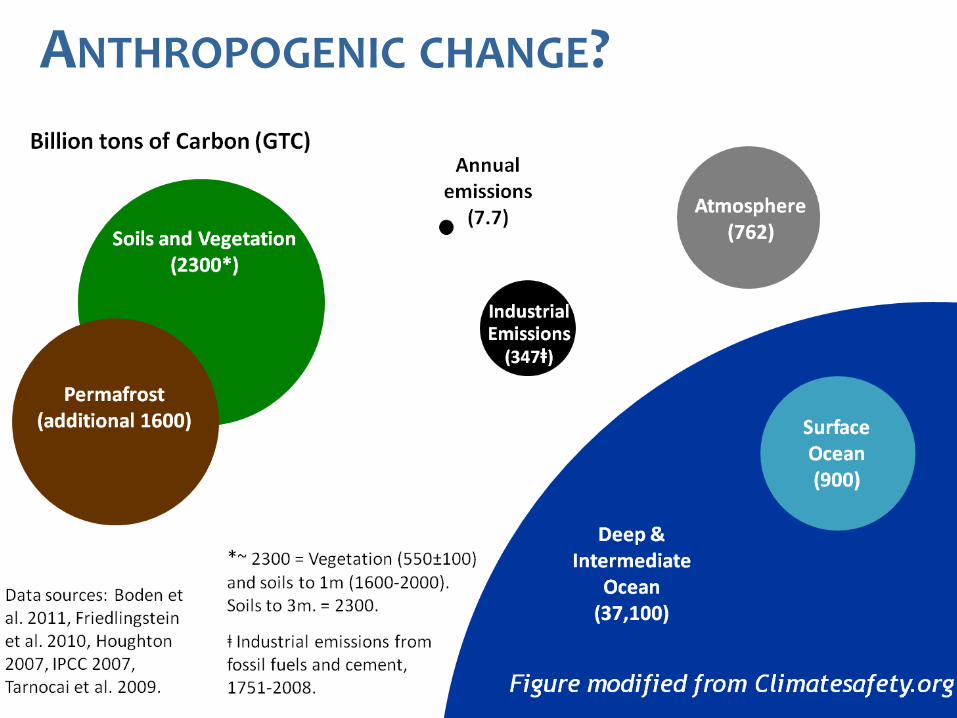
ANTHROPOGENIC CHANGE?
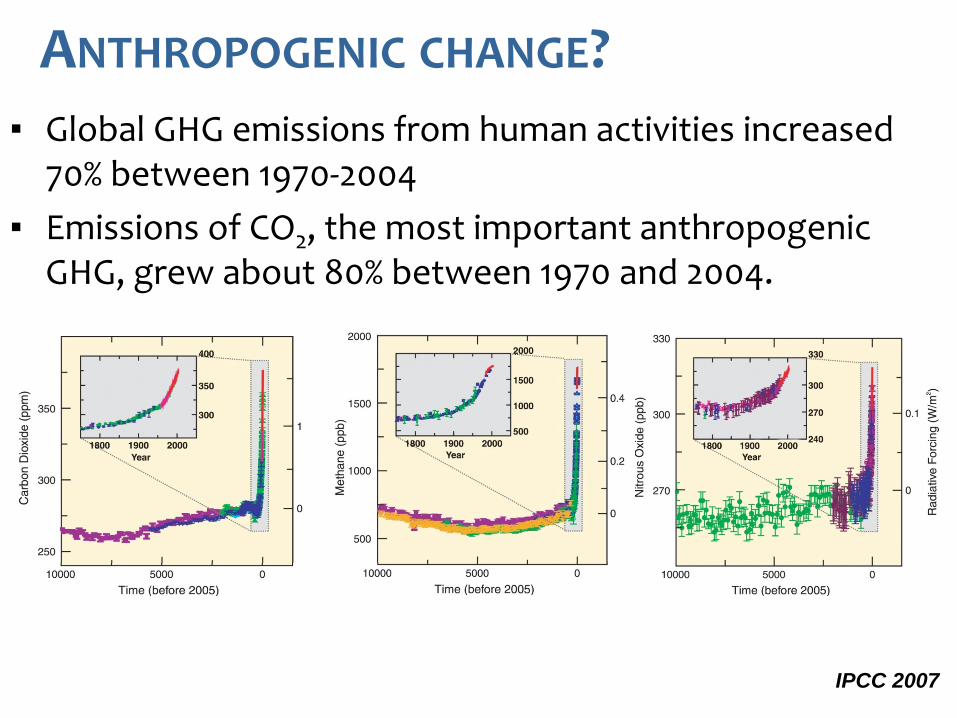
ANTHROPOGENIC CHANGE? ▪ Global GHG emissions from human activities increased
70% between 1970-2004 ▪ Emissions of CO2, the most important anthropogenic
GHG, grew about 80% between 1970 and 2004.
IPCC 2007
The atmosphere is massive, how can we change it? • We move massive amounts of carbon into the
atmosphere. • Fossil carbon is an addition – it has been isolated
from the carbon cycle for millions of years. • GHGs have different atmospheric lifetimes – CO2
may last decades to centuries. • Land cover change transfers carbon to the
atmosphere.
The measurement record clearly shows our additions to the atmosphere.
I don’t trust climate models.
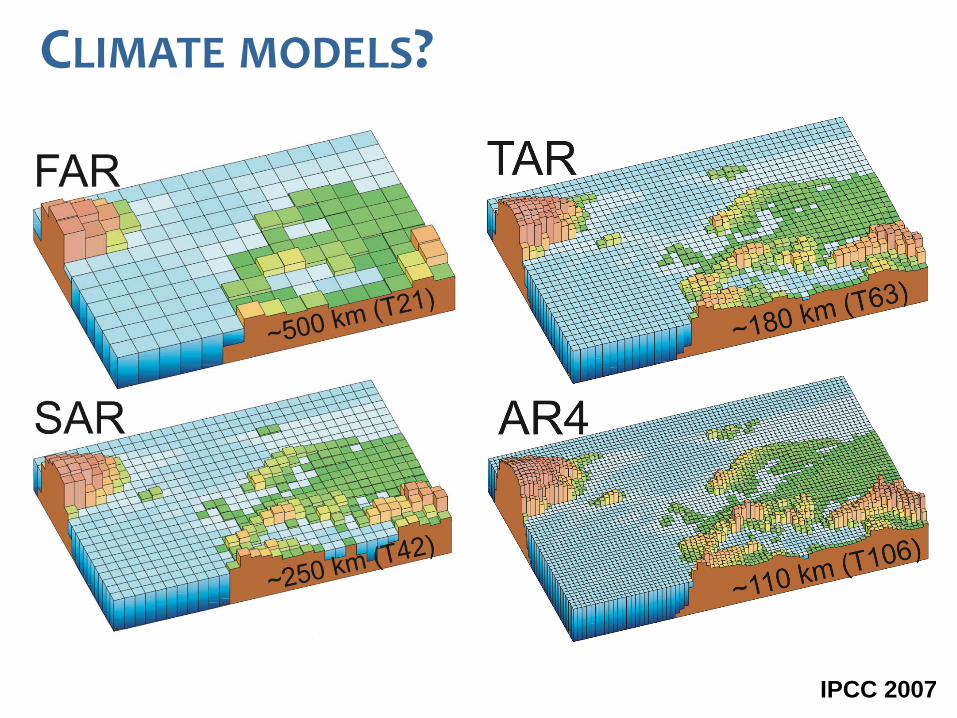
CLIMATE MODELS?
IPCC 2007
CLIMATE MODELS?
IPCC 2007
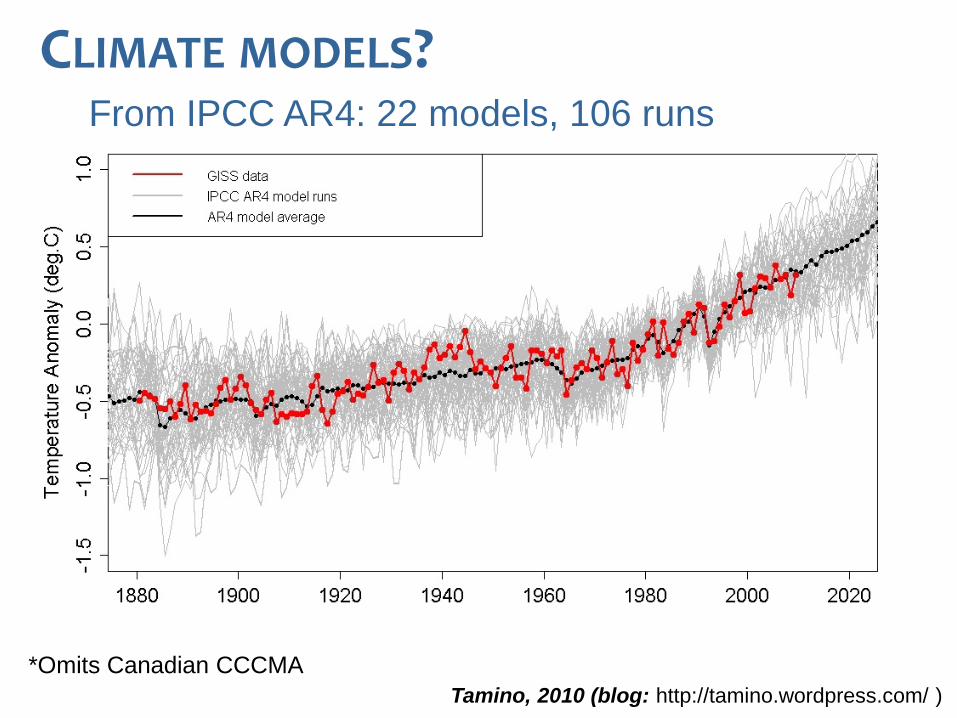
CLIMATE MODELS?
Tamino, 2010 (blog: http://tamino.wordpress.com/ )
From IPCC AR4: 22 models, 106 runs
*Omits Canadian CCCMA
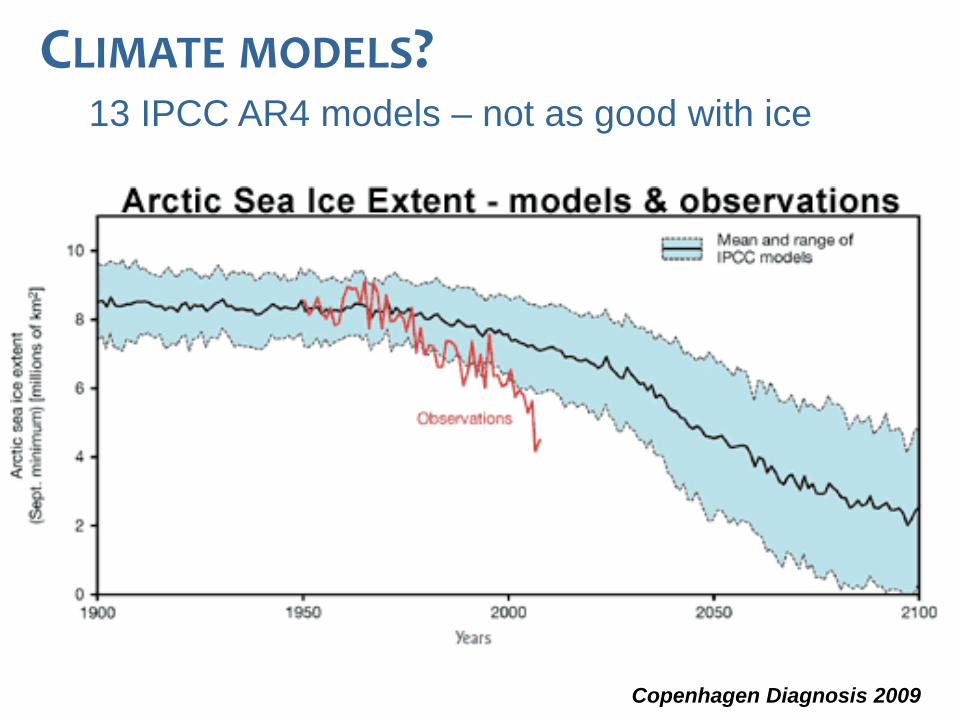
CLIMATE MODELS?
Copenhagen Diagnosis 2009
13 IPCC AR4 models – not as good with ice
I don’t trust climate models. • That’s okay; they have acknowledged shortcomings. • They do well globally with air temps, much less well
with precip, and will likely never be “good enough” at a management scale.
• Great at multi-decadal trends, poor at multi-year. • Emissions uncertainties are inherent.
All models are wrong, some are useful – best to use multiple models, think long term, and consider a range of futures.
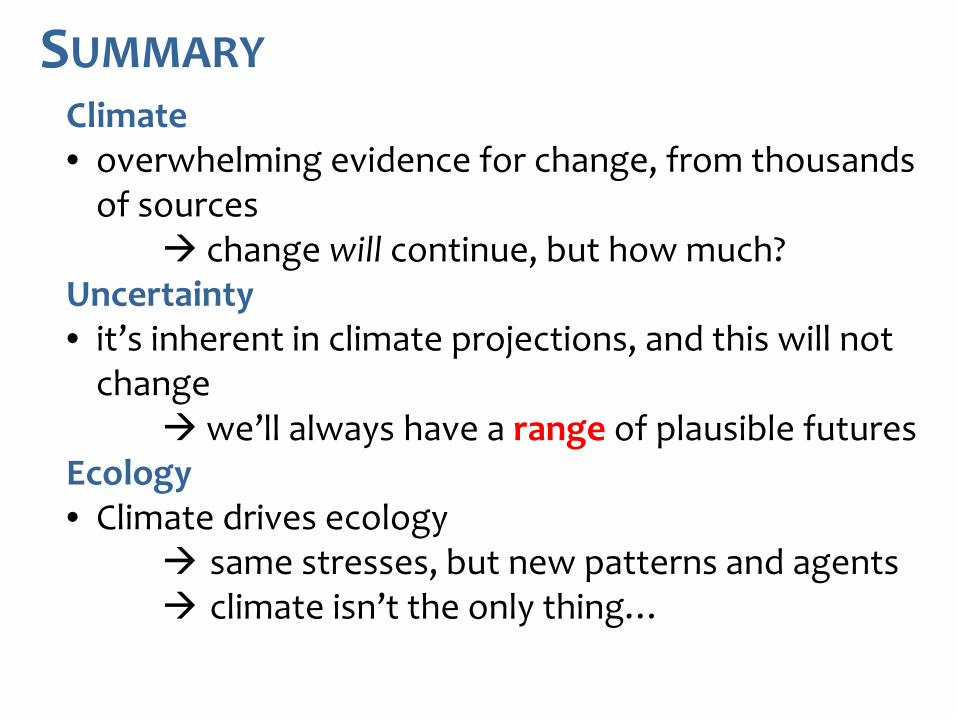
SUMMARY Climate • overwhelming evidence for change, from thousands
of sources change will continue, but how much? Uncertainty • it’s inherent in climate projections, and this will not
change we’ll always have a range of plausible futures Ecology • Climate drives ecology
same stresses, but new patterns and agents climate isn’t the only thing…
It’s cold out, eh? Good thing the climate’s changing…. *
Courtesy of NASA. http://www.fas.org/irp/imint/docs/rst/Front/tofc.html
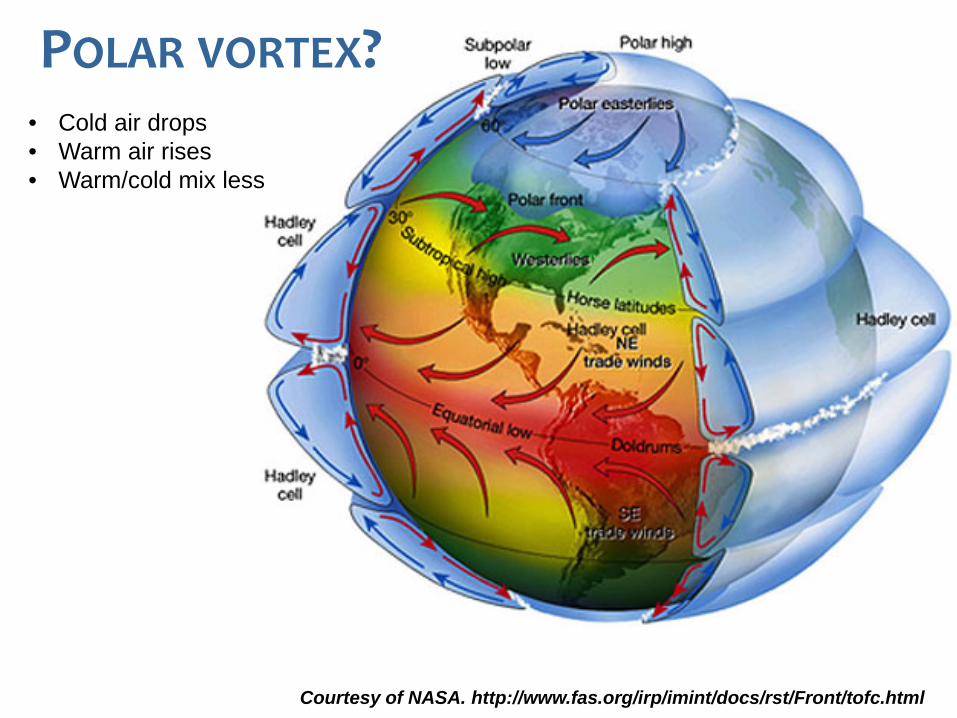
POLAR VORTEX? • Cold air drops • Warm air rises • Warm/cold mix less
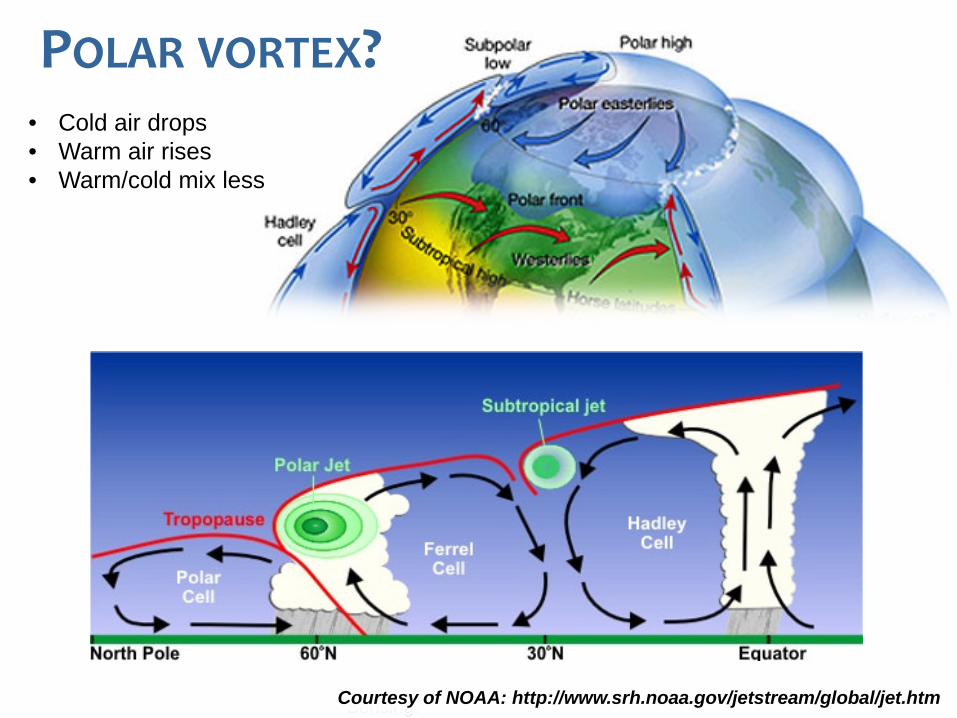
Image source: NASA Remote Sensing Tutorial: The Water Planet - Meteorological, Oceanographic and Hydrologic Applications of Remote Sensing.
POLAR VORTEX?
Courtesy of NOAA
Courtesy of NOAA: http://www.srh.noaa.gov/jetstream/global/jet.htm
• Cold air drops • Warm air rises • Warm/cold mix less
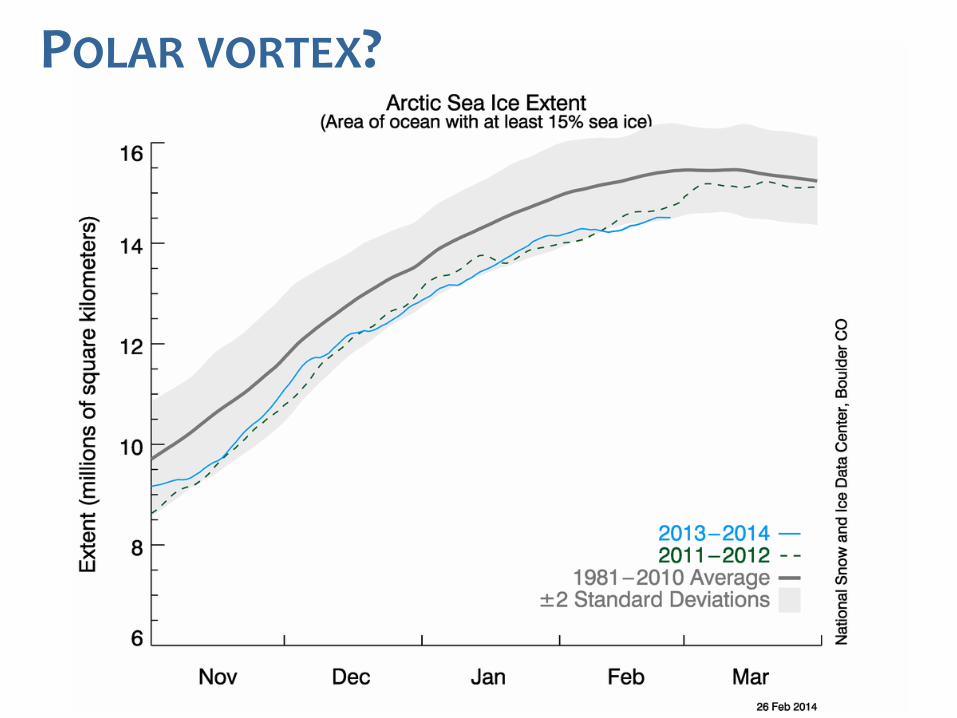
POLAR VORTEX?
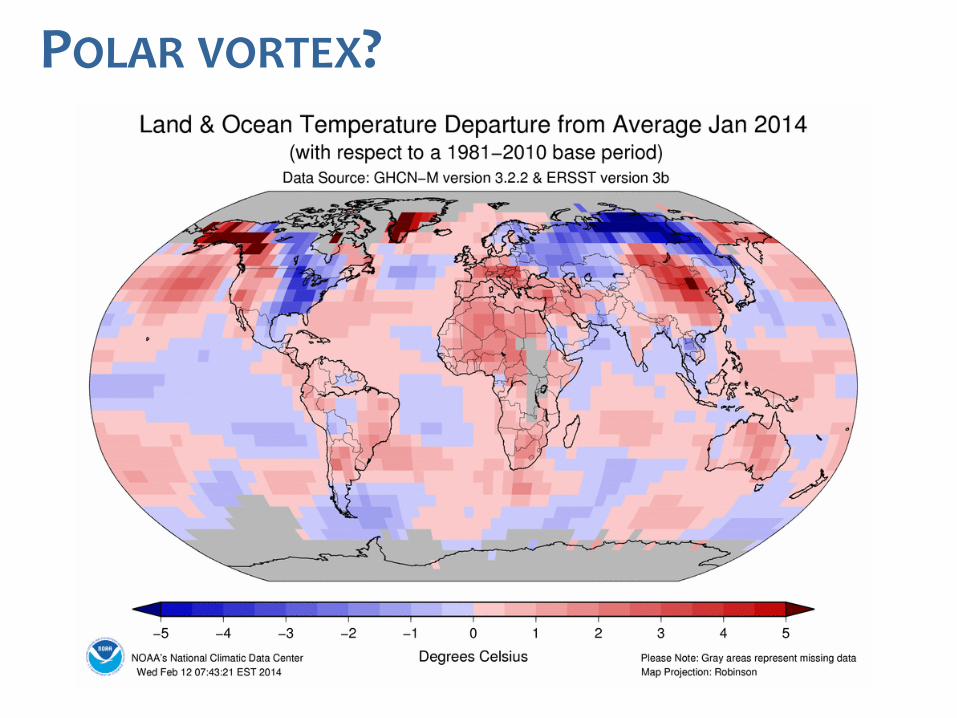
POLAR VORTEX?
Polar vortex?
• The circumpolar vortex meanders less with sharp temperature differences.
• Record high polar temps resulted in bigger meanders.
• Likely to happen more often in the future.
It sounds crazy, but the vortex dipped down because of record arctic temps. We were colder, but earth was warmer.
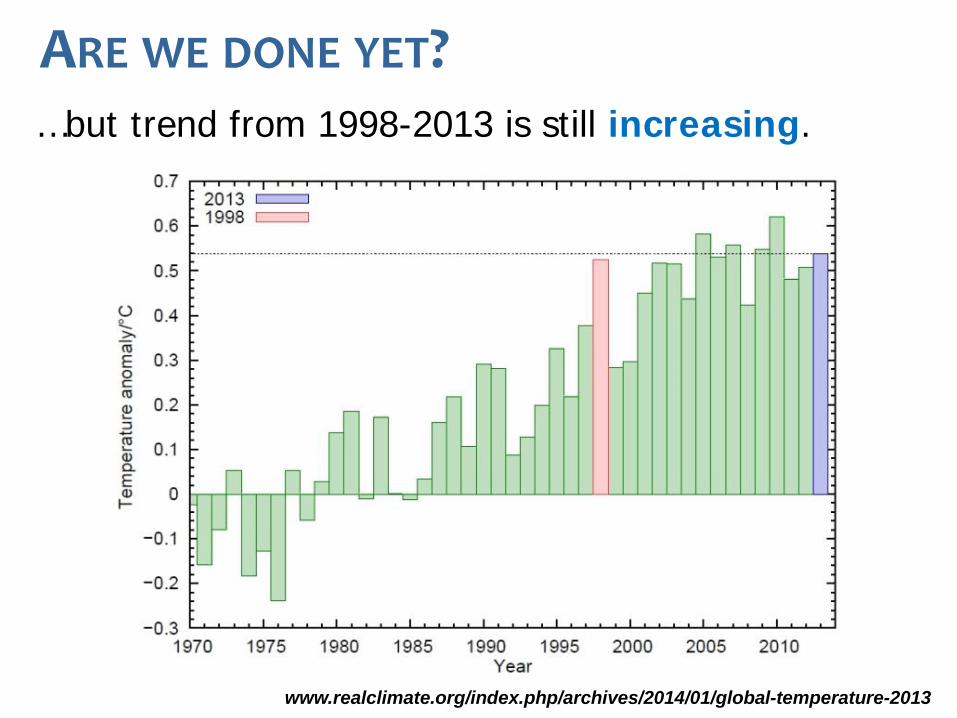
ARE WE DONE YET?
www.realclimate.org/index.php/archives/2014/01/global-temperature-2013
…but trend from 1998-2013 is still increasing.

ARE WE DONE YET?
Seneviratne et al. 2014
and… temperature extremes are still increasing in frequency.
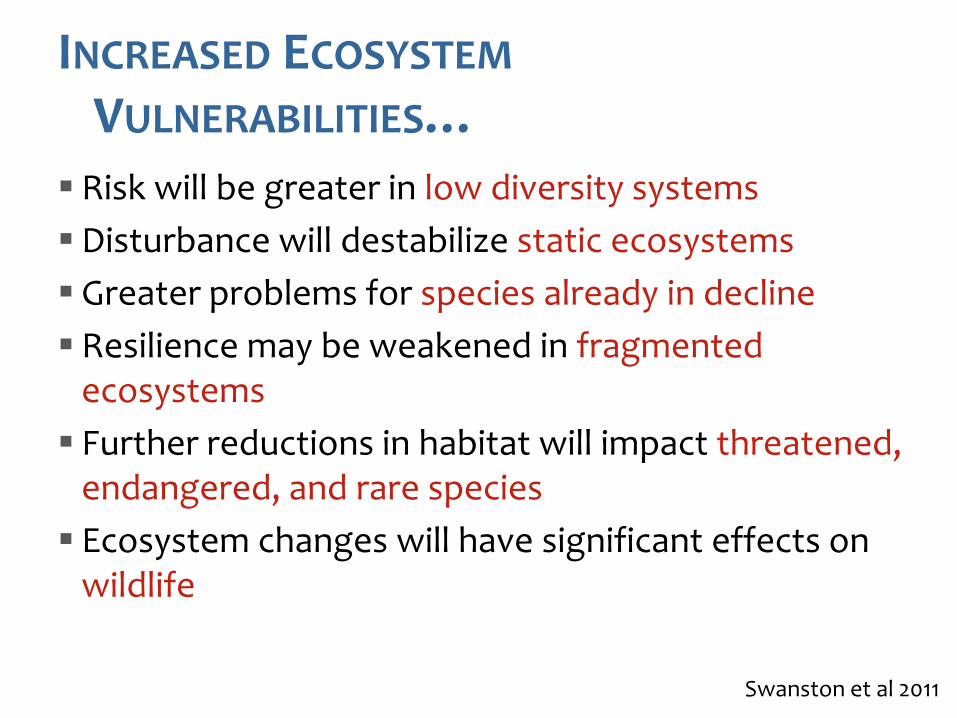
INCREASED ECOSYSTEM VULNERABILITIES…
Risk will be greater in low diversity systems Disturbance will destabilize static ecosystems Greater problems for species already in decline Resilience may be weakened in fragmented
ecosystems Further reductions in habitat will impact threatened,
endangered, and rare species Ecosystem changes will have significant effects on
wildlife
Swanston et al 2011