Embed Size (px)
Citation preview
CLIMATE CHANGE AND MASSACHUSETTS FISH AND WILDLIFE:
Volume 2HABITAT AND SPECIES VULNERABILITY
Manomet Center for Conservation Sciences&
Massachusetts Division of Fisheries and WildlifeAn Agency of the Massachusetts Department of Fish and Game
April 2010

2
A Report to the Commonwealth of Massachusetts
DEVAL L. PATRICK, Governor Commonwealth of Massachusetts
IAN A. BOWLES, Secretary Executive Office of Energy & Environmental Affairs
MARY B. GRIFFIN, Commissioner Department of Fish & Game
WAYNE F. MacCALLUM, Director Division of Fisheries & Wildlife
FISHERIES & WILDLIFE BOARD GEORGE L. DAREY, Chairperson (Lenox)
BONNIE BOOTH (Spencer) JOHN F. CREEDON (Brockton)
JOSEPH S. LARSON, Ph.D. (Pelham) MICHAEL P. ROCHE (Orange)
BRANDI VAN ROO, Ph.D. (Douglas) FREDERIC WINTHROP (Ipswich)
NATURAL HERITAGE & ENDANGERED SPECIES ADVISORY COMMITTEE
KATHLEEN S. ANDERSON, Chairperson (Middleborough) MARILYN J. FLOR (Rockport)
JOSEPH S. LARSON, Ph.D. (Pelham) MARK MELLO (South Dartmouth) GLENN MOTZKIN (Shutesbury)
THOMAS J. RAWINSKI (Oakham) JONATHAN A. SHAW (Sandwich)
3
TABLE OF CONTENTS 1. INTRODUCTION ......................................................................................................4 2. APPROACHES...........................................................................................................6
2.1 Emissions Scenarios and Two Alternative Future Northeastern Climate Scenarios.................................................................................................9 2.2 Preliminary Vulnerability Analyses. ....................................................................9
3. RESULTS .................................................................................................................10 3.1 Habitats...............................................................................................................10 3.2 Vulnerability of Vertebrate Species in Greatest Need of Conservation ............12
4. DISCUSSION ...........................................................................................................14 4.1 Ecological Trajectories Under Climate Change.................................................16 4.2 Species in Greatest Need of Conservation .........................................................17
5. REFERENCES..........................................................................................................18 ATTACHMENT 2 ........................................................................................................24 ATTACHMENT 3 ........................................................................................................25 ATTACHMENT 4 ........................................................................................................26 ATTACHMENT 5 ........................................................................................................28 ATTACHMENT 6 ........................................................................................................31 ATTACHMENT 7 ........................................................................................................33 ATTACHMENT 8 ........................................................................................................35 ATTACHMENT 9 ........................................................................................................36 ATTACHMENT 10 ......................................................................................................37 ATTACHMENT 11 ......................................................................................................39 ATTACHMENT 12 ......................................................................................................40 ATTACHMENT 13 ......................................................................................................41 ATTACHMENT 14 ......................................................................................................43 ATTACHMENT 15 ......................................................................................................45 ATTACHMENT 16 ......................................................................................................48 ATTACHMENT 17 ......................................................................................................50 ATTACHMENT 18 ......................................................................................................52 ATTACHMENT 19 ......................................................................................................54 ATTACHMENT 20 ......................................................................................................58
4
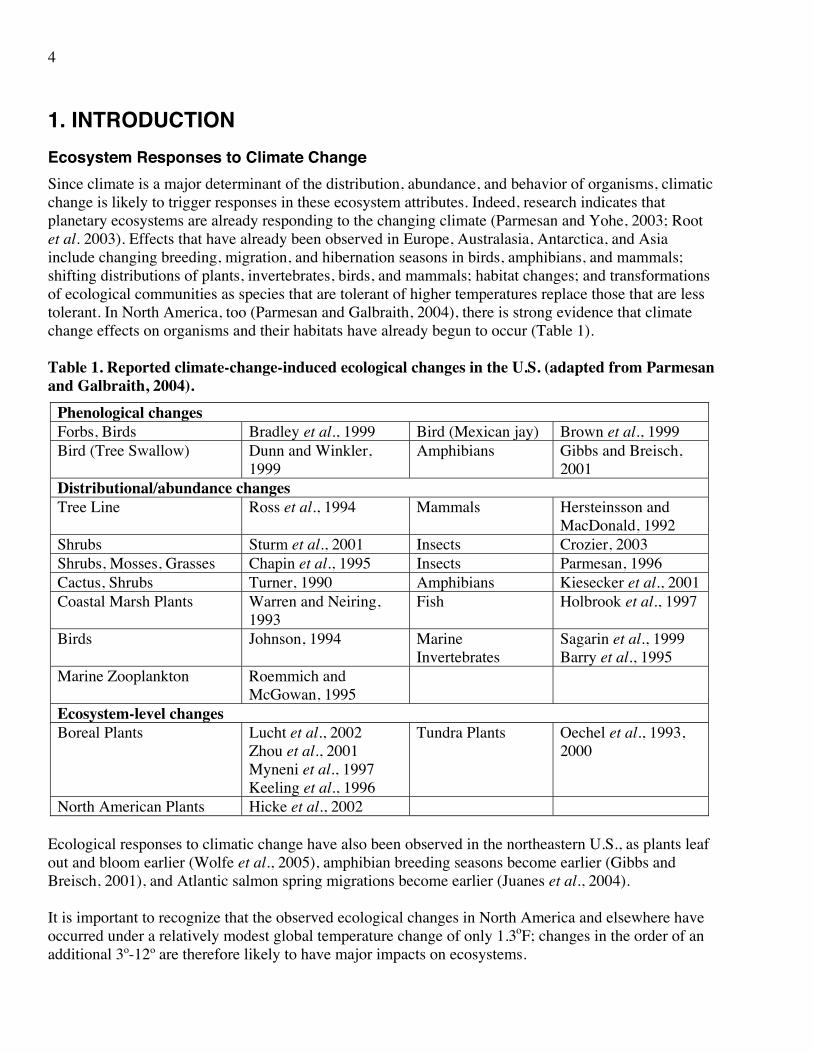
1. INTRODUCTION Ecosystem Responses to Climate Change Since climate is a major determinant of the distribution, abundance, and behavior of organisms, climatic change is likely to trigger responses in these ecosystem attributes. Indeed, research indicates that planetary ecosystems are already responding to the changing climate (Parmesan and Yohe, 2003; Root et al. 2003). Effects that have already been observed in Europe, Australasia, Antarctica, and Asia include changing breeding, migration, and hibernation seasons in birds, amphibians, and mammals; shifting distributions of plants, invertebrates, birds, and mammals; habitat changes; and transformations of ecological communities as species that are tolerant of higher temperatures replace those that are less tolerant. In North America, too (Parmesan and Galbraith, 2004), there is strong evidence that climate change effects on organisms and their habitats have already begun to occur (Table 1). Table 1. Reported climate-change-induced ecological changes in the U.S. (adapted from Parmesan and Galbraith, 2004).
Phenological changes Forbs, Birds Bradley et al., 1999 Bird (Mexican jay) Brown et al., 1999 Bird (Tree Swallow) Dunn and Winkler,
1999 Amphibians Gibbs and Breisch,
2001 Distributional/abundance changes Tree Line Ross et al., 1994 Mammals Hersteinsson and
MacDonald, 1992 Shrubs Sturm et al., 2001 Insects Crozier, 2003 Shrubs, Mosses, Grasses Chapin et al., 1995 Insects Parmesan, 1996 Cactus, Shrubs Turner, 1990 Amphibians Kiesecker et al., 2001 Coastal Marsh Plants Warren and Neiring,
1993 Fish Holbrook et al., 1997
Birds Johnson, 1994 Marine Invertebrates
Sagarin et al., 1999 Barry et al., 1995
Marine Zooplankton Roemmich and McGowan, 1995
Ecosystem-level changes Boreal Plants Lucht et al., 2002
Zhou et al., 2001 Myneni et al., 1997 Keeling et al., 1996
Tundra Plants Oechel et al., 1993, 2000
North American Plants Hicke et al., 2002 Ecological responses to climatic change have also been observed in the northeastern U.S., as plants leaf out and bloom earlier (Wolfe et al., 2005), amphibian breeding seasons become earlier (Gibbs and Breisch, 2001), and Atlantic salmon spring migrations become earlier (Juanes et al., 2004). It is important to recognize that the observed ecological changes in North America and elsewhere have occurred under a relatively modest global temperature change of only 1.3oF; changes in the order of an additional 3º-12º are therefore likely to have major impacts on ecosystems.

5
Adaptation to Climate Change Most conservation strategies were developed in an era when major climatic changes were not anticipated, or were considered to be of only minor importance. Indeed, many approaches implicitly assume a stable climatic background (e.g., fixed-area protection, reintroductions, habitat restoration). However, now that we have become more aware of the ecological consequences of climate change, we urgently need to re-examine and refine these approaches to the conservation of natural resources. This is the challenge of adaptation. One of the essential precursors of effective adaptation planning is to identify and quantify the comparative vulnerabilities of valued ecological resources. Without such information, it is difficult to identify which of the many potential climate change-induced effects deserves most immediate attention. Is Habitat A likely to be more or less affected than Habitats B or C? What is likely to be the magnitude of effect (e.g., in area of habitat lost or number of species displaced)? How will the system change? What effective management tools and solutions are available to site and land managers? These are questions that need answers if limited resources are to be most effectively allocated. In addition to evaluating the risks posed to resources by a changing climate, it is important that such an analysis also include two other components:
• A transparent evaluation of the level of confidence associated with vulnerability projections, so that the potential costs and benefits of any adaptation measures may be realistically appraised, and limited resources applied to the most urgent problems and those with the greatest likelihoods of successful outcomes.
• The inclusion of stressors other than climate change, because alleviation of these may comprise effective adaptation intervention points (by increasing the overall resilience of the system and its resistance to climate change effects).
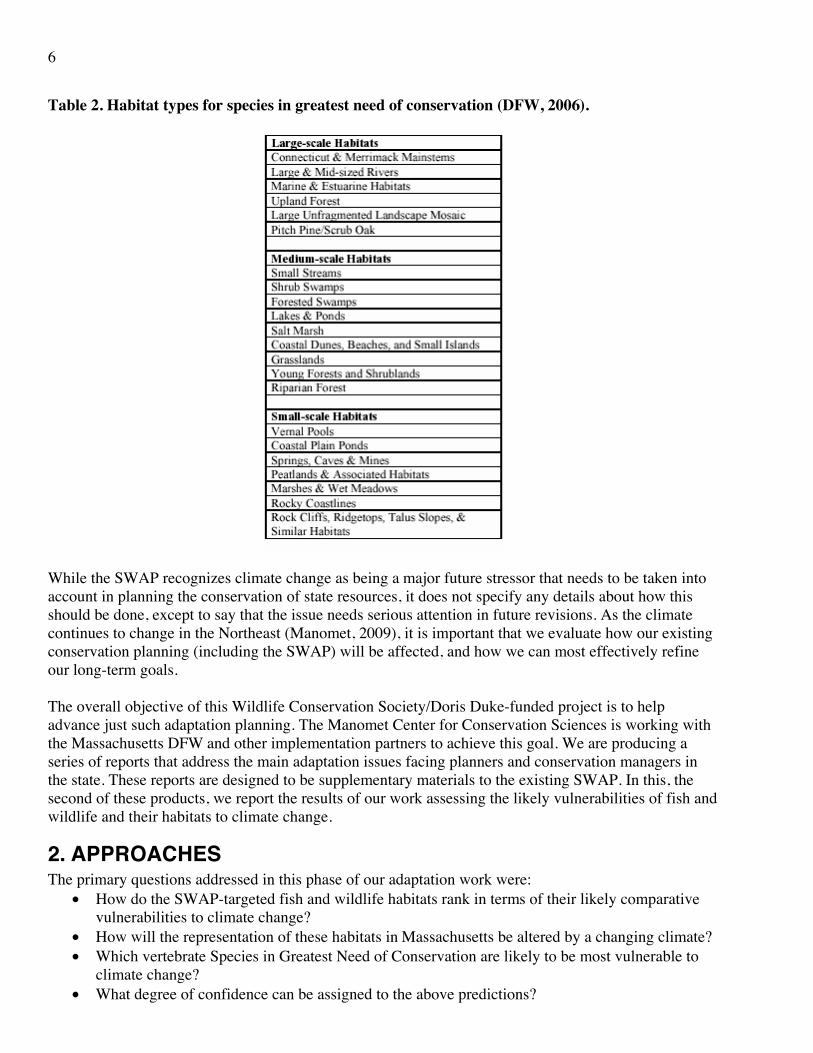
Adaptation and the Massachusetts State Wildlife Action Plan The focus of the Massachusetts State Wildlife Action Plan (SWAP) is on the conservation of valued fish and wildlife habitat (DFW, 2006). Although this is not the only conservation instrument used in the state, the SWAP is important in that it represents much of the Division of Fisheries and Wildlife’s (DFW) current thinking on how Massachusetts’ fish and wildlife resources should be conserved in the future – in effect, it is a conservation “roadmap.” It identifies a total of 22 habitats that support 257 animal species that have been classified as being in “Greatest Need of Conservation” in the state (i.e., listed by federal, state, and other agencies as of special concern). These 22 habitat types (Table 2) are the focus of future conservation planning in the state, with the priority conservation strategy being proactive habitat protection.
6
Table 2. Habitat types for species in greatest need of conservation (DFW, 2006).
While the SWAP recognizes climate change as being a major future stressor that needs to be taken into account in planning the conservation of state resources, it does not specify any details about how this should be done, except to say that the issue needs serious attention in future revisions. As the climate continues to change in the Northeast (Manomet, 2009), it is important that we evaluate how our existing conservation planning (including the SWAP) will be affected, and how we can most effectively refine our long-term goals. The overall objective of this Wildlife Conservation Society/Doris Duke-funded project is to help advance just such adaptation planning. The Manomet Center for Conservation Sciences is working with the Massachusetts DFW and other implementation partners to achieve this goal. We are producing a series of reports that address the main adaptation issues facing planners and conservation managers in the state. These reports are designed to be supplementary materials to the existing SWAP. In this, the second of these products, we report the results of our work assessing the likely vulnerabilities of fish and wildlife and their habitats to climate change.
2. APPROACHES The primary questions addressed in this phase of our adaptation work were:
• How do the SWAP-targeted fish and wildlife habitats rank in terms of their likely comparative vulnerabilities to climate change?
• How will the representation of these habitats in Massachusetts be altered by a changing climate? • Which vertebrate Species in Greatest Need of Conservation are likely to be most vulnerable to
climate change? • What degree of confidence can be assigned to the above predictions?
7
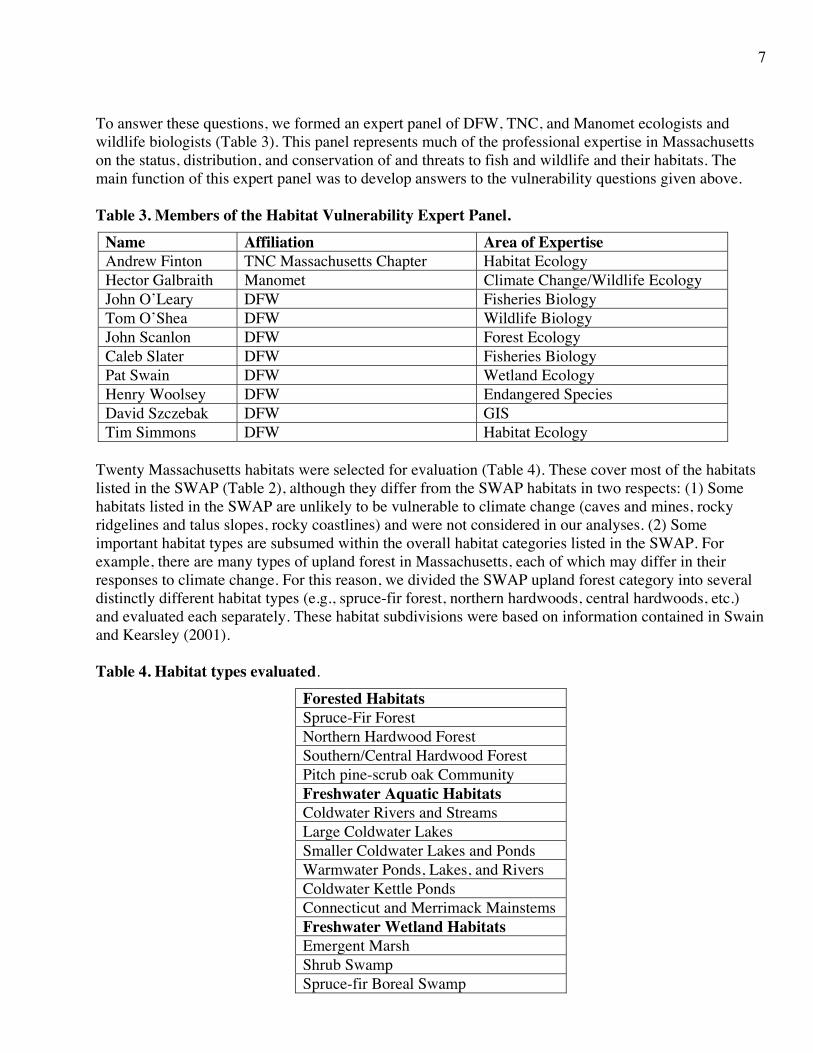
To answer these questions, we formed an expert panel of DFW, TNC, and Manomet ecologists and wildlife biologists (Table 3). This panel represents much of the professional expertise in Massachusetts on the status, distribution, and conservation of and threats to fish and wildlife and their habitats. The main function of this expert panel was to develop answers to the vulnerability questions given above. Table 3. Members of the Habitat Vulnerability Expert Panel.
Name Affiliation Area of Expertise Andrew Finton TNC Massachusetts Chapter Habitat Ecology Hector Galbraith Manomet Climate Change/Wildlife Ecology John O’Leary DFW Fisheries Biology Tom O’Shea DFW Wildlife Biology John Scanlon DFW Forest Ecology Caleb Slater DFW Fisheries Biology Pat Swain DFW Wetland Ecology Henry Woolsey DFW Endangered Species David Szczebak DFW GIS Tim Simmons DFW Habitat Ecology
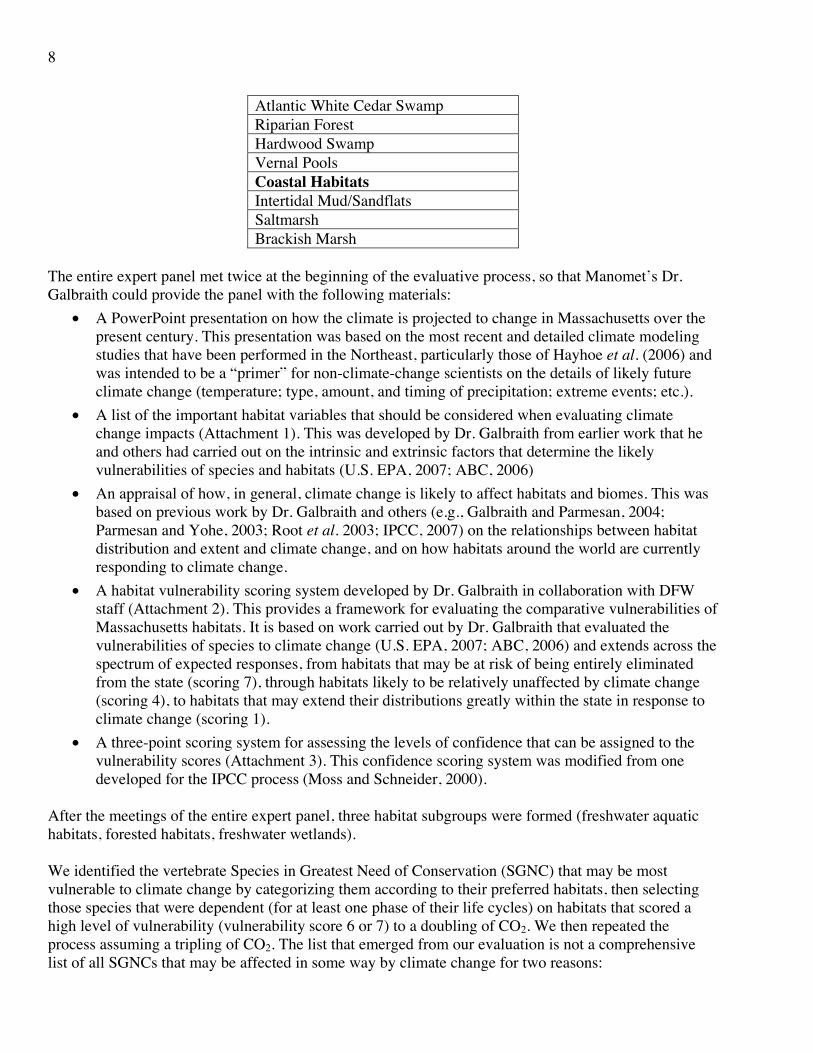
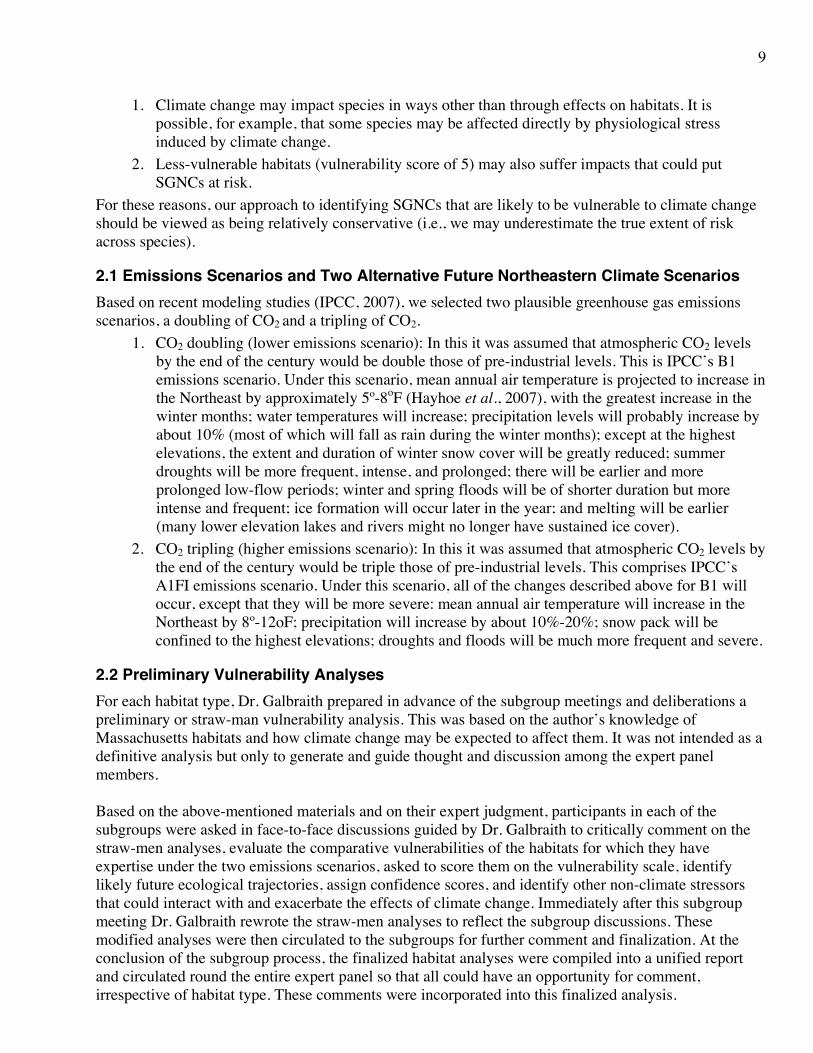
Twenty Massachusetts habitats were selected for evaluation (Table 4). These cover most of the habitats listed in the SWAP (Table 2), although they differ from the SWAP habitats in two respects: (1) Some habitats listed in the SWAP are unlikely to be vulnerable to climate change (caves and mines, rocky ridgelines and talus slopes, rocky coastlines) and were not considered in our analyses. (2) Some important habitat types are subsumed within the overall habitat categories listed in the SWAP. For example, there are many types of upland forest in Massachusetts, each of which may differ in their responses to climate change. For this reason, we divided the SWAP upland forest category into several distinctly different habitat types (e.g., spruce-fir forest, northern hardwoods, central hardwoods, etc.) and evaluated each separately. These habitat subdivisions were based on information contained in Swain and Kearsley (2001). Table 4. Habitat types evaluated.
Forested Habitats Spruce-Fir Forest Northern Hardwood Forest Southern/Central Hardwood Forest Pitch pine-scrub oak Community Freshwater Aquatic Habitats Coldwater Rivers and Streams Large Coldwater Lakes Smaller Coldwater Lakes and Ponds Warmwater Ponds, Lakes, and Rivers Coldwater Kettle Ponds Connecticut and Merrimack Mainstems Freshwater Wetland Habitats Emergent Marsh Shrub Swamp Spruce-fir Boreal Swamp
8
Atlantic White Cedar Swamp Riparian Forest Hardwood Swamp Vernal Pools Coastal Habitats Intertidal Mud/Sandflats Saltmarsh Brackish Marsh
The entire expert panel met twice at the beginning of the evaluative process, so that Manomet’s Dr. Galbraith could provide the panel with the following materials:
• A PowerPoint presentation on how the climate is projected to change in Massachusetts over the present century. This presentation was based on the most recent and detailed climate modeling studies that have been performed in the Northeast, particularly those of Hayhoe et al. (2006) and was intended to be a “primer” for non-climate-change scientists on the details of likely future climate change (temperature; type, amount, and timing of precipitation; extreme events; etc.).
• A list of the important habitat variables that should be considered when evaluating climate change impacts (Attachment 1). This was developed by Dr. Galbraith from earlier work that he and others had carried out on the intrinsic and extrinsic factors that determine the likely vulnerabilities of species and habitats (U.S. EPA, 2007; ABC, 2006)
• An appraisal of how, in general, climate change is likely to affect habitats and biomes. This was based on previous work by Dr. Galbraith and others (e.g., Galbraith and Parmesan, 2004; Parmesan and Yohe, 2003; Root et al. 2003; IPCC, 2007) on the relationships between habitat distribution and extent and climate change, and on how habitats around the world are currently responding to climate change.
• A habitat vulnerability scoring system developed by Dr. Galbraith in collaboration with DFW staff (Attachment 2). This provides a framework for evaluating the comparative vulnerabilities of Massachusetts habitats. It is based on work carried out by Dr. Galbraith that evaluated the vulnerabilities of species to climate change (U.S. EPA, 2007; ABC, 2006) and extends across the spectrum of expected responses, from habitats that may be at risk of being entirely eliminated from the state (scoring 7), through habitats likely to be relatively unaffected by climate change (scoring 4), to habitats that may extend their distributions greatly within the state in response to climate change (scoring 1).
• A three-point scoring system for assessing the levels of confidence that can be assigned to the vulnerability scores (Attachment 3). This confidence scoring system was modified from one developed for the IPCC process (Moss and Schneider, 2000).
After the meetings of the entire expert panel, three habitat subgroups were formed (freshwater aquatic habitats, forested habitats, freshwater wetlands). We identified the vertebrate Species in Greatest Need of Conservation (SGNC) that may be most vulnerable to climate change by categorizing them according to their preferred habitats, then selecting those species that were dependent (for at least one phase of their life cycles) on habitats that scored a high level of vulnerability (vulnerability score 6 or 7) to a doubling of CO2. We then repeated the process assuming a tripling of CO2. The list that emerged from our evaluation is not a comprehensive list of all SGNCs that may be affected in some way by climate change for two reasons:
9
1. Climate change may impact species in ways other than through effects on habitats. It is possible, for example, that some species may be affected directly by physiological stress induced by climate change.
2. Less-vulnerable habitats (vulnerability score of 5) may also suffer impacts that could put SGNCs at risk.
For these reasons, our approach to identifying SGNCs that are likely to be vulnerable to climate change should be viewed as being relatively conservative (i.e., we may underestimate the true extent of risk across species).
2.1 Emissions Scenarios and Two Alternative Future Northeastern Climate Scenarios Based on recent modeling studies (IPCC, 2007), we selected two plausible greenhouse gas emissions scenarios, a doubling of CO2 and a tripling of CO2.
1. CO2 doubling (lower emissions scenario): In this it was assumed that atmospheric CO2 levels by the end of the century would be double those of pre-industrial levels. This is IPCC’s B1 emissions scenario. Under this scenario, mean annual air temperature is projected to increase in the Northeast by approximately 5º-8oF (Hayhoe et al., 2007), with the greatest increase in the winter months; water temperatures will increase; precipitation levels will probably increase by about 10% (most of which will fall as rain during the winter months); except at the highest elevations, the extent and duration of winter snow cover will be greatly reduced; summer droughts will be more frequent, intense, and prolonged; there will be earlier and more prolonged low-flow periods; winter and spring floods will be of shorter duration but more intense and frequent; ice formation will occur later in the year; and melting will be earlier (many lower elevation lakes and rivers might no longer have sustained ice cover).
2. CO2 tripling (higher emissions scenario): In this it was assumed that atmospheric CO2 levels by the end of the century would be triple those of pre-industrial levels. This comprises IPCC’s A1FI emissions scenario. Under this scenario, all of the changes described above for B1 will occur, except that they will be more severe: mean annual air temperature will increase in the Northeast by 8º-12oF; precipitation will increase by about 10%-20%; snow pack will be confined to the highest elevations; droughts and floods will be much more frequent and severe.
2.2 Preliminary Vulnerability Analyses For each habitat type, Dr. Galbraith prepared in advance of the subgroup meetings and deliberations a preliminary or straw-man vulnerability analysis. This was based on the author’s knowledge of Massachusetts habitats and how climate change may be expected to affect them. It was not intended as a definitive analysis but only to generate and guide thought and discussion among the expert panel members. Based on the above-mentioned materials and on their expert judgment, participants in each of the subgroups were asked in face-to-face discussions guided by Dr. Galbraith to critically comment on the straw-men analyses, evaluate the comparative vulnerabilities of the habitats for which they have expertise under the two emissions scenarios, asked to score them on the vulnerability scale, identify likely future ecological trajectories, assign confidence scores, and identify other non-climate stressors that could interact with and exacerbate the effects of climate change. Immediately after this subgroup meeting Dr. Galbraith rewrote the straw-men analyses to reflect the subgroup discussions. These modified analyses were then circulated to the subgroups for further comment and finalization. At the conclusion of the subgroup process, the finalized habitat analyses were compiled into a unified report and circulated round the entire expert panel so that all could have an opportunity for comment, irrespective of habitat type. These comments were incorporated into this finalized analysis.
10
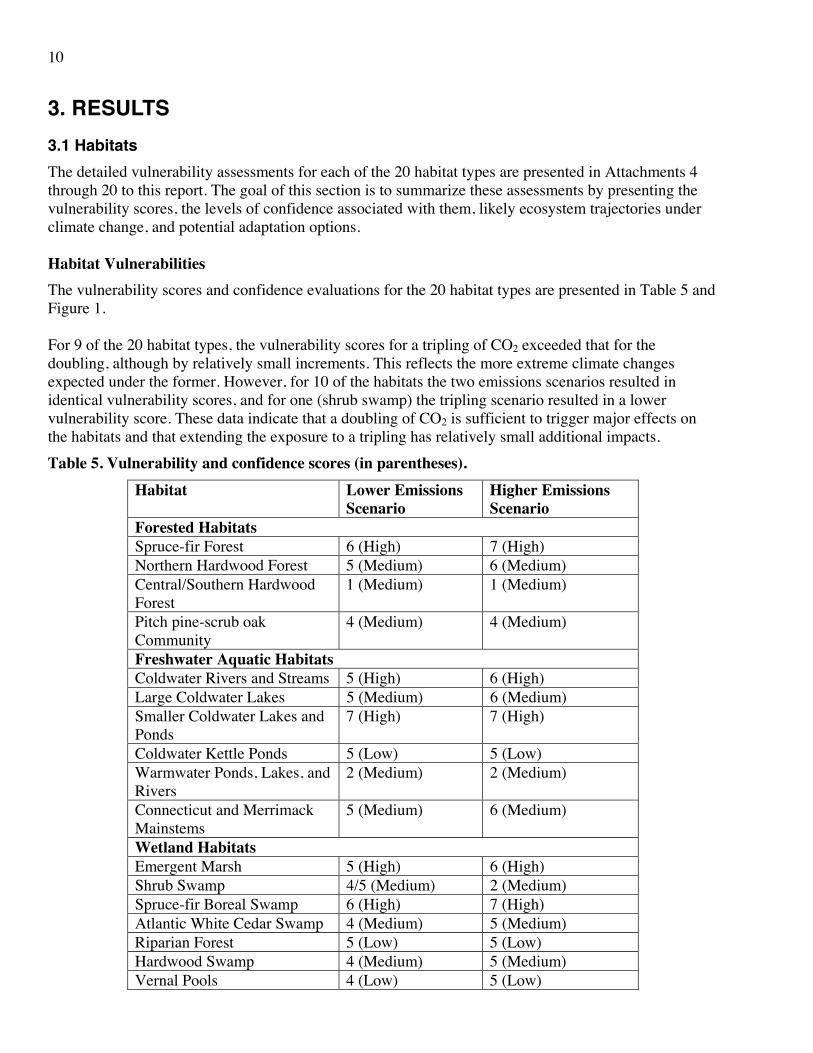
3. RESULTS 3.1 Habitats The detailed vulnerability assessments for each of the 20 habitat types are presented in Attachments 4 through 20 to this report. The goal of this section is to summarize these assessments by presenting the vulnerability scores, the levels of confidence associated with them, likely ecosystem trajectories under climate change, and potential adaptation options. Habitat Vulnerabilities The vulnerability scores and confidence evaluations for the 20 habitat types are presented in Table 5 and Figure 1. For 9 of the 20 habitat types, the vulnerability scores for a tripling of CO2 exceeded that for the doubling, although by relatively small increments. This reflects the more extreme climate changes expected under the former. However, for 10 of the habitats the two emissions scenarios resulted in identical vulnerability scores, and for one (shrub swamp) the tripling scenario resulted in a lower vulnerability score. These data indicate that a doubling of CO2 is sufficient to trigger major effects on the habitats and that extending the exposure to a tripling has relatively small additional impacts. Table 5. Vulnerability and confidence scores (in parentheses).
Habitat Lower Emissions Scenario
Higher Emissions Scenario
Forested Habitats Spruce-fir Forest 6 (High) 7 (High) Northern Hardwood Forest 5 (Medium) 6 (Medium) Central/Southern Hardwood Forest
1 (Medium) 1 (Medium)
Pitch pine-scrub oak Community
4 (Medium) 4 (Medium)
Freshwater Aquatic Habitats Coldwater Rivers and Streams 5 (High) 6 (High) Large Coldwater Lakes 5 (Medium) 6 (Medium) Smaller Coldwater Lakes and Ponds
7 (High) 7 (High)
Coldwater Kettle Ponds 5 (Low) 5 (Low) Warmwater Ponds, Lakes, and Rivers
2 (Medium) 2 (Medium)
Connecticut and Merrimack Mainstems
5 (Medium) 6 (Medium)
Wetland Habitats Emergent Marsh 5 (High) 6 (High) Shrub Swamp 4/5 (Medium) 2 (Medium) Spruce-fir Boreal Swamp 6 (High) 7 (High) Atlantic White Cedar Swamp 4 (Medium) 5 (Medium) Riparian Forest 5 (Low) 5 (Low) Hardwood Swamp 4 (Medium) 5 (Medium) Vernal Pools 4 (Low) 5 (Low)

11
Coastal Habitats Intertidal Mud/Sandflats 6 (High) 6 (High) Saltmarsh 1 (High) 1 (High) Brackish Marsh 6 (High) 6 (High)
The confidence scores for the habitats in Table 5 range from High (n=15), to Medium (n=18), to Low (n=6). Having developed and used these scores, we are confident that: (1) A score of High indicates that a habitat thus scored is more likely than not to conform to the allocated vulnerability score. Thus, Spruce-fir forest scores High vulnerability (6 or 7) and High confidence. To us, this indicates that it is very unlikely that the “actual” vulnerability score for this habitat would deviate from 6 or 7. (2) A habitat that has a confidence score of Medium is less certain. However, we consider it unlikely that the “actual” vulnerability of such a habitat would deviate much from the allocated score. For example, we consider it possible that a habit that scores 4 on the vulnerability score and had a Medium uncertainty score could in fact have an actual vulnerability score of 3 or 5, but not 2 or 6. We are much less certain about habitats that have Low confidence scores, and these should be read as implying considerable uncertainty in our scorings. The factors contributing to each habitat’s comparative vulnerability are displayed in Table 6. Table 6. Factors Influencing the Vulnerability to Climate Change of Massachusetts Habitats.
Habitat Vulnerability Scores
Cold-adapted
High Elevation
NorthernHabitat
SouthernHabitat
Vulnerable to Fire
Vulnerable to Pest
Outbreaks
Vulnerable to Invasives
Vulnerable to Sea-level
Rise Small Coldwater Lakes
7/7 Yes Yes Yes No No No Yes No
Spruce-fir Forest 6/7 Yes Yes Yes No Yes Yes No No
Boreal Swamp 6/7 Yes Yes Yes No Yes Yes No No
Large Coldwater Lakes
5/6 Yes Yes Yes No No No Yes No
Northern Hardwood Forest
5/6 Yes Yes Yes No No Yes Yes No
Coldwater Rivers 5/6 Yes Yes No No No No Yes No
River Mainstems 5/6 No No No No No No Yes No
Emergent Marsh 5/6 No No Yes No No No Yes No
Kettle Ponds 5/5 No No Yes No No No Yes No
Riparian Forest 5/5 No No No Yes No No Yes No
Pitch pine-scrub oak Communities
4/4 No No No Yes No No No No
Hardwood Swamp 4/5 No No No Yes No No No No
Atlantic White Cedar Swamps
4/5 No No No Yes No No No No
Vernal Pools 4/5 No No No No No No No No
Shrub Swamp 4/2 No No No No No No Yes No
Central/Southern Hardwoods
1/1 No No No Yes No No Yes No
Warmwater Aquatic
2/2 No No No Yes No No Yes No
Brackish Marsh 6/6 No No No No No No Yes Yes
Saltmarsh 1/1 No No No No No No No Yes
Tidal Flats 6/6 No No No No No No No Yes
12
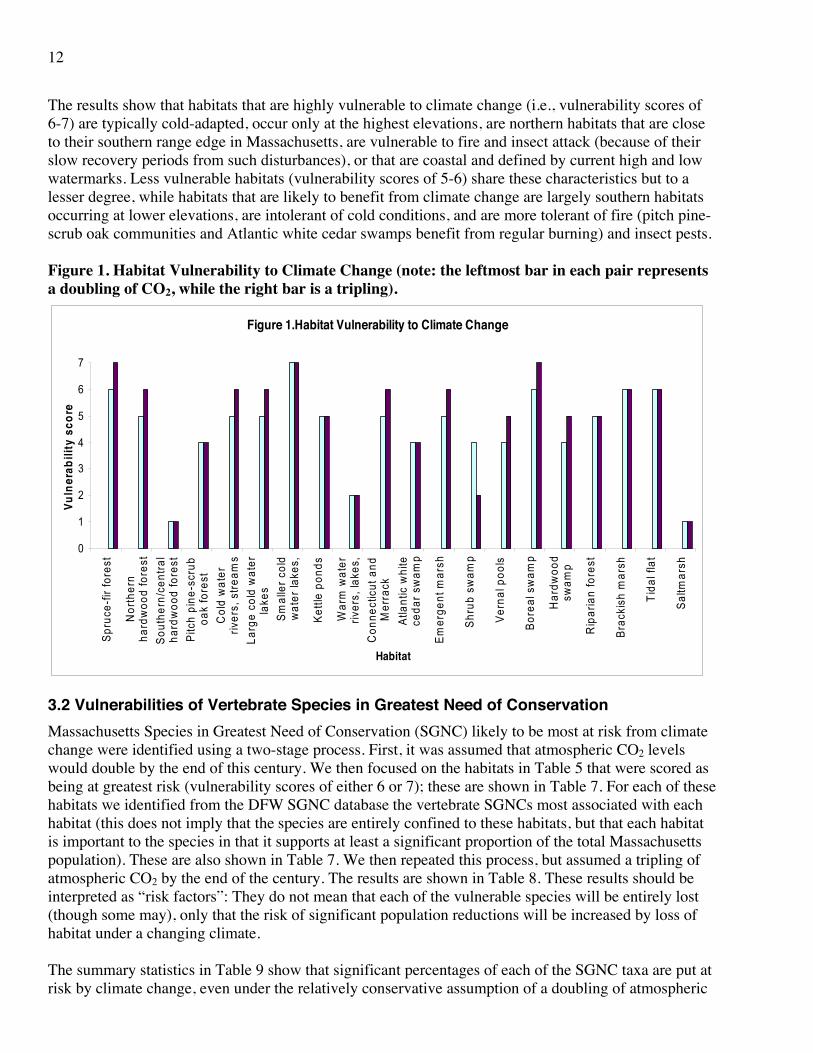
The results show that habitats that are highly vulnerable to climate change (i.e., vulnerability scores of 6-7) are typically cold-adapted, occur only at the highest elevations, are northern habitats that are close to their southern range edge in Massachusetts, are vulnerable to fire and insect attack (because of their slow recovery periods from such disturbances), or that are coastal and defined by current high and low watermarks. Less vulnerable habitats (vulnerability scores of 5-6) share these characteristics but to a lesser degree, while habitats that are likely to benefit from climate change are largely southern habitats occurring at lower elevations, are intolerant of cold conditions, and are more tolerant of fire (pitch pine-scrub oak communities and Atlantic white cedar swamps benefit from regular burning) and insect pests. Figure 1. Habitat Vulnerability to Climate Change (note: the leftmost bar in each pair represents a doubling of CO2, while the right bar is a tripling).
Figure 1.Habitat Vulnerability to Climate Change
0
1
2
3
4
5
6
7
Spru
ce-fi
r for
est
Nor
ther
nha
rdw
ood
fore
stSo
uthe
rn/c
entra
lha
rdw
ood
fore
stPi
tch
pine
-scr
uboa
k fo
rest
Col
d w
ater
river
s, s
tream
sLa
rge
cold
wat
erla
kes
Smal
ler c
old
wat
er la
kes,
Kettl
e po
nds
War
m w
ater
river
s, la
kes,
Con
nect
icut
and
Mer
rack
Atla
ntic
whi
tece
dar s
wam
p
Emer
gent
mar
sh
Shru
b sw
amp
Vern
al p
ools
Bore
al s
wam
p
Har
dwoo
dsw
amp
Rip
aria
n fo
rest
Brac
kish
mar
sh
Tida
l fla
t
Saltm
arsh
Habitat
Vuln
erab
ility
sco
re
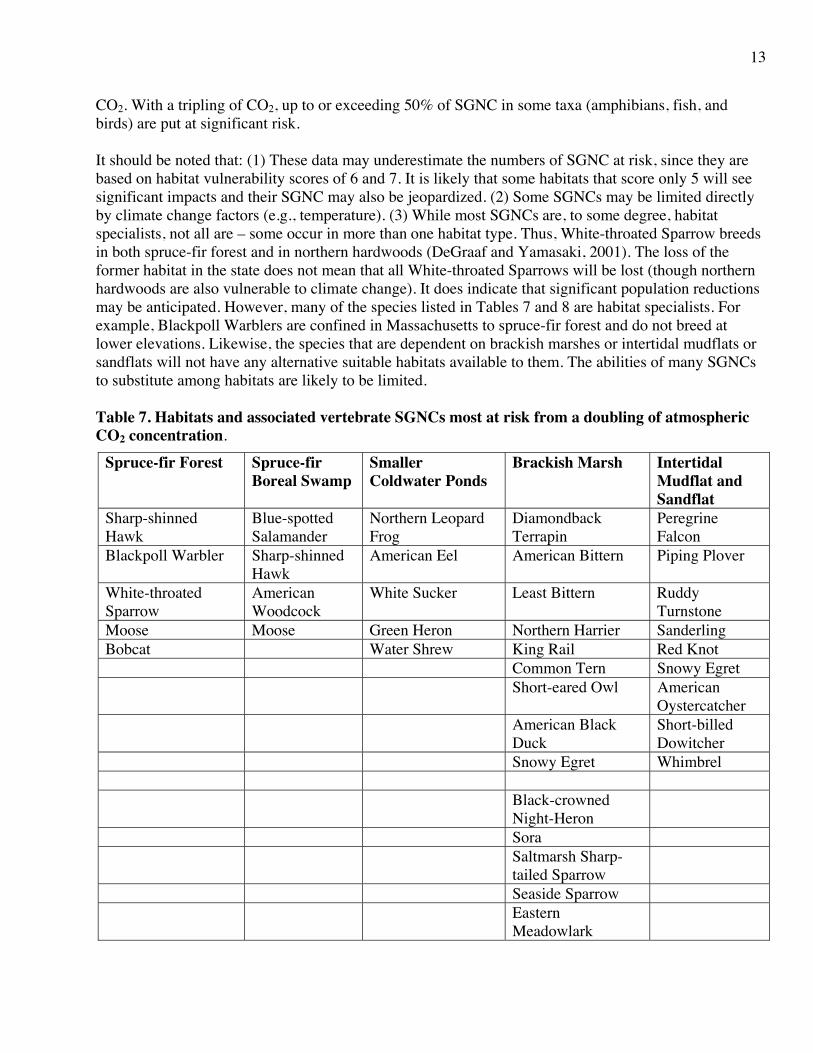
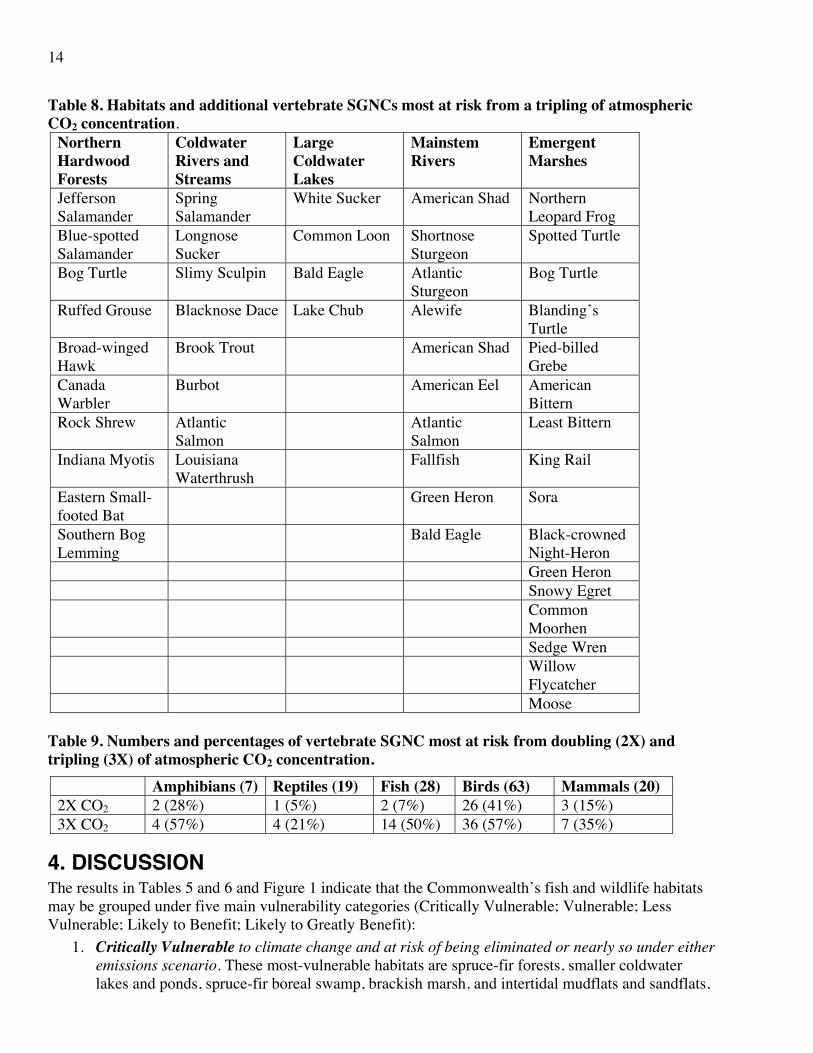
3.2 Vulnerabilities of Vertebrate Species in Greatest Need of Conservation Massachusetts Species in Greatest Need of Conservation (SGNC) likely to be most at risk from climate change were identified using a two-stage process. First, it was assumed that atmospheric CO2 levels would double by the end of this century. We then focused on the habitats in Table 5 that were scored as being at greatest risk (vulnerability scores of either 6 or 7); these are shown in Table 7. For each of these habitats we identified from the DFW SGNC database the vertebrate SGNCs most associated with each habitat (this does not imply that the species are entirely confined to these habitats, but that each habitat is important to the species in that it supports at least a significant proportion of the total Massachusetts population). These are also shown in Table 7. We then repeated this process, but assumed a tripling of atmospheric CO2 by the end of the century. The results are shown in Table 8. These results should be interpreted as “risk factors”: They do not mean that each of the vulnerable species will be entirely lost (though some may), only that the risk of significant population reductions will be increased by loss of habitat under a changing climate. The summary statistics in Table 9 show that significant percentages of each of the SGNC taxa are put at risk by climate change, even under the relatively conservative assumption of a doubling of atmospheric
13
CO2. With a tripling of CO2, up to or exceeding 50% of SGNC in some taxa (amphibians, fish, and birds) are put at significant risk. It should be noted that: (1) These data may underestimate the numbers of SGNC at risk, since they are based on habitat vulnerability scores of 6 and 7. It is likely that some habitats that score only 5 will see significant impacts and their SGNC may also be jeopardized. (2) Some SGNCs may be limited directly by climate change factors (e.g., temperature). (3) While most SGNCs are, to some degree, habitat specialists, not all are – some occur in more than one habitat type. Thus, White-throated Sparrow breeds in both spruce-fir forest and in northern hardwoods (DeGraaf and Yamasaki, 2001). The loss of the former habitat in the state does not mean that all White-throated Sparrows will be lost (though northern hardwoods are also vulnerable to climate change). It does indicate that significant population reductions may be anticipated. However, many of the species listed in Tables 7 and 8 are habitat specialists. For example, Blackpoll Warblers are confined in Massachusetts to spruce-fir forest and do not breed at lower elevations. Likewise, the species that are dependent on brackish marshes or intertidal mudflats or sandflats will not have any alternative suitable habitats available to them. The abilities of many SGNCs to substitute among habitats are likely to be limited. Table 7. Habitats and associated vertebrate SGNCs most at risk from a doubling of atmospheric CO2 concentration.
Spruce-fir Forest Spruce-fir Boreal Swamp
Smaller Coldwater Ponds
Brackish Marsh Intertidal Mudflat and Sandflat
Sharp-shinned Hawk
Blue-spotted Salamander
Northern Leopard Frog
Diamondback Terrapin
Peregrine Falcon
Blackpoll Warbler Sharp-shinned Hawk
American Eel American Bittern Piping Plover
White-throated Sparrow
American Woodcock
White Sucker Least Bittern Ruddy Turnstone
Moose Moose Green Heron Northern Harrier Sanderling Bobcat Water Shrew King Rail Red Knot Common Tern Snowy Egret Short-eared Owl American
Oystercatcher American Black
Duck Short-billed Dowitcher
Snowy Egret Whimbrel Black-crowned
Night-Heron
Sora Saltmarsh Sharp-
tailed Sparrow
Seaside Sparrow Eastern
Meadowlark
14
Table 8. Habitats and additional vertebrate SGNCs most at risk from a tripling of atmospheric CO2 concentration.
Northern Hardwood Forests
Coldwater Rivers and Streams
Large Coldwater Lakes
Mainstem Rivers
Emergent Marshes
Jefferson Salamander
Spring Salamander
White Sucker American Shad Northern Leopard Frog
Blue-spotted Salamander
Longnose Sucker
Common Loon Shortnose Sturgeon
Spotted Turtle
Bog Turtle Slimy Sculpin Bald Eagle Atlantic Sturgeon
Bog Turtle
Ruffed Grouse Blacknose Dace Lake Chub Alewife Blanding’s Turtle
Broad-winged Hawk
Brook Trout American Shad Pied-billed Grebe
Canada Warbler
Burbot American Eel American Bittern
Rock Shrew Atlantic Salmon
Atlantic Salmon
Least Bittern
Indiana Myotis Louisiana Waterthrush
Fallfish King Rail
Eastern Small-footed Bat
Green Heron Sora
Southern Bog Lemming
Bald Eagle Black-crowned Night-Heron
Green Heron Snowy Egret Common
Moorhen Sedge Wren Willow
Flycatcher Moose
Table 9. Numbers and percentages of vertebrate SGNC most at risk from doubling (2X) and tripling (3X) of atmospheric CO2 concentration.
Amphibians (7) Reptiles (19) Fish (28) Birds (63) Mammals (20) 2X CO2 2 (28%) 1 (5%) 2 (7%) 26 (41%) 3 (15%) 3X CO2 4 (57%) 4 (21%) 14 (50%) 36 (57%) 7 (35%)
4. DISCUSSION The results in Tables 5 and 6 and Figure 1 indicate that the Commonwealth’s fish and wildlife habitats may be grouped under five main vulnerability categories (Critically Vulnerable; Vulnerable; Less Vulnerable; Likely to Benefit; Likely to Greatly Benefit):
1. Critically Vulnerable to climate change and at risk of being eliminated or nearly so under either emissions scenario. These most-vulnerable habitats are spruce-fir forests, smaller coldwater lakes and ponds, spruce-fir boreal swamp, brackish marsh, and intertidal mudflats and sandflats,
15
all of which were assigned vulnerability scores of 6 or 7. It should also be noted that the confidence scores for many of these projections are High (largely because the relationships between temperature and species and habitat distribution are well-understood and because the habitats are already highly limited in their distributions in Massachusetts). These are all either cold-adapted habitats that are predominantly northern in their occurrence and are close to the southern edge of their ranges in Massachusetts, or are coastal and vulnerable to sea-level change The spruce-fir forest and spruce-fir boreal swamp are confined to higher elevations or cold basins where temperatures are low, growing seasons short, and where spruce and fir have a competitive advantage over other potentially dominant trees (e.g., broadleaf trees such as beech and maples). Their vulnerability is a consequence of this limitation to generally colder habitats (and to the fact that they are not disturbance-tolerant). The fish and invertebrates typical of smaller coldwater lakes and ponds are also generally cold-adapted. Because of this (and the fact that such habitat is already highly fragmented and limited in its extent within the state), this habitat type is rendered vulnerable to being eliminated entirely under a changing climate. The intertidal habitats are threatened by rising sea levels. Many such sites are likely to be constrained in their abilities to migrate inland (Attachment 20) by a combination of topography and the construction of coastal defense structures as infrastructure becomes threatened.
2. Vulnerable to climate change and at risk of being reduced or greatly reduced in extent under either emissions scenario. These vulnerable habitats include northern hardwood forest, coldwater rivers and streams, large coldwater lakes, coldwater kettle ponds, emergent marshes, and the Connecticut and Merrimack mainstems. These are also habitats that are cold-adapted, though not as closely as the critically vulnerable habitats described above. Also, some of them (e.g., northern hardwoods and coldwater rivers and streams) are not as restricted in their current distributions and extents. Therefore, the expected impacts of climate change are not expected to be as great as those projected for the critically vulnerable habitats (i.e., large-scale habitat contractions will probably result, rather than elimination). Also, many of these habitats (rivers and streams, lakes, kettle ponds, emergent marshes) are potentially vulnerable to drought, which is projected to increase in frequency and intensity under both emissions scenarios. All of these habitats score 5 or 6. The confidence scores range from Low to High.
3. Less Vulnerable to climate change and unlikely to change in their extents or to experience only moderate losses under both the lower and higher emissions scenarios. These less vulnerable habitats include Pitch pine-scrub oak communities, shrub swamps, Atlantic white cedar swamps, hardwood swamps, riparian forests, and vernal pools, all of which score 4 or 5. The distributions of each of these habitats extend much further south than Massachusetts and are not likely to be limited by the temperature changes expected under either emissions scenario. The confidence score assigned to each of these was Medium (except in the case of riparian forest, which was assigned a Low confidence score). The reason that the uncertainty scores were not High was because of the potentially confounding effects of drought. While it is likely that an increased frequency and severity of drought could adversely affect these habitats in Massachusetts, we are unable, given the uncertainty of modeling precipitation change, to project future changes with more confidence.
4. Likely to Benefit under climate change and increase moderately in extent under either emissions scenario. Only one habitat type – warmwater ponds, lakes, and rivers – was so categorized. These warmwater habitats are largely southern or low elevation in their distribution and might be expected to extend their ranges further north and higher in elevation under a warming climate. However, the potential for extension is limited by at least three factors: (1) Most of the waterbodies in the state are already warmwater habitat. (2) The transition from coldwater to warmwater habitats is not likely to be a simple 1:1 conversion. Some mid-elevation, relatively

16
low-flow rivers or streams that are currently coldwater habitat may not become suitable for warmwater plant and animal communities due to the droughts and low summer flow conditions expected under climate change. (3) Warming may disrupt the aquatic ecosystems in ways that are viewed by humans as aesthetically undesirable (e.g., increased frequencies of algal blooms, more emergent vegetation, fish kills, further invasion by undesirable species). These disruptions could lead to management practices that could constrain the spread of warmwater organisms (e.g., more severe winter drawdown, the use of biocides). For these reasons, warmwater habitats were assigned a vulnerability score of 2 (habitat may expand moderately [<50%]) for both emissions scenarios, and a confidence score of Medium (reflecting the three areas of uncertainty listed above).
5. Likely to Greatly Benefit under climate change and increase in extent under either emissions scenario. Two habitats, southern/central hardwood forest and salt marsh, were so categorized. The former is largely a southern habitat type that currently only just penetrates Massachusetts, but might be expected to extend its range further north and higher in elevation under a warming climate. This evaluation was assigned a confidence score of Medium. Recent modeling for salt marsh (Attachment 20) indicates that at least two major coastal wetland sites in Massachusetts, Monomoy and Parker River National Wildlife Reserves, the extent of this habitat will greatly increase under sea-level rise, at the expense of brackish marsh and tidal flat.
4.1. Ecological Trajectories Under Climate Change The analyses above show that different ecological systems are more or less vulnerable to climate change and, consequently, that we can expect to see major changes in their distributions across the Massachusetts landscape. What forms will these changes take? Until relatively recently our dominant model of change was for habitats or biomes to slowly replace each other as their optimum climatic conditions shifted. Thus, we might expect the highly vulnerable spruce-fir forests at upper elevations to be replaced by northern hardwood forest as it moves upslope to track its optimum climatic conditions. This model of entire communities shifting was an important concept in our evaluations of what could happen to habitats under climate change (e.g., VEMAP, 1995). However, we now believe that it is simplistic and may not represent what may actually occur. Different organisms have different intrinsic rates of response to climate change. For example, a northeastern warbler such as the American Redstart can potentially shift its breeding range northward by several hundred kilometers in only a few days, but the majority of the plants that make up the breeding habitat of this species are far less able to respond as rapidly – a similar shift could take decades or centuries. Rather than entire ecosystems or communities shifting their distributions across the landscape, we are much more likely to see them dissociating and separating, depending on their intrinsic response rates, and reconfiguring into potentially novel combinations upslope or further north. This dissociation and reconfiguring is the current dominant model of how ecological communities may be affected by climate change. How do we expect this model to be expressed in Massachusetts fish and wildlife habitats? It is unlikely that over the next century we will see the northern hardwood forest community, with all its associated plant and animal species, simply move uphill to occupy a vacuum left by a retreating spruce-fir forest and all its associated plant and animal species. What is perhaps more likely is that in the shorter term (i.e., the next few decades) we will begin to see the elimination of the most climatically-vulnerable components of the spruce-fir forest, while the forest may retain much of its overall structure and composition. At the same time that this is happening, the spruce-fir forest may be increasingly colonized by lower elevation species that are able to tolerate cooler temperatures and move upslope quickly. Thus, in the shorter term, the northern hardwood forest will permeate rather than replace the spruce-fir. This

17
permeation zone will spread uphill as the climate continues to warm and as lower elevation plants spread uphill and cold-adapted species die out. The process of uphill permeation by northern hardwood forest species and uphill retreat by spruce-fir forest species in the shorter term (the next 50-100 years) will result in a spectrum of forest types replacing the original spruce-fir. In the lowest-elevation areas where the spruce-fir forest originally occurred, it will likely be replaced by a community resembling higher-elevation northern hardwoods. At somewhat higher elevations, the new forest type will likely comprise a mixture of the two community types. At the highest elevation, spruce and fir trees may persist but it is likely that the understory will now comprise many lower-elevation species. Given enough time (perhaps by the end of this century) the spruce fir forest may be gone. This will not necessarily mean that it has been entirely replaced by the northern hardwood community: Some species that are today characteristic of spruce-fir forests may persist, while others that are characteristic of northern hardwoods may not be able to move far enough uphill. Thus, while we do anticipate community movement, it will likely be less deterministic than some of our early models might have predicted, and resemble a long-term community reshuffling, rather than complete replacement. The description above implies a long, slow process of reshuffling of species. However, it is possible that the transitions could happen much more quickly if stochastic events intrude. For example, the warming temperatures could greatly benefit some of the invertebrate pests that afflict northeastern forests. This is already happening with mountain pine beetle in the west (Carroll et al., 2003) and the northward spread of hemlock wooly adelgid in the east (UCS, 2007). More frequent or increased-intensity attacks by such pests could result in a greater incidence of tree die-off, much more standing dead timber, and larger and more intense fires. If severe enough, these circumstances could “flip” the affected system, causing a much more rapid transition to the new habitat type. The considerations described above apply to all climate-induced transitions that we may see in Massachusetts habitats over the next century. What this means for conservationists, planners, or land managers is that, while we can identify the major elements of large-scale change, we must be wary of relying entirely on simple models (e.g., northern hardwood forest and all its associated species will oust spruce-fir forests from higher elevations), think more probabilistically, be prepared for unforeseen surprises, and initiate “climate-smart” monitoring that will allow us to track and respond to changes as they occur.
4.2. Species in Greatest Need of Conservation The results of the analyses reported in Tables 7 through 9 show that the vulnerabilities of some habitats to climate change translate into vulnerabilities of associated vertebrate SGNCs. While it is not possible to calculate the actual impacts on these species in terms of population reductions, it is quite clear that a significant proportion of the vertebrate SGNCs will be put at a greater risk of adverse impacts even under a doubling of CO2. At a tripling, these percentages attain or exceed 50% of taxa. Thus we can expect that the projected impacts on vulnerable habitats will be accompanied by significant adverse impacts on vertebrate SGNCs. Overall, it seems likely that a doubling or tripling of atmospheric CO2 will result in major declines in many of the species that are currently listed as being in greatest need of conservation. As discussed in Section 3.2, it is unlikely that many SGNCs will be able to adapt to climate change impacts by simply switching their habitat preferences.

18
5. REFERENCES ABC (American Bird Conservancy). 2006. Potential Future Climate Change Effects on Ecological Resources and Biodiversity in the San Pedro Riparian National Conservation Area, Arizona. Report published by American Bird Conservancy. Plains, Virginia. Barry, J.P., C.H. Baxter, R.D. Sagarin, and S.E. Gilman. 1995. Climate-related long-term faunal changes in a California rocky intertidal community. Science 267:672-675. Bradley, N.L., A.C. Leopold, J. Ross, and W. Huffaker. 1999. Phenological changes reflect climate change in Wisconsin. Proceedings of the National Academy of Sciences, USA. 96:9701-9704. Brown, J.L., S.H. Li, and N. Bhagabati. 1999. Long-term trend toward earlier breeding in an American bird: A response to global warming? Proceedings of the National Academy of Sciences, USA 96:5565-5569. Carroll, A.L., S.W. Taylor, J. Régnière, and L. Safranyik. 2003. Effects of Climate Change on Range Expansion by the Mountain Pine Beetle in British Columbia. Mountain Pine Beetle Symposium: Challenges and Solutions. October 30-31, 2003. Kelowna, British Columbia. T.L. Shore, J.E. Brooks, and J.E. Stone (eds). Natural Resources Canada, Canadian Forest Service, Pacific Forestry Centre, Information Report BC-X-399, Victoria, British Columbia. 298 p. Chapin, F.S., III, G.R. Shaver, A.E. Giblin, K.G. Nadelhoffer, and J.A. Laundre. 1995. Response of arctic tundra to experimental and observed changes in climate. Ecology 76:694-711. Clough, J. and E. Larsen. 2009. Application of the Sea-Level Affecting Marshes Model (SLAMM 5.0) to Parker River, Monomoy, and Mashpee NWRs. Obtainable from: Dr. Brian Czech, Conservation Biologist, U. S. Fish and Wildlife Service National Wildlife Refuge System, Division of Natural Resources and Conservation Planning, Conservation Biology Program, 4401 N. Fairfax Drive - MS 670 Arlington, VA 22203. Crozier, L. 2003. Winter warming facilitates range expansion: cold tolerance of the butterfly Atalopedes campestris. Oecologia 135:648-656. DeGraaf, R.M., and M. Yamasaki. 2001. New England Wildlife: habitats, natural history, and distribution. University Press of New England. Lebanon, New Hampshire. DFW (Division of Fisheries and Wildlife). 2006. Massachusetts Comprehensive Wildlife Conservation Strategy. Massachusetts Division of Fisheries and Wildlife. Westborough, Mass. Dunn, P.O. and D.W. Winkler. 1999. Climate change has affected the breeding date of tree swallows throughout North America. Proceedings of the Royal Society of London Series B 266:2487-2490. Gibbs, J. P. and A.R. Breisch. 2001. Climate warming and calling phenology of frogs near Ithaca, New York, 1900-1999. Conservation Biology 15:1175-1178. Hayhoe, K., C.P. Wake, T.G. Huntington, L. Luo, M.D. Schwartz, J. Sheffield, E. Wood, B. Anderson, J. Bradbury, A. DeGaetano, T.J. Troy, and D. Wolfe. 2006. Past and future changes in climate and hydrological indicators in the U.S. Northeast. Climate Dynamics DOI 10.1007/s00382-006-0187-8.

19
Hersteinsson, P. and D.W. Macdonald. 1992. Interspecific competition and the geographical distribution of red and arctic foxes Vulpes vulpes and Alopex lagopus. Oikos 64:505-515. Hicke, J.A., G.P. Asner, J.T. Randerson, C. Tucker, S. Los, R. Birdsey, J.C. Jenkins, C. Field, and E. Holland. 2002. Satellite-derived increases in net primary productivity across North America, 1982-1998. Geophysical Research Letters 29(10):69-1—69-4. Holbrook, S.J., R.J. Schmitt, and J.S. Stephens, Jr. 1997. Changes in an assemblage of temperate reef fishes associated with a climatic shift. Ecological Applications 7:1299-1310. IPCC, 2007: Climate Change 2007: Mitigation. Contribution of Working Group III to the Fourth Assessment Report of the Intergovernmental Panel on Climate Change. B. Metz, O.R. Davidson, P.R. Bosch, R. Dave, and L.A. Meyer (eds). Cambridge University Press, Cambridge, UK. Juanes, F., S. Gephard, K.F. Beland. 2004. Long-term changes in migration timing of adult Atlantic salmon (Salmo salar) at the southern edge of the species distribution. Cdn. J. Fisheries and Aquatic Sciences 61:2392-2400. Keeling, C.D., J.F.S. Chin, T.P. Whorf. 1996. Nature 382:146. Kiesecker, J.M., A.R. Blaustein, and L.K. Belden. 2001. Complex causes of amphibian population declines. Nature 410:681-684. Lucht, W., I.C. Prentice, R.B. Myneni, S. Sitch, P. Friedlingstein, W. Cramer, P. Bousquet, W. Buermann, B. Smith. 2002. Climatic control of the high-latitude vegetation greening trend and Pinatubo effect. Science 296:1687-1689. Moss, R.H., and S.H. Schneider. 2000. Towards Consistent Assessment and Reporting of Uncertainties in the IPCC TAR. In Cross-Cutting Issues in the IPCC Third Assessment Report. R. Pachauri and T. Taniguchi (eds). Global Industrial and Social Progress Research Institute (for IPCC). Tokyo. Myneni, R.B., C.D. Keeling, C.J. Tucker, G. Asrar, and R.R. Nemani. 1997. Increased plant growth in the northern high latitudes from 1981 to 1991. Nature 386:698-702. NECIA (Northeast Climate Impacts Assessment). 2006. Climate Change in the U.S. Northeast. A report of the Northeast Climate Impacts Assessment. Union of Concerned Scientists. Cambridge, Mass. Oechel, W.C., S.J. Hastings, G. Vourlitis, and M. Jenkins. 1993. Recent change of arctic tundra ecosystems from net carbon dioxide sink to a source. Nature 361:520-523. Oechel, W.C., G.L. Vourlitis, S.J. Hastings, R.C. Zulueta, L. Hinzman, and D. Kane. 2000. Acclimation of ecosystem CO2 exchange in the Alaska Arctic in response to decadal warming. Nature 406:978-981. Parmesan, C. 1996. Climate and species’ range. Nature 382:765-766. Parmesan, C. and G. Yohe. 2003. A globally coherent fingerprint of climate change impacts across natural systems. Nature 421:37-42.
20
Parmesan, C. and H. Galbraith. 2004. Observed Impacts of Global Climate Change in the U.S. Pew Center on Global Climate Change Report. Washington, D.C. Pfeffer, W.T., J.T. Harper, and S.O. O'Neel. 2008. Kinematic Constraints on Glacier Contributions to 21st-Century Sea-Level Rise. Science 321:1340-1343. Rahmstorf, S. 2007. A Semi-Empirical Approach to Projecting Future Sea-Level Rise. Science 315:368-370. Roemmich, D. and J. McGowan. 1995. Climatic warming and the decline of zooplankton in the California Current. Science 267:1324-1326. Root, T.L., J.T. Price, K.R. Hall, S.H. Schneider, C. Rosenzweig , and J.A. Pounds. 2003. Fingerprints of global warming on wild animals and plants. Nature 421:57-60. Ross, M.S., J.J. O’Brien, L. Da Silveira, and L. Sternberg. 1994. Sea-level rise and the reduction in pine forests in the Florida keys. Ecological Applications 4(1):144-156. Sagarin, R.D., J.P. Barry, S.E. Gilman, and C.H. Baxter. 1999. Climate-related change in an intertidal community over short and long time scales. Ecological Monographs 69:465-490. Sturm, M., C. Racine, and K. Tape. 2001. Increasing shrub abundance in the Arctic. Nature 411:546-547. Swain, P.C., and J.B. Kearsley. 2001. Classification of the Natural Communities of Massachusetts. Version 1.3. Natural Heritage and Endangered Species Program, Massachusetts Division of Fisheries and Wildlife, Westborough, Mass. http://www.mass.gov/dfwele/dfw/nhesp/nhclass.htm. Turner, R.M. 1990. Long-term vegetation change at a fully protected Sonoran desert site. Ecology 71(2):464-477. UCS (Union of Concerned Scientists). 2007. Confronting Climate Change in the U.S. Northeast: Science, Impacts and Solutions. Report by the Union of Concerned Scientists. July 2007. Cambridge, Mass. U.S. EPA. 2007. A Framework for Categorizing the Relative Vulnerability of Threatened and Endangered Species to Climate Change. A report to EPA, Office of Research and Development, Washington, D.C. by H. Galbraith and J. Price. VEMAP (J.M. Melillo, J. Borchers, J. Chaney, H. Fisher, S. Fox, A. Haseltine, A. Janetos, D.W. Kicklighter, T.G.F. Kittel, A.D. McGuire, R. McKeown, R. Neilson, R. Nemani, D.S. Ojima, T. Painter, Y. Pan, W.J. Parton, L. Pierce, L.Pitelka, C. Prentice, B. Rizzo, N.A. Rosenbloom, S. Running, D.S. Schimel, S. Sitch, T. Smith, and I.Woodward). 1995. “Vegetation/Ecosystem Modeling and Analysis Project (VEMAP): Comparing biogeography and biogeochemistry models in a continental-scale study of terrestrial ecosystem responses to climate change and CO2 doubling.” Global Biogeochemical Cycles 9:407-437. Warren, R.S. and W.A. Niering. 1993. Vegetation change on a northeast tidal marsh: Interaction of sea-level rise and marsh accretion. Ecology 74:96-103.

21
Wolfe D.W., M.D. Schwartz, A. Lakso, Y. Otsuki, R. Pool, and N. Shaulis. 2005. Climate change and shifts in spring phenology of three horticultural woody perennials in northeastern USA. Internat. J. Biometeor 49:303-309. Zhou, L., C.J. Tucker, R.K. Kaufmann, D. Slayback, N.V. Shabanov, and R.B. Myneni. 2001. Variation in northern vegetation activity inferred from satellite data of vegetation index during 1981-1999. Journal Geophysical Research-Atmospheres 106(D17):20069-20083.
22
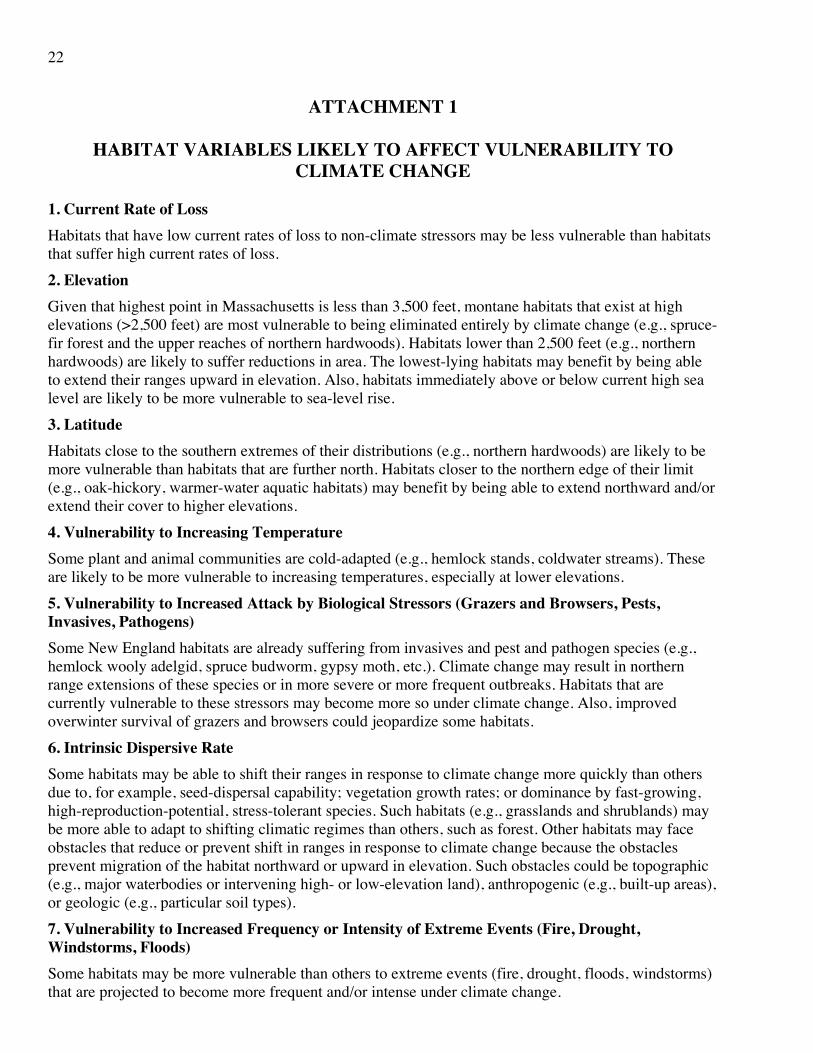
ATTACHMENT 1
HABITAT VARIABLES LIKELY TO AFFECT VULNERABILITY TO CLIMATE CHANGE
1. Current Rate of Loss Habitats that have low current rates of loss to non-climate stressors may be less vulnerable than habitats that suffer high current rates of loss. 2. Elevation Given that highest point in Massachusetts is less than 3,500 feet, montane habitats that exist at high elevations (>2,500 feet) are most vulnerable to being eliminated entirely by climate change (e.g., spruce-fir forest and the upper reaches of northern hardwoods). Habitats lower than 2,500 feet (e.g., northern hardwoods) are likely to suffer reductions in area. The lowest-lying habitats may benefit by being able to extend their ranges upward in elevation. Also, habitats immediately above or below current high sea level are likely to be more vulnerable to sea-level rise. 3. Latitude Habitats close to the southern extremes of their distributions (e.g., northern hardwoods) are likely to be more vulnerable than habitats that are further north. Habitats closer to the northern edge of their limit (e.g., oak-hickory, warmer-water aquatic habitats) may benefit by being able to extend northward and/or extend their cover to higher elevations. 4. Vulnerability to Increasing Temperature Some plant and animal communities are cold-adapted (e.g., hemlock stands, coldwater streams). These are likely to be more vulnerable to increasing temperatures, especially at lower elevations. 5. Vulnerability to Increased Attack by Biological Stressors (Grazers and Browsers, Pests, Invasives, Pathogens) Some New England habitats are already suffering from invasives and pest and pathogen species (e.g., hemlock wooly adelgid, spruce budworm, gypsy moth, etc.). Climate change may result in northern range extensions of these species or in more severe or more frequent outbreaks. Habitats that are currently vulnerable to these stressors may become more so under climate change. Also, improved overwinter survival of grazers and browsers could jeopardize some habitats. 6. Intrinsic Dispersive Rate Some habitats may be able to shift their ranges in response to climate change more quickly than others due to, for example, seed-dispersal capability; vegetation growth rates; or dominance by fast-growing, high-reproduction-potential, stress-tolerant species. Such habitats (e.g., grasslands and shrublands) may be more able to adapt to shifting climatic regimes than others, such as forest. Other habitats may face obstacles that reduce or prevent shift in ranges in response to climate change because the obstacles prevent migration of the habitat northward or upward in elevation. Such obstacles could be topographic (e.g., major waterbodies or intervening high- or low-elevation land), anthropogenic (e.g., built-up areas), or geologic (e.g., particular soil types). 7. Vulnerability to Increased Frequency or Intensity of Extreme Events (Fire, Drought, Windstorms, Floods) Some habitats may be more vulnerable than others to extreme events (fire, drought, floods, windstorms) that are projected to become more frequent and/or intense under climate change.
23
8. Vulnerability to Phenologic Change Some habitats are dependent on the timing of annual events such as snow melt, ice-out, timing of run-off, etc. For example, coldwater fish habitat and vernal pools are both influenced by the timing of spring snow-melt, ice-out, and precipitation. Changes in the timing of such events could have adverse habitat impacts. 9. Vulnerability to Human Maladaptive Responses Some habitats are likely to be vulnerable to human responses to climate change more than to climate change itself. For example, the construction of sea walls in response to rising sea levels will have major impacts on the ability of the coast line to migrate inland, thereby jeopardizing coastal habitats such as saltmarshes and intertidal mudflats and sandflats. 10. Likely Future Impacts of Non-Climate Stressors Future adaptation to climate change may focus largely on enhancing ecosystem/habitat resilience. One way to address this is to minimize the effects of non-climate stressors, such as contaminants, habitat destruction, fragmentation, invasive species, pests, etc. It is important, therefore, to identify for each habitat which non-climate stressors may be important in the future and the comparative vulnerabilities of the habitats to those stressors.
24
ATTACHMENT 2
HABITAT VULNERABILITY SCORING SYSTEM
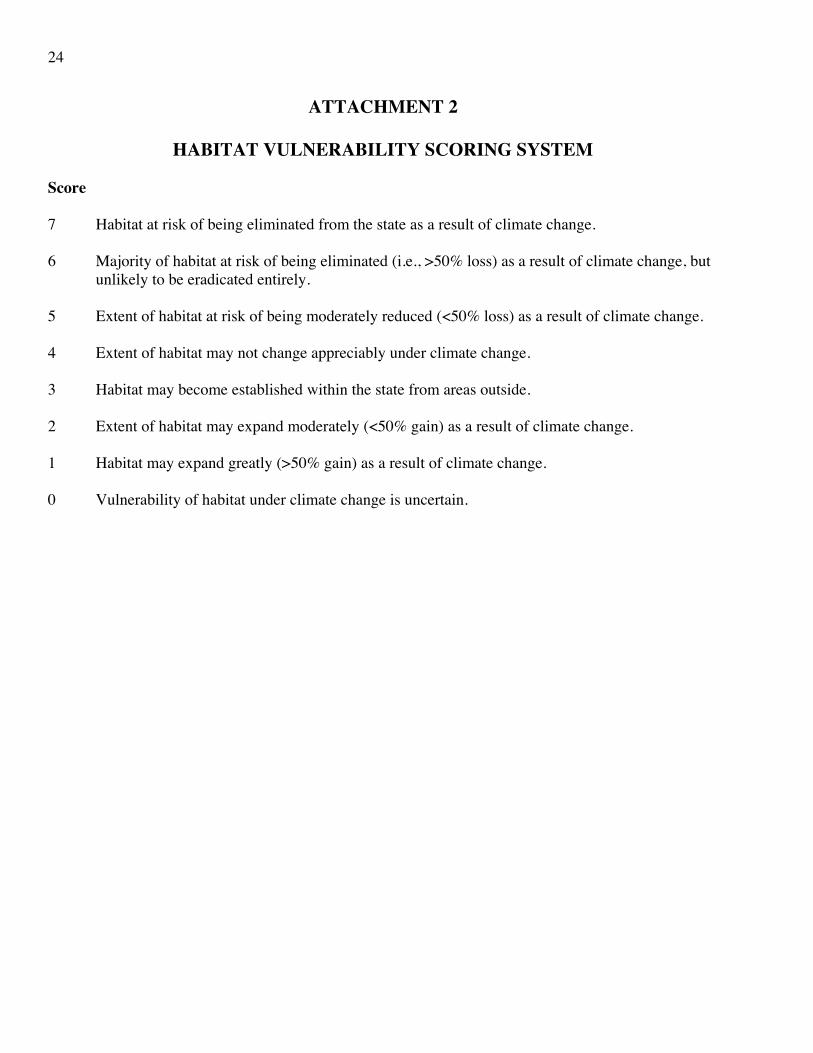
Score 7 Habitat at risk of being eliminated from the state as a result of climate change. 6 Majority of habitat at risk of being eliminated (i.e., >50% loss) as a result of climate change, but
unlikely to be eradicated entirely. 5 Extent of habitat at risk of being moderately reduced (<50% loss) as a result of climate change. 4 Extent of habitat may not change appreciably under climate change. 3 Habitat may become established within the state from areas outside. 2 Extent of habitat may expand moderately (<50% gain) as a result of climate change. 1 Habitat may expand greatly (>50% gain) as a result of climate change. 0 Vulnerability of habitat under climate change is uncertain.

25
ATTACHMENT 3
CONFIDENCE EVALUATION SCORES
Confidence Level High confidence >70% confidence Medium confidence between 30% and 70% confidence Low confidence <30% confidence

26
ATTACHMENT 4
SPRUCE-FIR FOREST VULNERABILITY EVALUATION
NTWHCS category: Acadian-Appalachian Montane Spruce-Fir Forest State ranking S2 Vulnerability score 7 (both emissions scenarios) Confidence evaluation High Rationale Limited by temperature, wind, winter snowpack, and acidic soils, spruce-fir forest is generally confined to higher elevation mountains in the Northeast. The occurrence and persistence of low cloud cover, from which these forests obtain much of their water supply, may also be a main ecological limiting factor for this habitat type: Cogbill and White, (1991) propose that the lower elevational limit for this community in New England is determined by cloud cover. In Massachusetts, it is a relatively uncommon and highly fragmented habitat, found mainly above 2,500 feet (e.g., at >3,000 feet on Mount Greylock), though it occurs as small fragments down to 2,000 feet in state forests in Peru and Savoy and on mounts Wachusett and Watatic, where it grades into northern hardwood forest. It is dominated by red spruce and balsam fir with a typically sparse understory of striped maple, mountain ash, and hobblebush. The ground layer is usually sparse and dominated by mosses, particularly sphagnum species, and lichens. With an elevation-temperature lapse rate of 1.8ºF for every 330 feet (http://www.spc.noaa.gov/exper/soundings/help/lapse.html), it would require a mean annual temperature increase of only about 5ºF to entirely eliminate the climatic envelope in which this habitat exists in Massachusetts. The most recent and detailed modeling (Hayhoe et al., 2006) indicates that under the low emissions scenario this threshold may be reached by 2100. Under the high emissions scenario, it will be reached and exceeded by 2050. Based on bioclimatic modeling, Prasad et al., (2007) found in the U.S. Forest Service Climate Change Tree Atlas project that the two dominant tree species in this habitat (Balsam Fir and Red Spruce) will be eliminated entirely from southern New England, except under the least sensitive GCM (PCM) and lowest IPCC emissions scenario (B1). Prasad et al. (2007) assign model reliability scores of High for both species. Because of the above, we have assigned a lower emissions scenario vulnerability score of 6 (most of the habitat likely to be eliminated from the state), and a higher emissions scenario vulnerability score of 7 (likely to be entirely eliminated from the state). The above analysis is based on projected changes in temperature and growing season. However, it is also plausible that a changing climate could also affect this habitat type through changes in cloud cover. If the distribution and frequency of occurrence of low blanketing cloud is affected by climate change (as is already happening in some cloud forests in Central America), it is possible that water stress could be an added determinant of the future distribution and extent of spruce-fir forest in Massachusetts. Although a possibility, it is difficult to evaluate the potential magnitude and extent of this effect since changes in cloud cover patterns cannot be projected using currently available general circulation models. The above rankings may actually underestimate the rapidity of the potential effects of climate change on this habitat type since they consider only direct effects. However, it is not unlikely that important adverse indirect effects could also be triggered by climate change. For example, an increased incidence and intensity of fire (spruce-fir has a slow natural return rate of several hundred years) and of tree
27
damage from an increased frequency of ice storms, windthrow, invasives, and pests could accelerate the rate of demise of this habitat type in the state. Also, the balsam wooly adelgid is currently injuring large tracts of balsam fir in the southern range of this tree species. The adelgid’s distribution is limited by low winter temperatures and it could become an additional indirect stressor in southern New England as warming continues. Because of the tight relationship between the distribution of Red Spruce and Balsam Fir and climate (particularly temperature and length of growing season), we assign a confidence category of High to our vulnerability categorizations. Also, the models used by Prasad et al. (2007) were assigned reliability scores of High – i.e., a high degree of confidence in the model projections. References Hayhoe, K., C.P. Wake, T.G. Huntington, L. Luo, M.D. Schwartz, J. Sheffield, E. Wood, B. Anderson, J. Bradbury, A. DeGaetano, T.J. Troy, and D. Wolfe. 2006. Past and future changes in climate and hydrological indicators in the U.S. Northeast. Climate Dynamics DOI 10.1007/s00382-006-0187-8. Prasad, A. M., L. R. Iverson., S. Matthews., M. Peters. 2007. A Climate Change Atlas for 134 Forest Tree Species of the Eastern United States [database]. Northern Research Station, USDA Forest Service, Delaware, Ohio. Cogbill, C.V. and P.S. White. 1991. The latitude-elevation relationship for spruce-fir and treeline along the Appalachian mountain chain. Vegetation 94:153–175.
28
ATTACHMENT 5
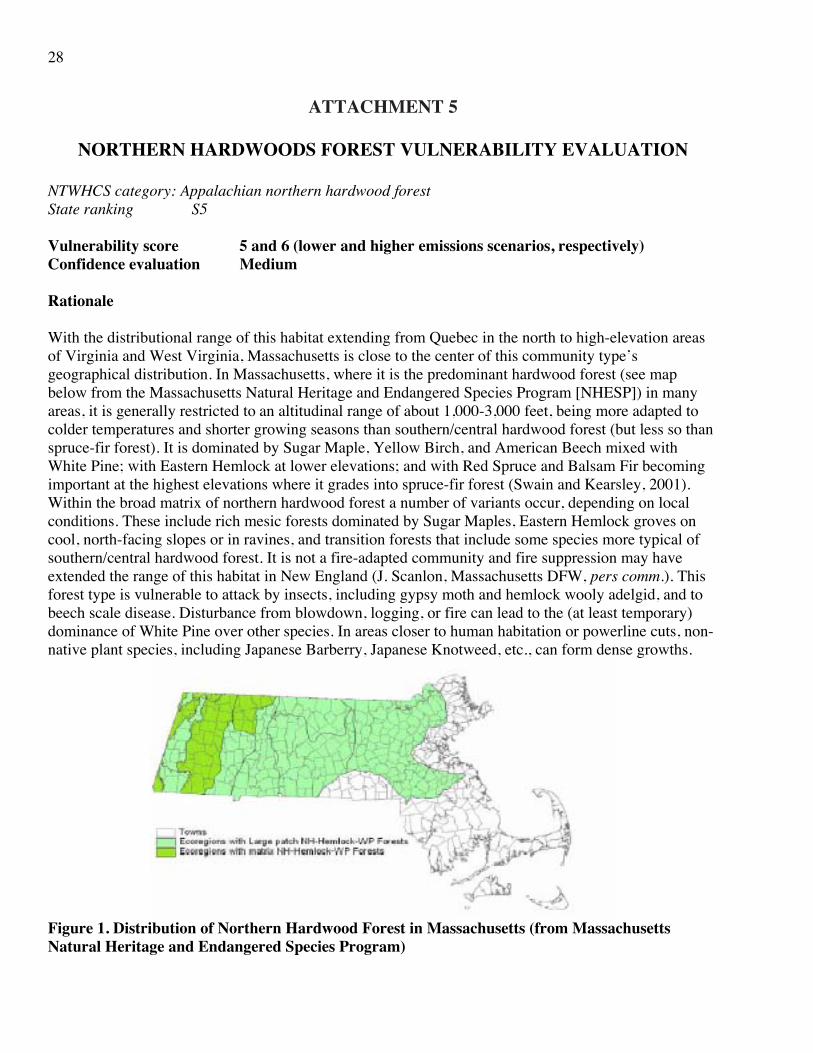
NORTHERN HARDWOODS FOREST VULNERABILITY EVALUATION NTWHCS category: Appalachian northern hardwood forest State ranking S5 Vulnerability score 5 and 6 (lower and higher emissions scenarios, respectively) Confidence evaluation Medium Rationale With the distributional range of this habitat extending from Quebec in the north to high-elevation areas of Virginia and West Virginia, Massachusetts is close to the center of this community type’s geographical distribution. In Massachusetts, where it is the predominant hardwood forest (see map below from the Massachusetts Natural Heritage and Endangered Species Program [NHESP]) in many areas, it is generally restricted to an altitudinal range of about 1,000-3,000 feet, being more adapted to colder temperatures and shorter growing seasons than southern/central hardwood forest (but less so than spruce-fir forest). It is dominated by Sugar Maple, Yellow Birch, and American Beech mixed with White Pine; with Eastern Hemlock at lower elevations; and with Red Spruce and Balsam Fir becoming important at the highest elevations where it grades into spruce-fir forest (Swain and Kearsley, 2001). Within the broad matrix of northern hardwood forest a number of variants occur, depending on local conditions. These include rich mesic forests dominated by Sugar Maples, Eastern Hemlock groves on cool, north-facing slopes or in ravines, and transition forests that include some species more typical of southern/central hardwood forest. It is not a fire-adapted community and fire suppression may have extended the range of this habitat in New England (J. Scanlon, Massachusetts DFW, pers comm.). This forest type is vulnerable to attack by insects, including gypsy moth and hemlock wooly adelgid, and to beech scale disease. Disturbance from blowdown, logging, or fire can lead to the (at least temporary) dominance of White Pine over other species. In areas closer to human habitation or powerline cuts, non-native plant species, including Japanese Barberry, Japanese Knotweed, etc., can form dense growths.
Figure 1. Distribution of Northern Hardwood Forest in Massachusetts (from Massachusetts Natural Heritage and Endangered Species Program)
29
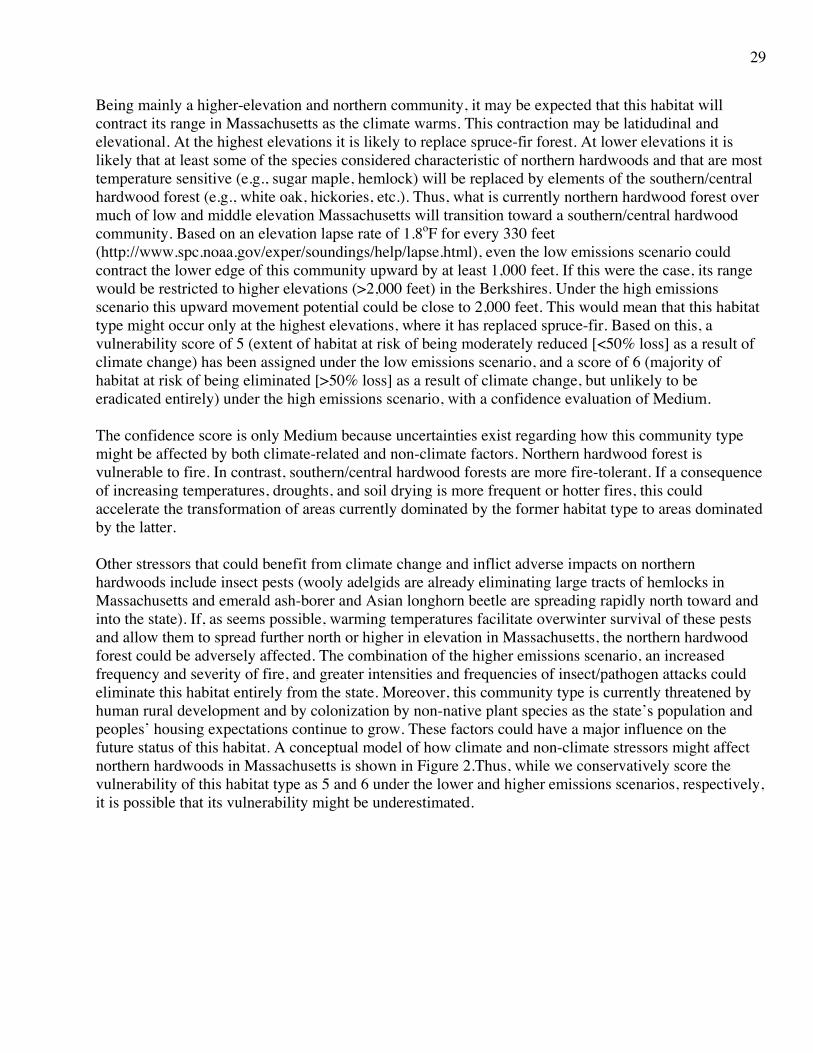
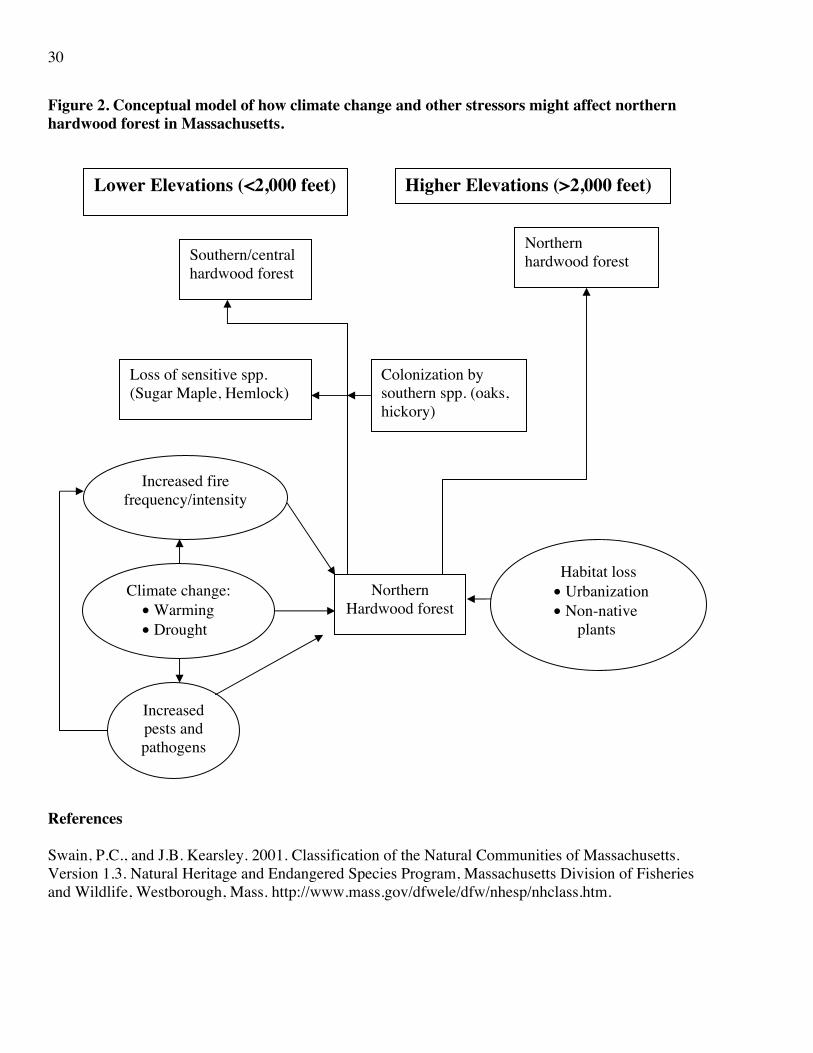
Being mainly a higher-elevation and northern community, it may be expected that this habitat will contract its range in Massachusetts as the climate warms. This contraction may be latidudinal and elevational. At the highest elevations it is likely to replace spruce-fir forest. At lower elevations it is likely that at least some of the species considered characteristic of northern hardwoods and that are most temperature sensitive (e.g., sugar maple, hemlock) will be replaced by elements of the southern/central hardwood forest (e.g., white oak, hickories, etc.). Thus, what is currently northern hardwood forest over much of low and middle elevation Massachusetts will transition toward a southern/central hardwood community. Based on an elevation lapse rate of 1.8oF for every 330 feet (http://www.spc.noaa.gov/exper/soundings/help/lapse.html), even the low emissions scenario could contract the lower edge of this community upward by at least 1,000 feet. If this were the case, its range would be restricted to higher elevations (>2,000 feet) in the Berkshires. Under the high emissions scenario this upward movement potential could be close to 2,000 feet. This would mean that this habitat type might occur only at the highest elevations, where it has replaced spruce-fir. Based on this, a vulnerability score of 5 (extent of habitat at risk of being moderately reduced [<50% loss] as a result of climate change) has been assigned under the low emissions scenario, and a score of 6 (majority of habitat at risk of being eliminated [>50% loss] as a result of climate change, but unlikely to be eradicated entirely) under the high emissions scenario, with a confidence evaluation of Medium. The confidence score is only Medium because uncertainties exist regarding how this community type might be affected by both climate-related and non-climate factors. Northern hardwood forest is vulnerable to fire. In contrast, southern/central hardwood forests are more fire-tolerant. If a consequence of increasing temperatures, droughts, and soil drying is more frequent or hotter fires, this could accelerate the transformation of areas currently dominated by the former habitat type to areas dominated by the latter. Other stressors that could benefit from climate change and inflict adverse impacts on northern hardwoods include insect pests (wooly adelgids are already eliminating large tracts of hemlocks in Massachusetts and emerald ash-borer and Asian longhorn beetle are spreading rapidly north toward and into the state). If, as seems possible, warming temperatures facilitate overwinter survival of these pests and allow them to spread further north or higher in elevation in Massachusetts, the northern hardwood forest could be adversely affected. The combination of the higher emissions scenario, an increased frequency and severity of fire, and greater intensities and frequencies of insect/pathogen attacks could eliminate this habitat entirely from the state. Moreover, this community type is currently threatened by human rural development and by colonization by non-native plant species as the state’s population and peoples’ housing expectations continue to grow. These factors could have a major influence on the future status of this habitat. A conceptual model of how climate and non-climate stressors might affect northern hardwoods in Massachusetts is shown in Figure 2.Thus, while we conservatively score the vulnerability of this habitat type as 5 and 6 under the lower and higher emissions scenarios, respectively, it is possible that its vulnerability might be underestimated.
30
Figure 2. Conceptual model of how climate change and other stressors might affect northern hardwood forest in Massachusetts.
References Swain, P.C., and J.B. Kearsley. 2001. Classification of the Natural Communities of Massachusetts. Version 1.3. Natural Heritage and Endangered Species Program, Massachusetts Division of Fisheries and Wildlife, Westborough, Mass. http://www.mass.gov/dfwele/dfw/nhesp/nhclass.htm.
Northern hardwood forest Southern/central
hardwood forest
Increased fire frequency/intensity
Increased pests and pathogens
Northern Hardwood forest
Climate change: • Warming • Drought
Habitat loss • Urbanization • Non-native
plants
Loss of sensitive spp. (Sugar Maple, Hemlock)
Colonization by southern spp. (oaks, hickory)
Lower Elevations (<2,000 feet) Higher Elevations (>2,000 feet)
31
ATTACHMENT 6
CENTRAL/SOUTHERN HARDWOODS VULNERABILITY EVALUATION
NTWHCS category: Central Appalachian dry oak-pine forest State ranking S5 Vulnerability score 1 (both emissions scenarios) Confidence evaluation Medium Rationale Its range extending south to Virginia and West Virginia, this community type reaches its most northern limit in central New England (Massachusetts, southern New Hampshire, and Vermont). It is therefore a southern community type that only edges into New England (Swain and Kearsley, 2001). It is dominated by various oak species (White, Red, Black, Chestnut) with White Pine, and occurs on coarse, well-drained soils. It is relatively tolerant of fire (more so than northern hardwoods), provided that it is not burnt too frequently or at high intensities. For the purposes of this analysis, “central/southern hardwood forest” includes both the mixed oak forest and oak-hemlock-white pine forest described by Swain and Kearsley (2001). In Massachusetts, this community type has a distribution that is largely limited to relatively low-lying areas (<1,000 feet) on the coastal plain, the southern Worcester Plateau, and the Connecticut River Valley (J. Scanlon, Massachusetts DFW, pers comm.). It is typically found on well-drained, alluvial soils on south-facing slopes. Being mainly a southern community, it may be expected that this habitat will extend its range further into Massachusetts as the climate warms. This extension may be latidudinal and elevational, and it will replace northern hardwoods forest. Even the low emissions scenario could enable this community type to extend upward in elevation by at least 1,000 feet, thus opening up large areas for colonization. Under the high emissions scenario this upward movement potential could be close to 2,000 feet. This would mean that this habitat type could invade much of the land currently inhabited by northern hardwoods. Based on this, a vulnerability score of 1 (habitat may expand greatly [>50% gain] as a result of climate change) has been assigned to it (both scenarios), with a confidence evaluation of Medium. The confidence score is only Medium because uncertainties exist regarding how this community type might be affected by climate-related and non-climate factors. If more frequent or more intense fires are a consequence of warming temperature, droughts, and desiccation of soils, then the potential spread of this habitat could be limited. Also, its range is currently limited by soil type (it is found mainly on coarse, well-drained soils). This could limit its spread into areas with finer soils or higher rainfall. Biotic factors may also limit its spread: It is currently under pressure from increasing populations of White-tailed Deer and Wild Turkey. In some areas these species are already affecting the composition and regeneration of this community type (J. Scanlon, Massachusetts DFW, pers comm.). If, as seems likely, climate change increases the overwinter survival of these species, this could result in adverse impact on the habitat type. Furthermore, this community type is currently under stress from human development as the state population and peoples’ housing expectations continue to grow. These factors could be major influences on the future status of this habitat.

32
References Swain, P.C., and J.B. Kearsley. 2001. Classification of the Natural Communities of Massachusetts. Version 1.3. Natural Heritage and Endangered Species Program, Massachusetts Division of Fisheries and Wildlife, Westborough, Mass. http://www.mass.gov/dfwele/dfw/nhesp/nhclass.htm.

33
ATTACHMENT 7
PITCH PINE-SCRUB OAK VULNERABILITY EVALUATION
NTWHCS category: Northeastern Interior Pine Barrens/North Atlantic Coastal Plain Pitch Pine barrens State ranking S2 Vulnerability score 4 (both emissions scenarios) Confidence evaluation Medium Rationale Its range extending south to New Jersey and Maryland, this community type reaches its northern limit on sandy, nutrient-poor, drought-prone soils in southern Maine, on Cape Cod, in the southern part of the Massachusetts coastal plain, and in the Connecticut River Valley (see Massachusetts Natural Heritage and Endangered Species Program map below). It is therefore a southern community type that extends into southern and central New England. Its canopy is dominated by Pitch Pine, with an understory of Scrub Oak, Huckleberry, and Lowbush Blueberry. The system is fire-maintained and will revert to White Pine or oak-dominated forest in the absence of fire (NHESP, 2007).
Figure 1. Distribution of Pitch pine-scrub oak communities in Massachusetts. Pitch pine-scrub oak occurs in significantly warmer climates to the south in New Jersey and Maryland. If the only determinant of its distribution were climate, it would be likely that its distribution in Massachusetts would extend under a warming climate. However, non-climatic factors, mainly the distribution of sandy, nutrient-poor soils; fire frequency; and development, are also important factors. These are likely to be the main limiting factors in any future spread of pitch pine barrens, not climate change. Based on this, a vulnerability score of 4 (extent of habitat may not change appreciably under climate change) has been assigned for both scenarios. The confidence score that we assign for this community type is Medium. This is because its future distribution is dependent on uncertain human settlement patterns and responses to climate change. Urban development is already a major fragmenting factor affecting this forest type and it is unlikely that this
34
pressure will ease over the next few decades. Also, as the summers warm and droughts become more frequent and prolonged, fire outbreaks may become more frequent and/or intense. How humans respond to this is a major uncertainty. If the societal response is increased fire suppression (to protect property and lives), it could result in further loss and fragmentation of this habitat type. References Massachusetts Natural Heritage and Endangered Species Program (NHESP). 2007. Natural Community Fact Sheet: Pitch Pine/Scrub Oak Communities. Massachusetts Division of Fisheries and Wildlife, Westborough, Mass.
35
ATTACHMENT 8
COLDWATER RIVERS AND STREAMS VULNERABILITY EVALUATION Vulnerability score 5 or 6 (low and high emissions scenarios, respectively) Confidence evaluation High Rationale This habitat type supports coldwater invertebrates such as the larvae of stoneflies and caddis flies, and coldwater-adapted fish, including sculpins and brook trout. It is largely limited to the higher elevations of the state on the Worcester Plateau and in the Berkshires, but also occurs at lower elevations in streams that are fed by groundwater (C. Slater, Massachusetts DFW, pers comm.). In evaluating the likely impact of climate change on this habitat type in Massachusetts, it is important to recognize that its current range extends far south of Massachusetts into the southern Appalachians in Georgia and South Carolina. Therefore, it currently persists in states with climates that are generally warmer by several degrees than Massachusetts. Under the lower emissions scenario, we project that the range of this habitat type will contract upward in elevation as the air temperature (and, hence, water temperatures) increase. Rivers and streams on the Worcester Plateau will be unlikely to continue to provide coldwater habitat. Under the higher emissions scenario, the habitat will contract even further to higher elevations in the Berkshires. However, it is less likely that this habitat type will be eradicated entirely from the state, even under the higher emissions scenario, as it could persist at the highest elevations and in areas fed by cool groundwater. Assuming an elevation lapse rate of 1.8oF for every 330 feet in elevation (http://www.spc.noaa.gov/exper/soundings/help/lapse.html), the higher emissions scenario temperature increase projection of 6o-12oF, and a current lowest elevation of this habitat type of 1,000 feet, the future low elevation range limit of this habitat type would be between 2,000 and 3,200 feet. Thus, it could persist, though much reduced in extent, in the higher elevation areas of the Berkshires. Under the low emissions scenario, coldwater rivers and streams were assigned a vulnerability score of 5 (extent of habitat likely to be reduced but by less than 50%). Under the higher emissions scenario, this habitat type scored 6 (majority of habitat likely to be eliminated, but not eradicated entirely). Confidence scores of High were assigned to each of these evaluations. This is justified by the fact that the habitat and its associated species are well known to be sensitive to water temperature, and that the temperature projections for the future are the least uncertain of the climate model predictions. Other stressors to which this habitat is currently subjected and that could play contributory roles in the future include: the expansion of residential and commercial development with its associated impervious surfaces (which collect and warm precipitation before it reaches the streams); agricultural, residential, and commercial water withdrawals; non-point contaminant runoff; and fragmentation by dams and culverts. On the other hand, in addition to being potential future exacerbatory stressors, some of these agents may constitute “adaptation intervention points” at which the resiliencies of the aquatic systems to climatic change could be enhanced. Thus, by restricting the extent and magnitudes of these stressors, the overall resilience of aquatic systems to future climate change may be enhanced.
36
ATTACHMENT 9
LARGE COLDWATER LAKES VULNERABILITY EVALUATION Vulnerability score 5 or 6 (lower and higher emissions scenarios, respectively) Confidence evaluation Medium Rationale At least two large Massachusetts reservoirs, Quabbin and Wachusett, support stable elements of a coldwater biological community, though they are largely dominated by warmwater organisms. The coldwater elements persist because these lakes are oligotrophic or mesotrophic and large and deep enough to allow the development of a thermocline with a coldwater deeper layer (hypolimnion). Quabbin covers a total area of 24,700 acres, with a maximum depth of greater than 100 feet, while Wachusett covers 4,160 acres, and reaches a maximum depth of 129 feet (http://www.mass.gov/dfwele/dfw/ habitat/maps/ponds/pond_maps.htm). The deeper waters in these lakes support coldwater fish, including land-locked Atlantic salmon (self-supporting in Wachusett, and augmented by stocking in Quabbin) and lake trout (self-supporting in both Quabbin and Wachusett). Under both emissions scenarios, it is likely that the hypoliminia will be forced ever deeper and will contract in volume (C. Slater, Massachusetts DFW, pers. comm.), further reducing the volume of coldwater habitat. These two lakes were assigned vulnerability scores of 5 (extent of habitat likely to be reduced, but by less than 50%) and 6 (majority of habitat likely to be eliminated, but not eradicated entirely) under the low and high emissions scenarios, respectively. The confidence scores assigned to these vulnerability categorizations were only Medium for the following main reasons: (1) These lakes are reservoirs managed for human water supply. Their fates under climate change are only partly a function of temperature and they may be equally or more vulnerable to changes in management regime. As the climate changes, human water needs may also change, necessitating potentially disruptive management practices. (2) Both lakes are also used by humans as recreational resources. As the climate warms, the aquatic ecosystems may be disrupted in ways that are viewed by humans as aesthetically undesirable (e.g., increased frequencies of algal blooms, more emergent vegetation). These could lead to management practices (e.g., drawdowns to eliminate algae or weeds) that could jeopardize the remaining coldwater habitat.
37
ATTACHMENT 10
SMALLER COLDWATER LAKES AND PONDS AND KETTLE PONDS VULNERABILITY EVALUATION
Vulnerability score 7 (smaller coldwater lakes and ponds; both emissions scenarios)
5 (coldwater kettle ponds; both emissions scenarios) Confidence evaluation High (smaller coldwater lakes and ponds) Low (coldwater kettle ponds) Rationale In addition to Quabbin and Wachusett, more than 30 other smaller lakes and ponds in Massachusetts (Table 1) support some fragments of coldwater habitat. Because these waterbodies are smaller and shallower (generally less than 500 acres and 80 feet maximum depth), they are at best tenuous supporters of coldwater habitat and there is a high risk that this habitat will be eliminated entirely, even under the lower emissions scenario. They were, therefore, assigned a vulnerability score of 7 (likely to be entirely eliminated from the state) for both scenarios, with a confidence score of High. As the climate warms, the aquatic ecosystems may be disrupted in ways that are viewed by humans as aesthetically undesirable (e.g., increased frequencies of algal blooms, more emergent vegetation). These could lead to management practices (e.g., more severe winter drawdown, the use of biocides), that could also jeopardize the remaining coldwater habitat. An additional 10 or so kettle ponds on the southwest coastal plain and on Cape Cod currently support coldwater habitat (Table 1). Although they are small and relatively shallow, coldwater habitat persists in these ponds because they receive their main hydrologic input directly from groundwater. It is not clear how, or how rapidly, increasing atmospheric temperatures will affect groundwater temperatures: If the groundwater feeding a kettle pond comes from a relatively deep source, it may be buffered from atmospheric temperature change. If, however, the groundwater source to a particular pond is shallow and the surface-subsurface recharge rate is high, the aquifer water temperatures – and, therefore, the pond temperature – might increase as the atmosphere warms. Climate change poses three main threats to kettle ponds in southeastern Massachusetts: (1) The groundwater aquifer underlying Cape Cod is already under increasing anthropogenic pressure as expanding human communities extract water for municipal and residential growth. This depletion rate could accelerate as summer air temperatures rise and the water needs of communities increase. Accelerated depletion of the aquifers could result in a lowering of the water table, with the risk that kettle ponds could become “perched,” and cut off from their recharge source. (2) As sea levels rise, increasing levels of ground water extraction could result in a cone of depletion that could trigger saltwater intrusions into the freshwater aquifers, with resulting impacts on the kettle ponds. (3) Increasing ambient temperatures coupled with nutrient inflow from surrounding agricultural and residential land could result in a general warming of the ponds and eutrophication. While all of these effects are plausible, we cannot be certain about their rates or magnitudes. For this reason, we have conservatively assigned a vulnerability score of 5 (extent of habitat likely to be moderately reduced) for both emissions scenarios. It is feasible that these scores may underestimate the vulnerability of kettle ponds to climate change, but considerable uncertainty exists, and this is reflected in our assigned confidence scores of only Low to this habitat type.
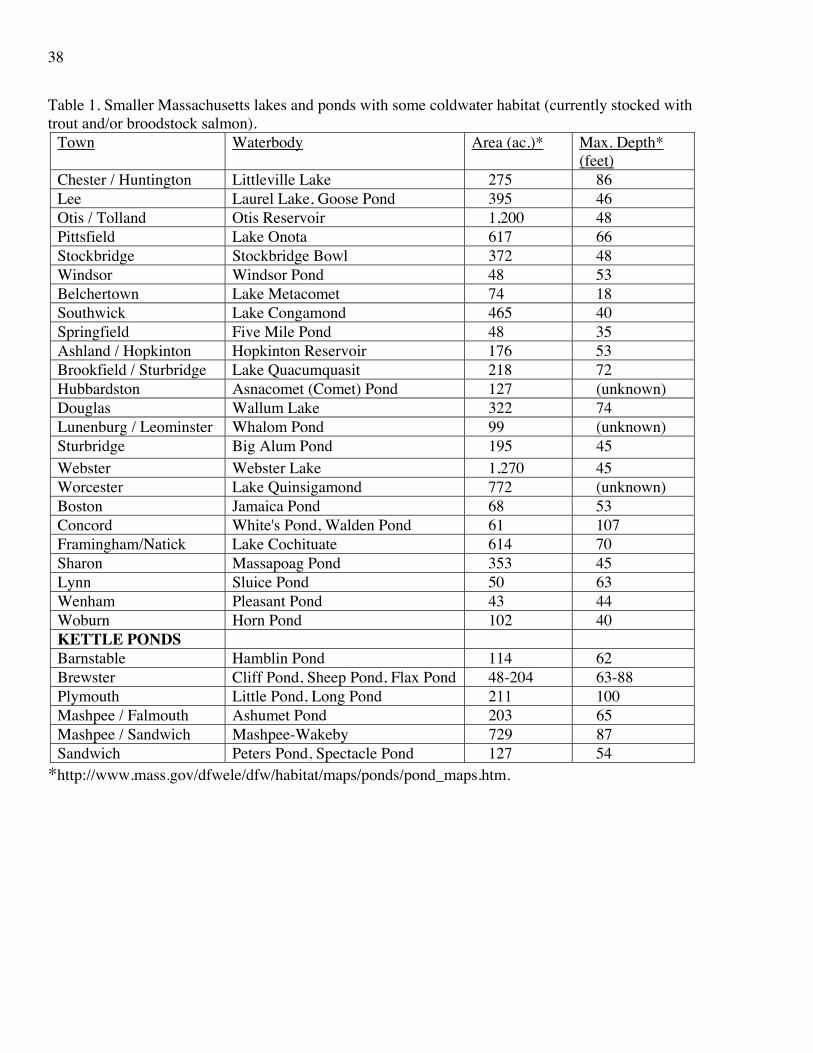
38
Table 1. Smaller Massachusetts lakes and ponds with some coldwater habitat (currently stocked with trout and/or broodstock salmon).
Town Waterbody Area (ac.)* Max. Depth* (feet)
Chester / Huntington Littleville Lake 275 86 Lee Laurel Lake, Goose Pond 395 46 Otis / Tolland Otis Reservoir 1,200 48 Pittsfield Lake Onota 617 66 Stockbridge Stockbridge Bowl 372 48 Windsor Windsor Pond 48 53 Belchertown Lake Metacomet 74 18 Southwick Lake Congamond 465 40 Springfield Five Mile Pond 48 35 Ashland / Hopkinton Hopkinton Reservoir 176 53 Brookfield / Sturbridge Lake Quacumquasit 218 72 Hubbardston Asnacomet (Comet) Pond 127 (unknown) Douglas Wallum Lake 322 74 Lunenburg / Leominster Whalom Pond 99 (unknown) Sturbridge Big Alum Pond 195 45 Webster Webster Lake 1,270 45 Worcester Lake Quinsigamond 772 (unknown) Boston Jamaica Pond 68 53 Concord White's Pond, Walden Pond 61 107 Framingham/Natick Lake Cochituate 614 70 Sharon Massapoag Pond 353 45 Lynn Sluice Pond 50 63 Wenham Pleasant Pond 43 44 Woburn Horn Pond 102 40 KETTLE PONDS Barnstable Hamblin Pond 114 62 Brewster Cliff Pond, Sheep Pond, Flax Pond 48-204 63-88 Plymouth Little Pond, Long Pond 211 100 Mashpee / Falmouth Ashumet Pond 203 65 Mashpee / Sandwich Mashpee-Wakeby 729 87 Sandwich Peters Pond, Spectacle Pond 127 54
*http://www.mass.gov/dfwele/dfw/habitat/maps/ponds/pond_maps.htm.
39
ATTACHMENT 11
WARMWATER PONDS, LAKES, AND RIVERS VULNERABILITY EVALUATION
Vulnerability score 2 (both emissions scenarios) Confidence evaluation Medium Rationale Warm water habitat is the most widespread freshwater aquatic habitat in Massachusetts. It is characterized by communities of organisms that are tolerant of relatively high water temperatures – many of them introduced or invasive species. Many of the species that compose these communities extend geographically far to the south in the U.S. to the southeastern states of Georgia and Florida, Massachusetts being closer to their current northern geographical limit. Because these habitats are dependent on warmer water temperatures, it is not expected that their extents will be reduced in Massachusetts under climate change. In fact, they are likely to spread to occupy areas that are currently colder-water habitats. However, this potential for extension is limited by at least three factors: (1) Most of the waterbodies in the state are already warmwater habitat and the potential for further expansion is, therefore, limited. (2) The transition from coldwater to warmwater habitats is not likely to be a simple 1:1 conversion. Some mid-elevation, relatively low-flow rivers or streams that are currently coldwater habitat may not become entirely suitable for warmwater plant and animal communities due to the droughts and low summer flow conditions expected under climate change. They may, instead, become, at best, suboptimal habitats, sparsely or temporarily occupied by only the most thermally-tolerant species. (3) Warming may disrupt the aquatic ecosystems in ways that are viewed by humans as aesthetically undesirable (e.g., increased frequencies of algal blooms, more emergent vegetation, fish kills, further invasion by undesirable species). These factors could lead to management practices that could constrain the spread of warmwater organisms (e.g., more severe winter drawdown, the use of biocides). For these reasons, warmwater habitats were assigned a vulnerability score of 2 (habitat may expand moderately [<50%]) for both emissions scenarios, and a confidence score of Medium (reflecting the three areas of uncertainty that are listed above).

40
ATTACHMENT 12
CONNECTICUT AND MERRIMACK RIVER MAINSTEMS VULNERABILITY EVALUATION
Vulnerability score 5 or 6 (lower and higher emissions scenarios, respectively) Confidence evaluation Medium Rationale The mainstems of the Connecticut and Merrimack rivers are unique in Massachusetts in that they are large, their spring flows are dominated by snowmelt originating in the headwaters in the mountains of New Hampshire and Vermont, and they support significant anadromous fish populations (American shad, Blueback herring, Alewife, Sea lamprey, and Atlantic salmon). Projected changes in precipitation patterns due to global climate change (less snow, more winter rain) are likely to cause significant changes in the spring hydrograph in these habitats. It is estimated that the peak spring flows will occur several weeks earlier in the season and the onset of summer flows and temperatures will arrive earlier and persist several weeks longer in the fall (UCS, 2007). These changes could have significant effects on anadromous fish populations that have evolved to take advantage of the current hydrograph (for example, Atlantic salmon smolts “ride” the snowmelt spring freshet to the sea). The timing of their entry into seawater is limited by the physiologies of these fish. Significant changes in the rivers’ flow regimes may leave the species maladapted to the new thermal environment. These changes in flow and temperature may create similar hurdles for herring and shad. Because of these potential impacts, we have assigned vulnerability scores of 5 (extent of habitat likely to be reduced, but by less than 50%) and 6 (most of the habitat likely to be eliminated from the state) for the lower and higher emissions scenarios, respectively. However, projecting future precipitation patterns using General Circulation Models entails considerable uncertainty. Since there is considerable uncertainty about the timing and degree of precipitation and flow changes that might occur, as there is about the species’ abilities to adapt to the new flow regimes, these scores may underestimate the vulnerability of this habitat. For this reason we have categorized our level of confidence as only Medium. References UCS (Union of Concerned Scientists). 2007. Confronting Climate Change in the U.S. Northeast: Science, Impacts and Solutions. Report by the Union of Concerned Scientists. July 2007. Cambridge, Mass.
41
ATTACHMENT 13
SHRUB SWAMP VULNERABILITY EVALUATION
NTWHCS category: Laurentian-Acadian wet meadow shrub-swamp State ranking S5 Vulnerability score 4/5 or 2 (lower and higher emissions scenarios, respectively) Confidence evaluation Medium Rationale The term shrub swamp describes a wide variety of more or less different habitat types, from areas that are permanently dominated by hydrophitic shrubs, through temporary seral stages on the way to becoming forested swamps, to habitats created by beaver activity that may dry out and become upland forest once that activity stops and the beaver dams are breached. These habitat types are widespread throughout glaciated regions of lowland Massachusetts, typically associated with lakes and ponds, and along streams. They often form a perimeter shrub-dominated zone around open water or emergent swamp habitat (P. Swain, Massachusetts DFW, pers comm.). Underlying soils are waterlogged and usually flooded for at least part of the growing season but may also be without standing water. They are usually dominated by a patchwork of shrubs and graminoids including willow spp., Red-osier Dogwood, alder, meadowsweet, grasses, sedges, and rushes. Trees are generally absent or contribute less than 25% cover. The main risk posed by climate change to shrub swamp in Massachusetts is likely to be due to changes in hydrology (P. Swain, Massachusetts DFW, pers comm.). Recent modeling suggests that under at least the higher emissions scenarios precipitation levels in the northeast will increase by about 10% or more. Precipitation under the lower emissions scenario is less certain. Much of the increase will occur as rain in the winter months. While the modeling results are not entirely consistent, it is feasible that under both scenarios the summer months may be characterized by rising temperatures, greater evaporation and evapotranspiration rates, and little or no increase in precipitation. This could lead to seasonal drying out of wetland soils. Also, more protracted and severe droughts may become the norm under the higher emissions scenario (but much less so under the lower emissions scenario). Hayhoe et al. (2006) project that under the higher emissions scenario summer droughts of 1-3 months in duration may occur each year, rather than once every 2-3 years as at present, and that medium-term droughts (lasting 3-6 months) will become more frequent. The climatic changes described above could result in alterations in the extent of shrub swamp habitat. In some areas there could be a net loss of habitat. However, in others the effect could be that the shrub swamp will contract inward toward more saturated soils and areas where the water table is currently closer to the soil surface. If the shrub swamps surround open water habitat or emergent swamps they could move inward, replacing those habitats as the overall wetland dries. In such cases there may be relatively little shrub swamp habitat loss. Indeed, it is feasible that there could be a net habitat gain. For the above reasons we have assigned overall vulnerability scores of 4/5 (extent of habitat may not change appreciably or some moderate loss may occur), or 2 (extent of habitat may expand moderately) under the higher and lower emissions scenarios, respectively. We assign a confidence score of only Medium because of the uncertainty associated with projecting precipitation and drought effects: while it
42
is likely that the extent of this habitat type may not be greatly reduced – it may even be benefited, at the expense of other wetland types – local topography and hydrology will be of paramount importance and generalizing is problematic. Also, human actions could modify the likely outcomes under climate change: One of the effects associated with increasing human population density and sprawling settlement patterns could be a greater need for fresh water, and the concomitant depletion of aquifers and increased water diversions. Such anthropogenic stresses could result in lowered water tables and the drying out of existing swamp areas, with adverse impacts to this habitat type. References Hayhoe, K., C.P. Wake, T.G. Huntington, L. Luo, M.D. Schwartz, J. Sheffield, E. Wood, B. Anderson, J. Bradbury, A. DeGaetano, T.J. Troy, and D. Wolfe. 2006. Past and future changes in climate and hydrological indicators in the U.S. Northeast. Climate Dynamics DOI 10.1007/s00382-006-0187-8.

43
ATTACHMENT 14
SPRUCE-FIR BOREAL SWAMP VULNERABILITY EVALUATION
NTWHCS category: Northern Appalachian-Acadian conifer-hardwood acidic swamp Vulnerability score 6 and 7 (lower and higher emissions scenarios, respectively) Confidence evaluation High Rationale Spruce-fir boreal swamp is a cold-adapted forested swamp dominated in Massachusetts by Red Spruce and Balsam Fir, with Black Spruce and Red Maple also found frequent in the canopy. The shrub and herbaceous layers are often sparse, with the hummock-hollow ground layer dominated by hydrophytes such as sphagnum and Carex species (NHESP, 2001). The community type, which extends north to Ontario and south to northern Pennsylvania, is limited in Massachusetts to land above about 1,000 feet on the northern Worcester Plateau and the Berkshires (see Massachusetts NHESP map below, Figure 1). Spruce-fir boreal swamp in Massachusetts is close to the southern limit of this habitat type. In Massachusetts it often occurs as a headwater swamp in topographical basins that receive cold air flow. The nutrient-poor, low-pH, waterlogged peat soils in these basins are fed either by runoff from upslope or by springs. There is, however, only limited water movement within the basins, with limited outflow. The soils on which this community type occurs are usually saturated for the entire growing season and often have standing water after snowmelt in the spring.
Figure 1. Distribution of Spruce-fir boreal swamp in Massachusetts. Limited by temperature, precipitation, topography, and peat soils, spruce-fir boreal swamp is confined in general to higher elevations in the Northeast. In Massachusetts, it is generally found above about 1,000 feet. With an elevation-temperature lapse rate of 1.8oF for every 330 feet, it would require an increase in mean annual temperature of approximately 14oF to eliminate the climatic envelope in which this habitat exists in Massachusetts. The most recent and detailed modeling (Hayhoe et al., 2006) indicates that such a temperature increase would be reached only under the most extreme estimate of the higher emissions scenarios. If we more conservatively assume that the higher emissions scenario will result in a mean annual temperature increase of 6o-12oF, the temperature envelope of the community type will be elevated to between 2,100 and 3,200 feet above sea level. This could result in the extent of the community type in Massachusetts being at least markedly reduced, or eliminated entirely. Under the
44
lower emissions scenario, a mean temperature increase of 5o-8oF could cause this climate envelope to become elevated to between 2,000 and 2,500 feet above sea level. This would result in a large reduction in the extent of the thermal habitat required by this community type. Future climate change that could affect the condition of the peat soils on which this community type grows could also have impacts on its distribution and extent. If the precipitation and sheet flow entering the swamps is warmer, it could accelerate the decomposition processes in the peat and its eventual replacement by a less organic soil and invasion by the surrounding northern hardwoods. Also, if increased drought causes the peat soil to dry out, it could desiccate and erode, resulting in loss of this habitat type. Based on this analysis, we assign a vulnerability score of 7 (likely to be eliminated entirely) to this habitat type under the higher emissions scenario and 6 (greater than 50% loss) under the lower emissions scenarios. We assume a confidence score of High for the following reasons: this community type in Massachusetts is already at the edge of its southernmost distribution and is therefore likely to be highly vulnerable to climate change. If, as the climate models suggest, more frequent, severe, and extended droughts occur during the growing season, existing basin swamps may dry out during the summer, heightening the risk of destructive fire (spruce-fir swamp has a slow natural return rate of several hundred years). Also, tree damage due to an increased frequency of ice storms, windthrow, invasives, and pests may intensify. These could accelerate the rate of demise of this habitat type in the state. The balsam wooly adelgid is currently injuring large tracts of balsam fir in the southern parts of its range. The adelgid’s distribution is limited by low winter temperatures and it could become an additional indirect stressor in southern New England as warming continues. Thus, it is not implausible that this habitat could be eliminated entirely from the state.
References Hayhoe, K., C.P. Wake, T.G. Huntington, L. Luo, M.D. Schwartz, J. Sheffield, E. Wood, B. Anderson, J. Bradbury, A. DeGaetano, T.J. Troy, and D. Wolfe. 2006. Past and future changes in climate and hydrological indicators in the U.S. Northeast. Climate Dynamics DOI 10.1007/s00382-006-0187-8. Massachusetts Natural Heritage and Endangered Species Program (NHESP). 2001. Natural Community Fact Sheet: Spruce Fir Boreal Swamp. Massachusetts Division of Fisheries and Wildlife, Westborough, Mass.

45
ATTACHMENT 15
ATLANTIC WHITE CEDAR SWAMP VULNERABILITY EVALUATION NTWHCS category: Northern Atlantic coastal plain basin peat swamp State ranking S2 Vulnerability score 4 or 5 (lower and higher emissions scenarios, respectively) Confidence evaluation Medium Rationale Its range extending north to southern Maine and south to Florida, Massachusetts is at the northern edge of this southern community’s distribution. Four Atlantic white cedar community types have been recognized in Massachusetts by the NHESP (http://www.mass.gov/dfwele/dfw/nhesp/natural_communities/pdf/atlantic_white_cedar_swamp.pdf): Coastal Atlantic white cedar swamp, confined mainly to the southeastern part of the State and Cape Cod; Inland Atlantic white cedar swamp, mainly in the southern part of the Worcester Plateau; Northern Atlantic white cedar swamp, in the northern part of the Worcester Plateau; and Alluvial Atlantic white cedar swamp, mainly in the southeastern part of the State. The distribution of these cedar swamps is given in the map below (Figure 1, from Massachusetts NHESP). Each of these types differ somewhat in their floristics (though the canopies of all are dominated by Atlantic White Cedar) and in their topographical distributions (Coastal Atlantic white cedar swamps are confined to elevations below 40 feet above sea level while Northern Atlantic white cedar swamps occur up to 1,100 feet above sea level). In wetter areas of southeastern Massachusetts, Atlantic white cedar swamp may grade into a community where sparse and stunted Atlantic White Cedars occur in a floating bog habitat dominated by a dense growth of shrubs such as Leatherleaf, Highbush Blueberry and Sheep Laurel (NHESP, 1998; Laderman, 1989).
Figure 1. Distribution of Atlantic white cedar swamps in Massachusetts.

46
In Massachusetts, Atlantic white cedar swamp is highly fragmented in its distribution. It is confined to acidic peat soils (or thin peat soils overlying alluvial mineral soils) that are saturated for most of the year, and flooded for half or more of the year. The canopy is dominated by Atlantic White Cedar, though other tree species such as Red Maple may also occur (especially in areas that are not subject to burning or other disturbance). The shrub layer may be dominated by Highbush Blueberry, Sweet Pepperbush, and others. The ground cover is often a hummock-hollow growth of sphagnum mosses (NHESP, 1998). This community type benefits from regular disturbance, particularly fire (Laderman, 1989). In areas where fire does not occur often enough or is suppressed, the Atlantic white cedar dominance gives way to less fire-tolerant species such as Red Maple. Development of a mature Atlantic white cedar swamp requires a fire return rate of about 100-200 years, while the development of a community dominated by larger Atlantic White Cedars requires a return rate of 200-400 years. In areas where fire is suppressed and Red Maple achieves a high representation, it may alter the soil chemistry: Red Maples have deeper root systems than Atlantic White Cedar and are able to “pump up” nutrients from deeper mineral soils and reduce soil acidity, thereby rendering the area less suitable for Atlantic White Cedars (P. Swain, Massachusetts DFW, pers comm.). Given its need for saturated peat soils and standing water, and its apparent ability to exist in areas with markedly warmer temperature regimes than Massachusetts (e.g., Florida and the Gulf Coast), it is unlikely that increased temperatures per se will adversely affect the distribution of this habitat type in Massachusetts. Indeed, it is possible that rising temperatures could benefit it. It is more likely that the most important climatic factors that might affect the distribution of this habitat type in Massachusetts will be those that have adverse impacts on site hydrology. Recent modeling suggests that under higher emissions scenarios precipitation levels in the Northeast will increase by about 10%. Precipitation under the lower emissions scenario is less certain. Much of the increase will occur as rain in the winter months. While the modeling results are not entirely consistent, it is feasible that under both scenarios the summer months may be characterized by rising temperatures, greater evaporation and evapotranspiration rates, and little or no increase in precipitation. This could lead to seasonal drying out of wetland soils. Also, more protracted and severe droughts may become the norm under the higher emissions scenario (but much less so under the lower emissions scenario). Hayhoe et al. (2006) project that under the higher emissions scenario summer droughts of 1-3 months in duration may occur each year, rather than once every 2-3 years as at present, and that medium-term droughts (lasting 3-6 months) will become more frequent. Assuming the higher emissions scenario with its projected increased frequency and severity of droughts, we assign a vulnerability score of 5 (extent of habitat likely to be reduced, but by less than 50%) to this habitat type. We do not assign a higher score because we consider it likely that most current Atlantic white cedar habitat will respond to climate change (even under the higher emissions scenario) by contracting inward to areas in the centers of swamps with currently higher water tables, rather than by being eliminated entirely. While it is possible that some swamps in more marginal hydrologic circumstances will be eliminated entirely, these are likely to be in the minority, and more stable, larger bogs are likely to survive, although reduced in extent. For the lower emissions scenario we assign a score of 4 (likely to be no appreciable change in habitat extent). Our assigned confidence scores for both scenarios are only Medium. Predicting the fate of this habitat under climate change is beset with uncertainties for three reasons: (1) Our ability to confidently project changes in precipitation and soil moisture regimes using general circulation models is far less certain than predicting temperature change. (2) Atlantic white cedar swamp is a disturbance- (particularly fire-

47
)adapted community, and it is possible that its future status and distribution may be a result of human responses to climate change, rather than to temperature or precipitation change. If humans respond to an increased duration and severity of drought by increasing fire suppression efforts (to protect adjacent property), the vulnerability scores assigned to this habitat type may under-represent the risk of habitat loss. (One management strategy under climate change might be to ensure that suitable fire regimes are maintained.) (3) Human actions (apart from fire suppression) could modify the likely outcomes under climate change: One of the effects associated with increasing human population density and sprawling settlement patterns could be a greater need for fresh water, and the concomitant depletion of aquifers and increased water diversions. Such anthropogenic stresses could result in the drying out of existing swamp areas and adverse impacts to this habitat type. References Hayhoe, K., C.P. Wake, T.G. Huntington, L. Luo, M.D. Schwartz, J. Sheffield, E. Wood, B. Anderson, J. Bradbury, A. DeGaetano, T.J. Troy, and D. Wolfe. 2006. Past and future changes in climate and hydrological indicators in the U.S. Northeast. Climate Dynamics DOI 10.1007/s00382-006-0187-8. Massachusetts Natural Heritage and Endangered Species Program (NHESP). 1998. Natural Community Fact Sheet: Atlantic White Cedar Swamps. Massachusetts Division of Fisheries and Wildlife, Westborough, Mass.
48
ATTACHMENT 16
HARDWOOD SWAMP VULNERABILITY EVALUATION
NTWHCS category: North-central Appalachian acidic swamp State rank S3 (red maple swamp) Vulnerability score 4 and 5 (lower and higher emission scenarios, respectively) Confidence evaluation Medium Rationale This community type occurs from northern New England south to Virginia and west to Wisconsin. Thus, Massachusetts is close to the northern limit of its distribution. In Massachusetts it is widespread, and the most common forested swamp community. It generally occur at elevations below 2,000 feet in depressions that are fed by sheet runoff, or springs where the soils are waterlogged for much of the year and where standing water may occur during the growing season. It also occurs on areas that once were lakes, ponds, or beaver swamps but that are infilling and progressing to upland vegetation (P. Swain, Massachusetts DFW, pers comm.). In more acidic and nutrient-poor areas, the canopy is dominated by red maple and hemlock . In more nutrient-rich areas the canopy is dominated by red maple and black ash. The shrub layer may be dominated by highbush blueberry, winterberry, holly, and spicebush. Herbaceous and ground cover include hydrophitic ferns (especially Cinnamon Fern), graminoids, and mosses. Since close variants of this habitat extend as far south as Virginia, where summer and winter average temperatures are 7o-11oF warmer than in Massachusetts, it is not likely that it will be directly adversely affected by rising temperatures (even under the higher emissions scenario). It is more likely that the most important climatic factors that might affect the distribution of this habitat type will be those that have adverse impacts on site hydrology and fire frequency (red maple is not tolerant of burning). Recent modeling suggests that under higher emissions scenarios precipitation levels in the northeast will increase by about 10%. Precipitation under the lower emissions scenario is less certain. Much of the increase will occur as rain in the winter months. While the modeling results are not entirely consistent, it is feasible that under both scenarios the summer months may be characterized by rising temperatures, greater evaporation and evapotranspiration rates, and little or no increase in precipitation. This could lead to seasonal drying out of wetland soils. Also, more protracted and severe droughts may become the norm under the higher emissions scenario (but much less so under the lower emissions scenario). Hayhoe et al. (2006) project that under the higher emissions scenario summer droughts of 1-3 months in duration may occur each year, rather than once every 2-3 years as at present, and that medium-term droughts (lasting 3-6 months) will become more frequent. Such an increased frequency and severity of droughts could have adverse impacts on this habitat type, at least at lower elevations, as the soils dry out and the water table is lowered. This could result in the swamp habitat becoming more vulnerable to invasion by vegetation more typical of drier habitats. Also, as in other forested habitats in Massachusetts, the rising temperatures could be accompanied by an increased risk of fire and insect attack. Such effects are likely to be less severe at higher elevations, where precipitation may still be adequate to maintain the swamp community. Assuming the higher emissions scenario with its projected increased frequency and severity of droughts, we assign a

49
vulnerability score of 5 (extent of habitat likely to be reduced but by less than 50%) to this habitat type at lower elevations where the drought effects may be most marked, and 4 (likely to be no appreciable change) at higher elevations. For the lower emissions scenario we also assign scores of 5 and 4 for higher and lower elevation zones, respectively. The confidence scores for both scenarios are only Medium. Predicting the fate of this habitat under climate change is beset with uncertainties for three major reasons: (1) Our ability to confidently project changes in precipitation and soil moisture regimes using general circulation models is far less certain than predicting temperature change. (2) Indirect effects of climate change may play prominent roles in the fate of this community type: Increased frequency and intensity of wildfires under increasing temperatures and drought; vulnerability to blowdown during increasingly frequent and severe windstorms (to which this shallow-rooted community is vulnerable); enhanced survival and outbreaks of insect pests; and facilitation of colonization by invasive plants could all have adverse impacts on the extent and distribution of this habitat type. (3) Human actions could modify the likely outcomes under climate change: One of the effects associated with increasing human population density and sprawling settlement patterns could be a greater need for fresh water, and the concomitant depletion of aquifers and increased water diversions. Such anthropogenic stresses could result in the drying out of existing swamp areas and adverse impacts to this habitat type. References Hayhoe, K., C.P. Wake, T.G. Huntington, L. Luo, M.D. Schwartz, J. Sheffield, E. Wood, B. Anderson, J. Bradbury, A. DeGaetano, T.J. Troy, and D. Wolfe. 2006. Past and future changes in climate and hydrological indicators in the U.S. Northeast. Climate Dynamics DOI 10.1007/s00382-006-0187-8.
50
ATTACHMENT 17
EMERGENT MARSHES AND WET MEADOWS VULNERABILITY EVALUATION
NTWHCS category: Laurentian-Acadian freshwater marsh Vulnerability score 5 and 6 (lower and higher emissions scenarios) Confidence evaluation High Rationale Found throughout the northeast, extending from Ontario and Quebec south to New Jersey and west to Wisconsin and Minnesota, emergent freshwater marshes and meadows are associated with slow-moving rivers and streams, shallow lake and pond margins, and artificial impoundments. The shoreline vegetation may be dominated by a number of hydrophitic species, including cattails, rushes, sedges, grasses, bur-reeds, and others. The vegetation of this community varies widely depending on the inundation regime, with cattail flourishing in permanently inundated areas, giving way to sedges and grasses in areas where the soils may be permanently waterlogged but with only temporary standing water. Shallow open water areas support aquatic species, such as water lilies and Pickerelweed. Invasive species, primarily Purple Loosestrife, Chinese Water Chestnut, and phragmites, have colonized many of Massachusetts’ emergent marshes and now form monocultures that are serious threats to the biodiversity of native plant and wildlife species. The main risk posed by climate change to emergent marsh communities in Massachusetts is likely to be due to changes in hydrology. Recent modeling suggests that under both the lower and higher emissions scenarios precipitation levels in the northeast will increase by about 10%. Much of this increase will occur as rain in the winter months. While the modeling results are not entirely consistent, it is feasible that the summer months may be characterized by rising temperatures, greater evapotranspiration rates, and little or no increase in precipitation. This could lead to seasonal drying out of wetland soils. Also, more protracted and severe droughts may become the norm under the higher emissions scenario (but much less so under the lower emissions scenario). Hayhoe et al. (2006) project that under the higher emissions scenario summer droughts of 1-3 months in duration may occur each year, rather than once every 2-3 years as at present, and that medium-term droughts (lasting 3-6 months) will become more frequent. These changes will likely result in loss of wetland habitat as the upper areas of marshes dry out during the summer months and the vegetation is eventually replaced by mesophyitic or xeric upland species. The effect of this could be that the marshes will contract inward toward currently deeper or more reliable water sources. Smaller, less well-watered marshes could be entirely replaced by upland vegetation, while larger marshes could become fragmented and reduced in area. Further spread by invasive plant species is likely to be another likely climate-change-mediated effect on emergent marshes. The two invasive species that are currently having the greatest adverse effects on Massachusetts freshwater marshes, Purple Loosestrife and phragmites, are highly tolerant of seasonal soil drying and drought – more so than most native species that have more restrictive hydrological requirements. Seasonal drying out of marsh soils and drought is likely to increase the competitive advantage of these species over native vegetation and result in yet further loss of native habitat.
51
For the above reasons, we have assigned vulnerability scores of 6 (most of the habitat likely to be eliminated from the state) under the higher emissions scenario, and 5 (extent of habitat likely to be reduced, but by less than 50%) under the lower emissions scenario, with a confidence score of High. References Hayhoe, K., C.P. Wake, T.G. Huntington, L. Luo, M.D. Schwartz, J. Sheffield, E. Wood, B. Anderson, J. Bradbury, A. DeGaetano, T.J. Troy, and D. Wolfe. 2006. Past and future changes in climate and hydrological indicators in the U.S. Northeast. Climate Dynamics DOI 10.1007/s00382-006-0187-8.

52
ATTACHMENT 18
VERNAL POOLS VULNERABILITY EVALUATION
Vulnerability score 4 and 5 (lower and higher emissions scenarios, respectively) Confidence evaluation Low Rationale Vernal pools are typically ephemerally flooded depressions in forested landscapes. They flood during autumn and winter rains and after snowfall melt, and remain flooded until early to mid summer when they dry out due to elevated evaporation and evapotranspiration rates. During the period that they are flooded they provide breeding sites for invertebrates and amphibians found only in vernal pools (vernal pool “obligates”), including fairy shrimps, mole salamanders, and anuran amphibians. Vernal pools are widespread throughout Massachusetts. As of January 2007, a total of 4,350 pools had been located and certified under the Massachusetts Wetlands Protection Act. Even this high total underestimates the true abundance of vernal pools in the State: An analysis of aerial imagery by the Massachusetts NHESP has revealed that there could be as many as 29,000 potential vernal pools, though it is not known how many of these actually support vernal pool obligate species (http://www.mass.gov/dfwele/dfw/nhesp_temp/vernal_pools/vernal_pool_data.htm.). The ranges of at least five of the six Massachusetts vernal pool obligate vertebrates (Spotted, Marbled, and Jefferson salamanders; Wood Frog; and Spadefoot Toad) extend well south of the Commonwealth to the warmer mid-Atlantic states and the Gulf of Mexico. It is unlikely that increasing temperatures will result in direct adverse physiological effects to these species. Blue-spotted Salamander, however, is a northern species that reaches its southernmost limit in the state. It is conceivable that this species (status: rare) is limited at least partly by ambient temperature and could be physiologically affected by increased ambient temperature. Nevertheless, for most vernal pool species it is most likely that the consequences of a changing climate will be the results of hydrologic disruptions rather than increased temperatures per se. The hydrology of vernal pools in Massachusetts is controlled by seasonal precipitation and evapotranspiration. In dry autumns the pools flood later, and in dry, warm springs they dry out earlier in the year. The point in the summer at which precipitation is exceeded by evapotranspiration is the time when the pools begin to dry out (Brooks, 2004). In Massachusetts, weekly rainfall and evapotranspiration rates explain some 40%-70% of the variability in water level change (Brooks, 2004). If the climatic regime were to become drier and warmer in spring and early summer, the earlier onset of high evapotranspiration rates might exceed the precipitation rates (current climate models indicate that summer precipitation may not alter much under a changing climate) and the pools might dry out earlier. In one analysis, Brooks (2004) estimated that, under two general circulation models, Massachusetts vernal pools would dry out three weeks earlier in the year by 2100. One vernal pool obligate, the Marbled Salamander, builds nests in the dry pool bottoms in the fall and broods the eggs until the pools become flooded. If this autumnal flooding was delayed by warmer fall temperatures and higher evapotranspiration, it could have adverse impacts on the breeding biology and productivity of this species (unless it was able to adapt by delaying its reproductive season).
53
In dry, warm springs, in which the pools dry out earlier in the summer, amphibian breeding seasons are truncated and there is low productivity, with many pools failing entirely (Brooks, 2004). Thus, the earlier drying out projected under climate change, particularly under the higher emissions scenario (Hayhoe et al. 2006), could have adverse consequences for vernal pools, particularly smaller pools, those at lower elevations, or those in areas of lower rainfall. Accordingly, we have assigned scores of 4 (likely to be no appreciable change) and 5 (extent of habitat likely to be reduced but by less than 50%) for the lower and higher emissions scenarios, respectively. Our lower emissions score of 4 is based on our assumption that the shading provided by the forest matrix surrounding the pools may obviate, to some extent, the higher temperatures. This would be less of a modifying factor under the higher emissions scenario. We assign a confidence score of only Low to our vulnerability estimates for several reasons: (1) The hydrology of the pools will largely determine their future suitability for obligate species, and a high degree of uncertainty surrounds predicting how the scenarios will affect this. Because the future climatic conditions may include more frequent, prolonged, and severe droughts, it is possible that the assigned scores underestimate hydrologic impacts and, consequently, the vulnerability of this habitat type. (2) If smaller pools are eliminated by warming, the “nearest neighbor distance” between pools will increase, thereby reducing the quality of upland habitat that once was adjacent to one or more pools. Brooks (2004) showed that, in the Quabbin watershed, eliminating the smallest pools (<0.025ha) would increase the mean nearest neighbor distance (NND) between pools from 293m to 701m, and that eliminating pools less than 0.2 ha would increase the NND to 2,431m. (3) Vernal pool obligate species spend at least 10 months of the year out of the pools in the surrounding forest matrix. Climate-induced events in this habitat might have consequences that are as severe or more severe that the effects on pool hydrology. Since so little is known about the ecology of vernal pool obligates during their upland life phases, it is difficult to predict how forest changes, such as soil drying, might affect them. (4) Increasing air and water temperatures could have direct effects on amphibian physiology. As yet, little is known about the relationships between water temperature and amphibian reproduction and survival.
References Brooks, R. T. 2004. Weather-related effects on woodland vernal pool hydrology and hydroperiod. Wetlands 24:104-114.
54
ATTACHMENT 19
INTERTIDAL HABITATS VULNERABILITY EVALUATION NTWHCS category: Acadian coastal saltmarsh; North Atlantic coastal plain brackish tidal marsh Vulnerability score 6 (brackish marsh and tidal flats) for both emissions scenarios
1 (saltmarsh) for both emissions scenarios Confidence evaluation High Rationale An upgradient transect from extreme low tide level to extreme high tide level in sheltered rivermouths and coastal bays in Massachusetts would reveal a highly zoned succession of vegetation communities, each of which is adapted to specific salinity and inundation conditions. Permanently inundated estuarine open water lies below the extreme low water mark. Upgradient of that, at lower elevations above the extreme low water mark, is either ocean beach (in more dynamic, high-energy areas) or tidal mudflats or sandflats (in calmer, depositional areas). Extending above the sandflats or mudflats to the approximate mean high tide level is saltmarsh, with brackish marsh occurring higher still in less frequently inundated areas. Above the highest brackish marsh and the influence of saltwater intrusion is non-tidal freshwater marsh or dry land. The spatial distribution of the estuarine open water, tidal flats, ocean beach, saltmarsh, and brackish marsh habitats is a function of inundation frequency and duration, and the dominant plants that occur in each of these habitats exhibit varying tolerances to salinity. Tidal mudflats and sandflats may be colonized by the halophytic Glasswort (Salicornia spp.), but are typically only sparsely vegetated. Moving further upgradient, saltmarshes in Massachusetts are complexes of sub-communities dominated by different grass species. Twice-daily flooded areas (“lowmarsh”) are dominated by the salinity-tolerant Saltmarsh Cordgrass (Spartina alterniflora). At higher levels, where inundation is less frequent or of shorter duration, a “highmarsh” community is dominated by Saltmeadow Cordgrass (Spartina patens). Brackish marsh, which lies between the highest saltmarsh and freshwater marsh or dry land, is only infrequently inundated or is influenced by freshwater flow and supports less salt-tolerant species such as Cattail (Typha angustifolia), Phragmites (Phragmites australis), Freshwater Cordgrass (Spartina pectinata), or upland grasses. Tidal flat, saltmarsh, and brackish marsh communities are highly productive and support important animal populations. During their twice-daily inundations, Massachusetts sandflats and mudflats are feeding areas for fish and piscivorous bird species, including terns, skimmers and waterfowl. When exposed by the falling tide, these communities provide foraging habitat for internationally-important populations of shorebirds. Channels and ponds in Massachusetts saltmarshes provide spawning habitat for anadromous fish such as Rainbow Smelt (Osmerus mordax), while the grasslands of saltmarshes and brackish marshes are habitat for restricted-distribution bird species, including Saltmarsh Sharp-tailed and Seaside sparrows (Ammodramus caudacutus and Ammodramus maritimus, respectively), which occur only in these tidally-influenced habitat types. They also provide the main habitat for waterfowl such as Black Duck and American Wigeon (Anas rubripes and Americana, respectively), and are hunted over by avian predators, including Northern Harriers (Circus cyaneus), and, in winter, Snowy Owls (Bubo scandiacus).
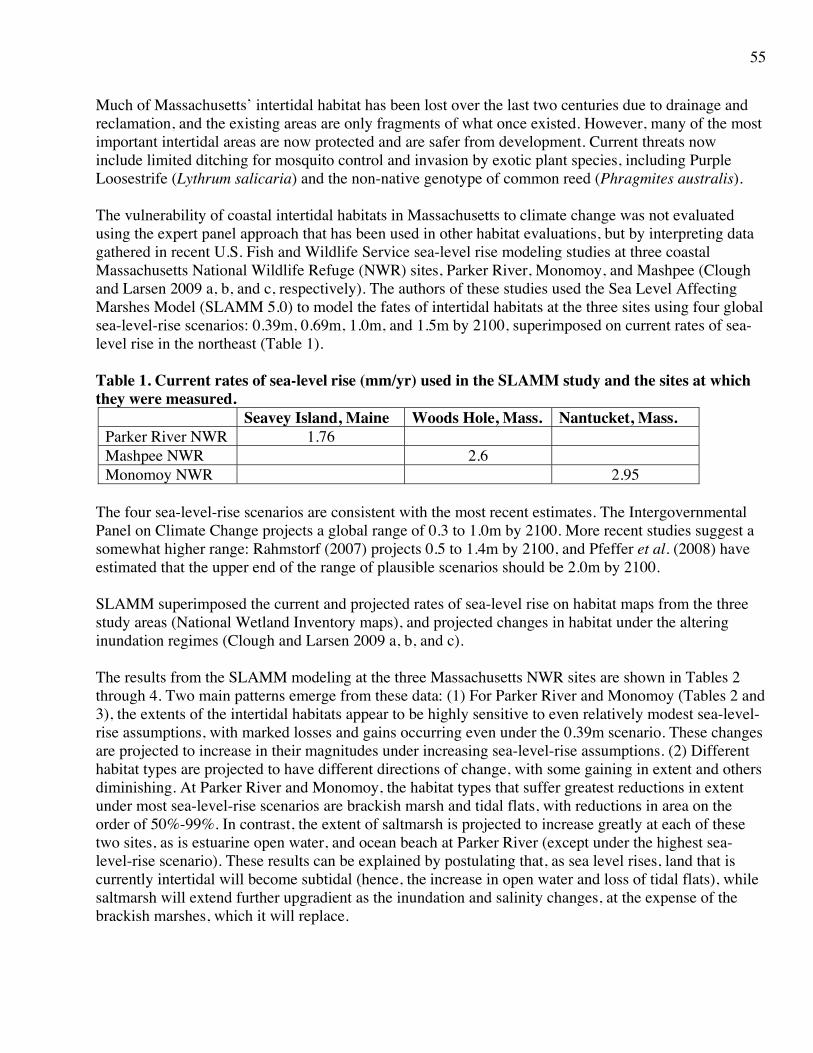
55
Much of Massachusetts’ intertidal habitat has been lost over the last two centuries due to drainage and reclamation, and the existing areas are only fragments of what once existed. However, many of the most important intertidal areas are now protected and are safer from development. Current threats now include limited ditching for mosquito control and invasion by exotic plant species, including Purple Loosestrife (Lythrum salicaria) and the non-native genotype of common reed (Phragmites australis). The vulnerability of coastal intertidal habitats in Massachusetts to climate change was not evaluated using the expert panel approach that has been used in other habitat evaluations, but by interpreting data gathered in recent U.S. Fish and Wildlife Service sea-level rise modeling studies at three coastal Massachusetts National Wildlife Refuge (NWR) sites, Parker River, Monomoy, and Mashpee (Clough and Larsen 2009 a, b, and c, respectively). The authors of these studies used the Sea Level Affecting Marshes Model (SLAMM 5.0) to model the fates of intertidal habitats at the three sites using four global sea-level-rise scenarios: 0.39m, 0.69m, 1.0m, and 1.5m by 2100, superimposed on current rates of sea-level rise in the northeast (Table 1). Table 1. Current rates of sea-level rise (mm/yr) used in the SLAMM study and the sites at which they were measured.
Seavey Island, Maine Woods Hole, Mass. Nantucket, Mass. Parker River NWR 1.76 Mashpee NWR 2.6 Monomoy NWR 2.95
The four sea-level-rise scenarios are consistent with the most recent estimates. The Intergovernmental Panel on Climate Change projects a global range of 0.3 to 1.0m by 2100. More recent studies suggest a somewhat higher range: Rahmstorf (2007) projects 0.5 to 1.4m by 2100, and Pfeffer et al. (2008) have estimated that the upper end of the range of plausible scenarios should be 2.0m by 2100. SLAMM superimposed the current and projected rates of sea-level rise on habitat maps from the three study areas (National Wetland Inventory maps), and projected changes in habitat under the altering inundation regimes (Clough and Larsen 2009 a, b, and c). The results from the SLAMM modeling at the three Massachusetts NWR sites are shown in Tables 2 through 4. Two main patterns emerge from these data: (1) For Parker River and Monomoy (Tables 2 and 3), the extents of the intertidal habitats appear to be highly sensitive to even relatively modest sea-level-rise assumptions, with marked losses and gains occurring even under the 0.39m scenario. These changes are projected to increase in their magnitudes under increasing sea-level-rise assumptions. (2) Different habitat types are projected to have different directions of change, with some gaining in extent and others diminishing. At Parker River and Monomoy, the habitat types that suffer greatest reductions in extent under most sea-level-rise scenarios are brackish marsh and tidal flats, with reductions in area on the order of 50%-99%. In contrast, the extent of saltmarsh is projected to increase greatly at each of these two sites, as is estuarine open water, and ocean beach at Parker River (except under the highest sea-level-rise scenario). These results can be explained by postulating that, as sea level rises, land that is currently intertidal will become subtidal (hence, the increase in open water and loss of tidal flats), while saltmarsh will extend further upgradient as the inundation and salinity changes, at the expense of the brackish marshes, which it will replace.
56
Table 2. Current and projected acres and percent losses or gains in intertidal habitats at Parker River NWR, under four SLR scenarios, by 2100.
Current Acres 0.39m 0.69m 1.0m 1.5m Brackish marsh
2,306 1,955 (-15) 1,114 (-52) 458 (-80) 3.9 (-99)
Saltmarsh 150 423 (+182) 1,206 (+704) 1,715 (+1,043)
818 (+445)
Tidal flat 803 327 (-59) 303 (-62) 382 (-52) 1,605 (+99) Estuarine open water
1,500 2,104 (+40) 2,218 (+48) 2,379 (+59) 2,579 (+72)
Ocean beach 226 264 (+17) 266 (+18) 261 (+15) 22.3 (-90) Table 3. Current and projected acres and percent losses or gains in intertidal habitats at Monomoy NWR, under four SLR scenarios, by 2100.
Current Acres 0.39m 0.69m 1.0m 1.5m Brackish marsh
94.3 25.0 (-73) 23.4 (-75) 30.1 (-68) 18.2 (-81)
Saltmarsh 0.0 12.7 77.0 123 94.7 Tidal flat 1,962 660 (-66) 184 (-90) 115 (-94) 149 (-92) Estuarine open water
6.9 945 (+13,608)
1,169 (+16,842) 1,095 (+15,769) 956 (+13,755)
Ocean beach 358 198 (-45) 158 (-56%) 44.5 (-87) 76.7 (-79) The patterns of projected change at Mashpee are similar, but less marked (Table 4): Estuarine open water is projected to increase in extent under all four sea-level rise scenarios (though less so than at Parker River and Monomoy), brackish marsh is almost completely eliminated, and saltmarsh gains in extent. However, tidal flats are projected to increase in extent, as is ocean beach. The differences between Mashpee, on one hand, and Parker River and Monomoy on the other, may be due to topography. The latter two sites are low-gradient, with extensive flat areas of habitat that are susceptible to showing marked change with only relatively small sea-level-rise changes. Mashpee, however, has a steeper cross-sectional profile with a lower representation of flat habitats. At such a site it requires greater sea-level rise to achieve the same magnitude of effects predicted at sites like Parker River and Monomoy. Table 4. Current and projected acres and percent losses or gains in intertidal habitats at Mashpee NWR, under four SLR scenarios, by 2100.
Current Acres 0.39m 0.69m 1.0m 1.5m Brackish marsh 161 113 (-30) 5.5 (-96) 1.7 (-99) 0.8 (-99) Saltmarsh 0.0 52.6 83.9 15.4 7.4 Tidal flat 0.0 3.9 70.6 99.5 10.6 Estuarine open water
161 167 (+4) 196 (+22) 258 (+60) 369 (+129)
Ocean beach 0.0 1.2 1.4 0.8 1.6 Regardless of the modeled differences among these sites, the results indicate that intertidal habitats in Massachusetts are highly sensitive to sea-level rise, even under relatively conservative estimates. A projected global rise of only 0.39m (the most optimistic of current estimates) is sufficient to result in
57
major projected habitat change at all three sites, particularly losses in brackish marsh and tidal flats and gains in saltmarsh. These changes generally become more marked as the sea-level-rise scenario is increased. Based on these projections, we assign a vulnerability score of 6 (extent of habitat likely to be reduced by more than 50%) to brackish marsh and tidal flat, and a score of 1 (habitat may expand greatly, by more than 50%) to saltmarsh. The patterns of change in ocean beach are more difficult to generalize. Mashpee shows a small projected increase, while Monomoy shows a marked loss and Parker River shows gains except under the highest sea-level-rise scenario. These differences are probably related to site-specific topographic factors such as gradient and exposure to open ocean storms. Because of these uncertainties we do not generalize a vulnerability score for this habitat type. We assign a confidence score of High to these vulnerability estimates because of the relative consistency in the magnitudes of projected change across sites. It should be noted, however, that local topography will affect the magnitudes of future patterns of change (as projected for Mashpee NWR), and these vulnerability scores should be treated with caution at higher-gradient sites. Also, at both Monomoy and Parker River, brackish marsh is unable to migrate further inland as the sea level rises (because Monomoy is a small island with limited space for expansion and because topography limits migration at Parker River). At sites where inland migration of brackish marsh is not so constrained, the habitat losses may be smaller. Finally, while the sea-level-rise scenarios used in the NWR SLAMM analyses represent our current “best estimates,” it is conceivable, depending on the extent of ice melt in the Arctic and Antarctic, that global sea-level rise could be higher, potentially much higher. Under such a scenario, patterns of loss and gain in coastal habitats could be radically different from our estimates. References Clough, J. and E. Larsen. 2009. Application of the Sea-Level Affecting Marshes Model (SLAMM 5.0) to Parker River, Monomoy, and Mashpee NWRs. Obtainable from: Dr. Brian Czech, Conservation Biologist, U. S. Fish and Wildlife Service National Wildlife Refuge System, Division of Natural Resources and Conservation Planning, Conservation Biology Program, 4401 N. Fairfax Drive - MS 670 Arlington, VA 22203.
Pfeffer, W.T., J.T. Harper, and S.O. O'Neel. 2008. Kinematic Constraints on Glacier Contributions to 21st-Century Sea-Level Rise. Science 321:1340-1343. Rahmstorf, S. 2007. A Semi-Empirical Approach to Projecting Future Sea-Level Rise. Science 315:368-370
58
ATTACHMENT 20
RIPARIAN FLOODPLAIN FOREST VULNERABILITY EVALUATION
NTWHCS category: Central Appalachian river floodplain forest State ranking S2 Vulnerability score 5 (both emissions scenarios) Confidence evaluation Low Rationale Riparian forests occur from northern New England south to New Jersey and west to Wisconsin and Missouri. Thus, Massachusetts is close to the northern limit of this community’s range. This habitat type occurs on generally flat, seasonally flooded riverbanks. Due to spring flooding, they receive annual depositions of fine silt eroded from further upriver. These two factors (spring inundation and silt deposition) are essential for the maintenance and regeneration of this habitat type. The Massachusetts DFW recognizes three main riparian forest community types in the state: Major-river floodplain forest occurs in high-scour and high-deposition areas along the Connecticut, Deerfield, Housatonic, Chicopee, Westfield, Merrimack, and Taunton rivers, while small-river floodplain forest occurs along low-scour and poorly drained areas of tributaries to the Connecticut and other rivers. Transitional floodplain forest is intermediate in terms of frequency and severity of scouring. All three riparian forest types are similar in that their canopies are typically dominated by Silver Maple, Cottonwood, River Birch, Green Ash, or American Elm. Major-river forests are often dominated by the first two species, while smaller-tributary sites are dominated by River Birch, ashes, and elms. After the spring floods have receded in May, they generally lack a shrub or herbaceous layer. Later in the growing season the herbaceous layer becomes dominated by ferns and nettles. Silver Maple does not regenerate well in areas that are densely vegetated. However, it casts its seeds in late spring as the floodwaters are receding and exposing the underlying bare silt. Given these circumstances, it germinates and grows quickly before it can be out-competed by other species. Thus, the flooding that keeps the herbaceous vegetation sparse is an important requirement for sapling germination and growth. Riparian forest that are denied regular flooding become senescent, dominated by aging maples and cottonwoods, and are eventually replaced by more mesic habitats. Climate change could potentially affect the status and distribution of the remaining riparian forests by altering the timing, frequency, and magnitude of floods. The highest flood levels in the Connecticut occur between March and May, fed by spring snowmelt and rains. Thus the floods and silt deposition occur as temperatures are beginning to rise and plant growing conditions improve. Under both the lower and higher emissions scenarios the timing and magnitudes of flood events could be drastically altered. Recent modeling results suggest that more of the projected winter precipitation will fall as rain and less as snow. This could cause a dramatic contraction in the area of the Connecticut River watershed that is consistently snow-covered (NECIA, 2006). Modeling results also suggest that high flows could occur over the winter months and peak flows at least 2 weeks earlier in the spring. The net result of this could be a flattening of the seasonal hydrograph, with a greater volume of water flowing down the Connecticut, but an earlier and less pronounced spring peak. The result of this could be a reduced frequency and/or severity of flooding of the floodplain. If this were the case, the ability of floodplain forest to persist might be jeopardized. For this reason, we assign a vulnerability score of 5 (likely to be
59
affected by climate change but probably less than 50% habitat loss) to riparian floodplain forest. However, the current stressors on this habitat type could potentially outweigh any potential impacts by climate change. In Massachusetts the main current stressors on this habitat type are agricultural and urban development, invasive species, and, most importantly, water storage and hydrologic alterations. In the past, extensive riparian areas bordering the Connecticut River were lost through the construction of flood-control dikes and the enclosed land converted to urban or agricultural use. This is not such a potent threat to the habitat as it was historically, since the “developable” land has been converted and much of the remaining high quality floodplain forest is on public land or on privately owned conservation land where future losses due to development are likely to be small. Water storage for municipal and agricultural use and for hydropower is the main factor determining the condition of floodplain ecosystems on the major rivers where the majority of floodplain persists. Over the last 200 years, the flows in these rivers have been managed by the construction of dams. On the Connecticut River these dams extend from the furthest upriver reaches on the Vermont/New Hampshire state lines, downstream to Connecticut and Rhode Island. In Massachusetts on the Connecticut River and its tributaries alone, there are currently 19 sites at which Federal Energy Regulatory Commission permits have been granted to manage flow. Thus, the timing and volume of flow on these major rivers is tightly controlled: Water is typically stored during the winter and spring flow peaks and then slowly released during the drier summer months. The result is a flattening of the natural hydrograph. Despite their highly managed state, the “ghost” of the natural hydrograph can still be seen as facilities release flow during the spring peaks. However, this could easily change in the future as the need for alternative energy sources becomes more pressing and/or water demand for municipal supplies or summer recreation increases. These could, potentially, have much more profound effects on riparian floodplain forest than climate change. The highly managed nature of the hydrologic system also, paradoxically, offers the opportunity to maintain natural systems, as water release patterns could be used to supply their needs. As yet, we have no clear idea how future water management might impact riparian habitats along Massachusetts’ rivers. To reflect this, we have assigned a confidence score of Low to our vulnerability score of 5 (extent of habitat likely to be reduced but by less than 50%). References NECIA (Northeast Climate Impacts Assessment). 2006. Climate Change in the U.S. Northeast. A report of the Northeast Climate Impacts Assessment. Union of Concerned Scientists. Cambridge, Mass.


![New Presentatie Cafs Ieper [Compatibiliteitsmodus] · 2014. 7. 28. · Compressed Air Foam samengeperste lucht (van 30% tot 70% lucht tov water) Let’s talk about your fire protection](https://img.pdfslide.us/doc/110x75/605901d18f900b2b7b6106b3/new-presentatie-cafs-ieper-compatibiliteitsmodus-2014-7-28-compressed-air.jpg)