Embed Size (px)
DESCRIPTION
2011 WAFSCM Annual Conference November 3, 2011 - Pewaukee. Climate Change and Flooding in Wisconsin. Ken Potter Department of Civil & Environmental Engineering University of Wisconsin Madison, WI. Outline. Global Circulation (Climate) Models (GCMs) - PowerPoint PPT Presentation
Citation preview
Climate Change and Flooding in Wisconsin
Ken PotterDepartment of Civil & Environmental Engineering
University of WisconsinMadison, WI
2011 WAFSCM Annual ConferenceNovember 3, 2011 - Pewaukee
Outline
• Global Circulation (Climate) Models (GCMs)
• WICCI findings based on statistical downscaling of GCMs
• New findings based on Regional Circulation (Climate) Models (RCMs)
• NOAA Atlas 14
• Storm transposition for vulnerability assessment
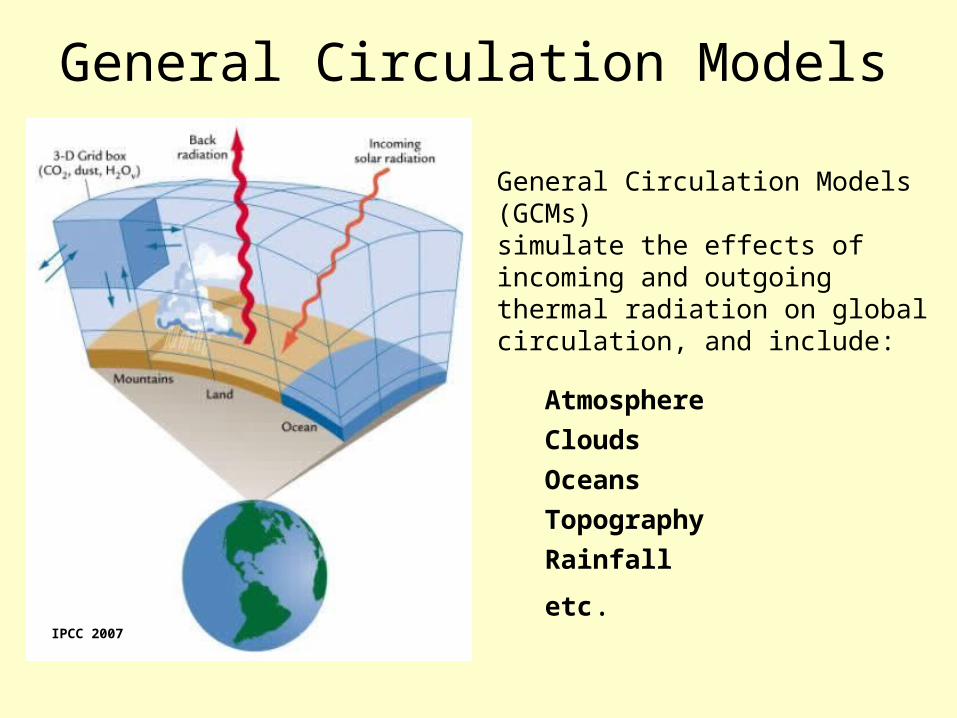
General Circulation Models
IPCC 2007
General Circulation Models (GCMs)simulate the effects of incoming and outgoing thermal radiation on global circulation, and include:
Atmosphere
Clouds
Oceans
Topography
Rainfall
etc.
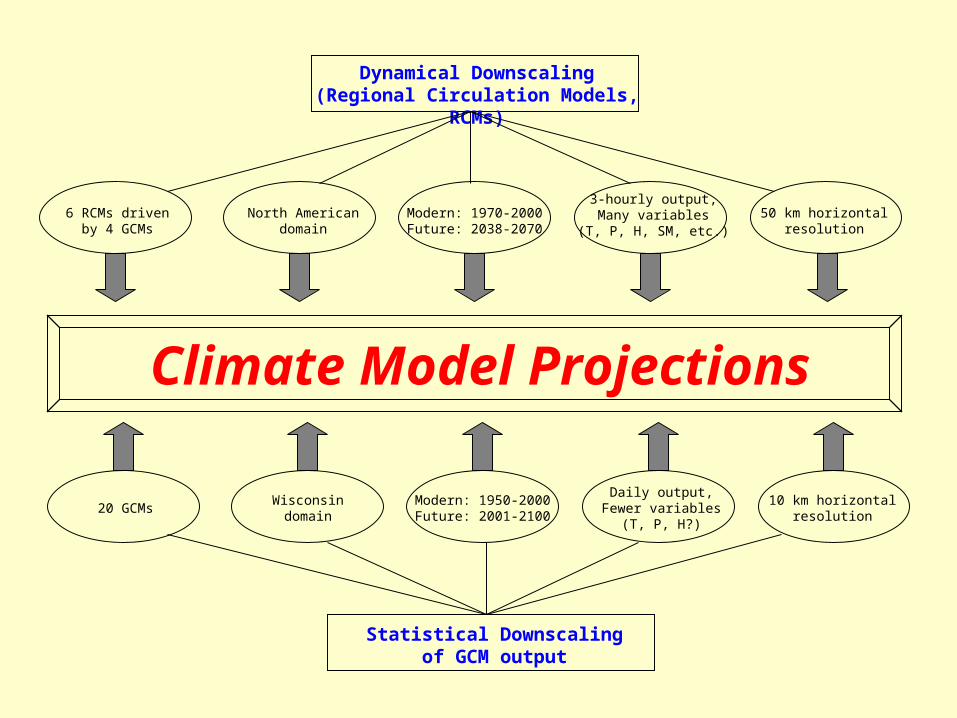
Dynamical Downscaling(Regional Circulation Models, RCMs)
Statistical Downscalingof GCM output
6 RCMs drivenby 4 GCMs
North Americandomain
Modern: 1970-2000Future: 2038-2070
3-hourly output,Many variables
(T, P, H, SM, etc.)50 km horizontal
resolution
20 GCMsWisconsin
domainModern: 1950-2000Future: 2001-2100
Daily output,Fewer variables
(T, P, H?)
10 km horizontalresolution
Climate Model Projections
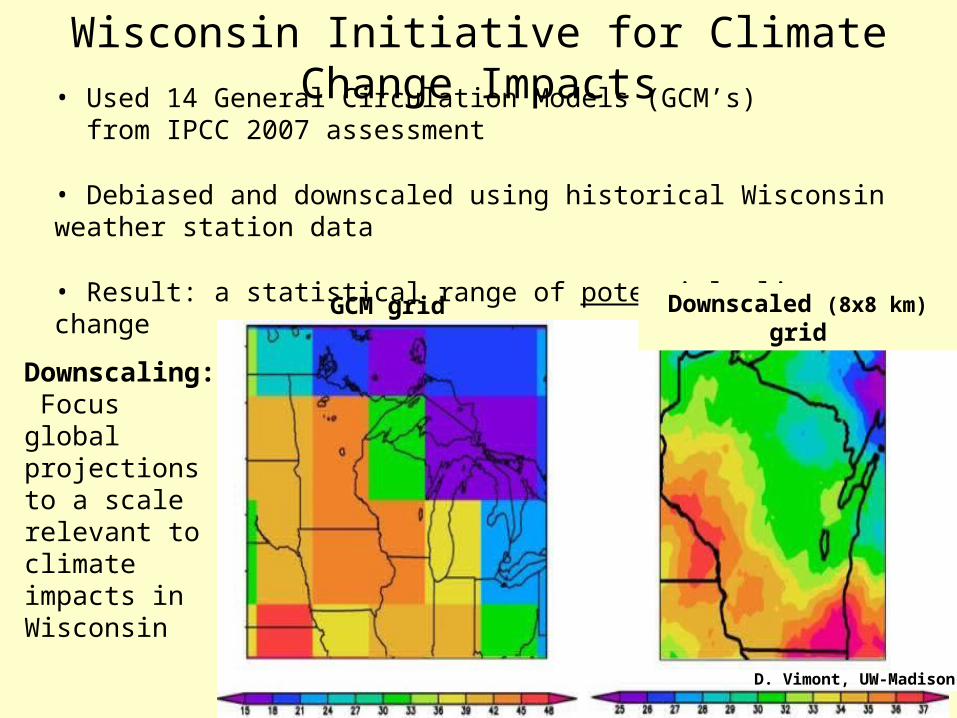
Downscaling: Focus global projections to a scale relevant to climate impacts in Wisconsin
Wisconsin Initiative for Climate Change Impacts• Used 14 General Circulation Models (GCM’s) from IPCC 2007 assessment
• Debiased and downscaled using historical Wisconsin weather station data
• Result: a statistical range of potential climate change
GCM grid Downscaled (8x8 km) grid
D. Vimont, UW-Madison
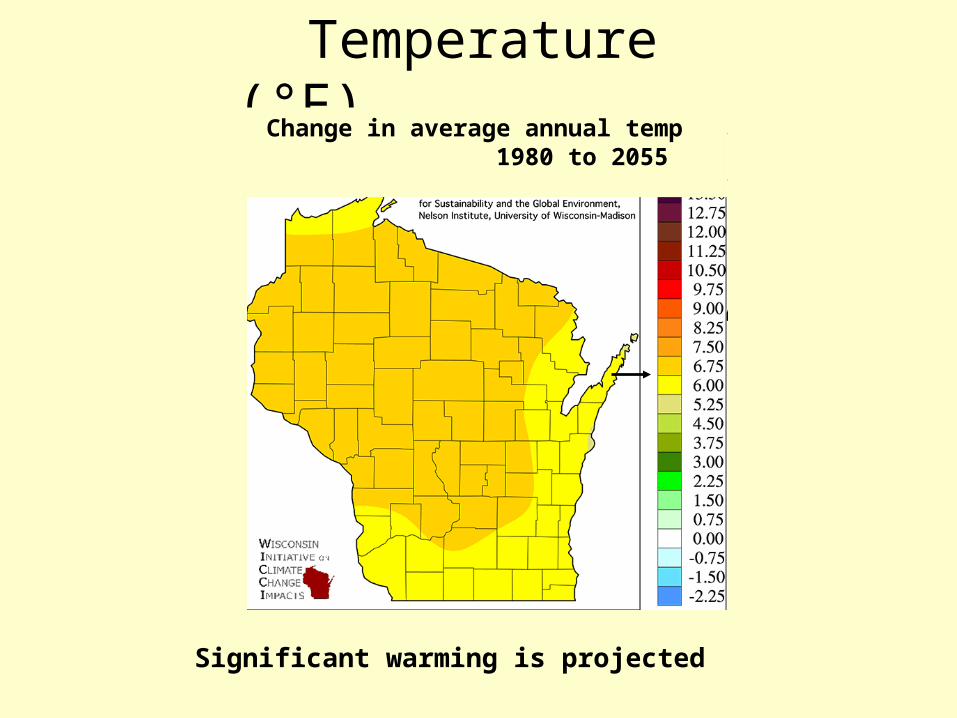
Temperature (°F)
Significant warming is projected
Change in average annual temp 1980 to 2055
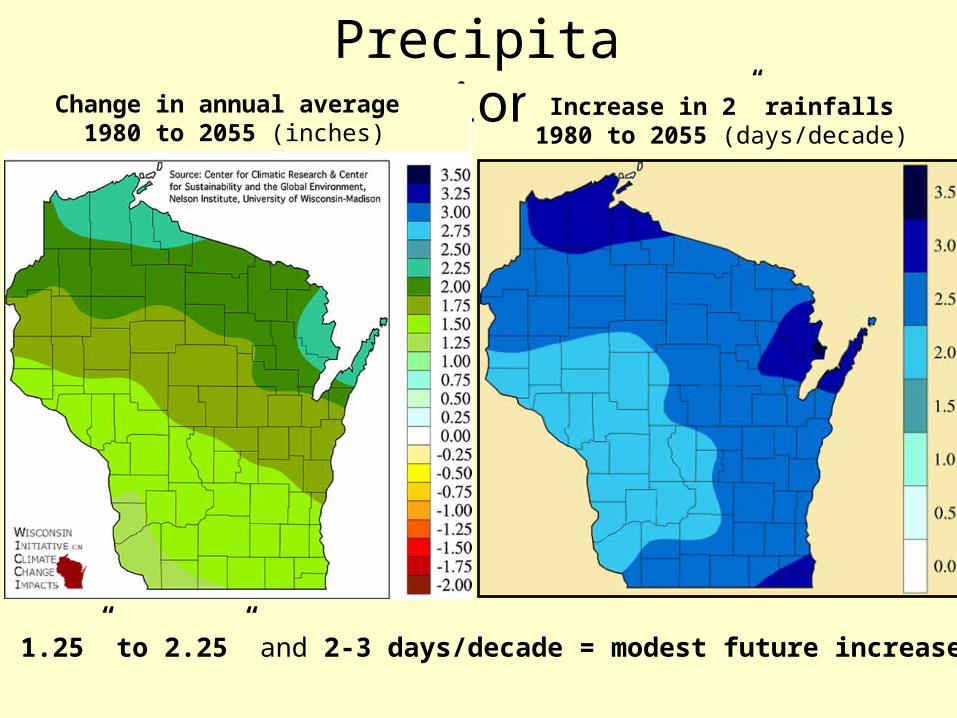
PrecipitationChange in annual average
1980 to 2055 (inches)
1.25” to 2.25” and 2-3 days/decade = modest future increase
Increase in 2” rainfalls 1980 to 2055 (days/decade)
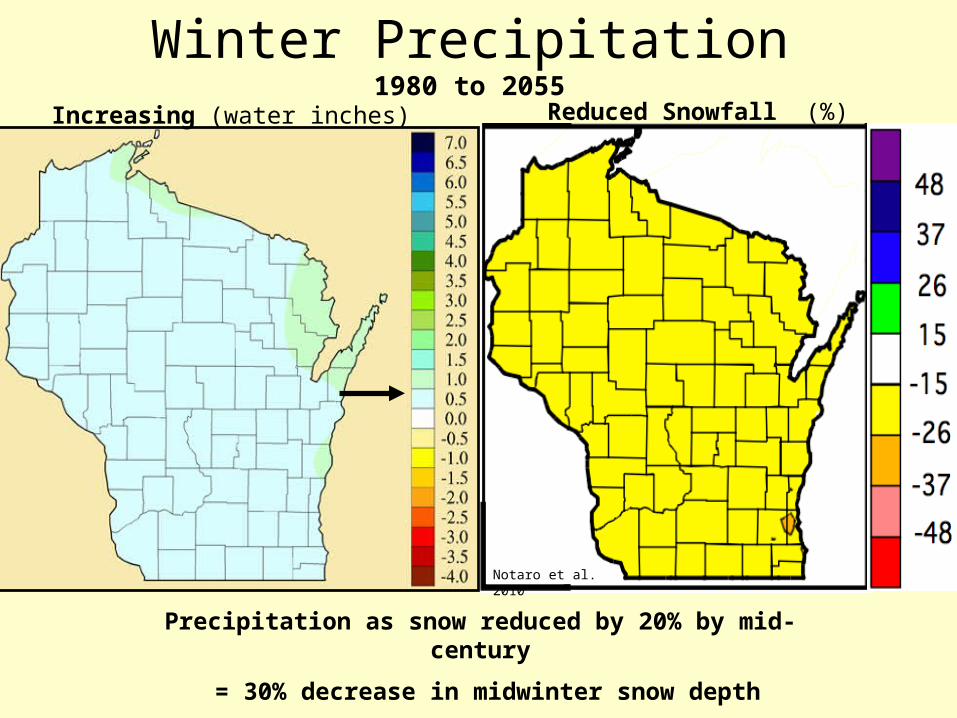
Winter Precipitation1980 to 2055
Precipitation as snow reduced by 20% by mid-century
= 30% decrease in midwinter snow depth
Notaro et al. 2010
Reduced Snowfall (%)Increasing (water inches)
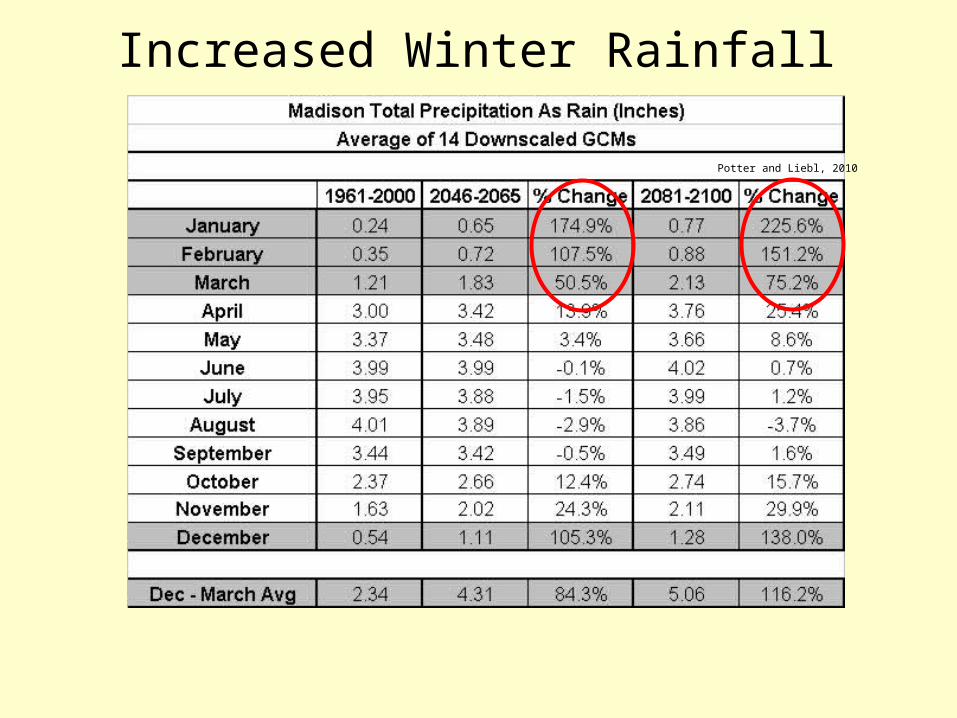
Increased Winter Rainfall
Potter and Liebl, 2010
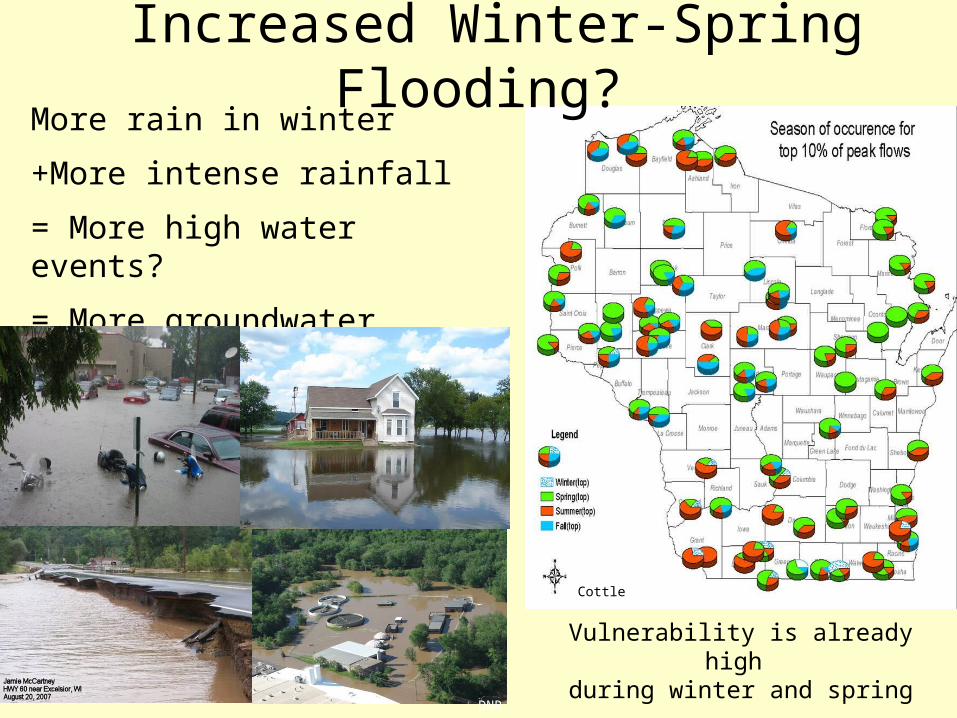
More rain in winter
+More intense rainfall
= More high water events?
= More groundwater recharge?
Gordy Stephenson
Cottle
Vulnerability is already high during winter and spring
DNR
Increased Winter-Spring Flooding?
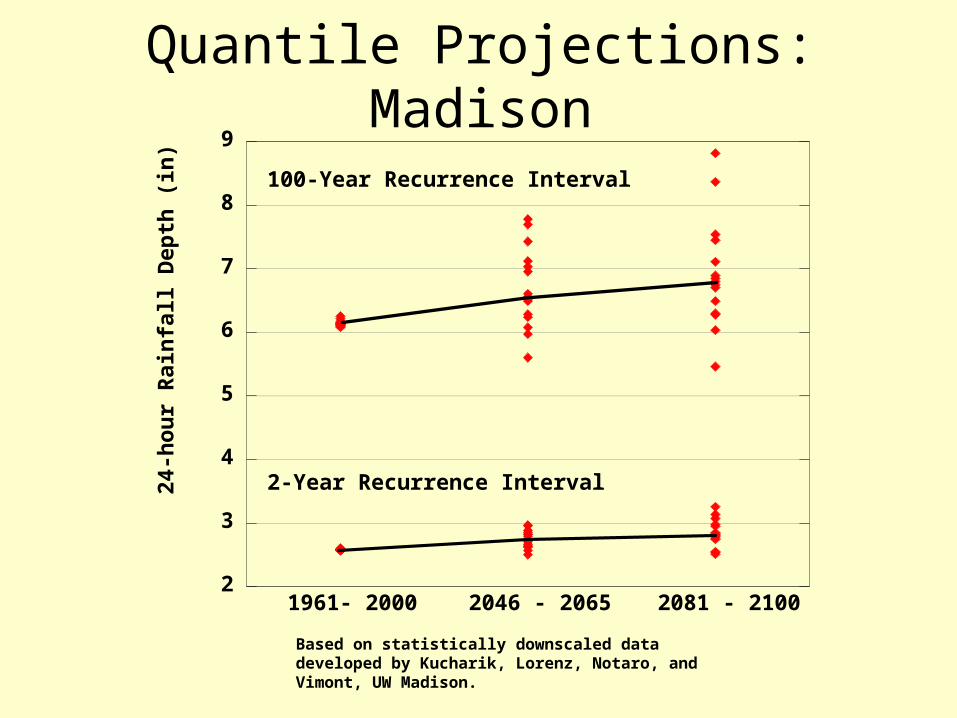
Based on statistically downscaled data developed by Kucharik, Lorenz, Notaro, and Vimont, UW Madison.
2
3
4
5
6
7
8
92
4-h
ou
r R
ain
fall
De
pth
(in
)
1961- 2000 2046 - 2065 2081 - 2100
2-Year Recurrence Interval
100-Year Recurrence Interval
Quantile Projections: Madison
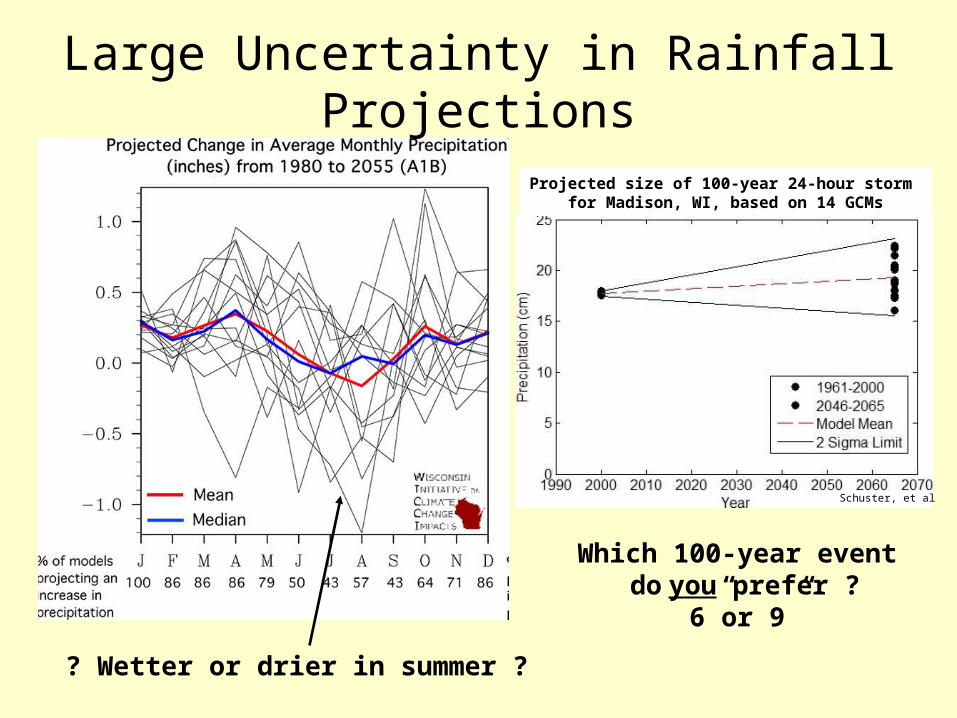
Large Uncertainty in Rainfall Projections
Which 100-year event do you prefer ?
6”or 9”
Projected size of 100-year 24-hour storm for Madison, WI, based on 14 GCMs
Schuster, et al
? Wetter or drier in summer ?
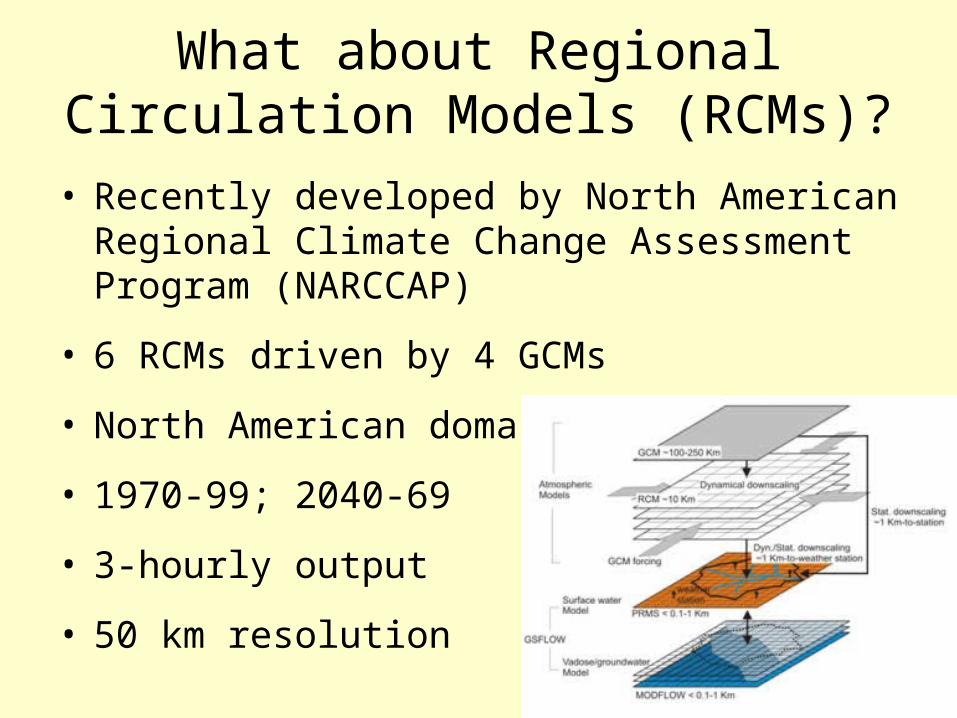
What about Regional Circulation Models (RCMs)?
• Recently developed by North American Regional Climate Change Assessment Program (NARCCAP)
• 6 RCMs driven by 4 GCMs
• North American domain
• 1970-99; 2040-69
• 3-hourly output
• 50 km resolution
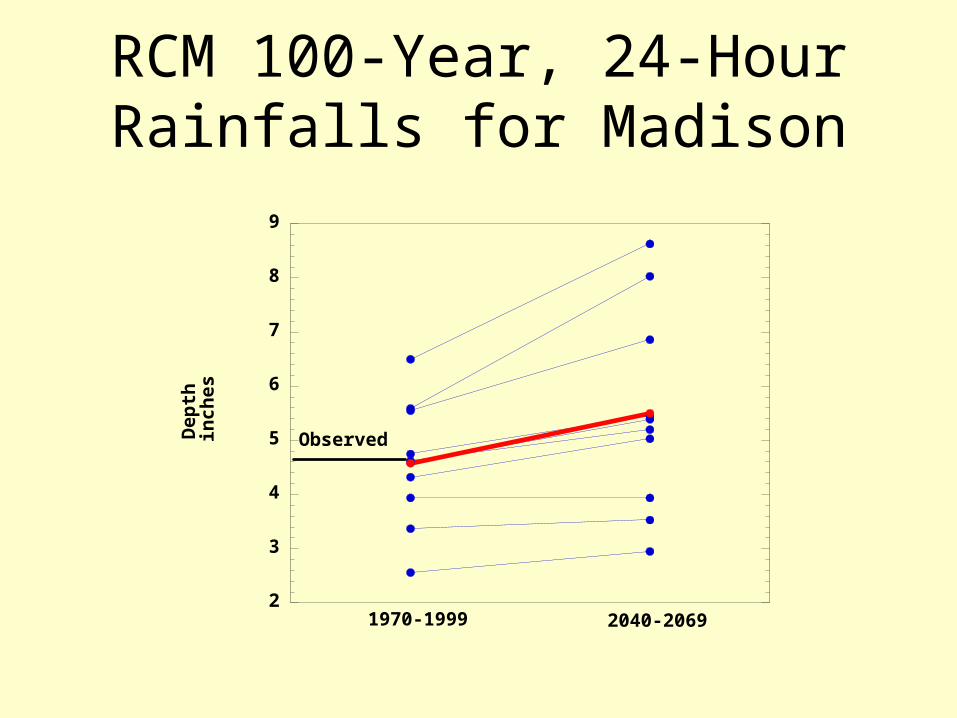
RCM 100-Year, 24-Hour Rainfalls for Madison
2
3
4
5
6
7
8
9
De
pth
inc
he
s
Observed
1970-1999 2040-2069
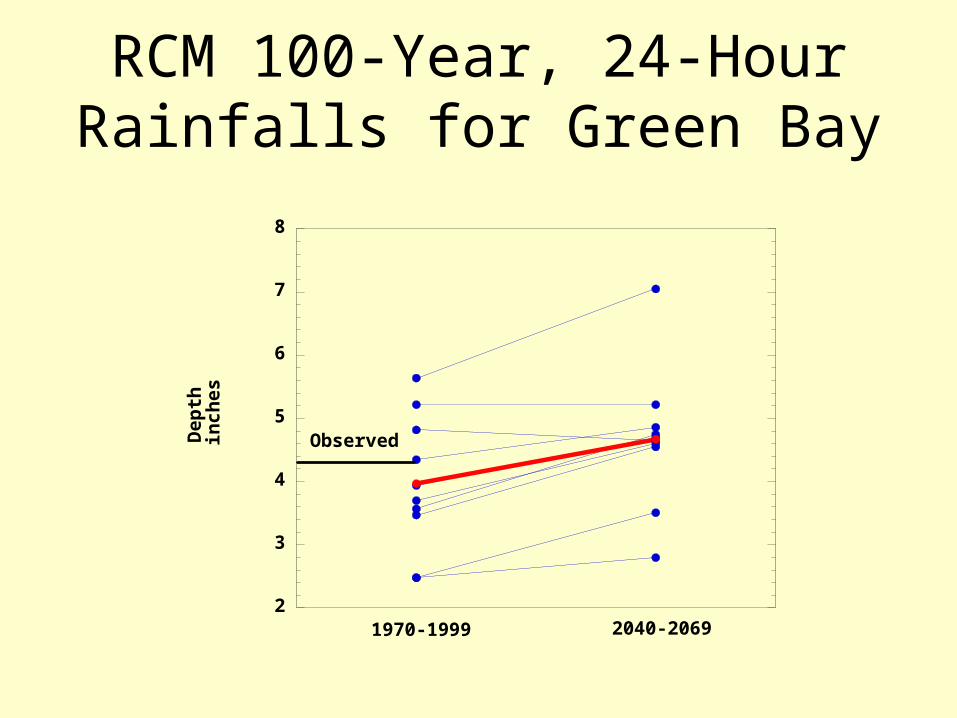
RCM 100-Year, 24-Hour Rainfalls for Green Bay
2
3
4
5
6
7
8
De
pth
inc
he
s
Observed
1970-1999 2040-2069
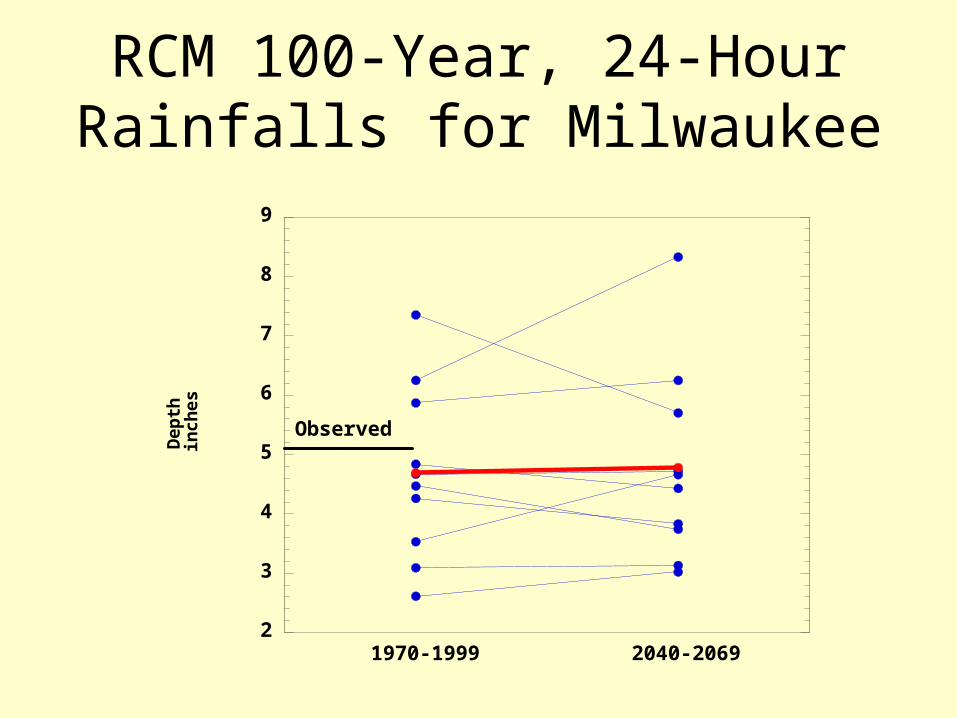
RCM 100-Year, 24-Hour Rainfalls for Milwaukee
2
3
4
5
6
7
8
9
Dep
thin
ches
Observed
1970-1999 2040-2069
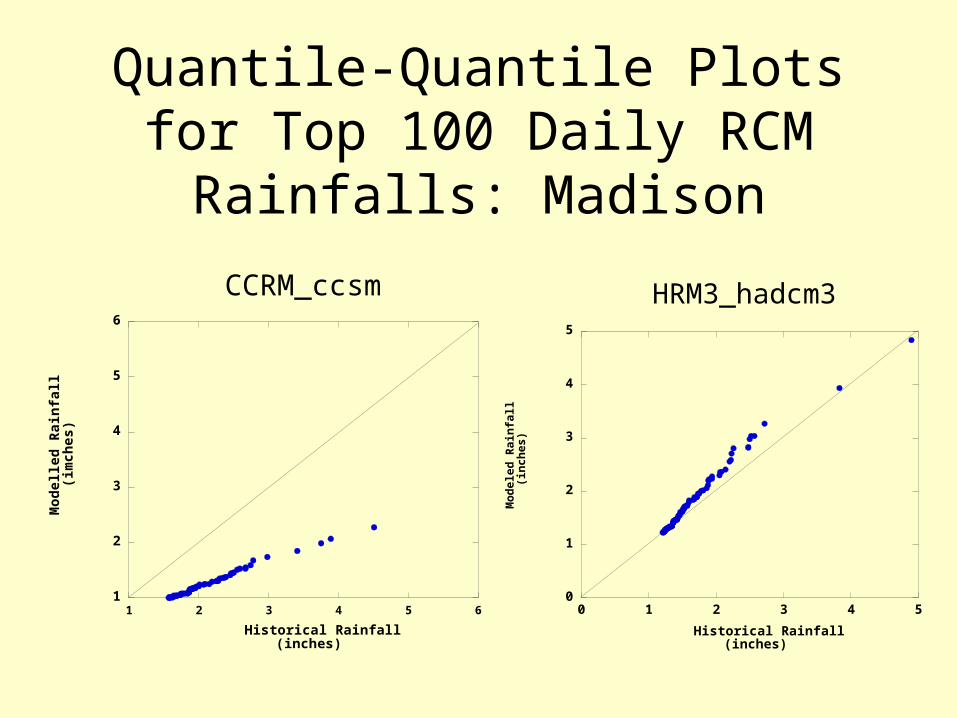
Quantile-Quantile Plots for Top 100 Daily RCM Rainfalls: Madison
0
1
2
3
4
5
0 1 2 3 4 5
HRM3_hadcm3
Mo
del
ed R
ain
fall
(in
ches
)
Historical Rainfall(inches)
1
2
3
4
5
6
1 2 3 4 5 6
CCRM_ccsm
Mo
del
led
Rai
nfa
ll(i
mch
es)
Historical Rainfall(inches)
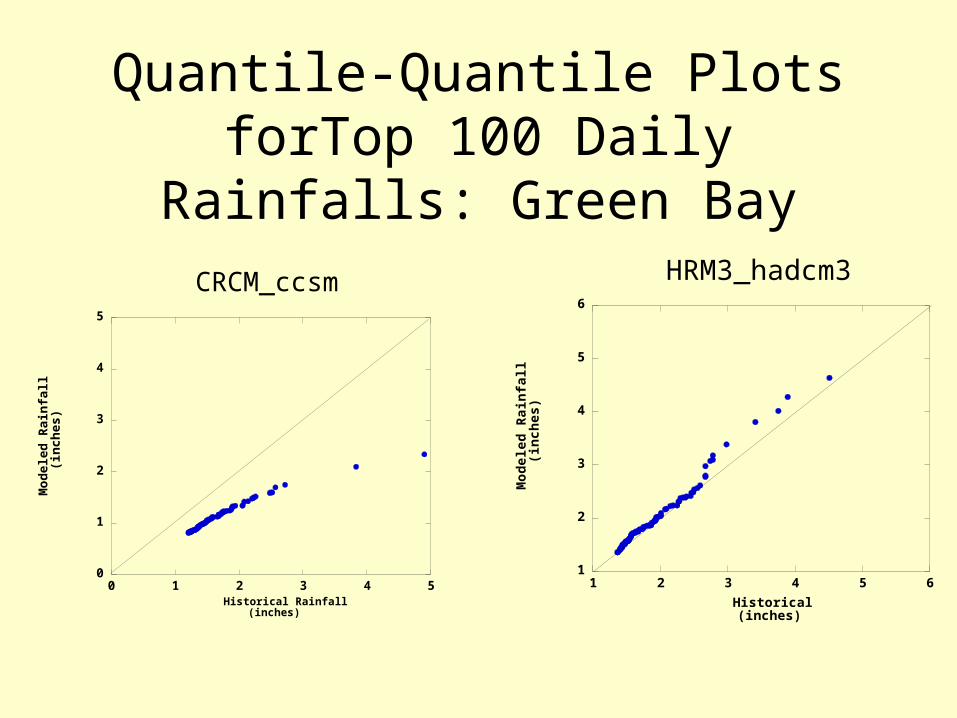
Quantile-Quantile Plots forTop 100 Daily Rainfalls: Green Bay
0
1
2
3
4
5
0 1 2 3 4 5
CRCM_ccsm
Mo
del
ed R
ain
fall
(in
ches
)
Historical Rainfall(inches)
1
2
3
4
5
6
1 2 3 4 5 6
HRM3_hadcm3
Mo
del
ed R
ain
fall
(in
ches
)
Historical(inches)
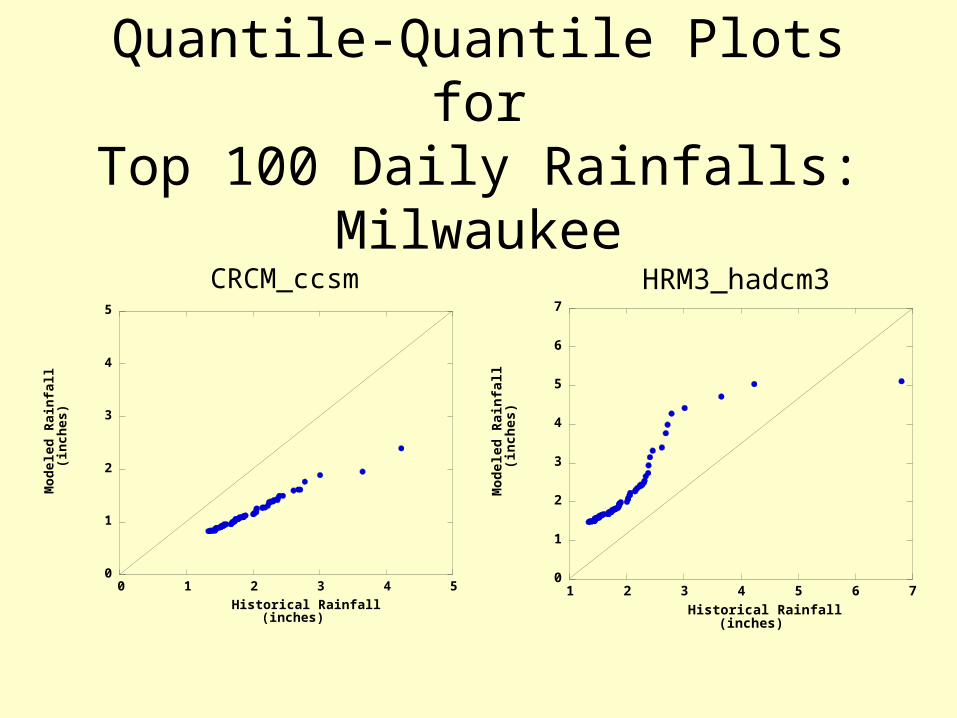
Quantile-Quantile Plots forTop 100 Daily Rainfalls: Milwaukee
0
1
2
3
4
5
6
7
1 2 3 4 5 6 7
HRM3_hadcm3
Mo
del
ed R
ain
fall
(in
ches
)
Historical Rainfall(inches)
0
1
2
3
4
5
0 1 2 3 4 5
CRCM_ccsm
Mo
del
ed R
ain
fall
(in
ches
)
Historical Rainfall(inches)
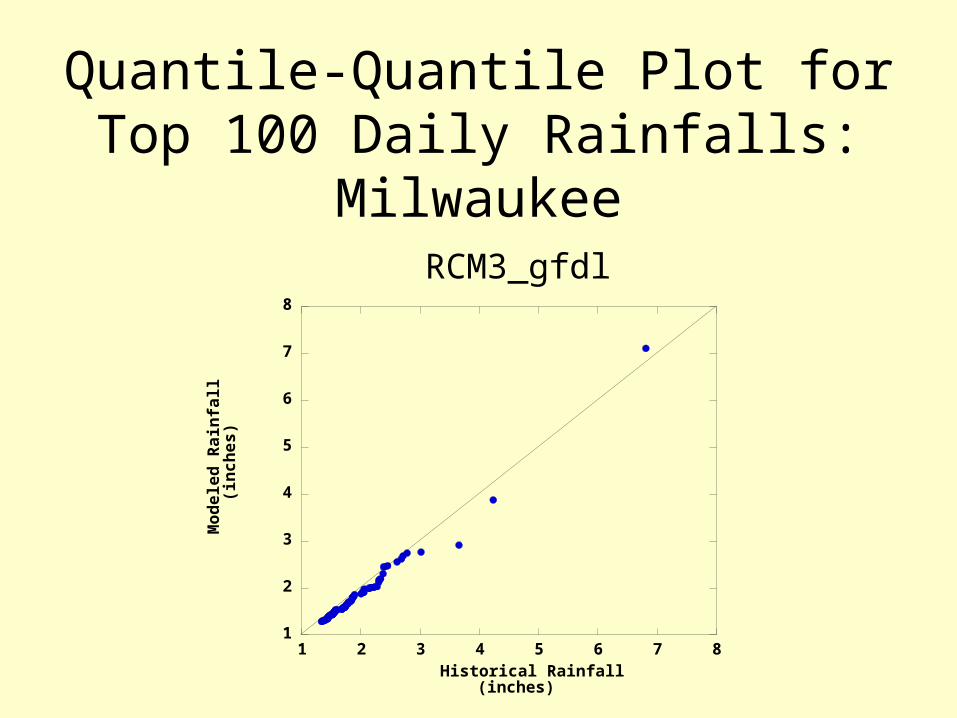
Quantile-Quantile Plot forTop 100 Daily Rainfalls: Milwaukee
1
2
3
4
5
6
7
8
1 2 3 4 5 6 7 8
RCM3_gfdl
Mo
del
ed R
ain
fall
(in
ches
)
Historical Rainfall(inches)
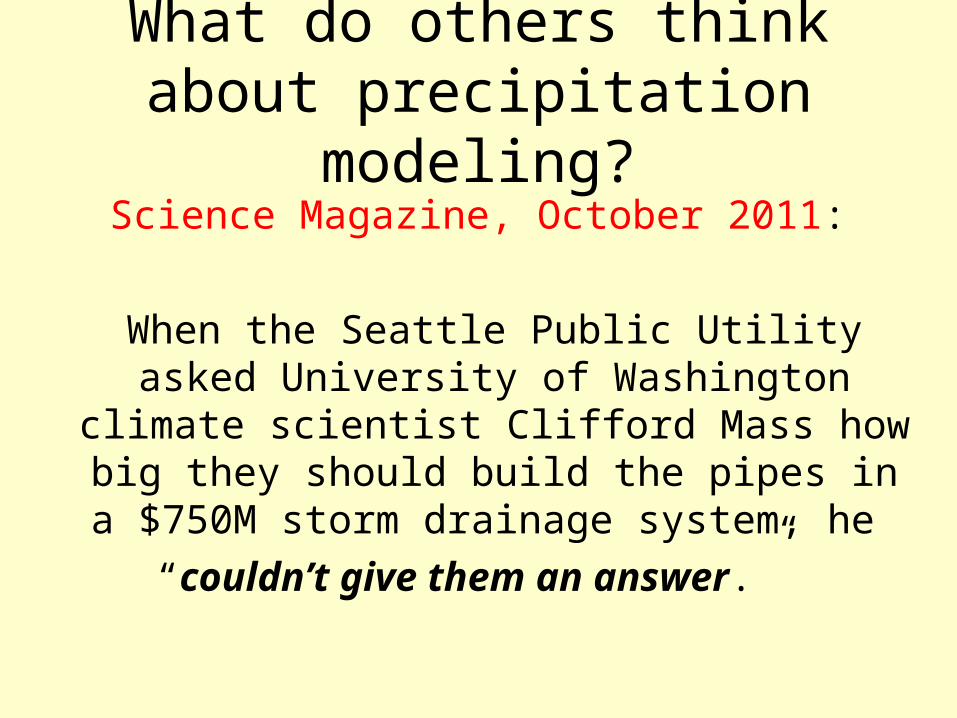
What do others think about precipitation modeling?
Science Magazine, October 2011:
When the Seattle Public Utility asked University of Washington climate scientist
Clifford Mass how big they should build the pipes in a $750M storm drainage system, he
“couldn’t give them an answer.”
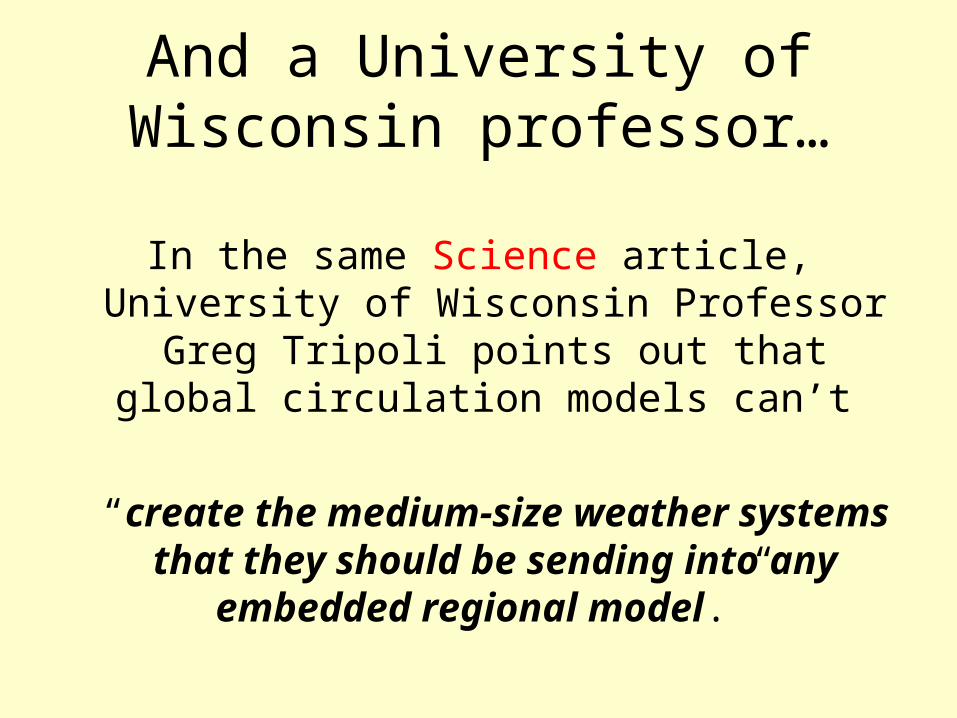
And a University of Wisconsin professor…
In the same Science article, University of Wisconsin Professor Greg Tripoli points out that global circulation models can’t
“create the medium-size weather systems that they should be sending into any embedded regional model.”

So what should we do about engineering design?
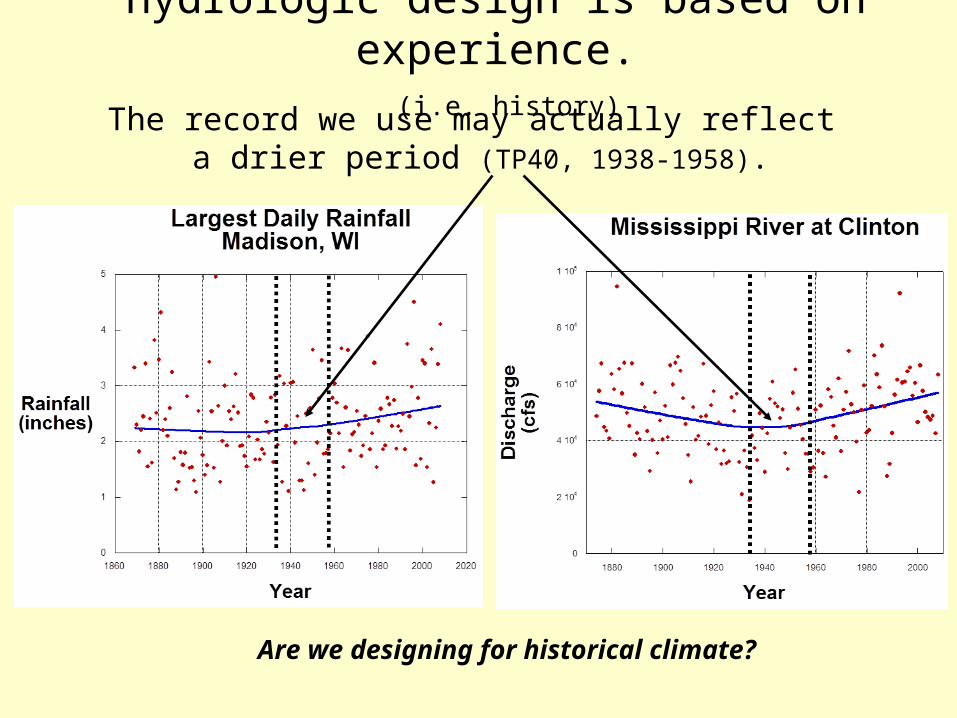
The record we use may actually reflect a drier period (TP40, 1938-1958).
Are we designing for historical climate?
Hydrologic design is based on experience. (i.e. history)
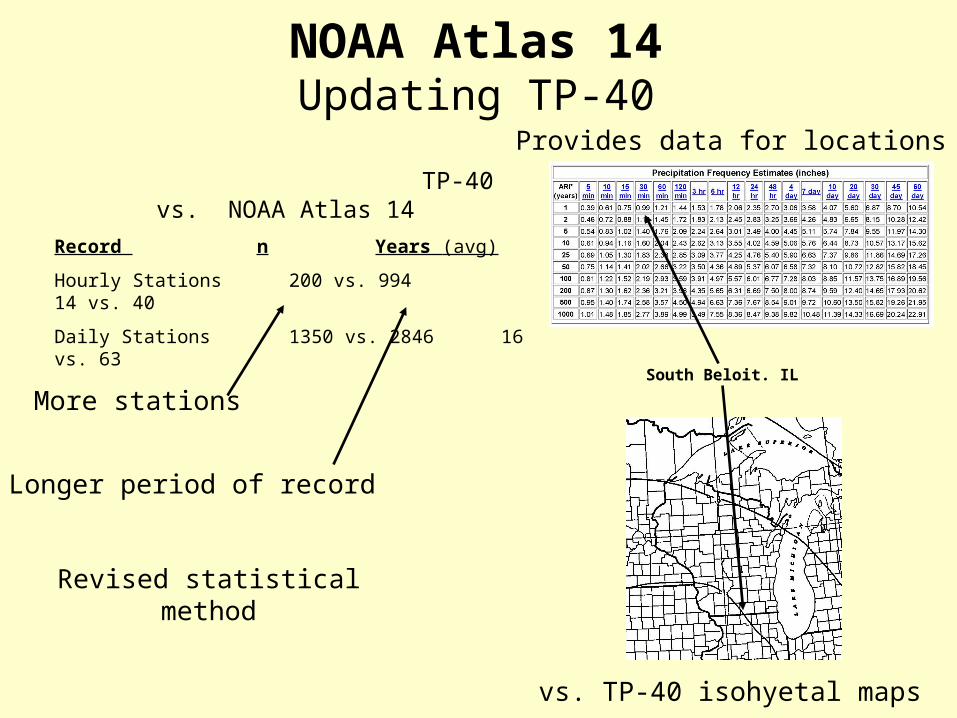
NOAA Atlas 14Updating TP-40
Provides data for locations
vs. TP-40 isohyetal maps
South Beloit. IL
More stations
TP-40 vs. NOAA Atlas 14
Record n Years (avg)
Hourly Stations 200 vs. 994 14 vs. 40
Daily Stations 1350 vs. 2846 16 vs. 63
Longer period of record
Revised statistical method
Davis Todd, et al 2006
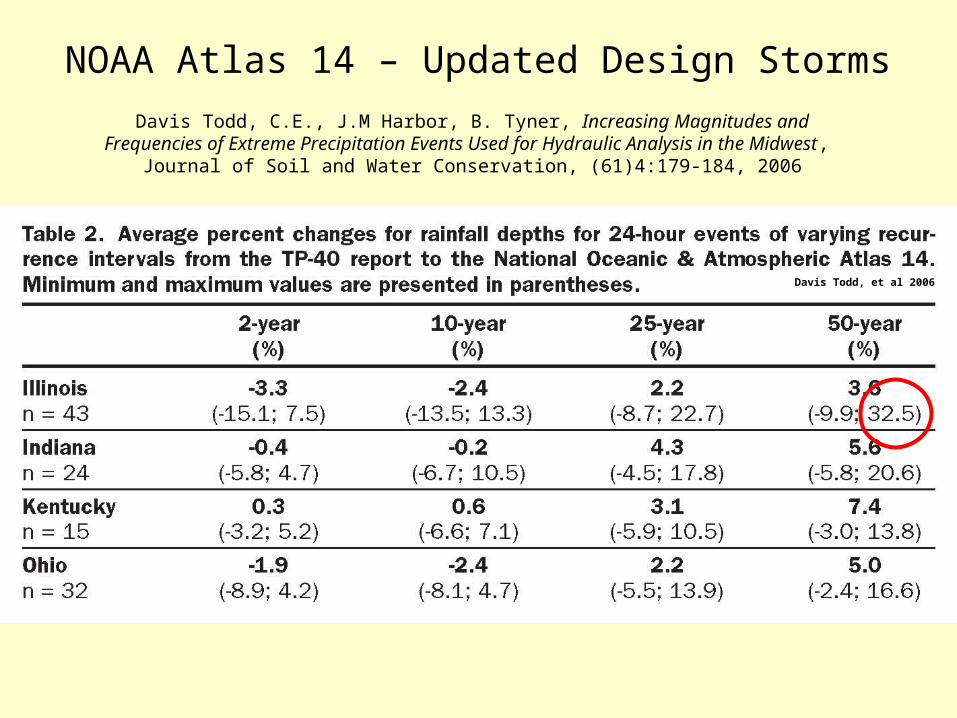
NOAA Atlas 14 – Updated Design Storms
Davis Todd, C.E., J.M Harbor, B. Tyner, Increasing Magnitudes and Frequencies of Extreme Precipitation Events Used for Hydraulic Analysis in the Midwest,
Journal of Soil and Water Conservation, (61)4:179-184, 2006
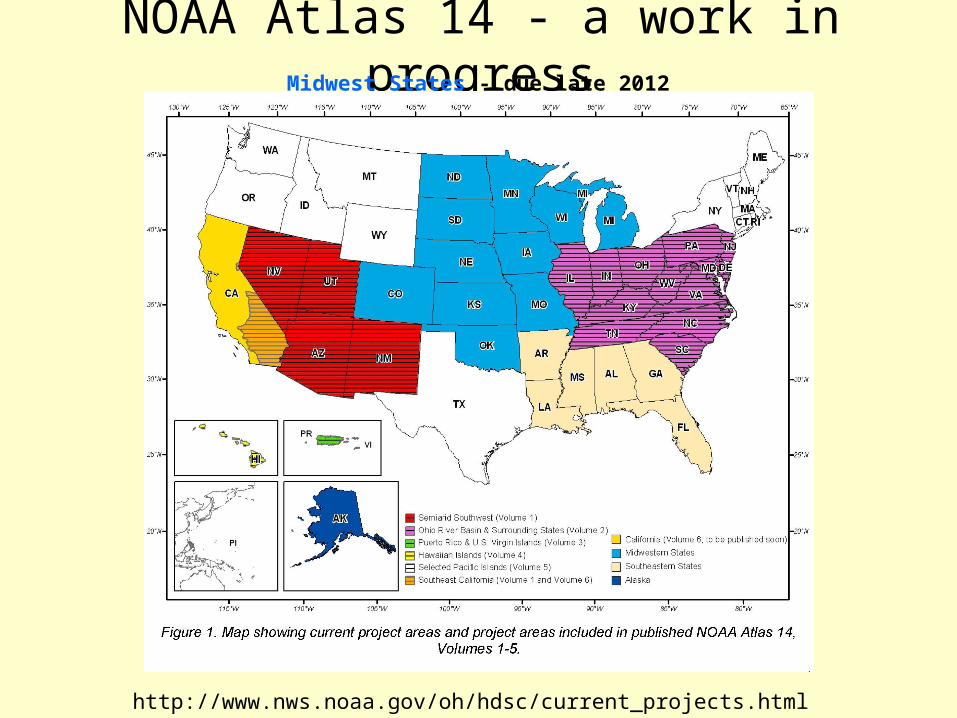
NOAA Atlas 14 - a work in progressMidwest States - due late 2012
http://www.nws.noaa.gov/oh/hdsc/current_projects.html
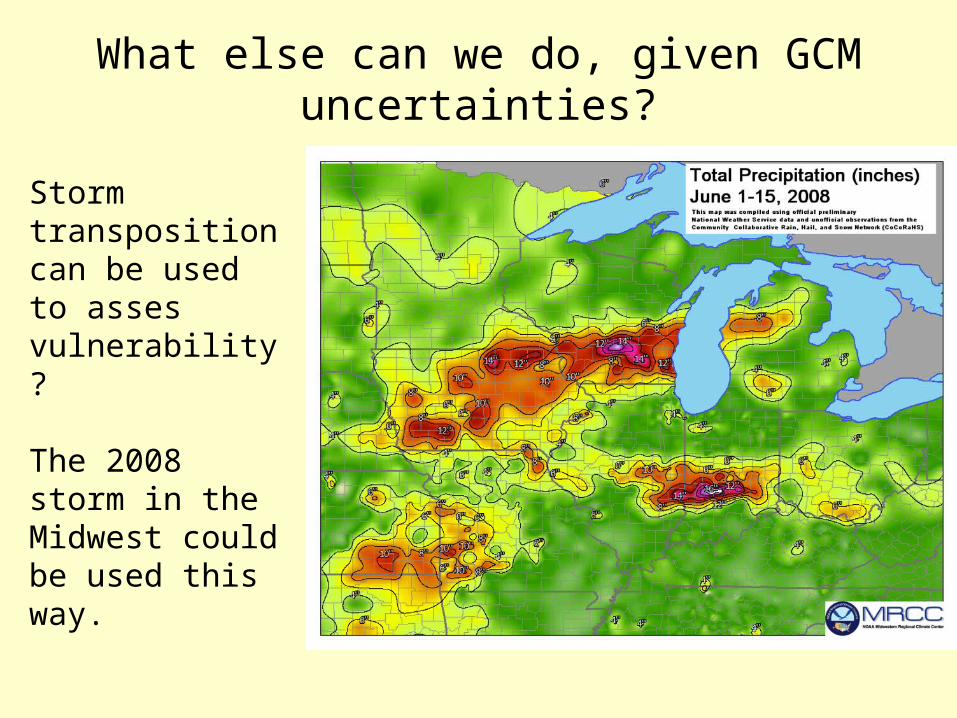
Storm transposition can be used to asses vulnerability?
The 2008 storm in the Midwest could be used this way.
What else can we do, given GCM uncertainties?
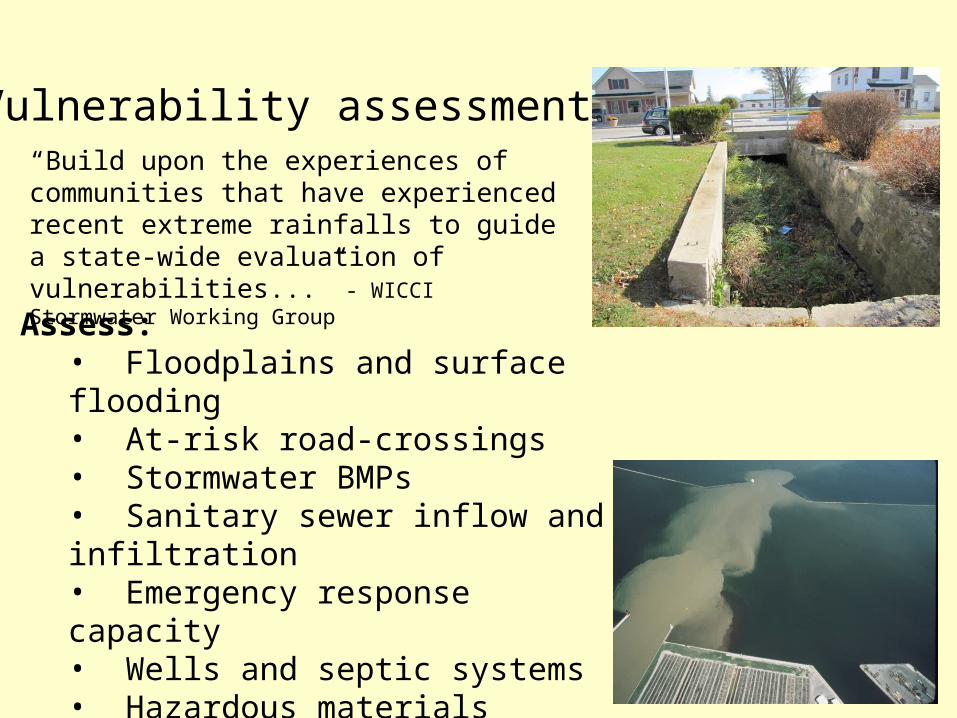
“Build upon the experiences of communities that have experienced recent extreme rainfalls to guide a state-wide evaluation of vulnerabilities...” - WICCI Stormwater Working Group
Vulnerability assessment
Assess: • Floodplains and surface flooding• At-risk road-crossings• Stormwater BMPs• Sanitary sewer inflow and infiltration• Emergency response capacity• Wells and septic systems• Hazardous materials storage
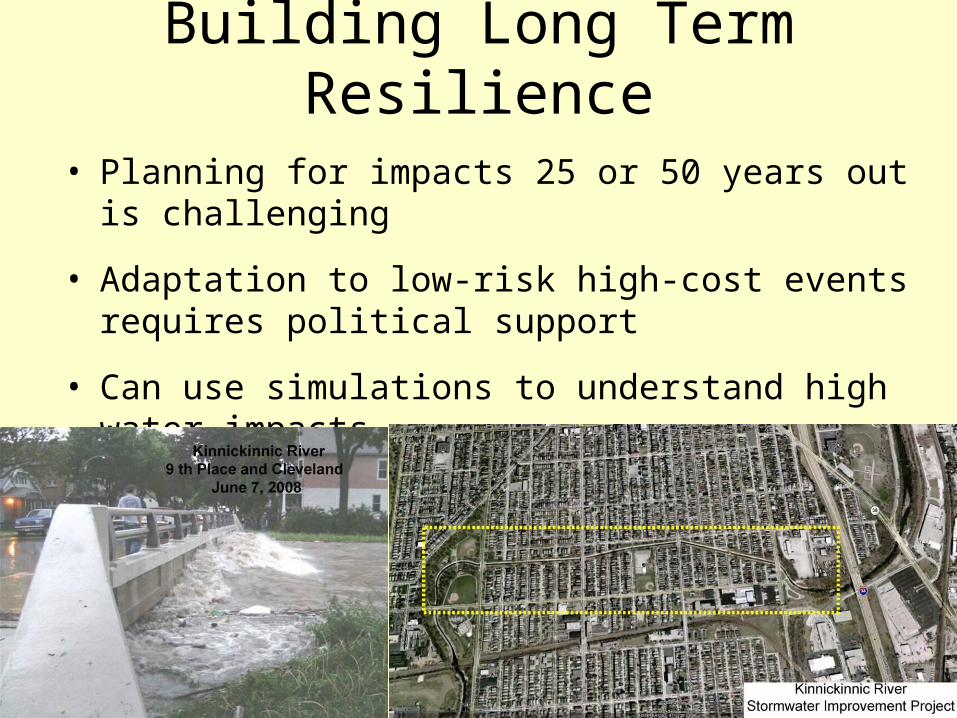
Building Long Term Resilience
• Planning for impacts 25 or 50 years out is challenging
• Adaptation to low-risk high-cost events requires political support
• Can use simulations to understand high water impacts
Conclusions
• Rain event intensities will likely increase in WI due to climate change, but the modeling results do not provide a sufficient basis for engineering design.
• Winter-spring precipitation changes appear to be better supported. Runoff implications need further study.
Conclusions
• NOAA Atlas 14 should be adopted statewide when available.
• Storm transposition should be explored as a method of evaluating vulnerabilities and increasing resilience.

Questions?