Embed Size (px)
Citation preview
Climate Change, Agriculture, and Global Table Grape Projection
Gregory V. JonesDirector: Business, Communication and the EnvironmentProfessor: Environmental Science and Policy
Talk Outline
The State of the Climate
Climate Change and Agriculture
Climate Structure and Suitability for Viticulture
Climate Variability and Change Impacts
Summary/Conclusions
State of the Climate
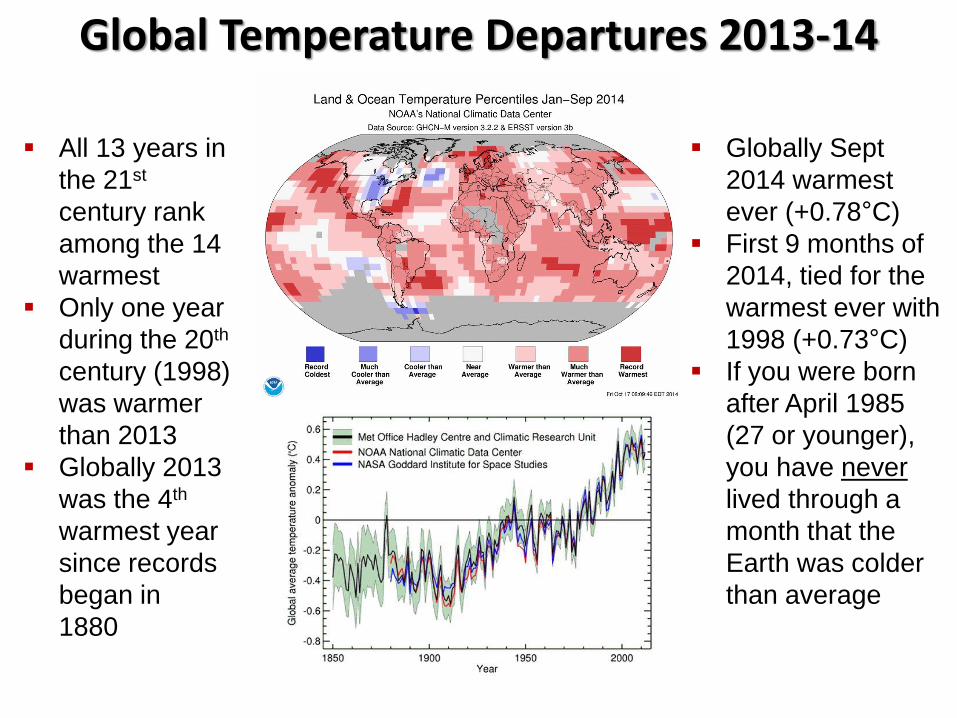
All 13 years in
the 21st
century rank
among the 14
warmest
Only one year
during the 20th
century (1998)
was warmer
than 2013
Globally 2013
was the 4th
warmest year
since records
began in
1880
Global Temperature Departures 2013-14
Globally Sept
2014 warmest
ever (+0.78°C)
First 9 months of
2014, tied for the
warmest ever with
1998 (+0.73°C)
If you were born
after April 1985
(27 or younger),
you have never
lived through a
month that the
Earth was colder
than average
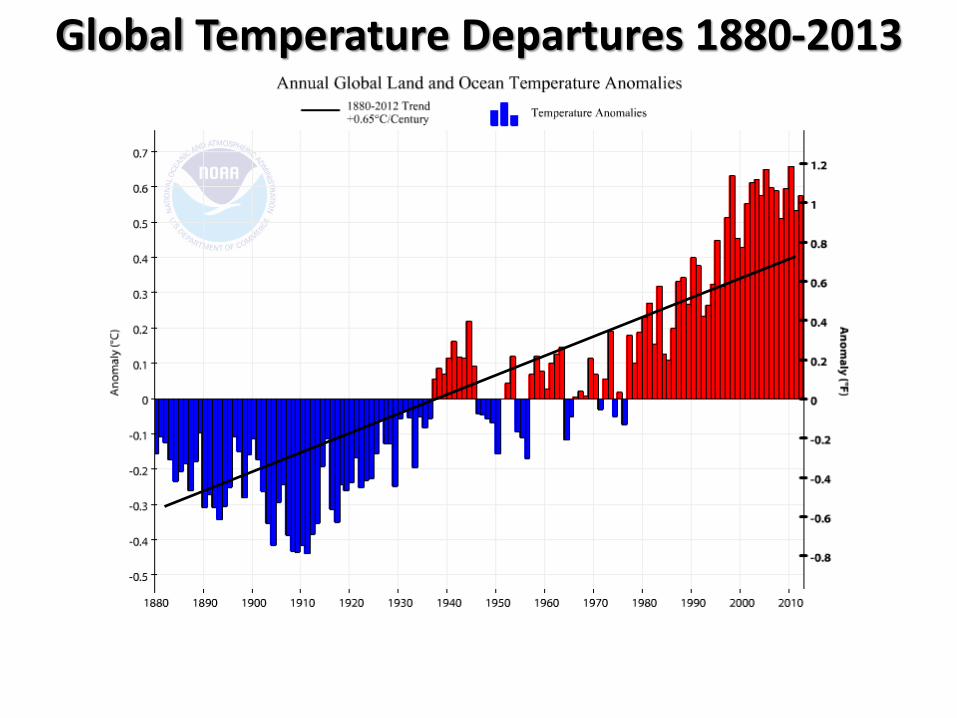
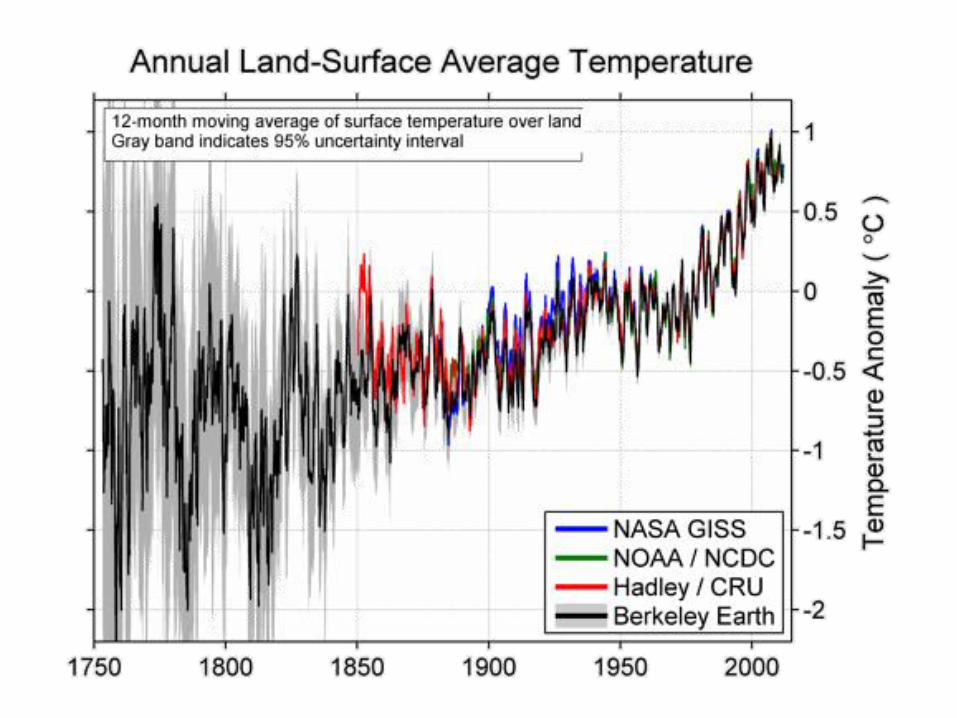
Global Temperature Departures 1880-2013
Global Temperature Departures 1880-2013
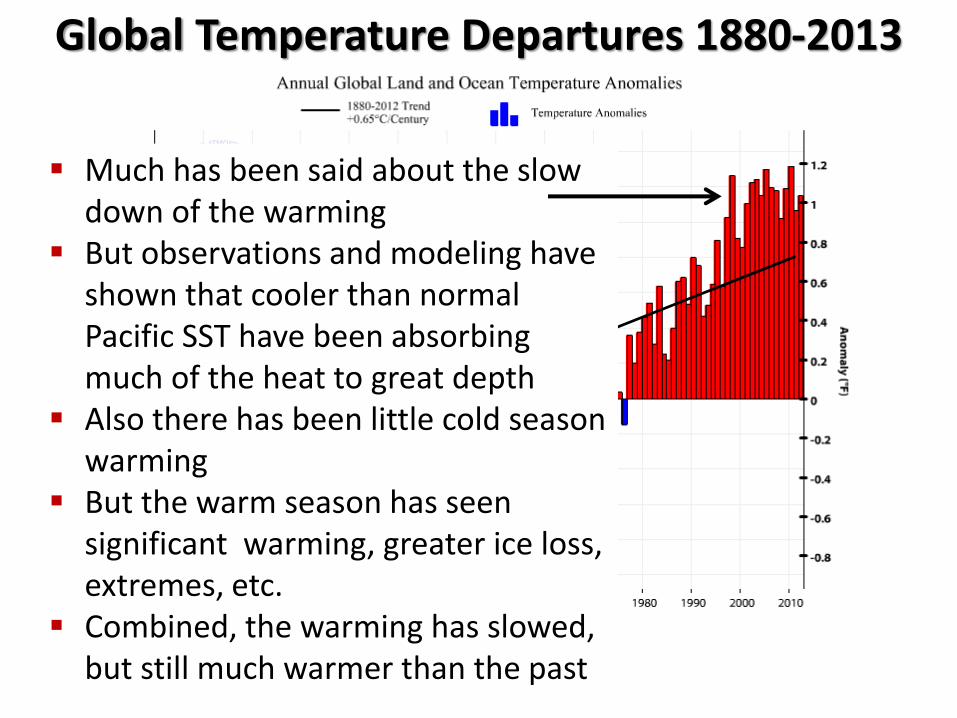
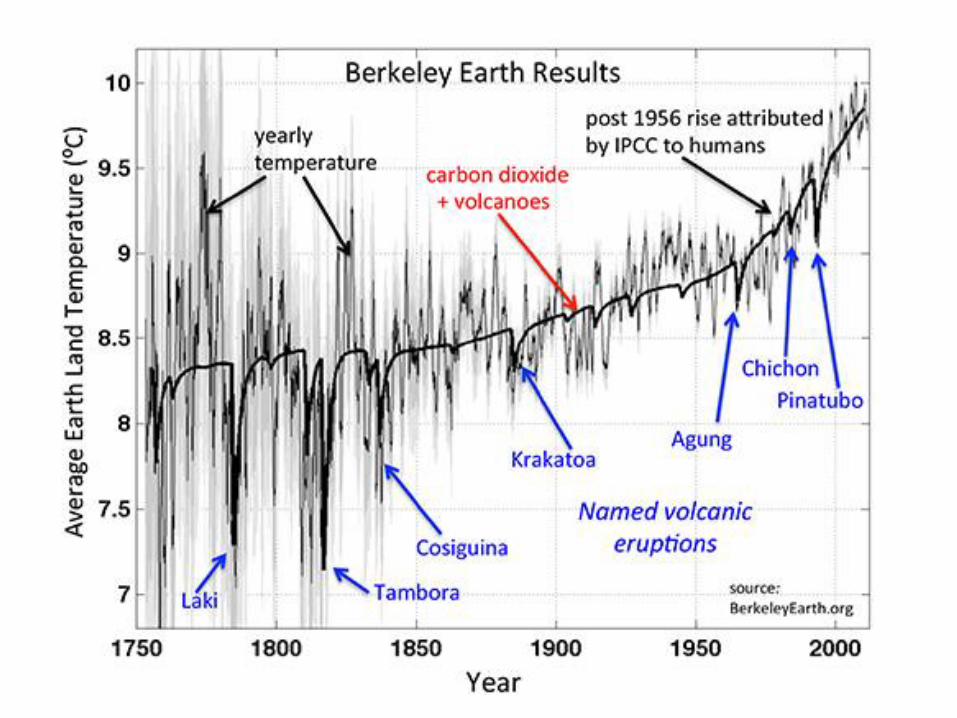
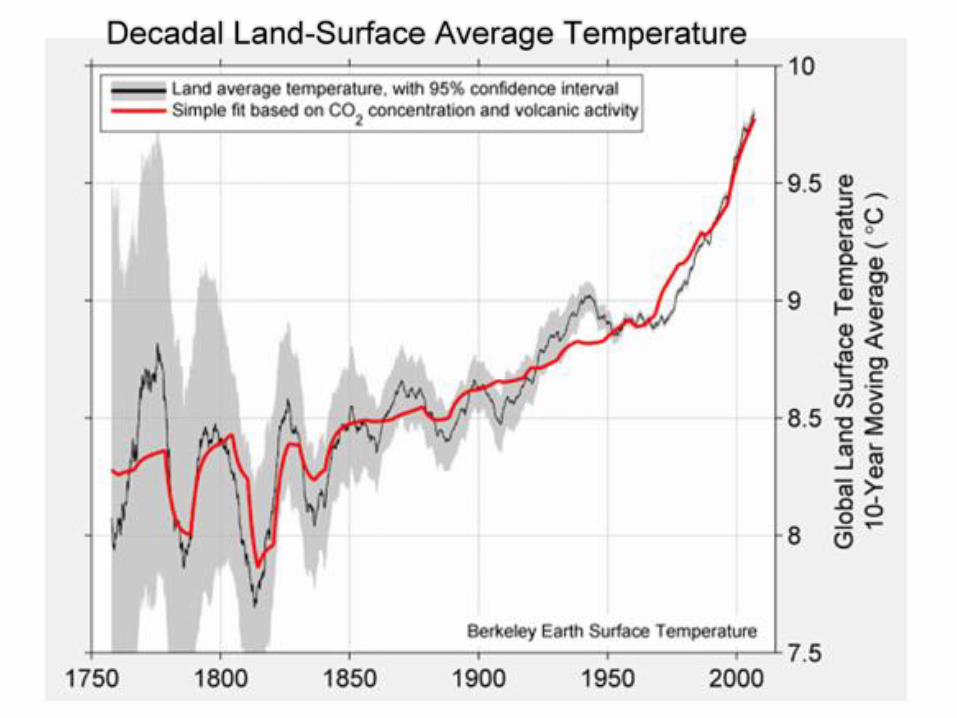
Much has been said about the slow down of the warming
But observations and modeling have shown that cooler than normal Pacific SST have been absorbing much of the heat to great depth
Also there has been little cold season warming
But the warm season has seen significant warming, greater ice loss, extremes, etc.
Combined, the warming has slowed, but still much warmer than the past
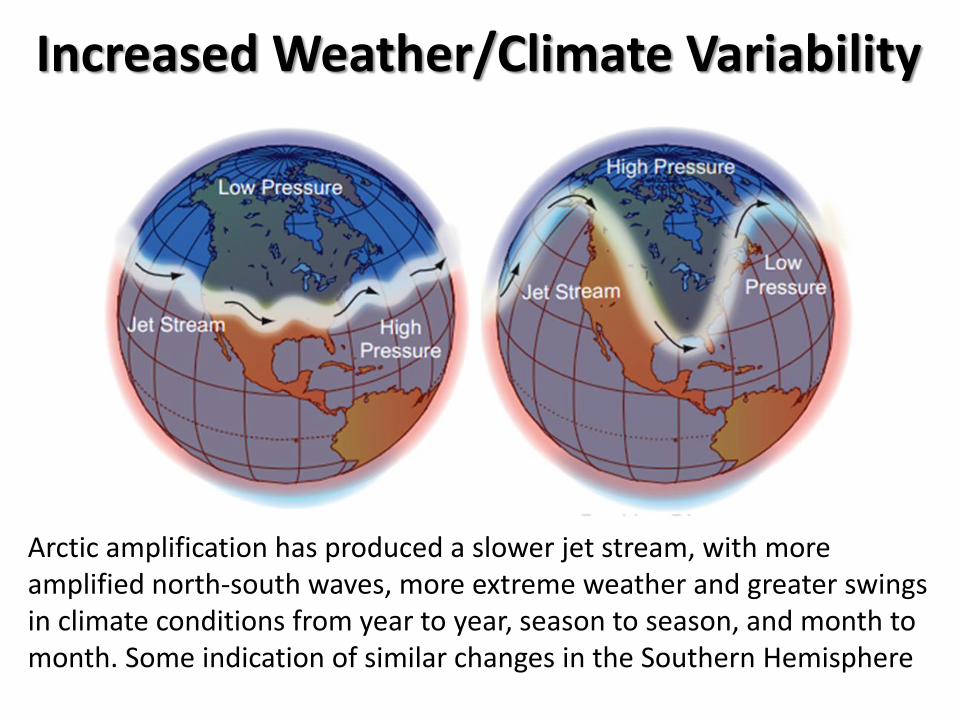
Arctic amplification has produced a slower jet stream, with more amplified north-south waves, more extreme weather and greater swings in climate conditions from year to year, season to season, and month to month. Some indication of similar changes in the Southern Hemisphere
Increased Weather/Climate Variability
Climate Change and Agriculture
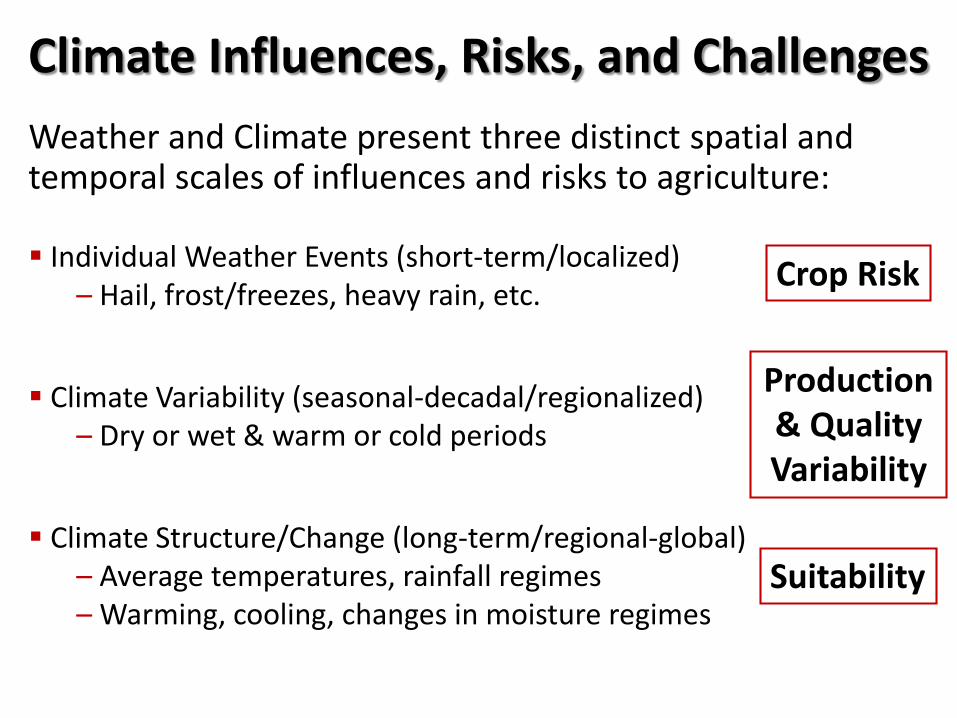
Weather and Climate present three distinct spatial and temporal scales of influences and risks to agriculture:
Individual Weather Events (short-term/localized)– Hail, frost/freezes, heavy rain, etc.
Climate Variability (seasonal-decadal/regionalized)– Dry or wet & warm or cold periods
Climate Structure/Change (long-term/regional-global)– Average temperatures, rainfall regimes– Warming, cooling, changes in moisture regimes
Climate Influences, Risks, and Challenges
Crop Risk
Production& Quality Variability
Suitability
Climate Change and Agriculture
What we know from the present and want/need to know for the future:
Agricultural production takes place under a climate regime that provides crop establishment, growth and maturity … will it continue or how will it be altered?
Will there be adequate heat units and precipitation to meet crop needs … how will the balance for optimum production change?
Sufficient regularity from year to year so as to allow security of production … will agroclimatic variability be greater than what is environmentally/economically feasible and/or sustainable?
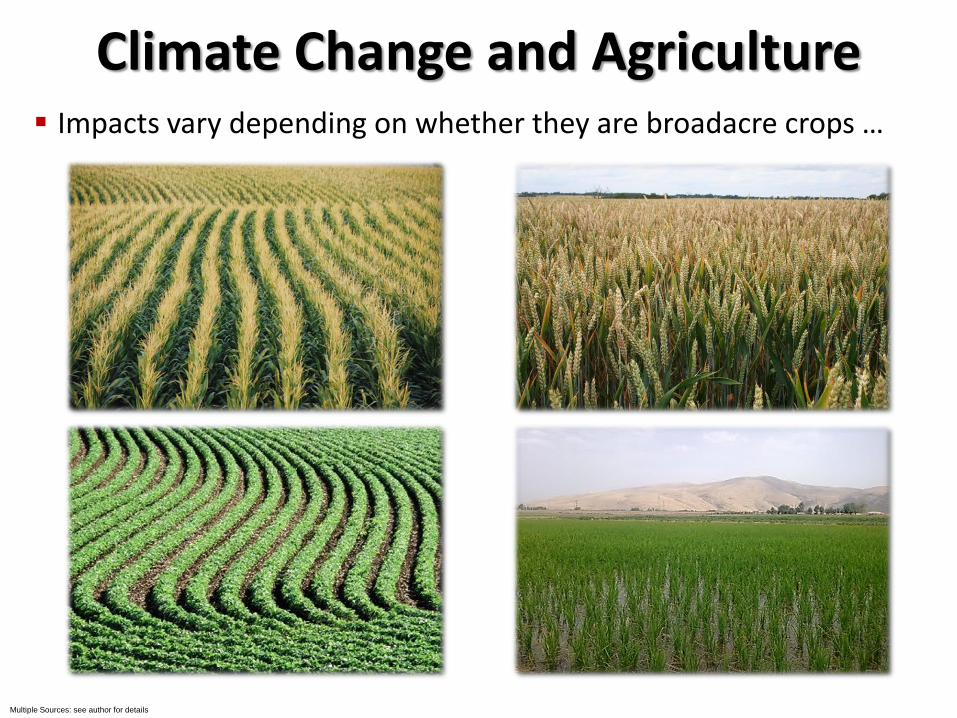
Climate Change and Agriculture Impacts vary depending on whether they are broadacre crops …
Multiple Sources: see author for details
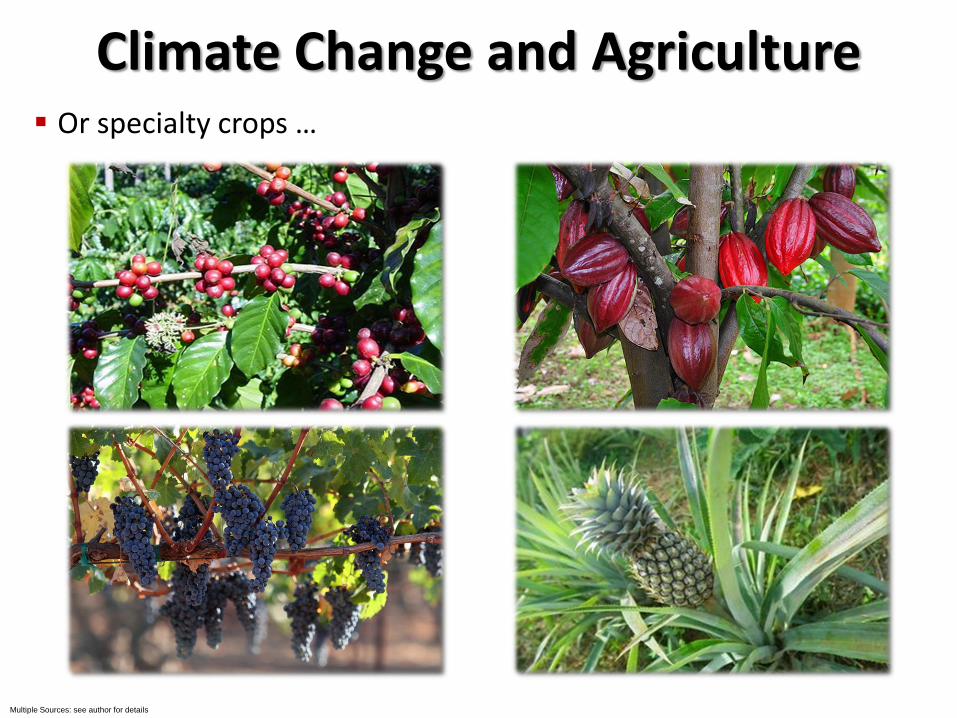
Climate Change and Agriculture Or specialty crops …
Multiple Sources: see author for details
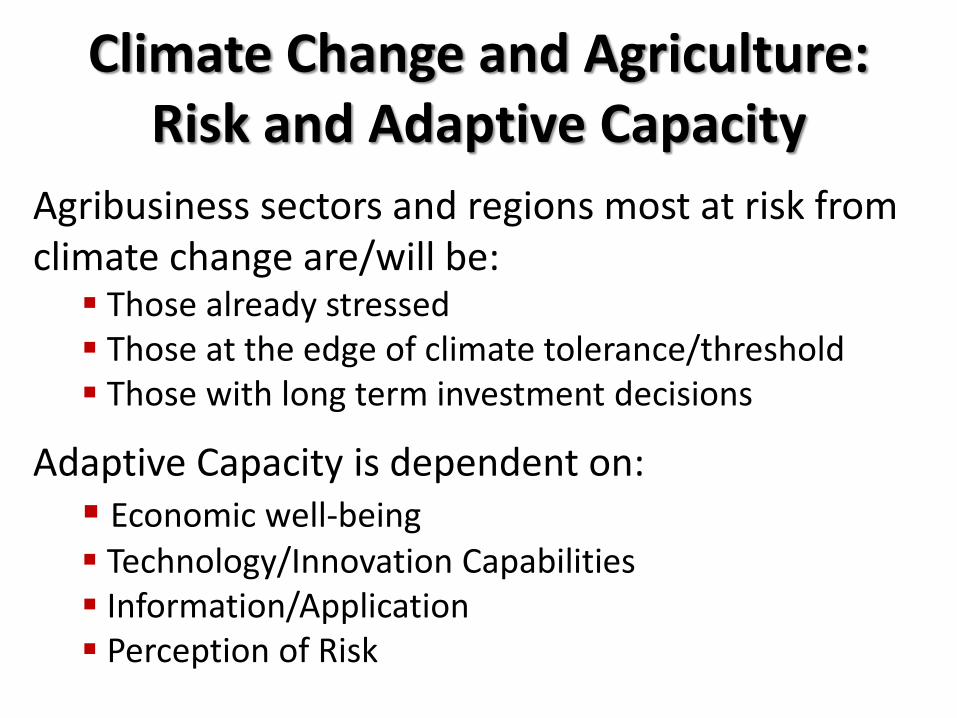
Climate Change and Agriculture: Risk and Adaptive Capacity
Agribusiness sectors and regions most at risk from climate change are/will be:
Those already stressed Those at the edge of climate tolerance/threshold Those with long term investment decisions
Adaptive Capacity is dependent on: Economic well-being Technology/Innovation Capabilities Information/Application Perception of Risk
Climate Structure and Suitability for Viticulture
Pro
du
ctio
n a
nd
Qu
alit
y M
etri
cs
Climate Metrics
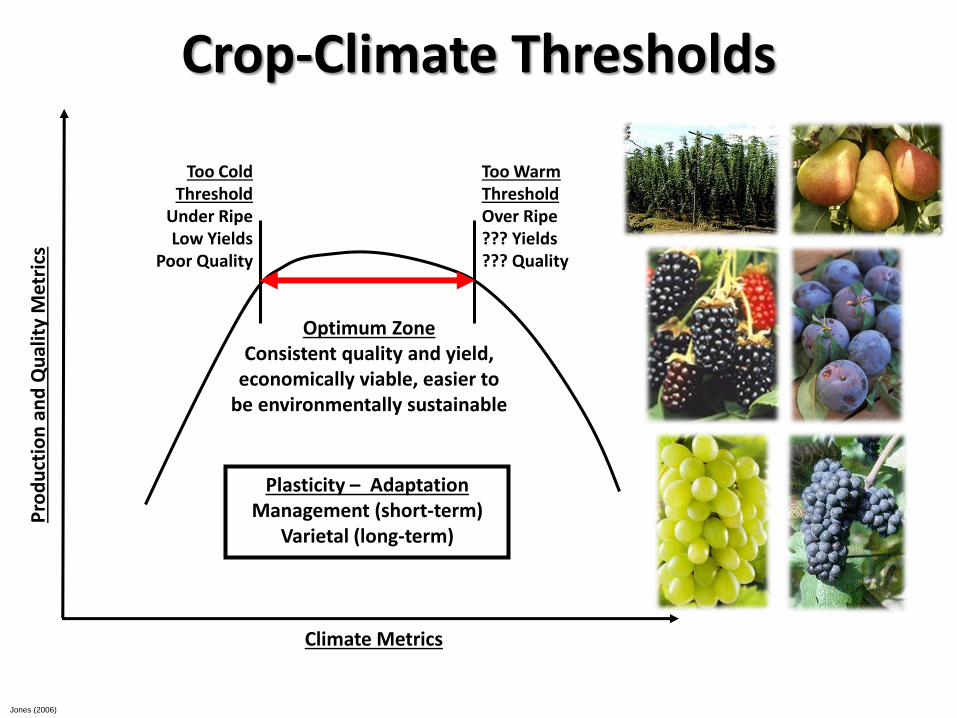
Optimum ZoneConsistent quality and yield,
economically viable, easier to be environmentally sustainable
Too WarmThreshold Over Ripe??? Yields??? Quality
Too ColdThreshold
Under RipeLow Yields
Poor Quality
Crop-Climate Thresholds
Plasticity – AdaptationManagement (short-term)
Varietal (long-term)
Jones (2006)
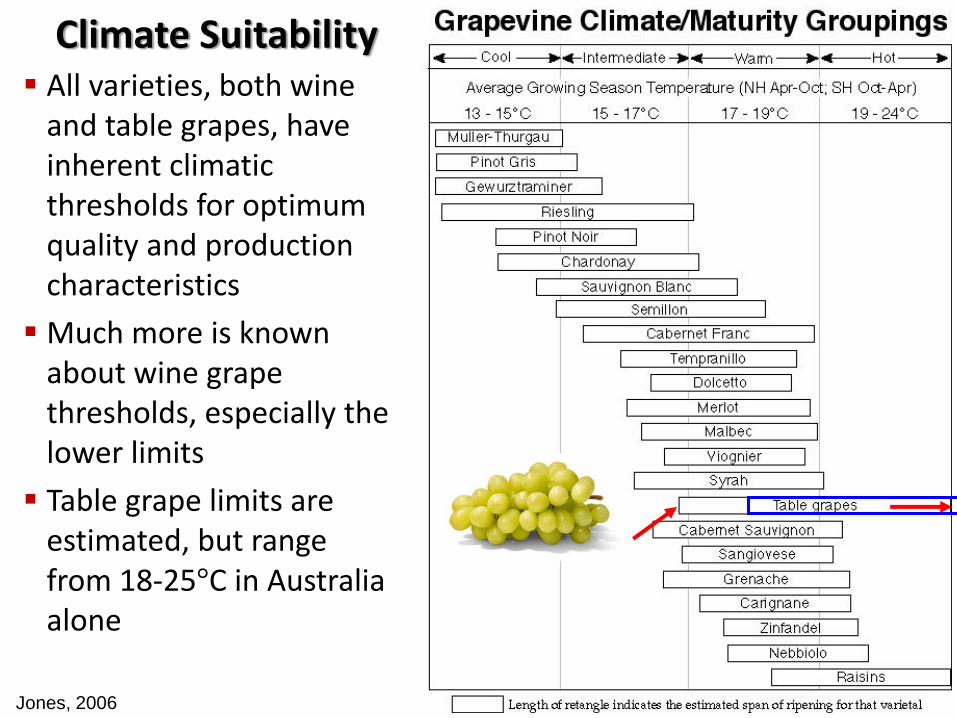
Jones, 2006
All varieties, both wine and table grapes, have inherent climatic thresholds for optimum quality and production characteristics
Much more is known about wine grape thresholds, especially the lower limits
Table grape limits are estimated, but range from 18-25°C in Australia alone
Climate Suitability
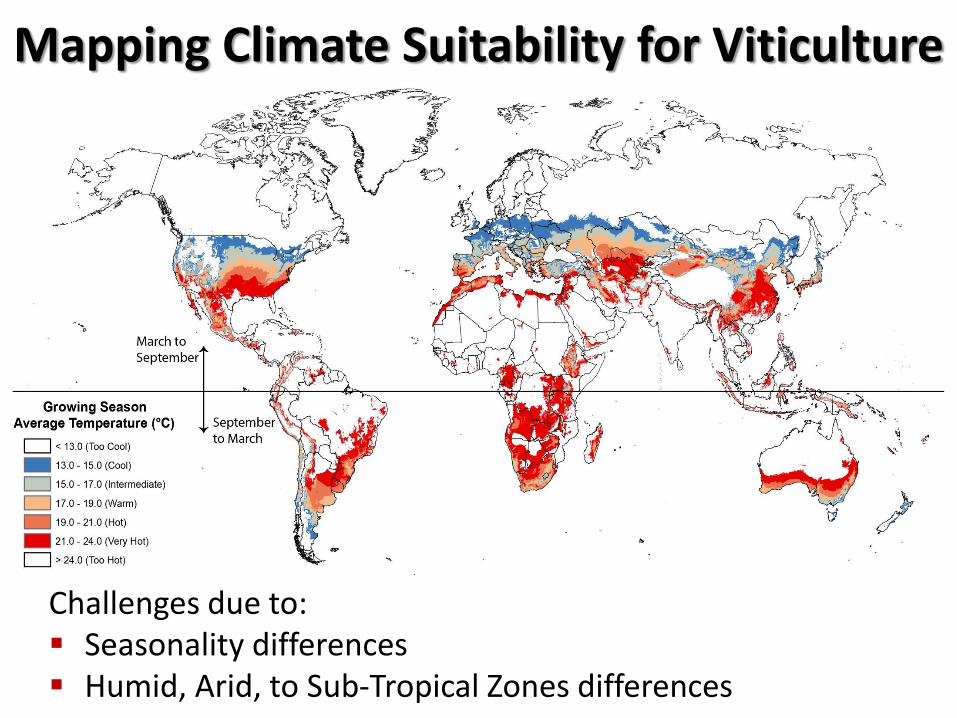
Mapping Climate Suitability for Viticulture
Challenges due to: Seasonality differences Humid, Arid, to Sub-Tropical Zones differences
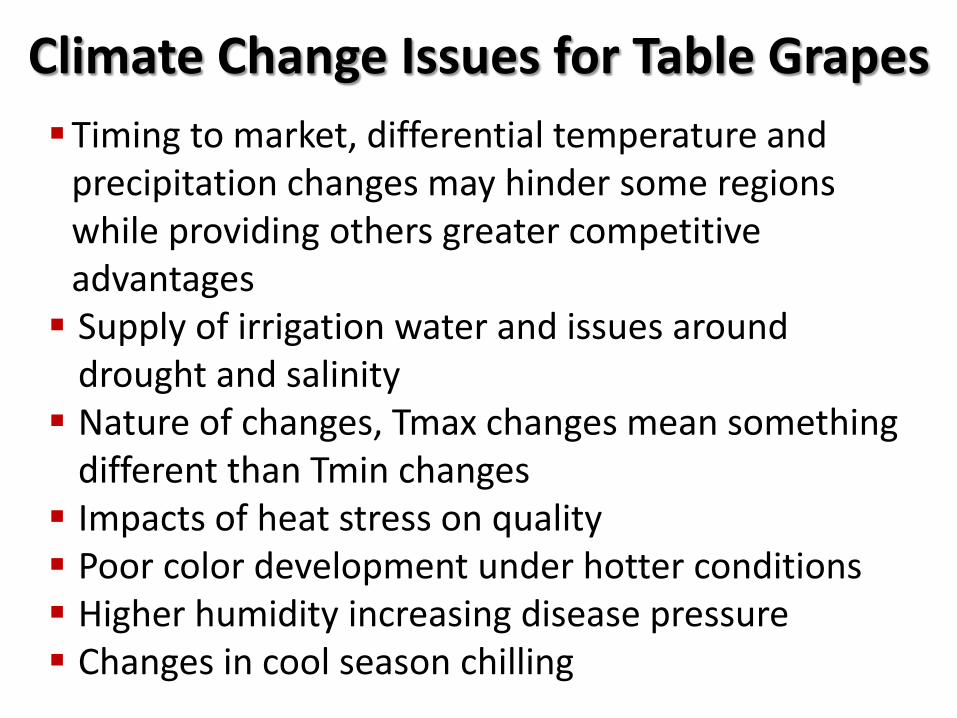
Climate Change Issues for Table Grapes
Timing to market, differential temperature and precipitation changes may hinder some regions while providing others greater competitive advantages
Supply of irrigation water and issues around drought and salinity
Nature of changes, Tmax changes mean something different than Tmin changes
Impacts of heat stress on quality Poor color development under hotter conditions Higher humidity increasing disease pressure Changes in cool season chilling
Climate Change – The Past & Present
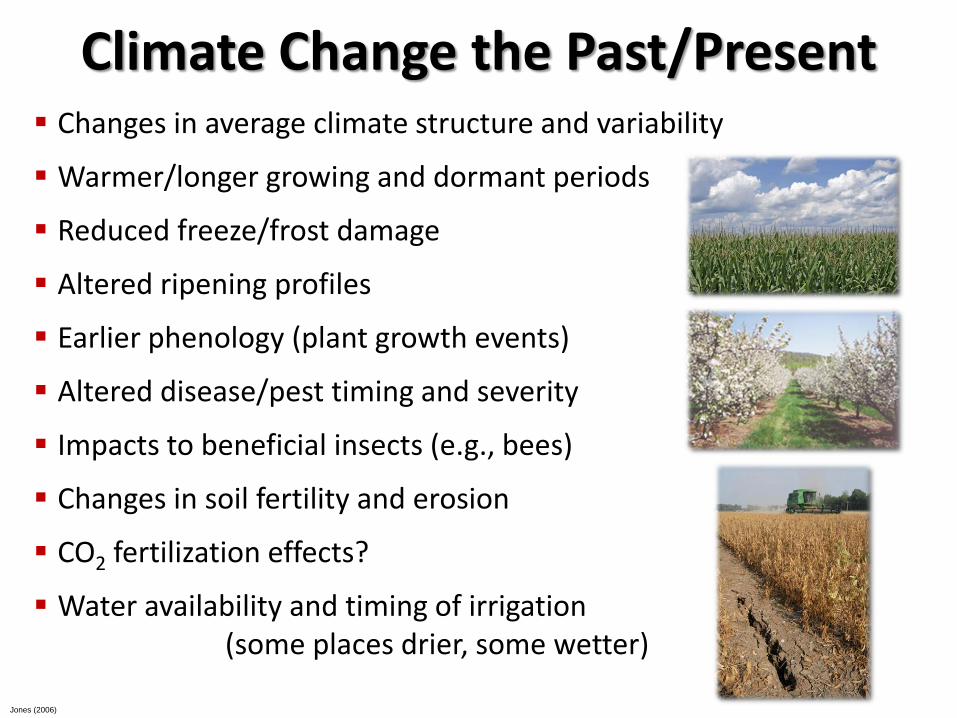
Changes in average climate structure and variability
Warmer/longer growing and dormant periods
Reduced freeze/frost damage
Altered ripening profiles
Earlier phenology (plant growth events)
Altered disease/pest timing and severity
Impacts to beneficial insects (e.g., bees)
Changes in soil fertility and erosion
CO2 fertilization effects?
Water availability and timing of irrigation (some places drier, some wetter)
Climate Change the Past/Present
Jones (2006)
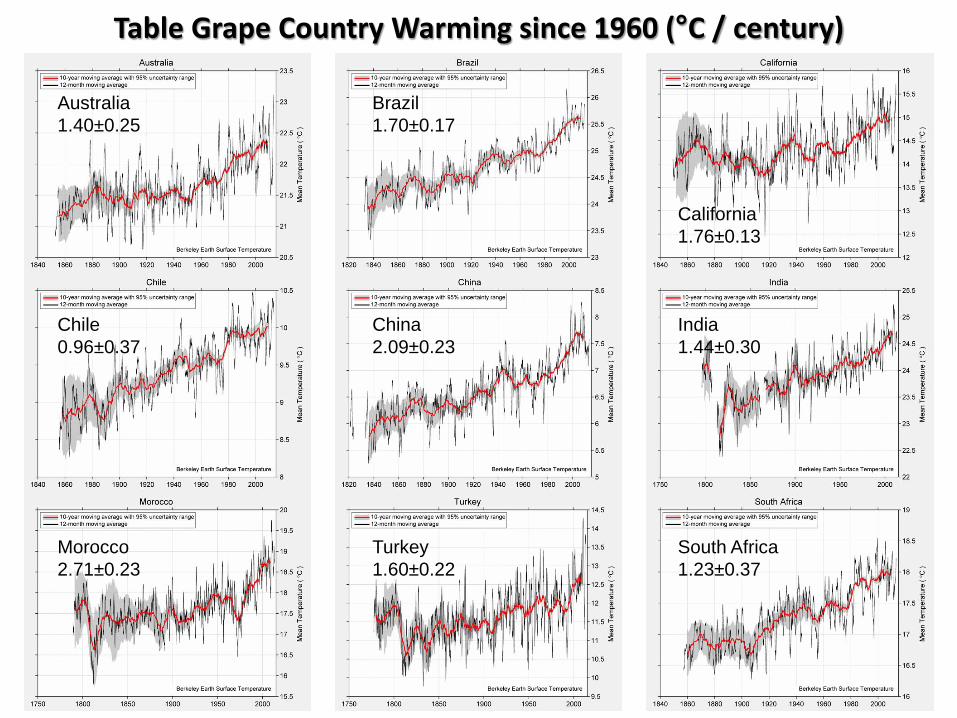
Australia
1.40±0.25
Brazil
1.70±0.17
California
1.76±0.13
Chile
0.96±0.37
China
2.09±0.23
India
1.44±0.30
Morocco
2.71±0.23
Turkey
1.60±0.22
South Africa
1.23±0.37
Table Grape Country Warming since 1960 (°C / century)
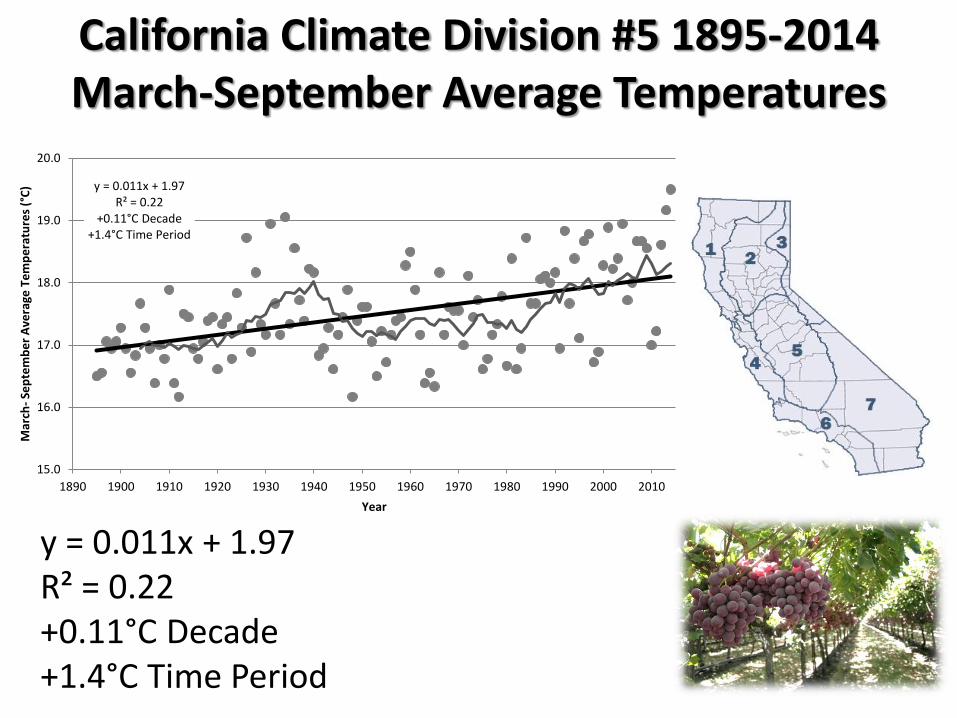
California Climate Division #5 1895-2014March-September Average Temperatures
y = 0.011x + 1.97R² = 0.22
+0.11°C Decade+1.4°C Time Period
15.0
16.0
17.0
18.0
19.0
20.0
1890 1900 1910 1920 1930 1940 1950 1960 1970 1980 1990 2000 2010
Mar
ch-
Sep
tem
be
r A
vera
ge T
em
pe
ratu
res
(°C
)
Year
y = 0.011x + 1.97R² = 0.22+0.11°C Decade+1.4°C Time Period
Climate Change – The Future
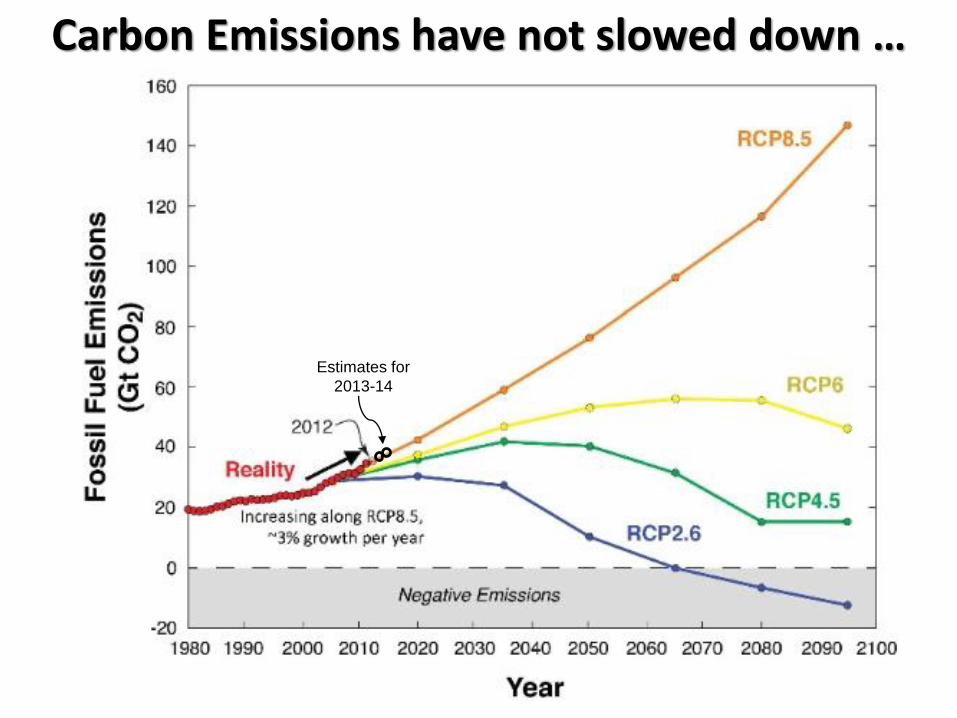
Estimates for
2013-14
Carbon Emissions have not slowed down …
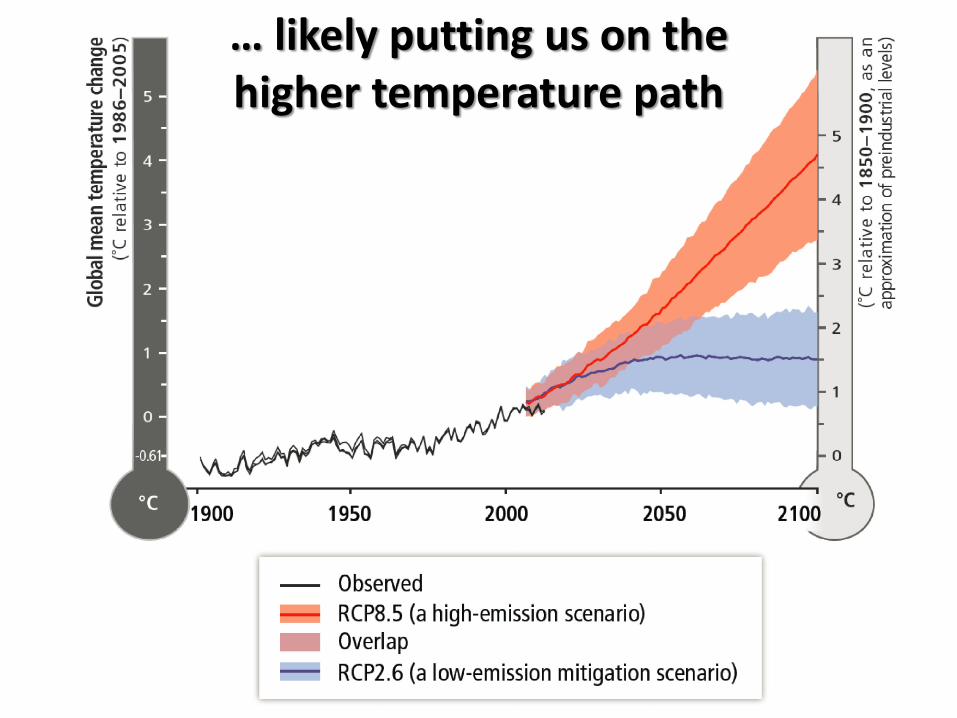
… likely putting us on the higher temperature path
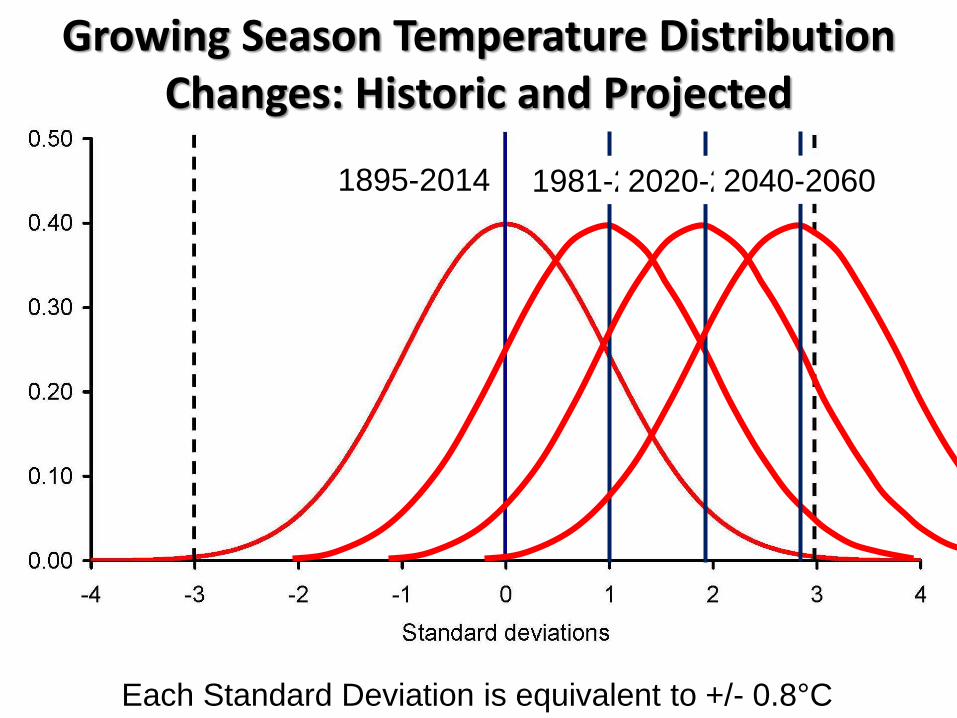
Growing Season Temperature Distribution Changes: Historic and Projected
1981-20102020-20402040-20601895-2014
Each Standard Deviation is equivalent to +/- 0.8°C
Summary/Conclusions
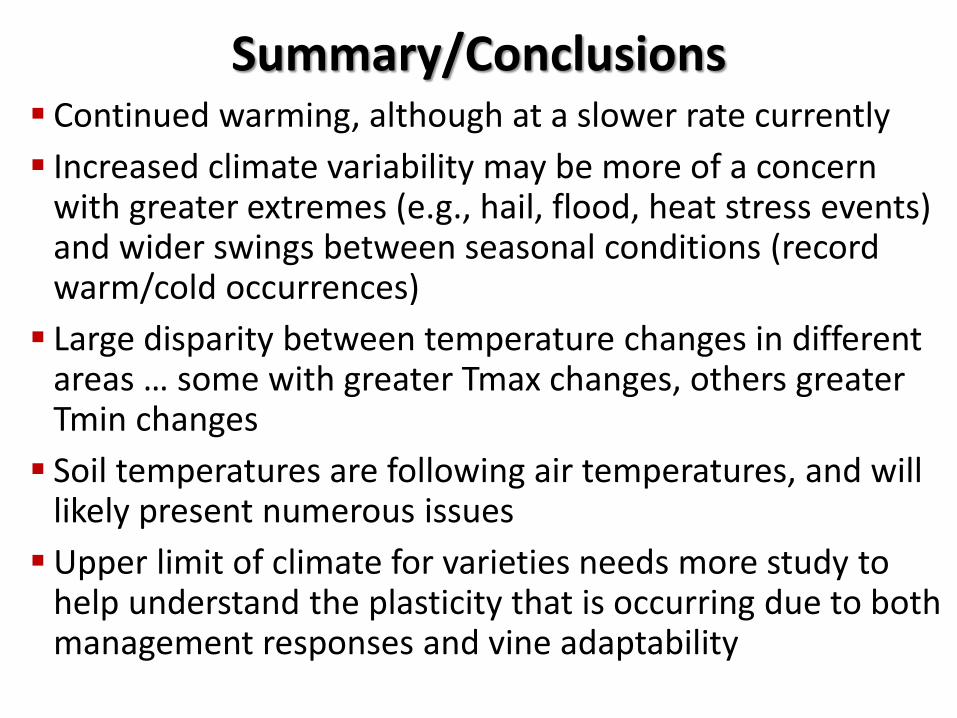
Summary/Conclusions Continued warming, although at a slower rate currently
Increased climate variability may be more of a concern with greater extremes (e.g., hail, flood, heat stress events) and wider swings between seasonal conditions (record warm/cold occurrences)
Large disparity between temperature changes in different areas … some with greater Tmax changes, others greater Tmin changes
Soil temperatures are following air temperatures, and will likely present numerous issues
Upper limit of climate for varieties needs more study to help understand the plasticity that is occurring due to both management responses and vine adaptability
Growers/Producers continually undergo tactical and strategic changes to climatic conditions, but not in isolation
Growers/Producers operate in a multi-risk environment (climate, markets, policy) and the status of adaptation determines future vulnerabilities
The gradual nature of climate change should provide growers/producers sufficient time to develop/utilize adaptation strategies
However, research/innovation/technology transfer must be done to minimize vulnerability and maximize adaptive capacity
Summary/Conclusions
Summary/Conclusions While challenges exist for all regions, opportunities for a
more sustainable industry through reduced vulnerability and increased adaptive capacity are being addressed in the industry and the research community:
− Realizing the large genetic potential for adaptation
− Realizing the large landscape potential for adaptation
− Potential changes in traditional training systems
− Optimization of canopy geometry, row orientation, and increasing the use of shading materials
− Improved understanding of scion-rootstock combinations for a region’s soils and climate
− Improved grapevine water use efficiency and irrigation management, where necessary/possible
Thank YouGregory V. Jones
Director: Business, Communication and the EnvironmentProfessor: Environmental Science and Policy