Embed Size (px)
Citation preview
DEPARTMENT OF ENVIRONMENTAL AFFAIRS AEnvironmental AffairsDepartment:
REPUBLIC OF SOUTH AFRICA
environmental affairs
Climate Change adaptation plans for south afriCan
Biomes

Climate Change adaptation plans for south afriCan Biomes
DepArtment of environmentAl AffAirs
2015
2016
Design and Layout by
Chief Directorate: Communications
Private Bag X447, Pretoria 0001
Authors:
Claire Davis1, Luthando Dziba1, Bob Scholes2, Emma Archer van Garderen1, Graham von Maltitz1, David Le Maitre1, Sally Archibald2, Daleen Lotter, Heidi van Deventer, Guy Midgley3 and Timm Hoffman4
1 Natural Resources and Environment, Council for Scientific and Industrial Research2 School of Animal, Plant and Environmental Sciences, University of Witwatersrand3 Department of Botany and Zoology, Stellenbosch University4 Plant Conservation Unit, Department of Biological Science, University of Cape Town
Citation:
Department of Environmental Affairs. 2015. Climate Change Adaptation Plans for South African Biomes (ed. Kharika, J.R.M., Mkhize, N.C.S., Munyai, T., Khavhagali, V.P., Davis, C., Dziba, D., Scholes, R., van Garderen, E., von Maltitz, G., Le Maitre, D., Archibald, S., Lotter, D., van Deventer, H., Midgely, G. and Hoffman, T). Pretoria.
photo credits:
Figures produced by NRE-CSIR.
Protea photo by Davis, C
foreWorD ..................................................................................................................................................................................vi
exeCutive summAry ............................................................................................................................................................... vii
1. introDuCtion .........................................................................................................................................................................1
1.1 Background...............................................................................................................................................................................11.2. Developing climate change adaptation plans for south African biomes ..........................................................................21.3 scope and objective of report ................................................................................................................................................3
2. Biomes of south AfriCA ....................................................................................................................................................4
2.1 non-climatic drivers of ecosystem change in the biomes ..................................................................................................5
3. Biome ADAptAtion plAns ....................................................................................................................................................8
3.1 Albany thicket .........................................................................................................................................................................83.1.1 Description of the biome ..........................................................................................................................................................83.1.2 Vulnerability to climate change ...............................................................................................................................................93.1.3 Adaptation options ................................................................................................................................................................103.2 Desert and nama Karoo Biomes ..........................................................................................................................................123.2.1 Description of the biomes .....................................................................................................................................................123.2.2 Vulnerability to climate change .............................................................................................................................................133.2.3 Adaptation options ................................................................................................................................................................143.3 forest ......................................................................................................................................................................................163.3.1 Description of the biome ........................................................................................................................................................163.3.2 Vulnerability to climate change .............................................................................................................................................183.3.3 Adaptation options ................................................................................................................................................................213.4 fynbos ....................................................................................................................................................................................233.4.1 Description of the biome .......................................................................................................................................................233.4.2 Key drivers and processes of change in the biome ..............................................................................................................243.4.3 Vulnerability of the biome to climate change ........................................................................................................................253.4.4 Adaptation practices and options in the fynbos biome .........................................................................................................263.5 Grassland ...............................................................................................................................................................................283.5.1 Description of the biome .......................................................................................................................................................283.5.2 Vulnerability to climate change .............................................................................................................................................303.5.3 Adaptation options ................................................................................................................................................................313.6 indian ocean Coastal Belt ....................................................................................................................................................343.6.1 Description of the biome .......................................................................................................................................................343.6.2 Vulnerability to climate change .............................................................................................................................................363.6.3 Adaptation options ................................................................................................................................................................373.7 savanna ..................................................................................................................................................................................383.7.1 Description of the biome .......................................................................................................................................................383.7.2 Vulnerability to climate change .............................................................................................................................................393.7.3 Adaptation options ................................................................................................................................................................403.8 succulent Karoo ....................................................................................................................................................................423.8.1 Description of the biome .......................................................................................................................................................423.8.2 Key drivers and processes of change in the biome ..............................................................................................................433.8.3 Vulnerability to climate change .............................................................................................................................................443.8.4 Adaptation options ................................................................................................................................................................46
4. poliCy options for enhAnCinG resilienCe of Biomes to ClimAte ChAnGe ..................................................49
5. ACKnoWleDGements .........................................................................................................................................................50
6. referenCes ..........................................................................................................................................................................51
Contents
list of fiGures
figure 1: Illustration of ecosystem-based adaptation (EbA), (Stocker et al. 2013). The white box refers to the adverse impacts of climate change process that are likely to occur without EbA while the outer blue box refers to examples of EbA that may reduce climate –related risks to human systems and may provide mitigation benefits............................................................................................................................................................3
figure 2: The biomes of South Africa (Mucina & Rutherford 2006; DEA 2013). .............................................................................4figure 3: Map of the Conservation Areas and Protected Areas (PACA). Data source:
DEA Protected Areas Database ......................................................................................................................................5figure 4: The proportion of each biome formally protected (expressed as % area), versus
biome size (protected areas data from NBA, 2011) .........................................................................................................5figure 5: Map of the transformed versus natural areas of South Africa. Data source:
SANBI 2009. ....................................................................................................................................................................6figure 6: The proportion of each biome that has been degraded or
transformed (expressed as a % area), (Mucina & Rutherford 2006a; SANBI 2009). ......................................................7figure 7: The estimated total percentage cover of invasive alien plant species for each primary
catchment as mapped by the National invasive Alien Plant Survey (Kotzé et al. 2010). The area shown in grey was not included in the mapping. The white areas comprising Lesotho and Swaziland, and areas mapped as transformed by cultivation or urbanisation in the Land Cover 2000 study (van den Berg et al. 2008), were excluded from the landscape dataset (after Le Maitre et al. 2013). ....................................7
figure 8: SKEP Priority Areas (Driver & Maze 2002) ...................................................................................................................48
list of tABles
table 1: The estimated range of the invasions in each of the biomes included in the landscape mapping for South Africa by Kotzé et al. (2010). The condensed hectare is a way of comparing invasions of different densities; an invasion covering 25% of 100 ha is mathematically equivalent to a condensed area of 25ha with 100% cover (after Le Maitre et al. 2013) . .......................................................................................................................8
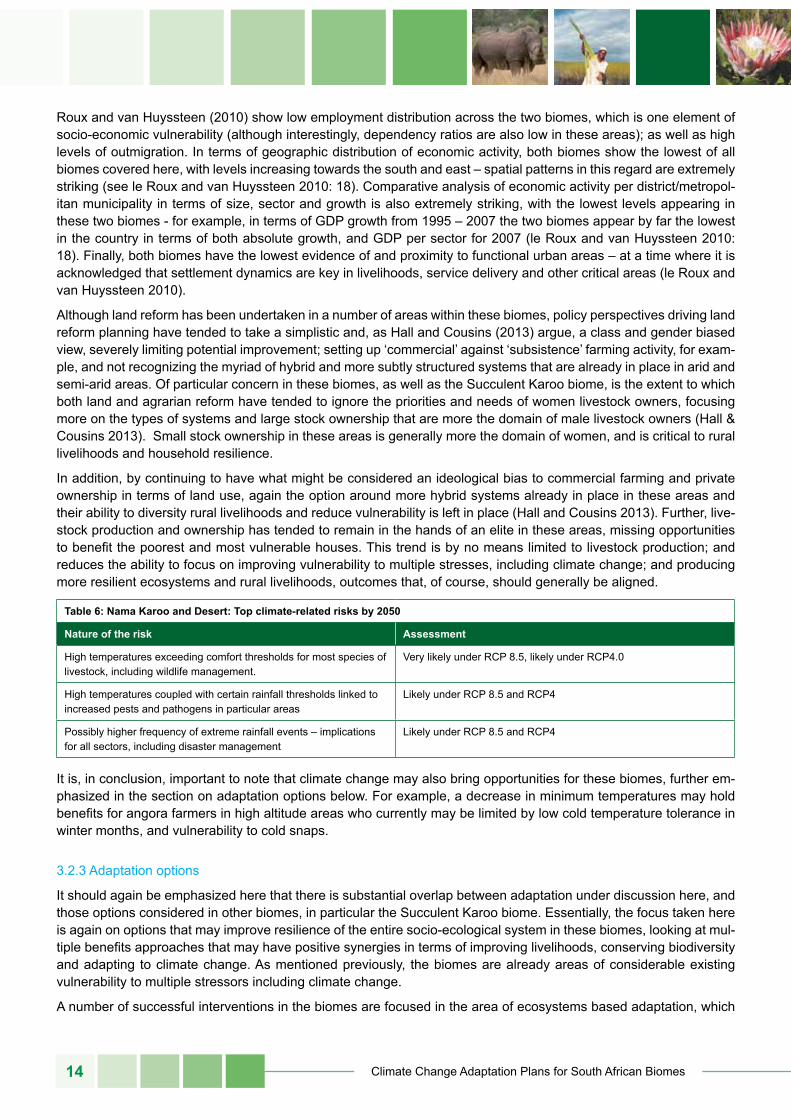
table 2: Albany Thicket: Top ecosystem services ........................................................................................................................9table 3: Albany Thicket: Top climate-related risks by 2050 .......................................................................................................10table 4: Albany Thicket: Top climate-related adaptation options ...............................................................................................10table 5: Nama Karoo and Desert: Top ecosystem services .......................................................................................................13table 6: Nama Karoo and Desert: Top climate-related risks by 2050 ........................................................................................14table 7: Nama Karoo and Desert: Top climate-related adaptation options ................................................................................15table 8: Forest: Top ecosystem services ...................................................................................................................................18table 9: Forest: Top climate-related risks by 2050 .....................................................................................................................21table 10: Forest: Top climate-related adaptation options .............................................................................................................22table 11: Fynbos: Top ecosystem services ..................................................................................................................................25table 12: Fynbos: Top climate-related risks by 2050 ...................................................................................................................26table 13: Fynbos: Top climate-related adaptation options ...........................................................................................................27table 14: Grassland: Top ecosystem services .............................................................................................................................30table 15: Grassland: Top climate-related risks by 2050 ...............................................................................................................31table 16: Grassland: Top climate-related adaptation options ......................................................................................................32table 17: IOCB: Top ecosystem services .....................................................................................................................................36table 18: IOCB: Top climate-related risks by 2050 ......................................................................................................................37table 19: IOCB: Top climate-related adaptation options ..............................................................................................................38table 20: Savanna: Top ecosystem services ...............................................................................................................................39table 21: Savanna: Top climate-related risks by 2050 .................................................................................................................40table 22: Savanna: Top climate-related adaptation options .........................................................................................................41table 23: Succulent Karoo: Top ecosystem services (after Le Maitre et al. 2009) .......................................................................43
table 24: Succulent Karoo: Top climate-related risks by 2050 .....................................................................................................46table 25: Succulent Karoo: Top climate-related adaptation options .............................................................................................46
list of Boxes
Box 1: Future climate scenarios for South Africa .......................................................................................................................2Box 2: Project for Ecosystem Services ......................................................................................................................................3Box 3: The Greater Addo conservation area ...........................................................................................................................11Box 4: The Baviaanskloof Thicket Restoration project .............................................................................................................12Box 5: The southern Cape forestry region ................................................................................................................................23Box 6: Case studies on changes in the distribution of species in the Fynbos ..........................................................................28Box 7: Anticipating surprises in the Fynbos biome ...................................................................................................................28Box 8: The Maloti-Drakensberg Transfrontier Park ..................................................................................................................33Box 9: Working for water, fire and wetlands .............................................................................................................................33Box 10: The iSimangaliso Wetland Authority park ....................................................................................................................38Box 11: The Wild Coast Conservation initiatives ........................................................................................................................38Box 12: Impacts of rural electrification on fuelwood extraction ...................................................................................................41Box 13: The Succulent Karoo Ecosystem Programme (SKEP)..................................................................................................48Box 14: The Biodiversity Ostrich Initiative Project ......................................................................................................................48
foreWorD
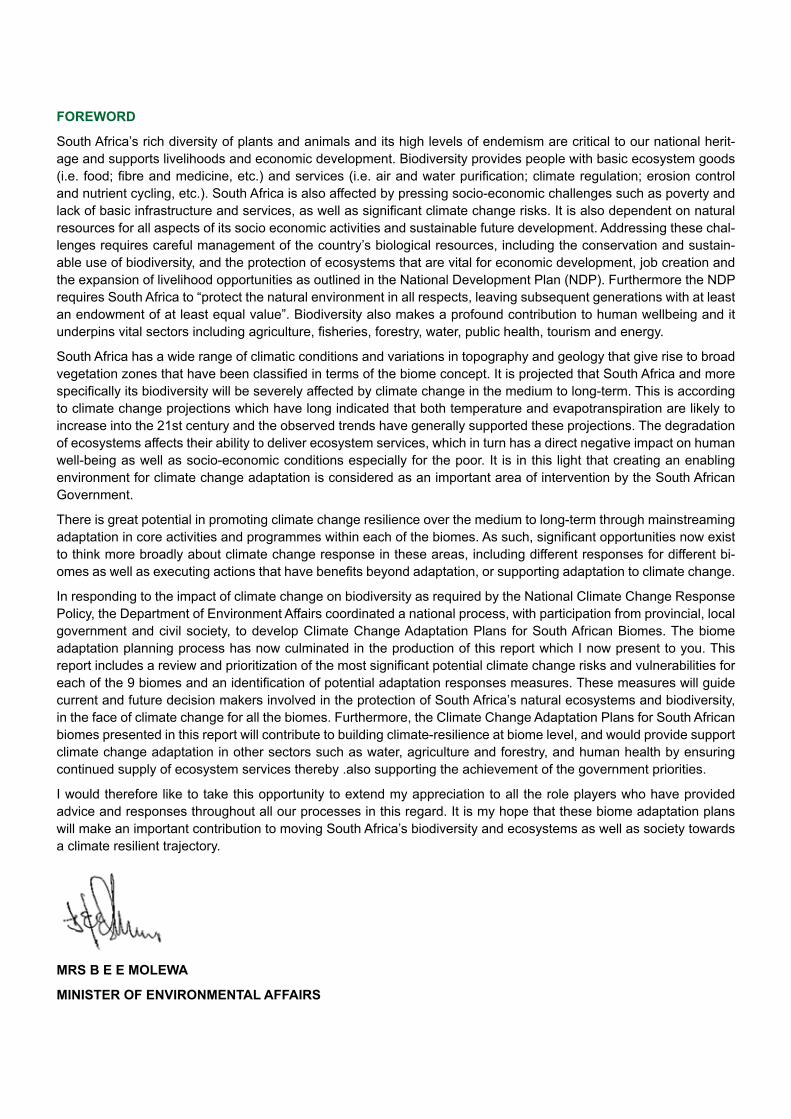
South Africa’s rich diversity of plants and animals and its high levels of endemism are critical to our national herit-age and supports livelihoods and economic development. Biodiversity provides people with basic ecosystem goods (i.e. food; fibre and medicine, etc.) and services (i.e. air and water purification; climate regulation; erosion control and nutrient cycling, etc.). South Africa is also affected by pressing socio-economic challenges such as poverty and lack of basic infrastructure and services, as well as significant climate change risks. It is also dependent on natural resources for all aspects of its socio economic activities and sustainable future development. Addressing these chal-lenges requires careful management of the country’s biological resources, including the conservation and sustain-able use of biodiversity, and the protection of ecosystems that are vital for economic development, job creation and the expansion of livelihood opportunities as outlined in the National Development Plan (NDP). Furthermore the NDP requires South Africa to “protect the natural environment in all respects, leaving subsequent generations with at least an endowment of at least equal value”. Biodiversity also makes a profound contribution to human wellbeing and it underpins vital sectors including agriculture, fisheries, forestry, water, public health, tourism and energy.
South Africa has a wide range of climatic conditions and variations in topography and geology that give rise to broad vegetation zones that have been classified in terms of the biome concept. It is projected that South Africa and more specifically its biodiversity will be severely affected by climate change in the medium to long-term. This is according to climate change projections which have long indicated that both temperature and evapotranspiration are likely to increase into the 21st century and the observed trends have generally supported these projections. The degradation of ecosystems affects their ability to deliver ecosystem services, which in turn has a direct negative impact on human well-being as well as socio-economic conditions especially for the poor. It is in this light that creating an enabling environment for climate change adaptation is considered as an important area of intervention by the South African Government.
There is great potential in promoting climate change resilience over the medium to long-term through mainstreaming adaptation in core activities and programmes within each of the biomes. As such, significant opportunities now exist to think more broadly about climate change response in these areas, including different responses for different bi-omes as well as executing actions that have benefits beyond adaptation, or supporting adaptation to climate change.
In responding to the impact of climate change on biodiversity as required by the National Climate Change Response Policy, the Department of Environment Affairs coordinated a national process, with participation from provincial, local government and civil society, to develop Climate Change Adaptation Plans for South African Biomes. The biome adaptation planning process has now culminated in the production of this report which I now present to you. This report includes a review and prioritization of the most significant potential climate change risks and vulnerabilities for each of the 9 biomes and an identification of potential adaptation responses measures. These measures will guide current and future decision makers involved in the protection of South Africa’s natural ecosystems and biodiversity, in the face of climate change for all the biomes. Furthermore, the Climate Change Adaptation Plans for South African biomes presented in this report will contribute to building climate-resilience at biome level, and would provide support climate change adaptation in other sectors such as water, agriculture and forestry, and human health by ensuring continued supply of ecosystem services thereby .also supporting the achievement of the government priorities.
I would therefore like to take this opportunity to extend my appreciation to all the role players who have provided advice and responses throughout all our processes in this regard. It is my hope that these biome adaptation plans will make an important contribution to moving South Africa’s biodiversity and ecosystems as well as society towards a climate resilient trajectory.
mrs B e e moleWA
minister of environmentAl AffAirs
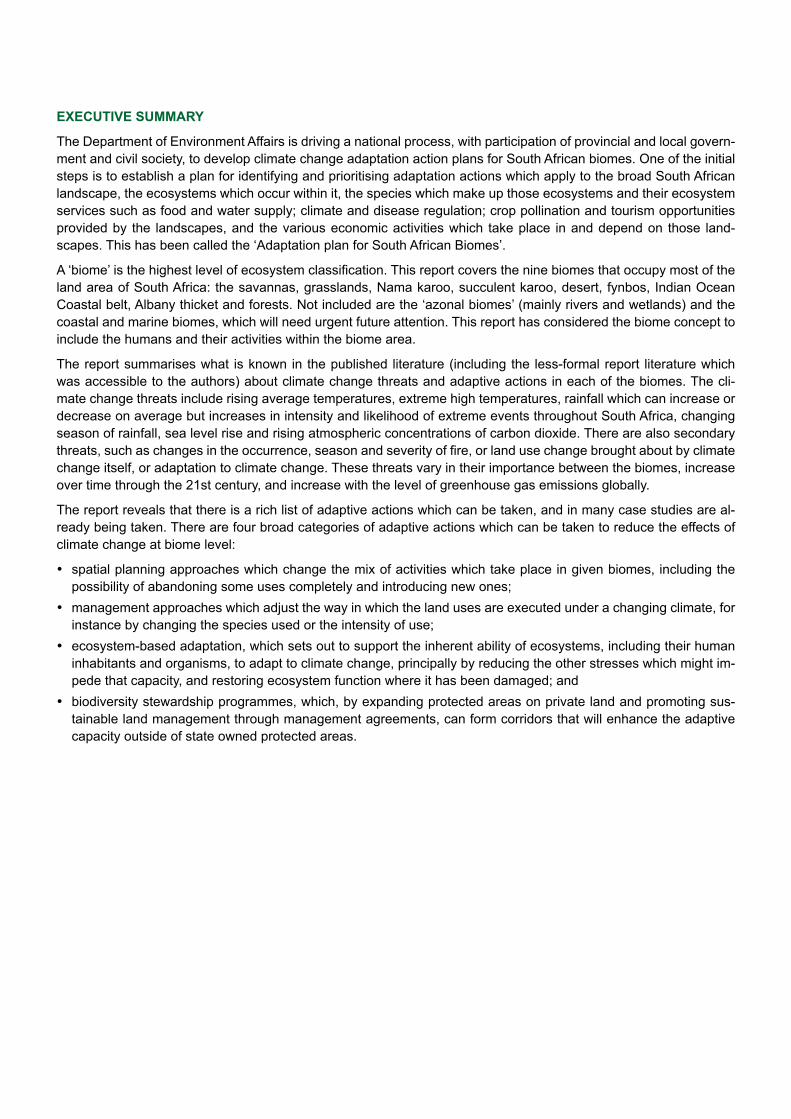
exeCutive summAry
The Department of Environment Affairs is driving a national process, with participation of provincial and local govern-ment and civil society, to develop climate change adaptation action plans for South African biomes. One of the initial steps is to establish a plan for identifying and prioritising adaptation actions which apply to the broad South African landscape, the ecosystems which occur within it, the species which make up those ecosystems and their ecosystem services such as food and water supply; climate and disease regulation; crop pollination and tourism opportunities provided by the landscapes, and the various economic activities which take place in and depend on those land-scapes. This has been called the ‘Adaptation plan for South African Biomes’.
A ‘biome’ is the highest level of ecosystem classification. This report covers the nine biomes that occupy most of the land area of South Africa: the savannas, grasslands, Nama karoo, succulent karoo, desert, fynbos, Indian Ocean Coastal belt, Albany thicket and forests. Not included are the ‘azonal biomes’ (mainly rivers and wetlands) and the coastal and marine biomes, which will need urgent future attention. This report has considered the biome concept to include the humans and their activities within the biome area.
The report summarises what is known in the published literature (including the less-formal report literature which was accessible to the authors) about climate change threats and adaptive actions in each of the biomes. The cli-mate change threats include rising average temperatures, extreme high temperatures, rainfall which can increase or decrease on average but increases in intensity and likelihood of extreme events throughout South Africa, changing season of rainfall, sea level rise and rising atmospheric concentrations of carbon dioxide. There are also secondary threats, such as changes in the occurrence, season and severity of fire, or land use change brought about by climate change itself, or adaptation to climate change. These threats vary in their importance between the biomes, increase over time through the 21st century, and increase with the level of greenhouse gas emissions globally.
The report reveals that there is a rich list of adaptive actions which can be taken, and in many case studies are al-ready being taken. There are four broad categories of adaptive actions which can be taken to reduce the effects of climate change at biome level:
• spatial planning approaches which change the mix of activities which take place in given biomes, including the possibility of abandoning some uses completely and introducing new ones;
• management approaches which adjust the way in which the land uses are executed under a changing climate, for instance by changing the species used or the intensity of use;
• ecosystem-based adaptation, which sets out to support the inherent ability of ecosystems, including their human inhabitants and organisms, to adapt to climate change, principally by reducing the other stresses which might im-pede that capacity, and restoring ecosystem function where it has been damaged; and
• biodiversity stewardship programmes, which, by expanding protected areas on private land and promoting sus-tainable land management through management agreements, can form corridors that will enhance the adaptive capacity outside of state owned protected areas.
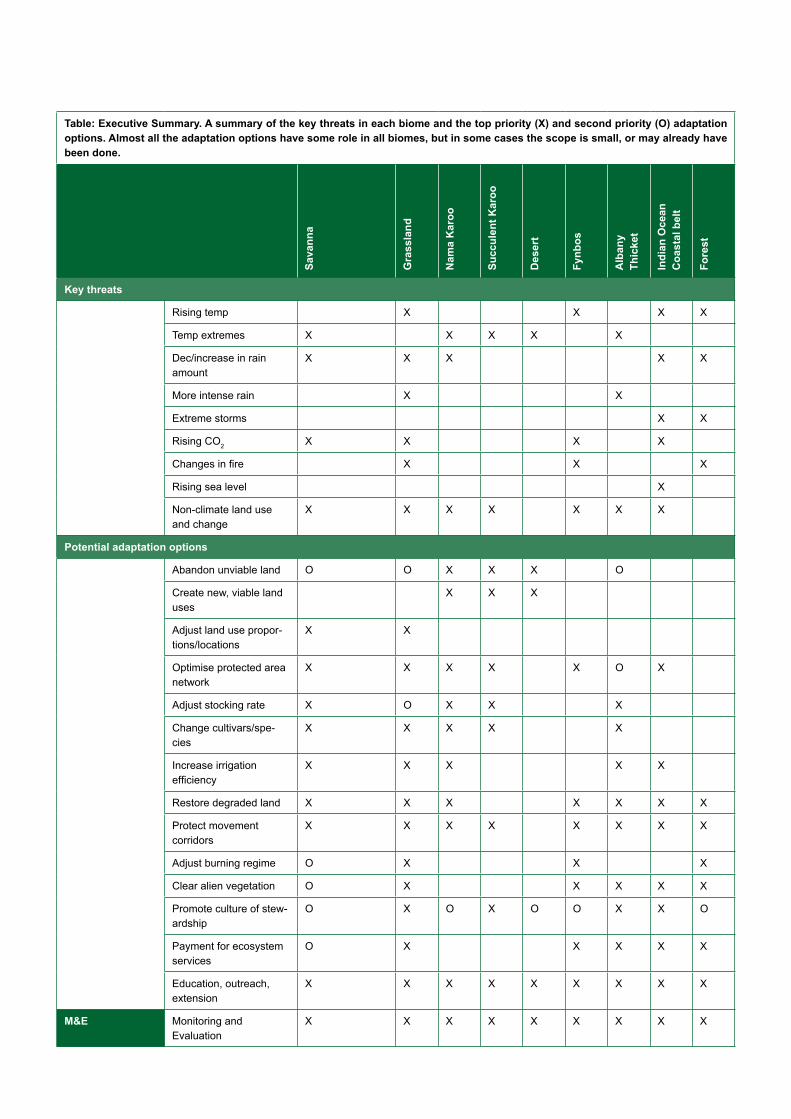
table: executive summary. A summary of the key threats in each biome and the top priority (x) and second priority (o) adaptation options. Almost all the adaptation options have some role in all biomes, but in some cases the scope is small, or may already have been done.
sava
nna
Gra
ssla
nd
nam
a K
aroo
succ
ulen
t Kar
oo
Des
ert
fynb
os
Alb
any
thic
ket
indi
an o
cean
C
oast
al b
elt
fore
st
Key threats
threats
Rising temp X X X X
Temp extremes X X X X X
Dec/increase in rain amount
X X X X X
More intense rain X X
Extreme storms X X
Rising CO2 X X X X
Changes in fire X X X
Rising sea level X
Non-climate land use and change
X X X X X X X
potential adaptation options
land use plan-ning
Abandon unviable land O O X X X O
Create new, viable land uses
X X X
Adjust land use propor-tions/locations
X X
Optimise protected area network
X X X X X O X
land manage-ment
Adjust stocking rate X O X X X
Change cultivars/spe-cies
X X X X X
Increase irrigation efficiency
X X X X X
ecosystem-based adaptation
Restore degraded land X X X X X X X
Protect movement corridors
X X X X X X X X
Adjust burning regime O X X X
Clear alien vegetation O X X X X X
mainstreaming Promote culture of stew-ardship
O X O X O O X X O
Payment for ecosystem services
O X X X X X
Education, outreach, extension
X X X X X X X X X
m&e Monitoring and Evaluation
X X X X X X X X X
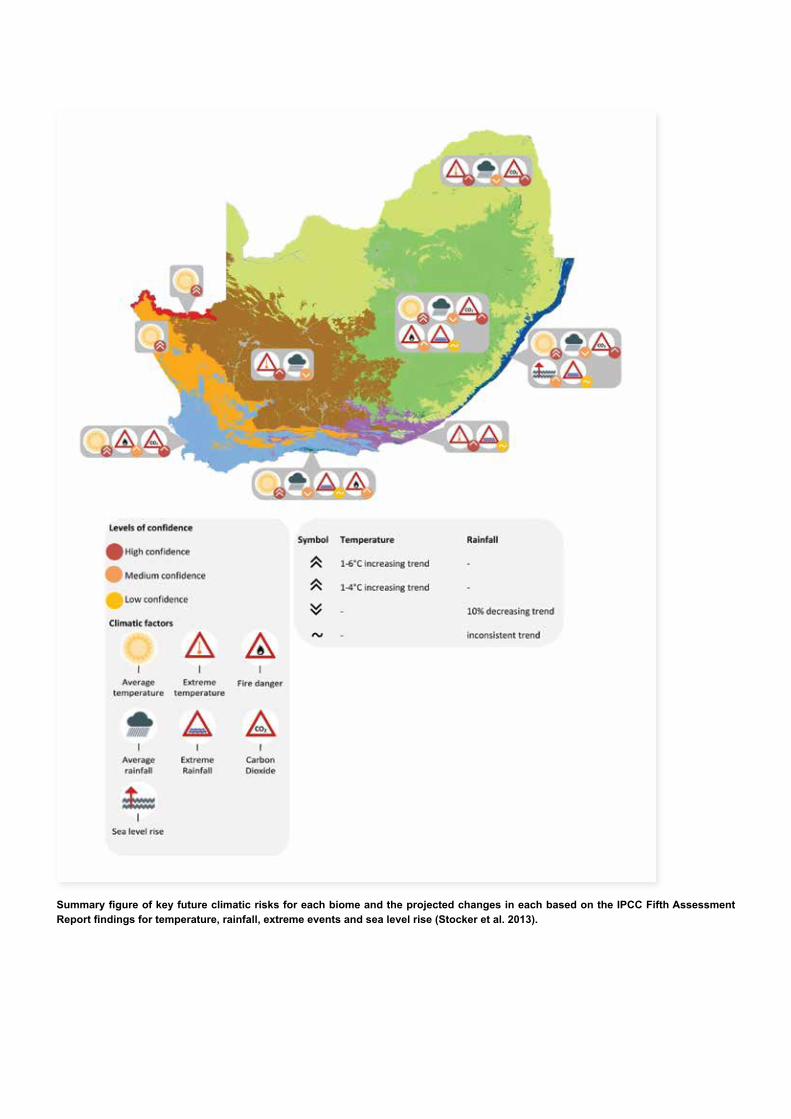
Summary figure of key future climatic risks for each biome and the projected changes in each based on the IPCC Fifth Assessment Report findings for temperature, rainfall, extreme events and sea level rise (Stocker et al. 2013).

Summary figure of key non-climatic risks for each biome
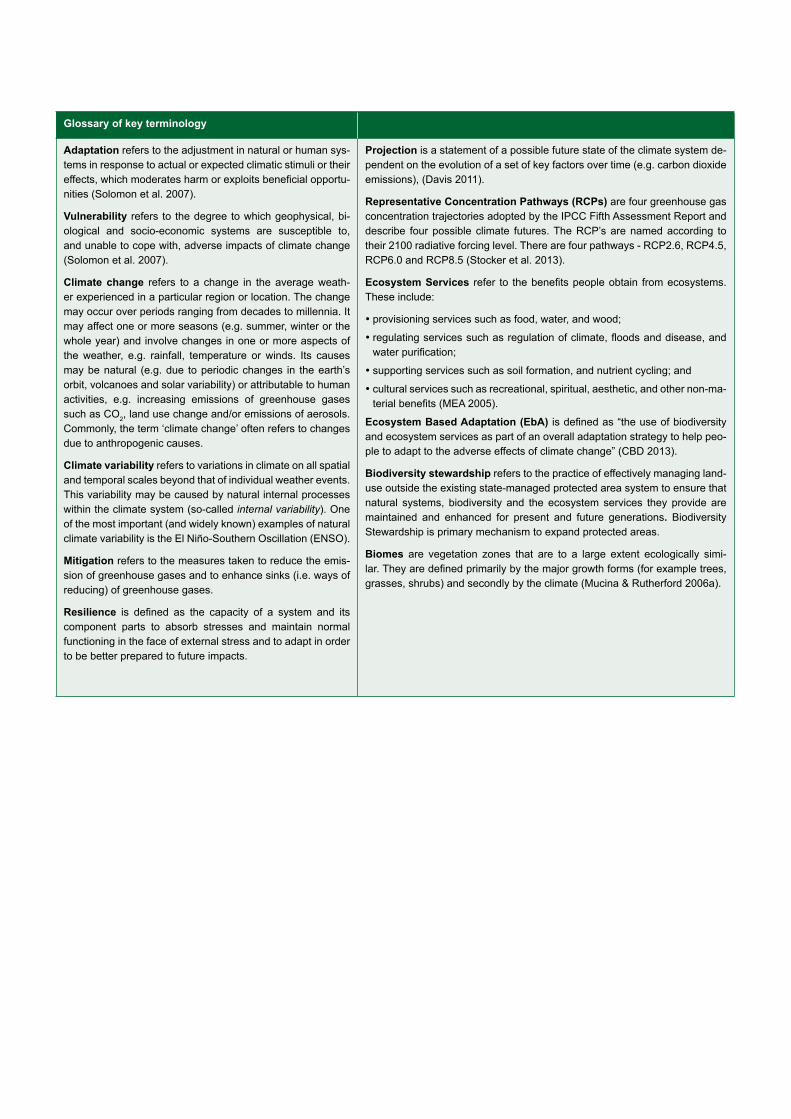
Glossary of key terminology
Adaptation refers to the adjustment in natural or human sys-tems in response to actual or expected climatic stimuli or their effects, which moderates harm or exploits beneficial opportu-nities (Solomon et al. 2007).
vulnerability refers to the degree to which geophysical, bi-ological and socio-economic systems are susceptible to, and unable to cope with, adverse impacts of climate change (Solomon et al. 2007).
Climate change refers to a change in the average weath-er experienced in a particular region or location. The change may occur over periods ranging from decades to millennia. It may affect one or more seasons (e.g. summer, winter or the whole year) and involve changes in one or more aspects of the weather, e.g. rainfall, temperature or winds. Its causes may be natural (e.g. due to periodic changes in the earth’s orbit, volcanoes and solar variability) or attributable to human activities, e.g. increasing emissions of greenhouse gases such as CO2, land use change and/or emissions of aerosols. Commonly, the term ‘climate change’ often refers to changes due to anthropogenic causes.
Climate variability refers to variations in climate on all spatial and temporal scales beyond that of individual weather events. This variability may be caused by natural internal processes within the climate system (so-called internal variability). One of the most important (and widely known) examples of natural climate variability is the El Niño-Southern Oscillation (ENSO).
mitigation refers to the measures taken to reduce the emis-sion of greenhouse gases and to enhance sinks (i.e. ways of reducing) of greenhouse gases.
resilience is defined as the capacity of a system and its component parts to absorb stresses and maintain normal functioning in the face of external stress and to adapt in order to be better prepared to future impacts.
projection is a statement of a possible future state of the climate system de-pendent on the evolution of a set of key factors over time (e.g. carbon dioxide emissions), (Davis 2011).
representative Concentration pathways (rCps) are four greenhouse gas concentration trajectories adopted by the IPCC Fifth Assessment Report and describe four possible climate futures. The RCP’s are named according to their 2100 radiative forcing level. There are four pathways - RCP2.6, RCP4.5, RCP6.0 and RCP8.5 (Stocker et al. 2013).
ecosystem services refer to the benefits people obtain from ecosystems. These include:
•provisioning services such as food, water, and wood;
•regulating services such as regulation of climate, floods and disease, and water purification;
•supporting services such as soil formation, and nutrient cycling; and
•cultural services such as recreational, spiritual, aesthetic, and other non-ma-terial benefits (MEA 2005).
ecosystem Based Adaptation (ebA) is defined as “the use of biodiversity and ecosystem services as part of an overall adaptation strategy to help peo-ple to adapt to the adverse effects of climate change” (CBD 2013).
Biodiversity stewardship refers to the practice of effectively managing land-use outside the existing state-managed protected area system to ensure that natural systems, biodiversity and the ecosystem services they provide are maintained and enhanced for present and future generations. Biodiversity Stewardship is primary mechanism to expand protected areas.
Biomes are vegetation zones that are to a large extent ecologically simi-lar. They are defined primarily by the major growth forms (for example trees, grasses, shrubs) and secondly by the climate (Mucina & Rutherford 2006a).

DEPARTMENT OF ENVIRONMENTAL AFFAIRS 1
1. introDuCtion
1.1 BackgroundSouth Africa is predicted to be severely affected by climate change and creating an enabling environment for ad-aptation is considered a priority area by the government (Archer et al. 2008; Stocker et al. 2013; Department of Environmental Affairs 2013). Climate change projections have long indicated that both temperature and evapotran-spiration are likely to increase into the 21st century (Department of Environmental Affairs 2013), and observed trends have generally supported these projections (Stocker et al. 2013; Department of Environmental Affairs 2013). Climate change is expected to alter the magnitude, timing, and distribution of storms that produce flood events as well as the frequency and intensity of drought events (Fauchereau et al. 2003; Engelbrecht et al 2010; Tadross et al. 2011).
The projected changes in climate (refer to Box 1) have been predicted to have a variety of impacts on South African Biomes (Midgley et al. 2002; Driver 2005; DEA 2013). Understanding how these climatic changes, coupled with existing stressors such as land-use change, will impact South Africa’s biomes is essential for understanding likely changes in ecosystem services and improve strategic adaptation responses (Solomon et al. 2007).
South Africa’s rich diversity of plants and animals and its high levels of endemism are critical to our national heritage and support livelihoods and economic development (e.g. through ecotourism). For instance, three of the 34 inter-nationally identified biodiversity ‘hotspots’ are located in South Africa, namely the Cape Floristic Region, Succulent Karoo, and Maputaland-Pondoland-Albany. These ‘hotspots’ contain high concentrations of endemic plant and an-imal species but these mainly occur in areas that are most threatened by human activity. However, most of South Africa’s ecosystems (including rivers, estuaries, forests, mangroves, grasslands, marine and other terrestrial eco-systems) are exposed to significant risks and many are considered critically endangered (Driver 2005; Driver et al. 2012). In addition to climate change, invasions by alien species, land use change and other drivers of change threat-en endemic populations (Midgley et al. 2003; van Wilgen et al. 2008).
South Africa’s National Spatial Biodiversity Assessment (Driver 2005) found that 34% of terrestrial ecosystems, 82% of the main river ecosystems and 65% of marine ecosystems are threatened, with few of these threatened ecosys-tems currently afforded any formal protection. The 2011 National Biodiversity Assessment (Driver et al. 2012) found that 40% of terrestrial, 57% of the rivers, 65% of the wetlands, 44% of estuaries, 41% of offshore and 59% of coastal and inshore ecosystems are threatened, with few of these threatened ecosystems currently afforded any formal protection.
The Vulnerability Assessment (DEA 2012) showed that climate change projections will lead to significant changes across the biomes through the alteration of existing habitats, seasonal rainfall, species distribution, and ecosystems. Climate change will also lead to changes in species distribution through shifting habitat, changing life cycles, and de-velopment of new physical traits1. The National Biodiversity Assessment Report (Driver et al. 2012) identified areas where biomes are most likely to be at risk as a result of climate change as well as areas where biomes are most likely to maintain stable ecological composition and structure in the face of climate change. There are, however, substantial uncertainties inherent in such bioclimatic envelope modelling approaches (Pearson & Dawson 2003; Huntley et al. 2010; Araújo & Peterson 2012) and little effort has been made to assess their key assumptions by relating them to quantitatively-measured vegetation data. Furthermore, exactly how these climate-driven changes are likely to mani-fest themselves in the context of the complex range of land-use activities in the region remains unclear.
1 This refers to species adapting to changing conditions through ‘plasticity’, which is the ability of organisms to respond to climate change, such as changes in temperature, without any genetic changes.
Climate Change Adaptation Plans for South African Biomes2
Box 1: future climate scenarios for south Africa
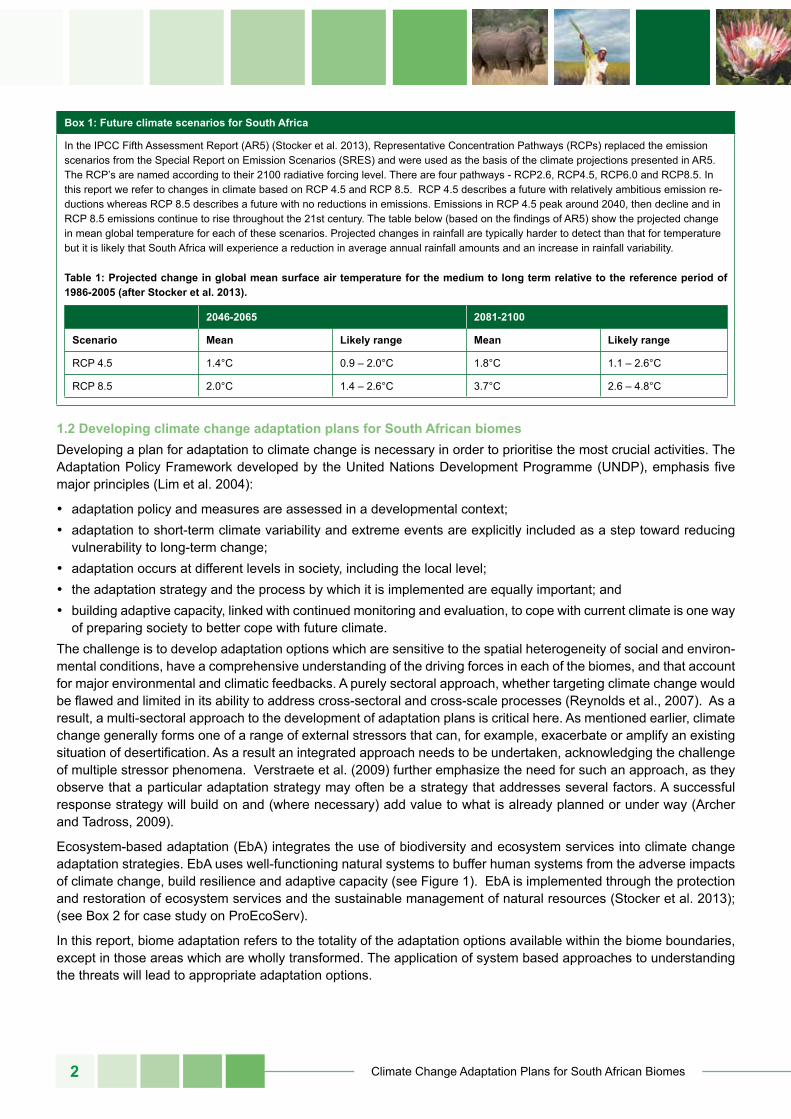
In the IPCC Fifth Assessment Report (AR5) (Stocker et al. 2013), Representative Concentration Pathways (RCPs) replaced the emission scenarios from the Special Report on Emission Scenarios (SRES) and were used as the basis of the climate projections presented in AR5. The RCP’s are named according to their 2100 radiative forcing level. There are four pathways - RCP2.6, RCP4.5, RCP6.0 and RCP8.5. In this report we refer to changes in climate based on RCP 4.5 and RCP 8.5. RCP 4.5 describes a future with relatively ambitious emission re-ductions whereas RCP 8.5 describes a future with no reductions in emissions. Emissions in RCP 4.5 peak around 2040, then decline and in RCP 8.5 emissions continue to rise throughout the 21st century. The table below (based on the findings of AR5) show the projected change in mean global temperature for each of these scenarios. Projected changes in rainfall are typically harder to detect than that for temperature but it is likely that South Africa will experience a reduction in average annual rainfall amounts and an increase in rainfall variability.
table 1: projected change in global mean surface air temperature for the medium to long term relative to the reference period of 1986-2005 (after stocker et al. 2013).
2046-2065 2081-2100
scenario mean likely range mean likely range
RCP 4.5 1.4°C 0.9 – 2.0°C 1.8°C 1.1 – 2.6°C
RCP 8.5 2.0°C 1.4 – 2.6°C 3.7°C 2.6 – 4.8°C
1.2 Developing climate change adaptation plans for south African biomesDeveloping a plan for adaptation to climate change is necessary in order to prioritise the most crucial activities. The Adaptation Policy Framework developed by the United Nations Development Programme (UNDP), emphasis five major principles (Lim et al. 2004):
• adaptation policy and measures are assessed in a developmental context;• adaptation to short-term climate variability and extreme events are explicitly included as a step toward reducing
vulnerability to long-term change; • adaptation occurs at different levels in society, including the local level; • the adaptation strategy and the process by which it is implemented are equally important; and• building adaptive capacity, linked with continued monitoring and evaluation, to cope with current climate is one way
of preparing society to better cope with future climate. The challenge is to develop adaptation options which are sensitive to the spatial heterogeneity of social and environ-mental conditions, have a comprehensive understanding of the driving forces in each of the biomes, and that account for major environmental and climatic feedbacks. A purely sectoral approach, whether targeting climate change would be flawed and limited in its ability to address cross-sectoral and cross-scale processes (Reynolds et al., 2007). As a result, a multi-sectoral approach to the development of adaptation plans is critical here. As mentioned earlier, climate change generally forms one of a range of external stressors that can, for example, exacerbate or amplify an existing situation of desertification. As a result an integrated approach needs to be undertaken, acknowledging the challenge of multiple stressor phenomena. Verstraete et al. (2009) further emphasize the need for such an approach, as they observe that a particular adaptation strategy may often be a strategy that addresses several factors. A successful response strategy will build on and (where necessary) add value to what is already planned or under way (Archer and Tadross, 2009).
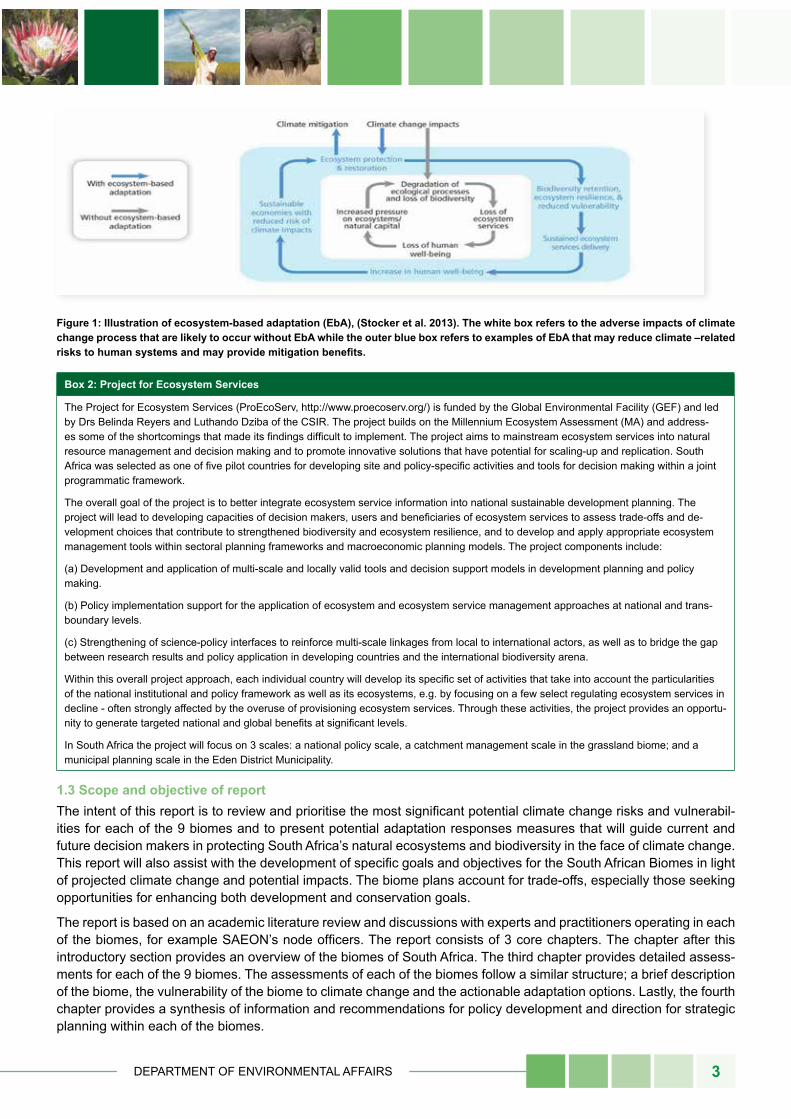
Ecosystem-based adaptation (EbA) integrates the use of biodiversity and ecosystem services into climate change adaptation strategies. EbA uses well-functioning natural systems to buffer human systems from the adverse impacts of climate change, build resilience and adaptive capacity (see Figure 1). EbA is implemented through the protection and restoration of ecosystem services and the sustainable management of natural resources (Stocker et al. 2013); (see Box 2 for case study on ProEcoServ).
In this report, biome adaptation refers to the totality of the adaptation options available within the biome boundaries, except in those areas which are wholly transformed. The application of system based approaches to understanding the threats will lead to appropriate adaptation options.
DEPARTMENT OF ENVIRONMENTAL AFFAIRS 3
figure 1: illustration of ecosystem-based adaptation (ebA), (stocker et al. 2013). the white box refers to the adverse impacts of climate change process that are likely to occur without ebA while the outer blue box refers to examples of ebA that may reduce climate –related risks to human systems and may provide mitigation benefits.
Box 2: project for ecosystem services
The Project for Ecosystem Services (ProEcoServ, http://www.proecoserv.org/) is funded by the Global Environmental Facility (GEF) and led by Drs Belinda Reyers and Luthando Dziba of the CSIR. The project builds on the Millennium Ecosystem Assessment (MA) and address-es some of the shortcomings that made its findings difficult to implement. The project aims to mainstream ecosystem services into natural resource management and decision making and to promote innovative solutions that have potential for scaling-up and replication. South Africa was selected as one of five pilot countries for developing site and policy-specific activities and tools for decision making within a joint programmatic framework.
The overall goal of the project is to better integrate ecosystem service information into national sustainable development planning. The project will lead to developing capacities of decision makers, users and beneficiaries of ecosystem services to assess trade-offs and de-velopment choices that contribute to strengthened biodiversity and ecosystem resilience, and to develop and apply appropriate ecosystem management tools within sectoral planning frameworks and macroeconomic planning models. The project components include:
(a) Development and application of multi-scale and locally valid tools and decision support models in development planning and policy making.
(b) Policy implementation support for the application of ecosystem and ecosystem service management approaches at national and trans-boundary levels.
(c) Strengthening of science-policy interfaces to reinforce multi-scale linkages from local to international actors, as well as to bridge the gap between research results and policy application in developing countries and the international biodiversity arena.
Within this overall project approach, each individual country will develop its specific set of activities that take into account the particularities of the national institutional and policy framework as well as its ecosystems, e.g. by focusing on a few select regulating ecosystem services in decline - often strongly affected by the overuse of provisioning ecosystem services. Through these activities, the project provides an opportu-nity to generate targeted national and global benefits at significant levels.
In South Africa the project will focus on 3 scales: a national policy scale, a catchment management scale in the grassland biome; and a municipal planning scale in the Eden District Municipality.
1.3 scope and objective of reportThe intent of this report is to review and prioritise the most significant potential climate change risks and vulnerabil-ities for each of the 9 biomes and to present potential adaptation responses measures that will guide current and future decision makers in protecting South Africa’s natural ecosystems and biodiversity in the face of climate change. This report will also assist with the development of specific goals and objectives for the South African Biomes in light of projected climate change and potential impacts. The biome plans account for trade-offs, especially those seeking opportunities for enhancing both development and conservation goals.
The report is based on an academic literature review and discussions with experts and practitioners operating in each of the biomes, for example SAEON’s node officers. The report consists of 3 core chapters. The chapter after this introductory section provides an overview of the biomes of South Africa. The third chapter provides detailed assess-ments for each of the 9 biomes. The assessments of each of the biomes follow a similar structure; a brief description of the biome, the vulnerability of the biome to climate change and the actionable adaptation options. Lastly, the fourth chapter provides a synthesis of information and recommendations for policy development and direction for strategic planning within each of the biomes.
Climate Change Adaptation Plans for South African Biomes4
The study was commissioned by the Department of Environmental Affairs and was funded by the Deutsche Gesellschaft für Internationale Zusammenarbeit (GIZ). The Long Term Adaptation Scenarios (2013) programme provides the core building block for the Biome Climate Change Adaptation plans report outlined here. This programme aims to provide national and sub-national adaptation scenarios for identified sectors in South Africa and evaluate the socio-economic and environmental implications of potential impacts of anticipated climate change over the short (<2030) medium (<2050) and long term (<2100).
2. Biomes of south AfriCA
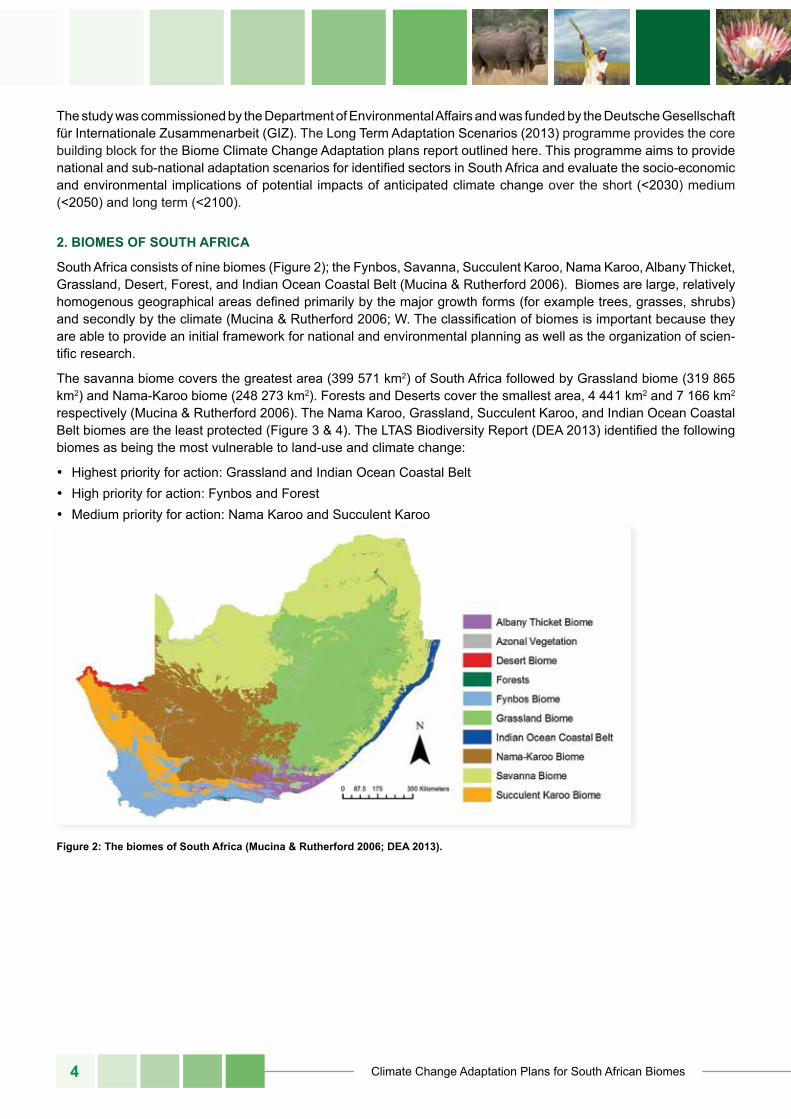
South Africa consists of nine biomes (Figure 2); the Fynbos, Savanna, Succulent Karoo, Nama Karoo, Albany Thicket, Grassland, Desert, Forest, and Indian Ocean Coastal Belt (Mucina & Rutherford 2006). Biomes are large, relatively homogenous geographical areas defined primarily by the major growth forms (for example trees, grasses, shrubs) and secondly by the climate (Mucina & Rutherford 2006; W. The classification of biomes is important because they are able to provide an initial framework for national and environmental planning as well as the organization of scien-tific research.
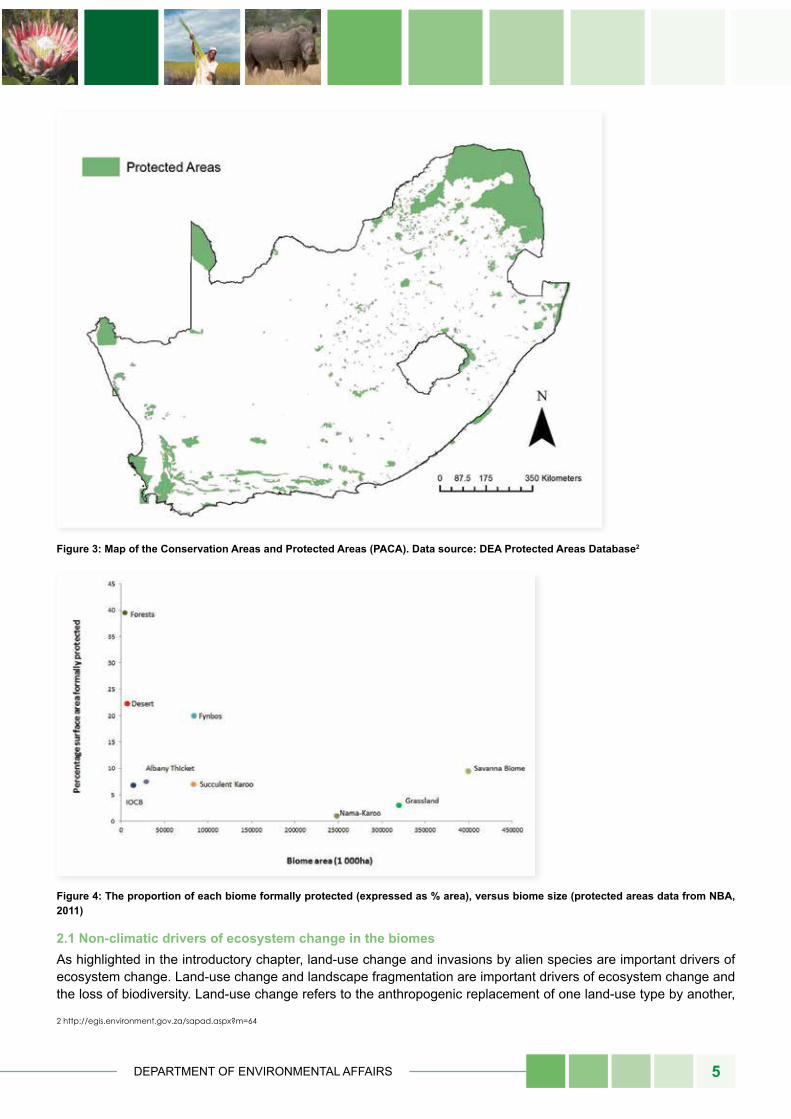
The savanna biome covers the greatest area (399 571 km2) of South Africa followed by Grassland biome (319 865 km2) and Nama-Karoo biome (248 273 km2). Forests and Deserts cover the smallest area, 4 441 km2 and 7 166 km2 respectively (Mucina & Rutherford 2006). The Nama Karoo, Grassland, Succulent Karoo, and Indian Ocean Coastal Belt biomes are the least protected (Figure 3 & 4). The LTAS Biodiversity Report (DEA 2013) identified the following biomes as being the most vulnerable to land-use and climate change:
• Highest priority for action: Grassland and Indian Ocean Coastal Belt• High priority for action: Fynbos and Forest• Medium priority for action: Nama Karoo and Succulent Karoo
figure 2: the biomes of south Africa (mucina & rutherford 2006; DeA 2013).
DEPARTMENT OF ENVIRONMENTAL AFFAIRS 5
figure 3: map of the Conservation Areas and protected Areas (pACA). Data source: DeA protected Areas Database2
figure 4: the proportion of each biome formally protected (expressed as % area), versus biome size (protected areas data from nBA, 2011)
2.1 non-climatic drivers of ecosystem change in the biomesAs highlighted in the introductory chapter, land-use change and invasions by alien species are important drivers of ecosystem change. Land-use change and landscape fragmentation are important drivers of ecosystem change and the loss of biodiversity. Land-use change refers to the anthropogenic replacement of one land-use type by another,
2 http://egis.environment.gov.za/sapad.aspx?m=64
Climate Change Adaptation Plans for South African Biomes6
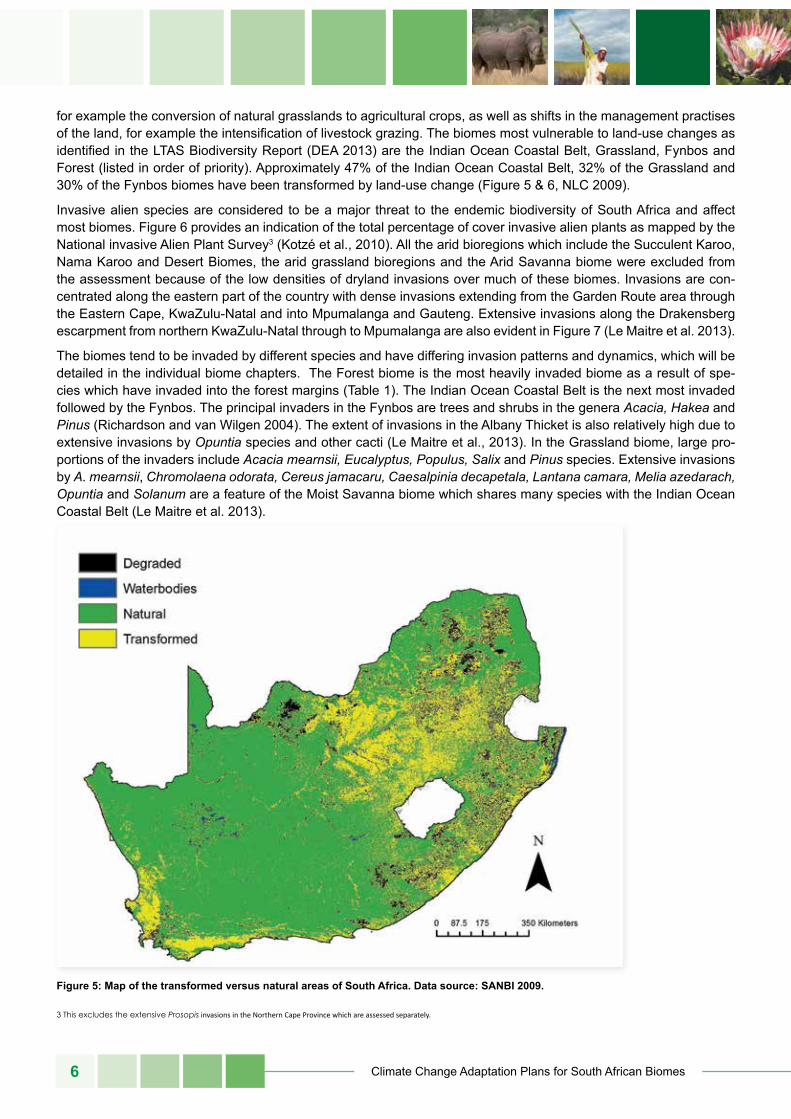
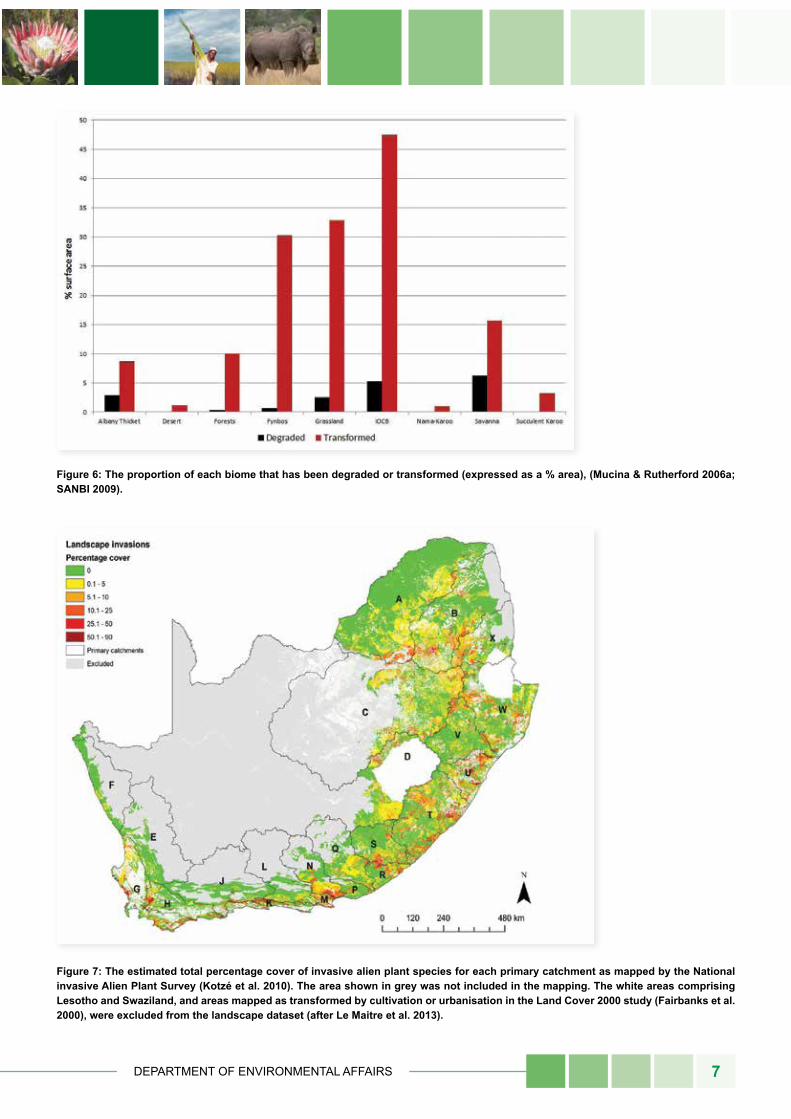
for example the conversion of natural grasslands to agricultural crops, as well as shifts in the management practises of the land, for example the intensification of livestock grazing. The biomes most vulnerable to land-use changes as identified in the LTAS Biodiversity Report (DEA 2013) are the Indian Ocean Coastal Belt, Grassland, Fynbos and Forest (listed in order of priority). Approximately 47% of the Indian Ocean Coastal Belt, 32% of the Grassland and 30% of the Fynbos biomes have been transformed by land-use change (Figure 5 & 6, NLC 2009).
Invasive alien species are considered to be a major threat to the endemic biodiversity of South Africa and affect most biomes. Figure 6 provides an indication of the total percentage of cover invasive alien plants as mapped by the National invasive Alien Plant Survey3 (Kotzé et al., 2010). All the arid bioregions which include the Succulent Karoo, Nama Karoo and Desert Biomes, the arid grassland bioregions and the Arid Savanna biome were excluded from the assessment because of the low densities of dryland invasions over much of these biomes. Invasions are con-centrated along the eastern part of the country with dense invasions extending from the Garden Route area through the Eastern Cape, KwaZulu-Natal and into Mpumalanga and Gauteng. Extensive invasions along the Drakensberg escarpment from northern KwaZulu-Natal through to Mpumalanga are also evident in Figure 7 (Le Maitre et al. 2013).
The biomes tend to be invaded by different species and have differing invasion patterns and dynamics, which will be detailed in the individual biome chapters. The Forest biome is the most heavily invaded biome as a result of spe-cies which have invaded into the forest margins (Table 1). The Indian Ocean Coastal Belt is the next most invaded followed by the Fynbos. The principal invaders in the Fynbos are trees and shrubs in the genera Acacia, Hakea and Pinus (Richardson and van Wilgen 2004). The extent of invasions in the Albany Thicket is also relatively high due to extensive invasions by Opuntia species and other cacti (Le Maitre et al., 2013). In the Grassland biome, large pro-portions of the invaders include Acacia mearnsii, Eucalyptus, Populus, Salix and Pinus species. Extensive invasions by A. mearnsii, Chromolaena odorata, Cereus jamacaru, Caesalpinia decapetala, Lantana camara, Melia azedarach, Opuntia and Solanum are a feature of the Moist Savanna biome which shares many species with the Indian Ocean Coastal Belt (Le Maitre et al. 2013).
figure 5: map of the transformed versus natural areas of south Africa. Data source: sAnBi 2009.
3 This excludes the extensive Prosopis invasions in the Northern Cape Province which are assessed separately.
DEPARTMENT OF ENVIRONMENTAL AFFAIRS 7
figure 6: the proportion of each biome that has been degraded or transformed (expressed as a % area), (mucina & rutherford 2006a; sAnBi 2009).
figure 7: the estimated total percentage cover of invasive alien plant species for each primary catchment as mapped by the national invasive Alien plant survey (Kotzé et al. 2010). the area shown in grey was not included in the mapping. the white areas comprising lesotho and swaziland, and areas mapped as transformed by cultivation or urbanisation in the land Cover 2000 study (fairbanks et al. 2000), were excluded from the landscape dataset (after le maitre et al. 2013).
Climate Change Adaptation Plans for South African Biomes8
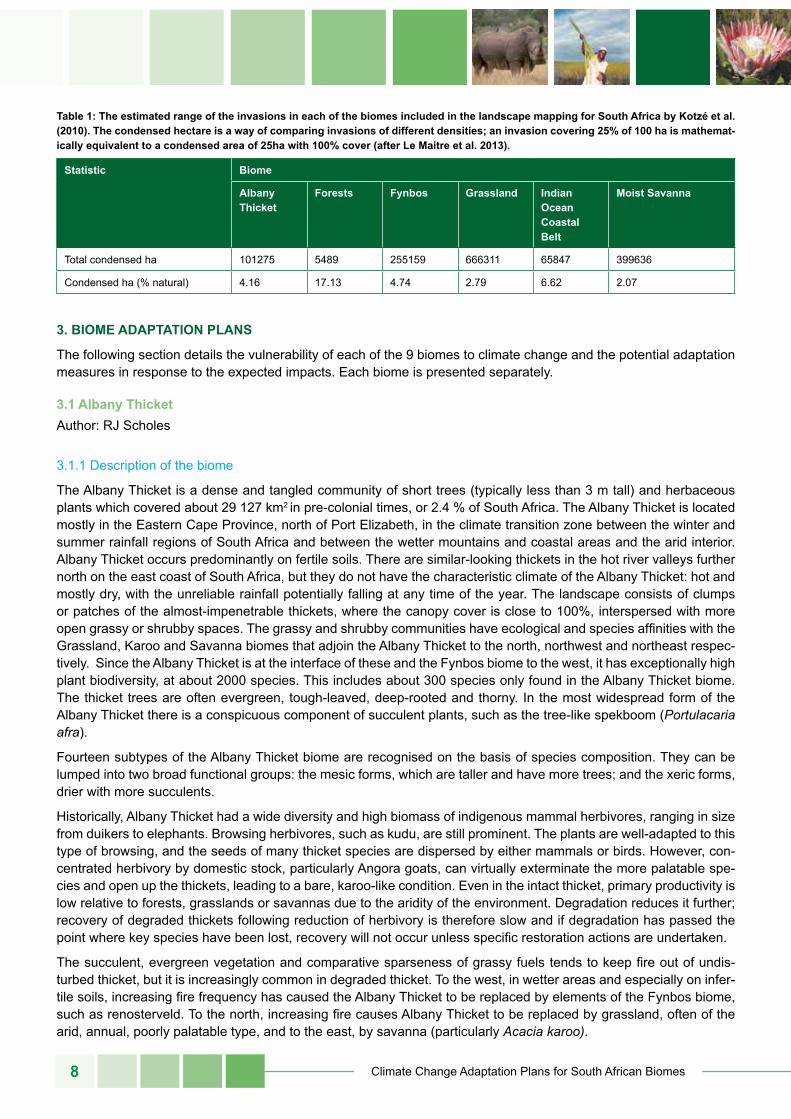
table 1: the estimated range of the invasions in each of the biomes included in the landscape mapping for south Africa by Kotzé et al. (2010). the condensed hectare is a way of comparing invasions of different densities; an invasion covering 25% of 100 ha is mathemat-ically equivalent to a condensed area of 25ha with 100% cover (after le maitre et al. 2013).
statistic Biome
Albany thicket
forests fynbos Grassland indian ocean Coastal Belt
moist savanna
Total condensed ha 101275 5489 255159 666311 65847 399636
Condensed ha (% natural) 4.16 17.13 4.74 2.79 6.62 2.07
3. Biome ADAptAtion plAns
The following section details the vulnerability of each of the 9 biomes to climate change and the potential adaptation measures in response to the expected impacts. Each biome is presented separately.
3.1 Albany thicketAuthor: RJ Scholes
3.1.1 Description of the biome
The Albany Thicket is a dense and tangled community of short trees (typically less than 3 m tall) and herbaceous plants which covered about 29 127 km2 in pre-colonial times, or 2.4 % of South Africa. The Albany Thicket is located mostly in the Eastern Cape Province, north of Port Elizabeth, in the climate transition zone between the winter and summer rainfall regions of South Africa and between the wetter mountains and coastal areas and the arid interior. Albany Thicket occurs predominantly on fertile soils. There are similar-looking thickets in the hot river valleys further north on the east coast of South Africa, but they do not have the characteristic climate of the Albany Thicket: hot and mostly dry, with the unreliable rainfall potentially falling at any time of the year. The landscape consists of clumps or patches of the almost-impenetrable thickets, where the canopy cover is close to 100%, interspersed with more open grassy or shrubby spaces. The grassy and shrubby communities have ecological and species affinities with the Grassland, Karoo and Savanna biomes that adjoin the Albany Thicket to the north, northwest and northeast respec-tively. Since the Albany Thicket is at the interface of these and the Fynbos biome to the west, it has exceptionally high plant biodiversity, at about 2000 species. This includes about 300 species only found in the Albany Thicket biome. The thicket trees are often evergreen, tough-leaved, deep-rooted and thorny. In the most widespread form of the Albany Thicket there is a conspicuous component of succulent plants, such as the tree-like spekboom (Portulacaria afra).
Fourteen subtypes of the Albany Thicket biome are recognised on the basis of species composition. They can be lumped into two broad functional groups: the mesic forms, which are taller and have more trees; and the xeric forms, drier with more succulents.
Historically, Albany Thicket had a wide diversity and high biomass of indigenous mammal herbivores, ranging in size from duikers to elephants. Browsing herbivores, such as kudu, are still prominent. The plants are well-adapted to this type of browsing, and the seeds of many thicket species are dispersed by either mammals or birds. However, con-centrated herbivory by domestic stock, particularly Angora goats, can virtually exterminate the more palatable spe-cies and open up the thickets, leading to a bare, karoo-like condition. Even in the intact thicket, primary productivity is low relative to forests, grasslands or savannas due to the aridity of the environment. Degradation reduces it further; recovery of degraded thickets following reduction of herbivory is therefore slow and if degradation has passed the point where key species have been lost, recovery will not occur unless specific restoration actions are undertaken.
The succulent, evergreen vegetation and comparative sparseness of grassy fuels tends to keep fire out of undis-turbed thicket, but it is increasingly common in degraded thicket. To the west, in wetter areas and especially on infer-tile soils, increasing fire frequency has caused the Albany Thicket to be replaced by elements of the Fynbos biome, such as renosterveld. To the north, increasing fire causes Albany Thicket to be replaced by grassland, often of the arid, annual, poorly palatable type, and to the east, by savanna (particularly Acacia karoo).
DEPARTMENT OF ENVIRONMENTAL AFFAIRS 9
About 12 % of the Albany thicket has been transformed into agricultural fields or urban settlements. Of the remainder, about a tenth is in its original condition, two thirds is severely degraded by domestic stock and the remainder is mod-erately degraded. National or provincial protected areas occupy 7.5 % of the Albany Thicket, with the largest block being the Greater Addo National Park. An increasing fraction, currently about a fifth, is under private or communal conservation management, which support a growing ecotourism and hunting industry, which now make up the main rural economic activity in the Thicket region. About a tenth of the Thicket Biome is under communal ownership and management, consisting of parts of the former Ciskei plus lands transferred to communal management since 1994.
table 2: Albany thicket: top ecosystem services
ecosystem service trends and importance
Nature –based tourism, including hunting Currently major, still growing
Domestic small stock forage, especially angora goats and sheep Historically dominant
Irrigated horticulture Creates jobs and income, but dependent on water from other biomes
Carbon storage Small, growing, large potential
3.1.2 Vulnerability to climate change
The Albany Thicket regional climate is projected to become 2-4°C hotter by the end of the 21st century. Due to the proximity of the biome to the coast, the warming is somewhat less than will be experienced in the interior of South Africa. With less confidence it is projected that the region will be about 15% wetter, especially in summer. The project-ed increase in rainfall, and particularly the fraction falling in large storms, is thought to be because the low-pressure trough which channels moisture from the tropics apparently strengthens under global warming.
Since Albany Thicket is partly defined by its climate, the area which it occupies is likely to be sensitive to climate changes. However, it is believed that the boundaries are not determined by the climate directly, but by the effects of the climate on the fire regime. Future hotter, wetter conditions would favour incursion of the savanna biome into the former Albany Thicket from the northeast. The frequency of large rainfall events is projected to increase, which increases the risk of soil erosion, particularly where the thickets have become degraded and especially on fine-tex-tured soils.
The viability of livestock-based land use activities in the Thicket depends to a large degree on the net primary pro-ductivity (NPP) of the plants that grow there. The NPP, under the scenarios described above, is likely to increase by about 10% (the increase due to rainfall and rising CO2 will be slightly offset by higher temperatures). Any benefits to livestock production will be offset by the negative effects of extreme temperatures on animal performance. Non-indigenous mammals such as cattle are particularly sensitive, especially where they are already near their physi-ological limits. Therefore the overall outlook for sheep, cattle and goat farmers is neutral to slightly negative. Land uses based on indigenous herbivores, for example hunting and game viewing, are less sensitive to climate change because the mammals involved are behaviourally better adapted to heat and because the economic viability of the enterprise is less directly linked to plant and animal production.
Succulent plants with a Crassulacean Acid Metabolism (CAM) are prominent in the Albany Thicket. Their productivity is less positively responsive to rising CO2 concentrations than the productivity of the C4 grasses, which are in turn less responsive than trees and forbs with a C3 photosynthetic system. Therefore, although succulent plants are well-adapted to high temperatures and drought, they may be outcompeted by trees and grass under combinations of more rainfall, rising CO2 and more frequent, more intense fires.
Climate Change Adaptation Plans for South African Biomes10
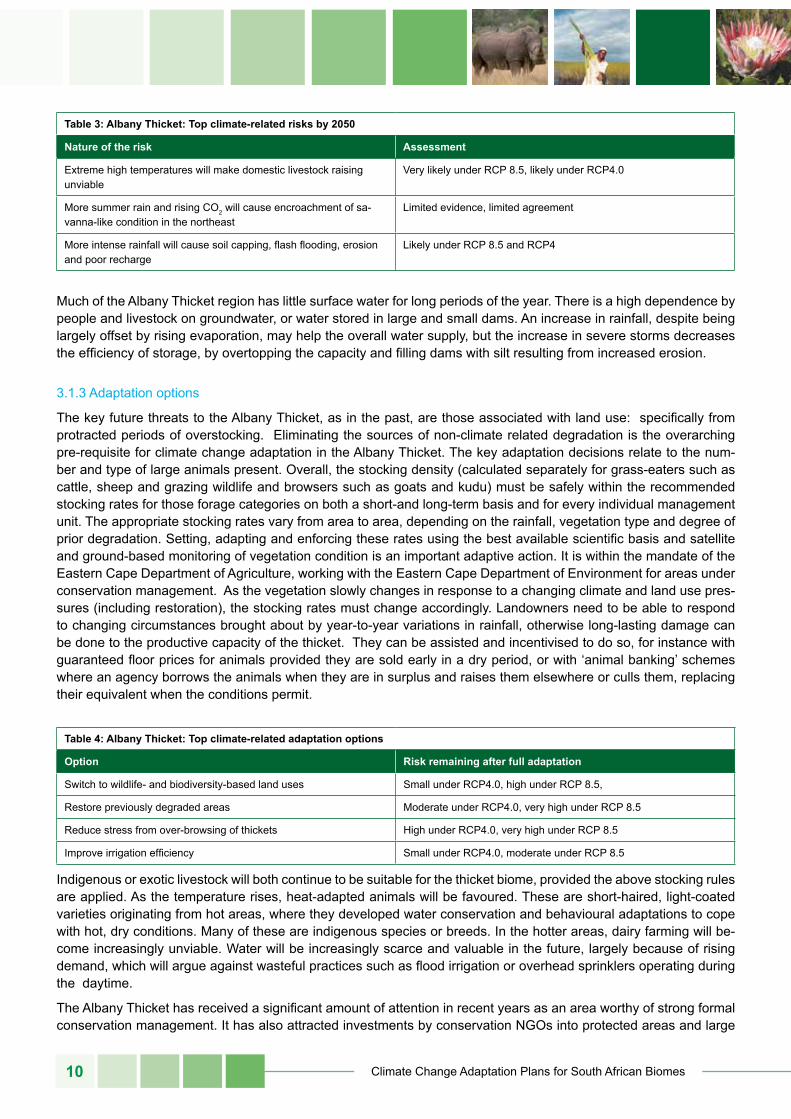
table 3: Albany thicket: top climate-related risks by 2050
nature of the risk Assessment
Extreme high temperatures will make domestic livestock raising unviable
Very likely under RCP 8.5, likely under RCP4.0
More summer rain and rising CO2 will cause encroachment of sa-vanna-like condition in the northeast
Limited evidence, limited agreement
More intense rainfall will cause soil capping, flash flooding, erosion and poor recharge
Likely under RCP 8.5 and RCP4
Much of the Albany Thicket region has little surface water for long periods of the year. There is a high dependence by people and livestock on groundwater, or water stored in large and small dams. An increase in rainfall, despite being largely offset by rising evaporation, may help the overall water supply, but the increase in severe storms decreases the efficiency of storage, by overtopping the capacity and filling dams with silt resulting from increased erosion.
3.1.3 Adaptation options
The key future threats to the Albany Thicket, as in the past, are those associated with land use: specifically from protracted periods of overstocking. Eliminating the sources of non-climate related degradation is the overarching pre-requisite for climate change adaptation in the Albany Thicket. The key adaptation decisions relate to the num-ber and type of large animals present. Overall, the stocking density (calculated separately for grass-eaters such as cattle, sheep and grazing wildlife and browsers such as goats and kudu) must be safely within the recommended stocking rates for those forage categories on both a short-and long-term basis and for every individual management unit. The appropriate stocking rates vary from area to area, depending on the rainfall, vegetation type and degree of prior degradation. Setting, adapting and enforcing these rates using the best available scientific basis and satellite and ground-based monitoring of vegetation condition is an important adaptive action. It is within the mandate of the Eastern Cape Department of Agriculture, working with the Eastern Cape Department of Environment for areas under conservation management. As the vegetation slowly changes in response to a changing climate and land use pres-sures (including restoration), the stocking rates must change accordingly. Landowners need to be able to respond to changing circumstances brought about by year-to-year variations in rainfall, otherwise long-lasting damage can be done to the productive capacity of the thicket. They can be assisted and incentivised to do so, for instance with guaranteed floor prices for animals provided they are sold early in a dry period, or with ‘animal banking’ schemes where an agency borrows the animals when they are in surplus and raises them elsewhere or culls them, replacing their equivalent when the conditions permit.
table 4: Albany thicket: top climate-related adaptation options
option risk remaining after full adaptation
Switch to wildlife- and biodiversity-based land uses Small under RCP4.0, high under RCP 8.5,
Restore previously degraded areas Moderate under RCP4.0, very high under RCP 8.5
Reduce stress from over-browsing of thickets High under RCP4.0, very high under RCP 8.5
Improve irrigation efficiency Small under RCP4.0, moderate under RCP 8.5
Indigenous or exotic livestock will both continue to be suitable for the thicket biome, provided the above stocking rules are applied. As the temperature rises, heat-adapted animals will be favoured. These are short-haired, light-coated varieties originating from hot areas, where they developed water conservation and behavioural adaptations to cope with hot, dry conditions. Many of these are indigenous species or breeds. In the hotter areas, dairy farming will be-come increasingly unviable. Water will be increasingly scarce and valuable in the future, largely because of rising demand, which will argue against wasteful practices such as flood irrigation or overhead sprinklers operating during the daytime.
The Albany Thicket has received a significant amount of attention in recent years as an area worthy of strong formal conservation management. It has also attracted investments by conservation NGOs into protected areas and large
DEPARTMENT OF ENVIRONMENTAL AFFAIRS 11
shifts in land use from livestock farming to hunting and ecotourism. As a result, the Albany Thicket has one of the best-designed Conservation areas and protected areas networks in South Africa. The design has paid particular at-tention to providing resilience in the face of climate change (see Box 3).
Box 3: the Greater Addo conservation area
The Addo Elephant National Park has existed since 1931, when it was created to protect the last 16 local elephant and the thicket in which they had taken refuge. When the conservation importance of the Albany Thicket became apparent in the 1980s, a much more ambitious scheme began to develop with the park as its core. It was informed by the latest thinking on good design of conservation areas, especially in the light of possible climate change. The area of the National Park was increased from 1640 km2 to an eventual 2640 km2, plus 1200 km2 of adjoining Marine Protected Area, and associated privately owned conserved land amounting to some 1000 km2; making ‘Greater Addo’ the fifth largest national park in South Africa, an important tourism destination, and a significant source of employment and income. The design ensured that the land acquired formed an unbroken corridor extending between the karoo biome and the ocean, along the Sundays River and up the el-evational gradient into the Zuurberg and Baviaanskloof mountains. It is this layout, taking into account likely axes of movement in response to climate change, which makes the park climate resilient. In the process, the Sundays river became one of the few with a comprehensive conservation plan over a significant part of its length, including the estuary and important bird-breeding islands offshore.
The fine-grained, shale- and mudstone-derived soils of the Albany Thicket are prone to surface sealing and erosion, especially when the soil contains sodium. The erosion is typically triggered by exposure of an un-vegetated soil surface to high-energy rainfall, such as is delivered by severe storms. The best adaptive action is to restore the vegetation cover, by reducing livestock numbers if the degradation is slight, or if it is severe by deliberate soil erosion control measures such as contour bank creation, bush packing and replanting, accompanied by complete protection from livestock. These measures also improve the recharge of groundwater and thus the reliability of ‘baseflow’ in the rivers. Revegetation thus acts as a rainwater harvesting technique which is more efficient than the building of more small, shallow dams, and helping to prolong the life and usefulness of large dams and the quality of water in the rivers. Existing gully erosion can be arrested and fixed using well-established, labour intensive techniques such as the building of gabions.
Degraded Albany Thicket has been identified as a potential location for climate mitigation through carbon storage. This is an opportunity offered by climate change, and is consistent with other adaptation options and has co-benefits for biodiversity, water yield and job creation. Carbon storage is achieved by the restoration of degraded former thick-ets by planting spekboom. Intact Albany Thickets do have an unusually high carbon stock per unit area, considering the relatively harsh climate in which they occur, of about 30 tonnes carbon per hectare in the above and belowground plant parts, and a further 800 tonnes C/ha in the soil. Degraded thickets, on the other hand, have about 11 tonnes of plant biomass and 280 tonnes/ha of soil carbon. There is a large area of degraded thicket potentially available for restoration, perhaps as much as 10000 km2. Restoration has many other social and ecological benefits as well, few apparent disadvantages, and is consistent with climate adaptation actions such as favouring biodiversity and water conservation land uses. However, the costs and success rates of thicket restoration, the complete climate conse-quences of thicket restoration, the rate at which carbon is stored in the ecosystem and the vulnerability of the stored carbon to future loss if the thickets are not protected from over-browsing remain unclear. Thus the degree to which this option will be attractive at large scales to landowners and carbon traders is uncertain (see case study in Box 4 on the Baviaanskloof Thicket Restoration).
Climate Change Adaptation Plans for South African Biomes12
Box 4: the Baviaanskloof thicket restoration project
This project, funded by NGOs and the South African government’s ‘Working for Water’ poverty alleviation programme, is one of the few large-scale experiments in carbon sequestration using dryland restoration in South Africa and the world. It has been supported by the sale of carbon credits in the Voluntary Carbon Market, but not the more restrictive Certified Carbon Credits market. The actual costs of restoration as determined by the project were higher than anticipated, and the successful establishment of cuttings of spekboom were lower than hoped. These factors, together with the low growth rate (and thus the low carbon storage rate) of thickets in marginal lands and the high costs of monitoring and verification of restored patches, raise questions about the financial viability of this form of mitigation when the carbon price is low. Thicket restoration has many benefits to biodiversity, livelihoods and water yield, so there are strong arguments to promote it even if the climate benefits are marginal; but basing the income model on carbon sales alone is risky.
3.2 Desert and nama Karoo BiomesAuthor: Emma Archer van Garderen
3.2.1 Description of the biomes
We have chosen to deal with the Nama Karoo and Desert biomes together, since such a small portion of the Desert biome falls within South Africa. In addition, a range of themes almost completely overlap (this is often marked in text, although not exhaustively). Palmer and Hoffman (1997) in fact, refer to the Nama Karoo, Succulent Karoo and Desert Biomes together as comprising the ‘Karoo-Namib’ region, which is still a useful working area, although not much used in recent writing.
The Desert biome falls within a small area in northwest South Africa (although it of course extends further beyond the border – we limit our discussion here specifically to that portion within national boundaries). Within South Africa, it is found largely in the Richtersveld, in the Springbokvlakte area (DEA 2013; Mucina and Rutherford 1996). Desert biome vegetation is largely characterized by annuals, with drought resistant shrubs found in certain areas (DEA 2013). A number of interesting features may be found with regard to flora and fauna in this area, particularly in the area of arid adaptation. For example, Crassulacean acid metabolism (CAM) is a typical feature of some species of succulents in the Richtersveld area, allowing varying adaptation to water stress. In the case of fauna, numerous ex-amples abound, including the ability of a range of organisms to adapt foraging, hunting and feeding activity to diurnal and seasonal temperature cycles.
Land uses in the Desert biome include agriculture, in the form of extensive grazing, as well as wildlife ranching and management. Both emerging agriculture and large scale commercial agriculture may be found within this biome, as well as protected areas under a range of jurisdictions – although the area of the biome under protection is only 22.3 %. Commercial grazing in this area is largely limited to small stock, including goat farming – often the hardy boerbok species, which is itself well adapted to foraging and grazing in arid conditions. Communal farmers also farm on rural municipal land, under a range of communal grazing arrangements – a key land use in these areas, and a theme considered in the following section in the context of vulnerability.
The Nama Karoo is situated on the central plateau of the western half of South Africa and extends towards southern central Namibia. The Nama Karoo biome constitutes 607 235 km2 of the area in central to west South Africa, occu-pying the centre of what Hoffman (2014) calls an aridity index between the Succulent Karoo in the west and mesic Savanna biome in the east. It is of interest to note that only 0.8 % of the biome is under protection, while the vast majority (97.4%) remains natural although unprotected in the sense of formal jurisdictional protection.
The Nama Karoo biome consists of usually arid adapted (as in the case of the Desert Biome) grasses and bushes (including the highly palatable Themeda triandra, or rooigras), with annual precipitation decreasing from 400 mm in the east to around 60 mm in the west (Palmer and Hoffman 1997, DEA 2013). Precipitation in the area may be highly variable, with key implications for flora and fauna, as well as land uses in the area. Droughts are not uncommon, and seasonal rainfall may be difficult to predict. Areas of very low rainfall may lie in a topographical rain shadow (Palmer and Hoffman 1997). Palmer and Hoffman (1997) note that the biome comprises largely dwarf open shrubland, with Asteraceae, Poaceae, Aizoaceae, Mesembryanthemacaea, Liliaceae and Scrophulariaceae dominant.
Land uses in this large biome are dominated by agriculture in the form of extensive grazing and, increasingly, wildlife management (we see a trend of increasing wildlife management and ranching in a number of other biomes as well,
DEPARTMENT OF ENVIRONMENTAL AFFAIRS 13
including neighbouring areas). Both small and large stock production takes place here, while other key land uses include mining and various forms of tourism, ecotourism and allied livelihood activities. As in the case of the Desert Biome, communal farmers farm in addition on rural municipal land, with a range of grazing and use rights evident. Invasion of alien species are an increasing concern in the biome, with land use and grazing implicated in the expan-sion of certain species (for example, Opuntia humifusa is a declared weed under the Conservation of Agricultural Resources Act (CARA), requiring reporting to the Department of Agriculture, Forestry and Fisheries; and is associat-ed with overgrazing and veld degradation, as well as contributing to further decreased usability of grazing ground).
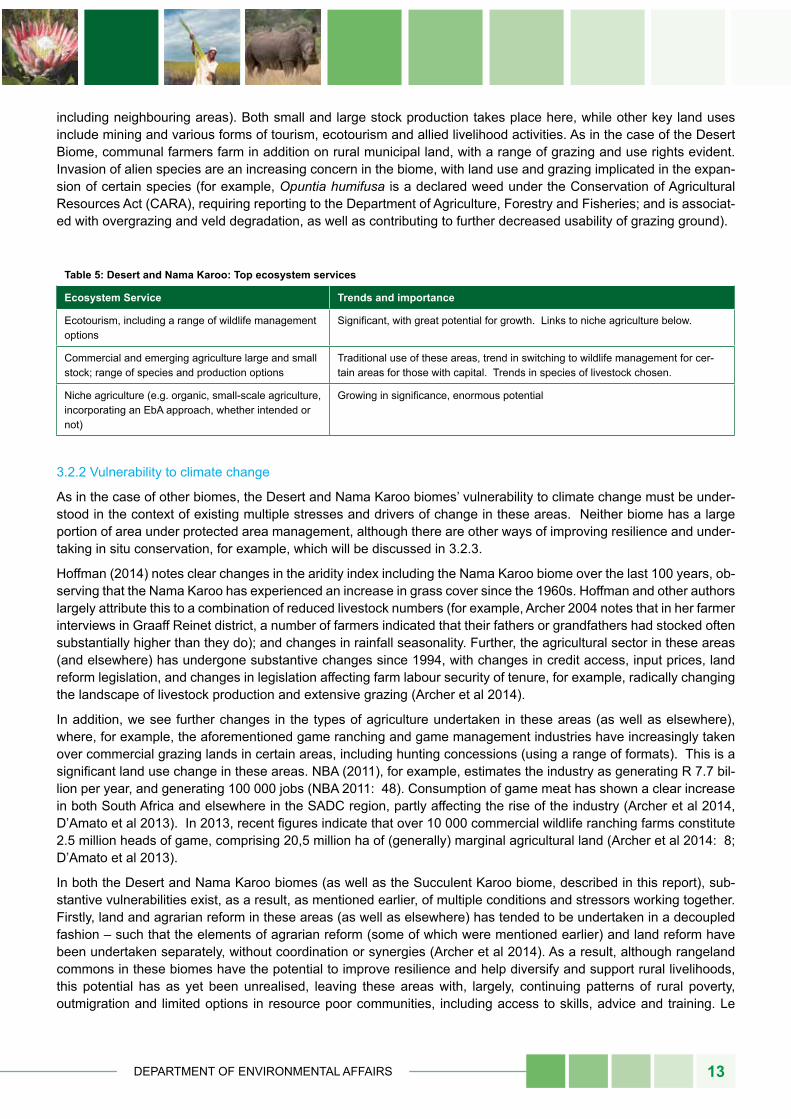
table 5: Desert and nama Karoo: top ecosystem services
ecosystem service trends and importance
Ecotourism, including a range of wildlife management options
Significant, with great potential for growth. Links to niche agriculture below.
Commercial and emerging agriculture large and small stock; range of species and production options
Traditional use of these areas, trend in switching to wildlife management for cer-tain areas for those with capital. Trends in species of livestock chosen.
Niche agriculture (e.g. organic, small-scale agriculture, incorporating an EbA approach, whether intended or not)
Growing in significance, enormous potential
3.2.2 Vulnerability to climate change
As in the case of other biomes, the Desert and Nama Karoo biomes’ vulnerability to climate change must be under-stood in the context of existing multiple stresses and drivers of change in these areas. Neither biome has a large portion of area under protected area management, although there are other ways of improving resilience and under-taking in situ conservation, for example, which will be discussed in 3.2.3.
Hoffman (2014) notes clear changes in the aridity index including the Nama Karoo biome over the last 100 years, ob-serving that the Nama Karoo has experienced an increase in grass cover since the 1960s. Hoffman and other authors largely attribute this to a combination of reduced livestock numbers (for example, Archer 2004 notes that in her farmer interviews in Graaff Reinet district, a number of farmers indicated that their fathers or grandfathers had stocked often substantially higher than they do); and changes in rainfall seasonality. Further, the agricultural sector in these areas (and elsewhere) has undergone substantive changes since 1994, with changes in credit access, input prices, land reform legislation, and changes in legislation affecting farm labour security of tenure, for example, radically changing the landscape of livestock production and extensive grazing (Archer et al 2014).
In addition, we see further changes in the types of agriculture undertaken in these areas (as well as elsewhere), where, for example, the aforementioned game ranching and game management industries have increasingly taken over commercial grazing lands in certain areas, including hunting concessions (using a range of formats). This is a significant land use change in these areas. NBA (2011), for example, estimates the industry as generating R 7.7 bil-lion per year, and generating 100 000 jobs (NBA 2011: 48). Consumption of game meat has shown a clear increase in both South Africa and elsewhere in the SADC region, partly affecting the rise of the industry (Archer et al 2014, D’Amato et al 2013). In 2013, recent figures indicate that over 10 000 commercial wildlife ranching farms constitute 2.5 million heads of game, comprising 20,5 million ha of (generally) marginal agricultural land (Archer et al 2014: 8; D’Amato et al 2013).
In both the Desert and Nama Karoo biomes (as well as the Succulent Karoo biome, described in this report), sub-stantive vulnerabilities exist, as a result, as mentioned earlier, of multiple conditions and stressors working together. Firstly, land and agrarian reform in these areas (as well as elsewhere) has tended to be undertaken in a decoupled fashion – such that the elements of agrarian reform (some of which were mentioned earlier) and land reform have been undertaken separately, without coordination or synergies (Archer et al 2014). As a result, although rangeland commons in these biomes have the potential to improve resilience and help diversify and support rural livelihoods, this potential has as yet been unrealised, leaving these areas with, largely, continuing patterns of rural poverty, outmigration and limited options in resource poor communities, including access to skills, advice and training. Le
Climate Change Adaptation Plans for South African Biomes14
Roux and van Huyssteen (2010) show low employment distribution across the two biomes, which is one element of socio-economic vulnerability (although interestingly, dependency ratios are also low in these areas); as well as high levels of outmigration. In terms of geographic distribution of economic activity, both biomes show the lowest of all biomes covered here, with levels increasing towards the south and east – spatial patterns in this regard are extremely striking (see le Roux and van Huyssteen 2010: 18). Comparative analysis of economic activity per district/metropol-itan municipality in terms of size, sector and growth is also extremely striking, with the lowest levels appearing in these two biomes - for example, in terms of GDP growth from 1995 – 2007 the two biomes appear by far the lowest in the country in terms of both absolute growth, and GDP per sector for 2007 (le Roux and van Huyssteen 2010: 18). Finally, both biomes have the lowest evidence of and proximity to functional urban areas – at a time where it is acknowledged that settlement dynamics are key in livelihoods, service delivery and other critical areas (le Roux and van Huyssteen 2010).
Although land reform has been undertaken in a number of areas within these biomes, policy perspectives driving land reform planning have tended to take a simplistic and, as Hall and Cousins (2013) argue, a class and gender biased view, severely limiting potential improvement; setting up ‘commercial’ against ‘subsistence’ farming activity, for exam-ple, and not recognizing the myriad of hybrid and more subtly structured systems that are already in place in arid and semi-arid areas. Of particular concern in these biomes, as well as the Succulent Karoo biome, is the extent to which both land and agrarian reform have tended to ignore the priorities and needs of women livestock owners, focusing more on the types of systems and large stock ownership that are more the domain of male livestock owners (Hall & Cousins 2013). Small stock ownership in these areas is generally more the domain of women, and is critical to rural livelihoods and household resilience.
In addition, by continuing to have what might be considered an ideological bias to commercial farming and private ownership in terms of land use, again the option around more hybrid systems already in place in these areas and their ability to diversity rural livelihoods and reduce vulnerability is left in place (Hall and Cousins 2013). Further, live-stock production and ownership has tended to remain in the hands of an elite in these areas, missing opportunities to benefit the poorest and most vulnerable houses. This trend is by no means limited to livestock production; and reduces the ability to focus on improving vulnerability to multiple stresses, including climate change; and producing more resilient ecosystems and rural livelihoods, outcomes that, of course, should generally be aligned.
table 6: nama Karoo and Desert: top climate-related risks by 2050
nature of the risk Assessment
High temperatures exceeding comfort thresholds for most species of livestock, including wildlife management.
Very likely under RCP 8.5, likely under RCP4.0
High temperatures coupled with certain rainfall thresholds linked to increased pests and pathogens in particular areas
Likely under RCP 8.5 and RCP4
Possibly higher frequency of extreme rainfall events – implications for all sectors, including disaster management
Likely under RCP 8.5 and RCP4
It is, in conclusion, important to note that climate change may also bring opportunities for these biomes, further em-phasized in the section on adaptation options below. For example, a decrease in minimum temperatures may hold benefits for angora farmers in high altitude areas who currently may be limited by low cold temperature tolerance in winter months, and vulnerability to cold snaps.
3.2.3 Adaptation options
It should again be emphasized here that there is substantial overlap between adaptation under discussion here, and those options considered in other biomes, in particular the Succulent Karoo biome. Essentially, the focus taken here is again on options that may improve resilience of the entire socio-ecological system in these biomes, looking at mul-tiple benefits approaches that may have positive synergies in terms of improving livelihoods, conserving biodiversity and adapting to climate change. As mentioned previously, the biomes are already areas of considerable existing vulnerability to multiple stressors including climate change.
A number of successful interventions in the biomes are focused in the area of ecosystems based adaptation, which
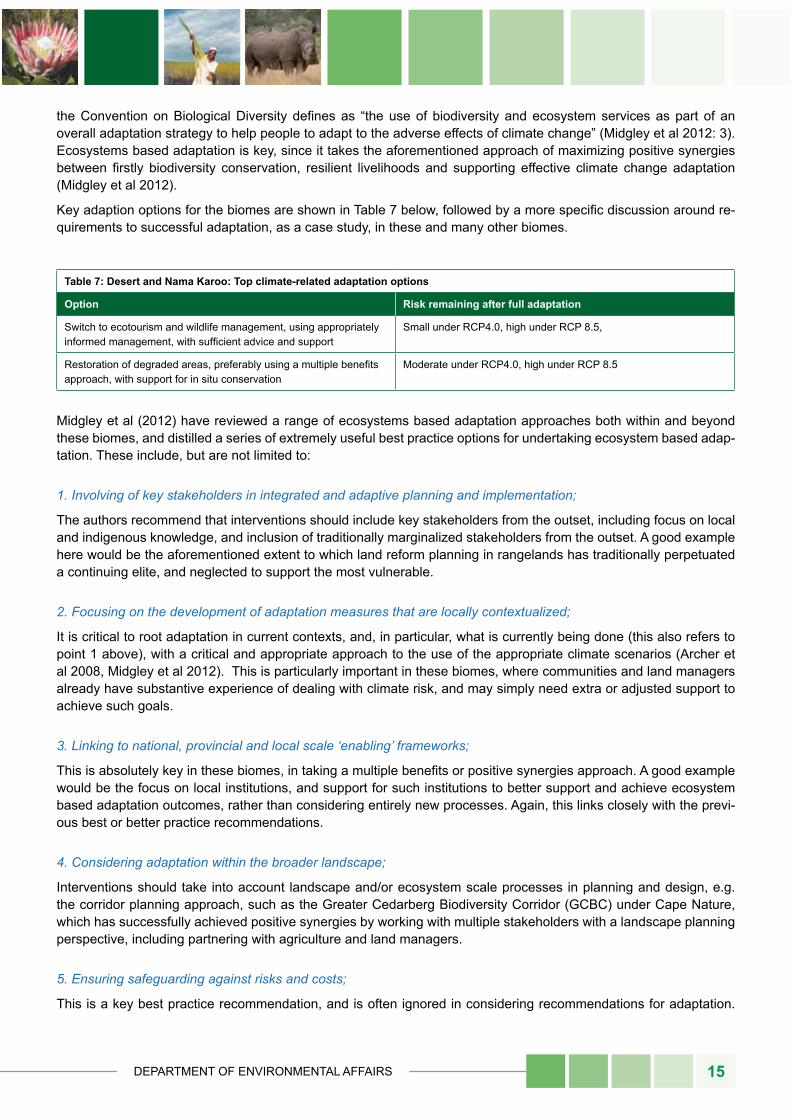
DEPARTMENT OF ENVIRONMENTAL AFFAIRS 15
the Convention on Biological Diversity defines as “the use of biodiversity and ecosystem services as part of an overall adaptation strategy to help people to adapt to the adverse effects of climate change” (Midgley et al 2012: 3). Ecosystems based adaptation is key, since it takes the aforementioned approach of maximizing positive synergies between firstly biodiversity conservation, resilient livelihoods and supporting effective climate change adaptation (Midgley et al 2012).
Key adaption options for the biomes are shown in Table 7 below, followed by a more specific discussion around re-quirements to successful adaptation, as a case study, in these and many other biomes.
table 7: Desert and nama Karoo: top climate-related adaptation options
option risk remaining after full adaptation
Switch to ecotourism and wildlife management, using appropriately informed management, with sufficient advice and support
Small under RCP4.0, high under RCP 8.5,
Restoration of degraded areas, preferably using a multiple benefits approach, with support for in situ conservation
Moderate under RCP4.0, high under RCP 8.5
Midgley et al (2012) have reviewed a range of ecosystems based adaptation approaches both within and beyond these biomes, and distilled a series of extremely useful best practice options for undertaking ecosystem based adap-tation. These include, but are not limited to:
1. Involving of key stakeholders in integrated and adaptive planning and implementation;
The authors recommend that interventions should include key stakeholders from the outset, including focus on local and indigenous knowledge, and inclusion of traditionally marginalized stakeholders from the outset. A good example here would be the aforementioned extent to which land reform planning in rangelands has traditionally perpetuated a continuing elite, and neglected to support the most vulnerable.
2. Focusing on the development of adaptation measures that are locally contextualized;
It is critical to root adaptation in current contexts, and, in particular, what is currently being done (this also refers to point 1 above), with a critical and appropriate approach to the use of the appropriate climate scenarios (Archer et al 2008, Midgley et al 2012). This is particularly important in these biomes, where communities and land managers already have substantive experience of dealing with climate risk, and may simply need extra or adjusted support to achieve such goals.
3. Linking to national, provincial and local scale ‘enabling’ frameworks;
This is absolutely key in these biomes, in taking a multiple benefits or positive synergies approach. A good example would be the focus on local institutions, and support for such institutions to better support and achieve ecosystem based adaptation outcomes, rather than considering entirely new processes. Again, this links closely with the previ-ous best or better practice recommendations.
4. Considering adaptation within the broader landscape;
Interventions should take into account landscape and/or ecosystem scale processes in planning and design, e.g. the corridor planning approach, such as the Greater Cedarberg Biodiversity Corridor (GCBC) under Cape Nature, which has successfully achieved positive synergies by working with multiple stakeholders with a landscape planning perspective, including partnering with agriculture and land managers.
5. Ensuring safeguarding against risks and costs;
This is a key best practice recommendation, and is often ignored in considering recommendations for adaptation.
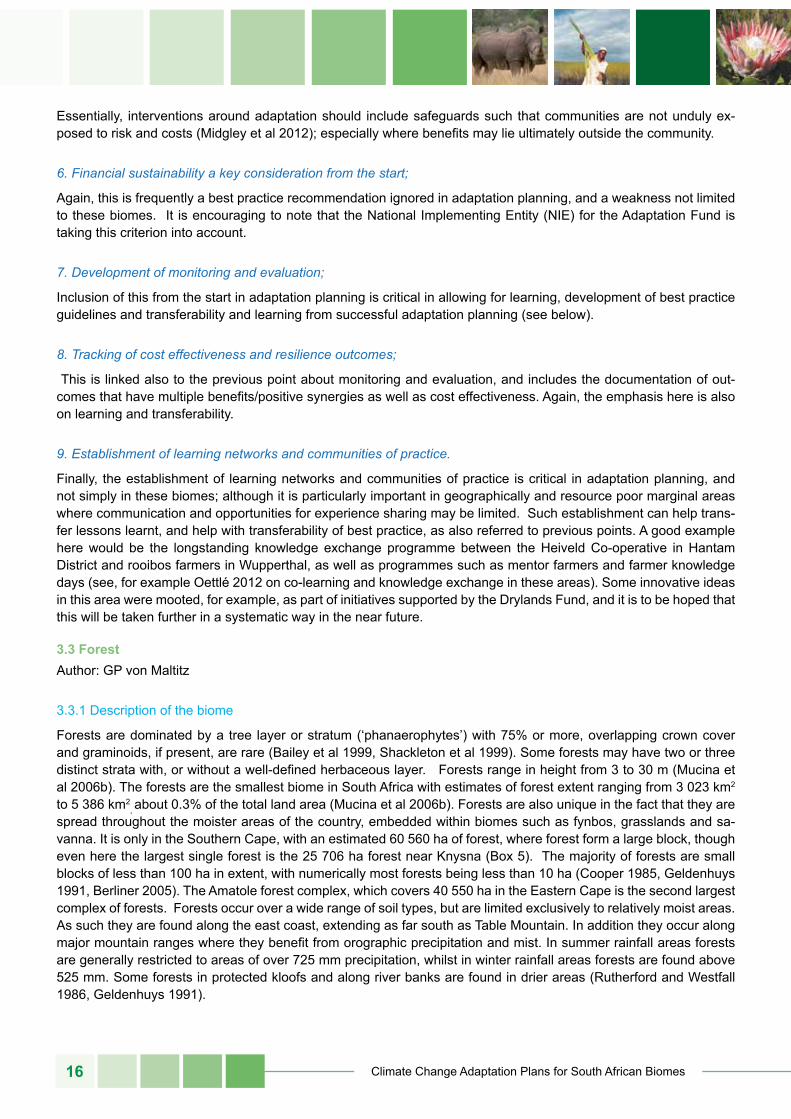
Climate Change Adaptation Plans for South African Biomes16
Essentially, interventions around adaptation should include safeguards such that communities are not unduly ex-posed to risk and costs (Midgley et al 2012); especially where benefits may lie ultimately outside the community.
6. Financial sustainability a key consideration from the start;
Again, this is frequently a best practice recommendation ignored in adaptation planning, and a weakness not limited to these biomes. It is encouraging to note that the National Implementing Entity (NIE) for the Adaptation Fund is taking this criterion into account.
7. Development of monitoring and evaluation;
Inclusion of this from the start in adaptation planning is critical in allowing for learning, development of best practice guidelines and transferability and learning from successful adaptation planning (see below).
8. Tracking of cost effectiveness and resilience outcomes;
This is linked also to the previous point about monitoring and evaluation, and includes the documentation of out-comes that have multiple benefits/positive synergies as well as cost effectiveness. Again, the emphasis here is also on learning and transferability.
9. Establishment of learning networks and communities of practice.
Finally, the establishment of learning networks and communities of practice is critical in adaptation planning, and not simply in these biomes; although it is particularly important in geographically and resource poor marginal areas where communication and opportunities for experience sharing may be limited. Such establishment can help trans-fer lessons learnt, and help with transferability of best practice, as also referred to previous points. A good example here would be the longstanding knowledge exchange programme between the Heiveld Co-operative in Hantam District and rooibos farmers in Wupperthal, as well as programmes such as mentor farmers and farmer knowledge days (see, for example Oettlé 2012 on co-learning and knowledge exchange in these areas). Some innovative ideas in this area were mooted, for example, as part of initiatives supported by the Drylands Fund, and it is to be hoped that this will be taken further in a systematic way in the near future.
3.3 forestAuthor: GP von Maltitz
3.3.1 Description of the biome
Forests are dominated by a tree layer or stratum (‘phanaerophytes’) with 75% or more, overlapping crown cover and graminoids, if present, are rare (Bailey et al 1999, Shackleton et al 1999). Some forests may have two or three distinct strata with, or without a well-defined herbaceous layer. Forests range in height from 3 to 30 m (Mucina et al 2006b). The forests are the smallest biome in South Africa with estimates of forest extent ranging from 3 023 km2 to 5 386 km2
, about 0.3% of the total land area (Mucina et al 2006b). Forests are also unique in the fact that they are spread throughout the moister areas of the country, embedded within biomes such as fynbos, grasslands and sa-vanna. It is only in the Southern Cape, with an estimated 60 560 ha of forest, where forest form a large block, though even here the largest single forest is the 25 706 ha forest near Knysna (Box 5). The majority of forests are small blocks of less than 100 ha in extent, with numerically most forests being less than 10 ha (Cooper 1985, Geldenhuys 1991, Berliner 2005). The Amatole forest complex, which covers 40 550 ha in the Eastern Cape is the second largest complex of forests. Forests occur over a wide range of soil types, but are limited exclusively to relatively moist areas. As such they are found along the east coast, extending as far south as Table Mountain. In addition they occur along major mountain ranges where they benefit from orographic precipitation and mist. In summer rainfall areas forests are generally restricted to areas of over 725 mm precipitation, whilst in winter rainfall areas forests are found above 525 mm. Some forests in protected kloofs and along river banks are found in drier areas (Rutherford and Westfall 1986, Geldenhuys 1991).
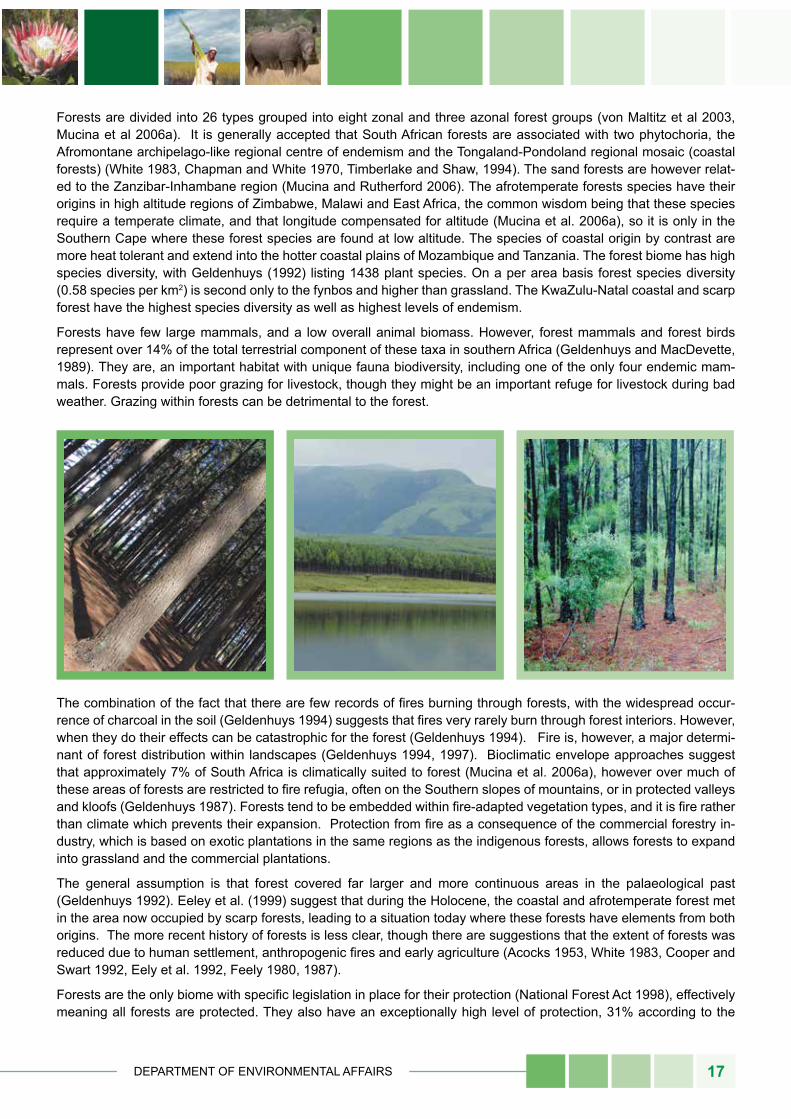
DEPARTMENT OF ENVIRONMENTAL AFFAIRS 17
Forests are divided into 26 types grouped into eight zonal and three azonal forest groups (von Maltitz et al 2003, Mucina et al 2006a). It is generally accepted that South African forests are associated with two phytochoria, the Afromontane archipelago-like regional centre of endemism and the Tongaland-Pondoland regional mosaic (coastal forests) (White 1983, Chapman and White 1970, Timberlake and Shaw, 1994). The sand forests are however relat-ed to the Zanzibar-Inhambane region (Mucina and Rutherford 2006). The afrotemperate forests species have their origins in high altitude regions of Zimbabwe, Malawi and East Africa, the common wisdom being that these species require a temperate climate, and that longitude compensated for altitude (Mucina et al. 2006a), so it is only in the Southern Cape where these forest species are found at low altitude. The species of coastal origin by contrast are more heat tolerant and extend into the hotter coastal plains of Mozambique and Tanzania. The forest biome has high species diversity, with Geldenhuys (1992) listing 1438 plant species. On a per area basis forest species diversity (0.58 species per km2) is second only to the fynbos and higher than grassland. The KwaZulu-Natal coastal and scarp forest have the highest species diversity as well as highest levels of endemism.
Forests have few large mammals, and a low overall animal biomass. However, forest mammals and forest birds represent over 14% of the total terrestrial component of these taxa in southern Africa (Geldenhuys and MacDevette, 1989). They are, an important habitat with unique fauna biodiversity, including one of the only four endemic mam-mals. Forests provide poor grazing for livestock, though they might be an important refuge for livestock during bad weather. Grazing within forests can be detrimental to the forest.
The combination of the fact that there are few records of fires burning through forests, with the widespread occur-rence of charcoal in the soil (Geldenhuys 1994) suggests that fires very rarely burn through forest interiors. However, when they do their effects can be catastrophic for the forest (Geldenhuys 1994). Fire is, however, a major determi-nant of forest distribution within landscapes (Geldenhuys 1994, 1997). Bioclimatic envelope approaches suggest that approximately 7% of South Africa is climatically suited to forest (Mucina et al. 2006a), however over much of these areas of forests are restricted to fire refugia, often on the Southern slopes of mountains, or in protected valleys and kloofs (Geldenhuys 1987). Forests tend to be embedded within fire-adapted vegetation types, and it is fire rather than climate which prevents their expansion. Protection from fire as a consequence of the commercial forestry in-dustry, which is based on exotic plantations in the same regions as the indigenous forests, allows forests to expand into grassland and the commercial plantations.
The general assumption is that forest covered far larger and more continuous areas in the palaeological past (Geldenhuys 1992). Eeley et al. (1999) suggest that during the Holocene, the coastal and afrotemperate forest met in the area now occupied by scarp forests, leading to a situation today where these forests have elements from both origins. The more recent history of forests is less clear, though there are suggestions that the extent of forests was reduced due to human settlement, anthropogenic fires and early agriculture (Acocks 1953, White 1983, Cooper and Swart 1992, Eely et al. 1992, Feely 1980, 1987).
Forests are the only biome with specific legislation in place for their protection (National Forest Act 1998), effectively meaning all forests are protected. They also have an exceptionally high level of protection, 31% according to the
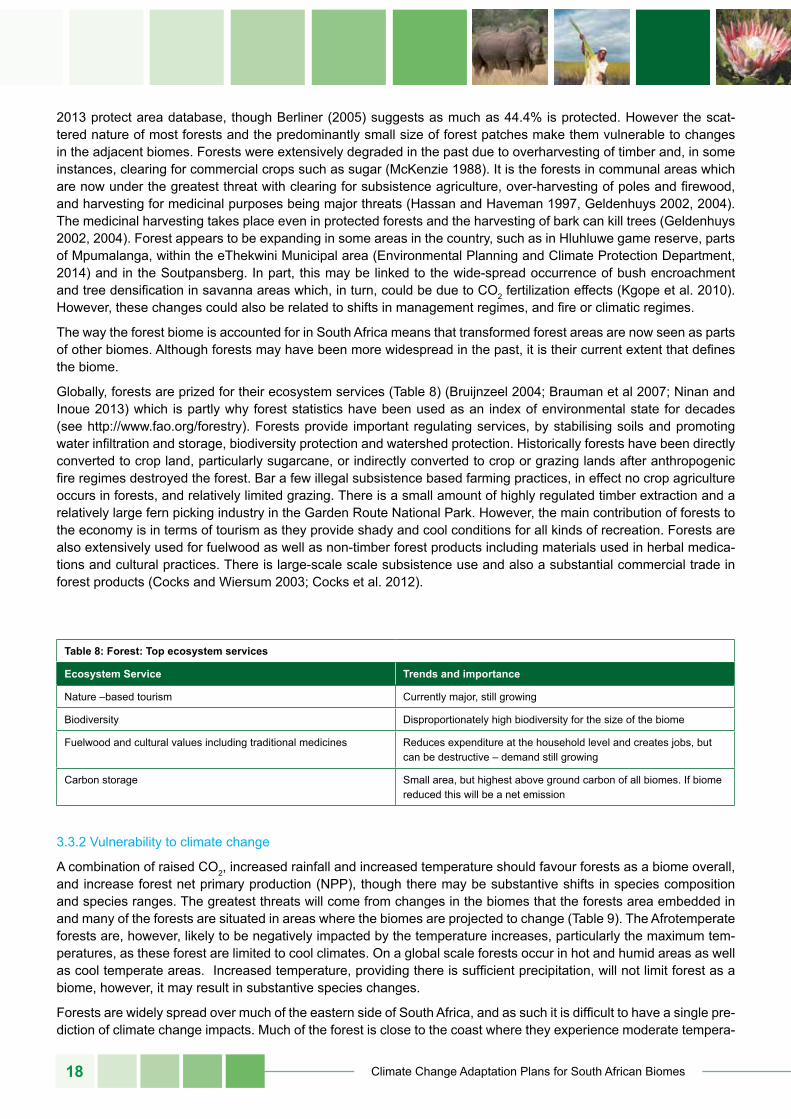
Climate Change Adaptation Plans for South African Biomes18
2013 protect area database, though Berliner (2005) suggests as much as 44.4% is protected. However the scat-tered nature of most forests and the predominantly small size of forest patches make them vulnerable to changes in the adjacent biomes. Forests were extensively degraded in the past due to overharvesting of timber and, in some instances, clearing for commercial crops such as sugar (McKenzie 1988). It is the forests in communal areas which are now under the greatest threat with clearing for subsistence agriculture, over-harvesting of poles and firewood, and harvesting for medicinal purposes being major threats (Hassan and Haveman 1997, Geldenhuys 2002, 2004). The medicinal harvesting takes place even in protected forests and the harvesting of bark can kill trees (Geldenhuys 2002, 2004). Forest appears to be expanding in some areas in the country, such as in Hluhluwe game reserve, parts of Mpumalanga, within the eThekwini Municipal area (Environmental Planning and Climate Protection Department, 2014) and in the Soutpansberg. In part, this may be linked to the wide-spread occurrence of bush encroachment and tree densification in savanna areas which, in turn, could be due to CO2 fertilization effects (Kgope et al. 2010). However, these changes could also be related to shifts in management regimes, and fire or climatic regimes.
The way the forest biome is accounted for in South Africa means that transformed forest areas are now seen as parts of other biomes. Although forests may have been more widespread in the past, it is their current extent that defines the biome.
Globally, forests are prized for their ecosystem services (Table 8) (Bruijnzeel 2004; Brauman et al 2007; Ninan and Inoue 2013) which is partly why forest statistics have been used as an index of environmental state for decades (see http://www.fao.org/forestry). Forests provide important regulating services, by stabilising soils and promoting water infiltration and storage, biodiversity protection and watershed protection. Historically forests have been directly converted to crop land, particularly sugarcane, or indirectly converted to crop or grazing lands after anthropogenic fire regimes destroyed the forest. Bar a few illegal subsistence based farming practices, in effect no crop agriculture occurs in forests, and relatively limited grazing. There is a small amount of highly regulated timber extraction and a relatively large fern picking industry in the Garden Route National Park. However, the main contribution of forests to the economy is in terms of tourism as they provide shady and cool conditions for all kinds of recreation. Forests are also extensively used for fuelwood as well as non-timber forest products including materials used in herbal medica-tions and cultural practices. There is large-scale scale subsistence use and also a substantial commercial trade in forest products (Cocks and Wiersum 2003; Cocks et al. 2012).
table 8: forest: top ecosystem services
ecosystem service trends and importance
Nature –based tourism Currently major, still growing
Biodiversity Disproportionately high biodiversity for the size of the biome
Fuelwood and cultural values including traditional medicines Reduces expenditure at the household level and creates jobs, but can be destructive – demand still growing
Carbon storage Small area, but highest above ground carbon of all biomes. If biome reduced this will be a net emission
3.3.2 Vulnerability to climate change
A combination of raised CO2, increased rainfall and increased temperature should favour forests as a biome overall, and increase forest net primary production (NPP), though there may be substantive shifts in species composition and species ranges. The greatest threats will come from changes in the biomes that the forests area embedded in and many of the forests are situated in areas where the biomes are projected to change (Table 9). The Afrotemperate forests are, however, likely to be negatively impacted by the temperature increases, particularly the maximum tem-peratures, as these forest are limited to cool climates. On a global scale forests occur in hot and humid areas as well as cool temperate areas. Increased temperature, providing there is sufficient precipitation, will not limit forest as a biome, however, it may result in substantive species changes.
Forests are widely spread over much of the eastern side of South Africa, and as such it is difficult to have a single pre-diction of climate change impacts. Much of the forest is close to the coast where they experience moderate tempera-
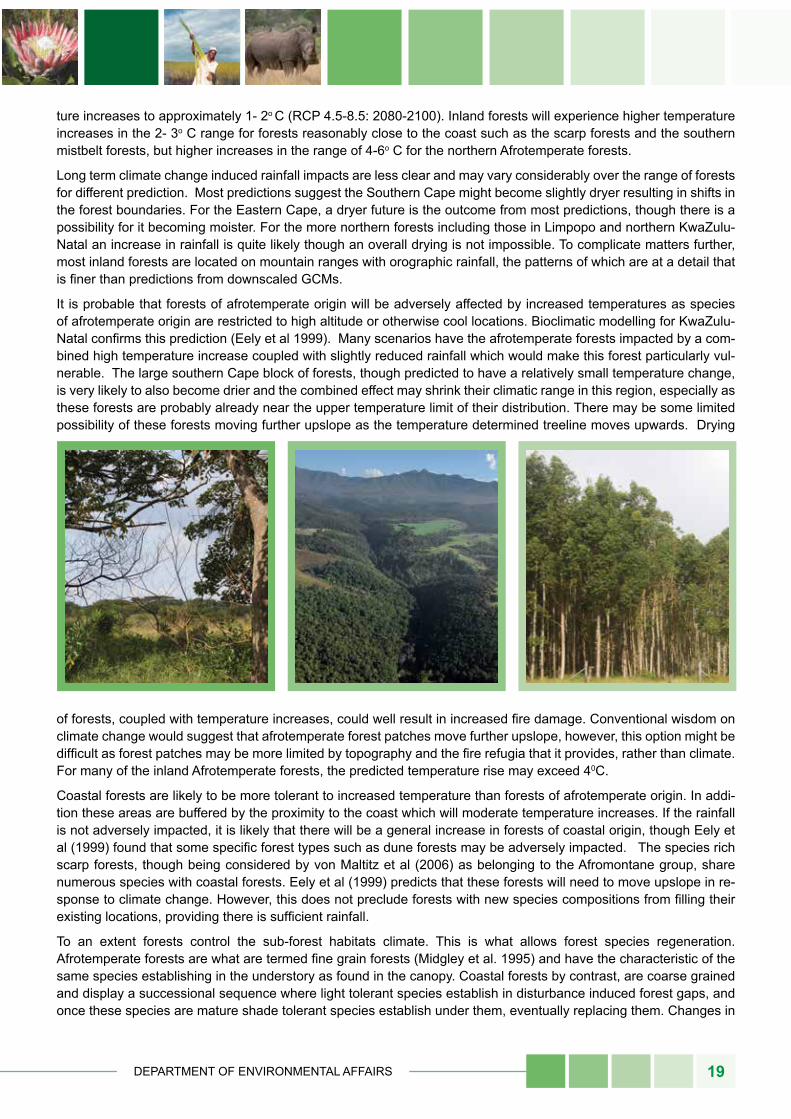
DEPARTMENT OF ENVIRONMENTAL AFFAIRS 19
ture increases to approximately 1- 2o C (RCP 4.5-8.5: 2080-2100). Inland forests will experience higher temperature increases in the 2- 3o C range for forests reasonably close to the coast such as the scarp forests and the southern mistbelt forests, but higher increases in the range of 4-6o C for the northern Afrotemperate forests.
Long term climate change induced rainfall impacts are less clear and may vary considerably over the range of forests for different prediction. Most predictions suggest the Southern Cape might become slightly dryer resulting in shifts in the forest boundaries. For the Eastern Cape, a dryer future is the outcome from most predictions, though there is a possibility for it becoming moister. For the more northern forests including those in Limpopo and northern KwaZulu-Natal an increase in rainfall is quite likely though an overall drying is not impossible. To complicate matters further, most inland forests are located on mountain ranges with orographic rainfall, the patterns of which are at a detail that is finer than predictions from downscaled GCMs.
It is probable that forests of afrotemperate origin will be adversely affected by increased temperatures as species of afrotemperate origin are restricted to high altitude or otherwise cool locations. Bioclimatic modelling for KwaZulu-Natal confirms this prediction (Eely et al 1999). Many scenarios have the afrotemperate forests impacted by a com-bined high temperature increase coupled with slightly reduced rainfall which would make this forest particularly vul-nerable. The large southern Cape block of forests, though predicted to have a relatively small temperature change, is very likely to also become drier and the combined effect may shrink their climatic range in this region, especially as these forests are probably already near the upper temperature limit of their distribution. There may be some limited possibility of these forests moving further upslope as the temperature determined treeline moves upwards. Drying
of forests, coupled with temperature increases, could well result in increased fire damage. Conventional wisdom on climate change would suggest that afrotemperate forest patches move further upslope, however, this option might be difficult as forest patches may be more limited by topography and the fire refugia that it provides, rather than climate. For many of the inland Afrotemperate forests, the predicted temperature rise may exceed 40C.
Coastal forests are likely to be more tolerant to increased temperature than forests of afrotemperate origin. In addi-tion these areas are buffered by the proximity to the coast which will moderate temperature increases. If the rainfall is not adversely impacted, it is likely that there will be a general increase in forests of coastal origin, though Eely et al (1999) found that some specific forest types such as dune forests may be adversely impacted. The species rich scarp forests, though being considered by von Maltitz et al (2006) as belonging to the Afromontane group, share numerous species with coastal forests. Eely et al (1999) predicts that these forests will need to move upslope in re-sponse to climate change. However, this does not preclude forests with new species compositions from filling their existing locations, providing there is sufficient rainfall.
To an extent forests control the sub-forest habitats climate. This is what allows forest species regeneration. Afrotemperate forests are what are termed fine grain forests (Midgley et al. 1995) and have the characteristic of the same species establishing in the understory as found in the canopy. Coastal forests by contrast, are coarse grained and display a successional sequence where light tolerant species establish in disturbance induced forest gaps, and once these species are mature shade tolerant species establish under them, eventually replacing them. Changes in
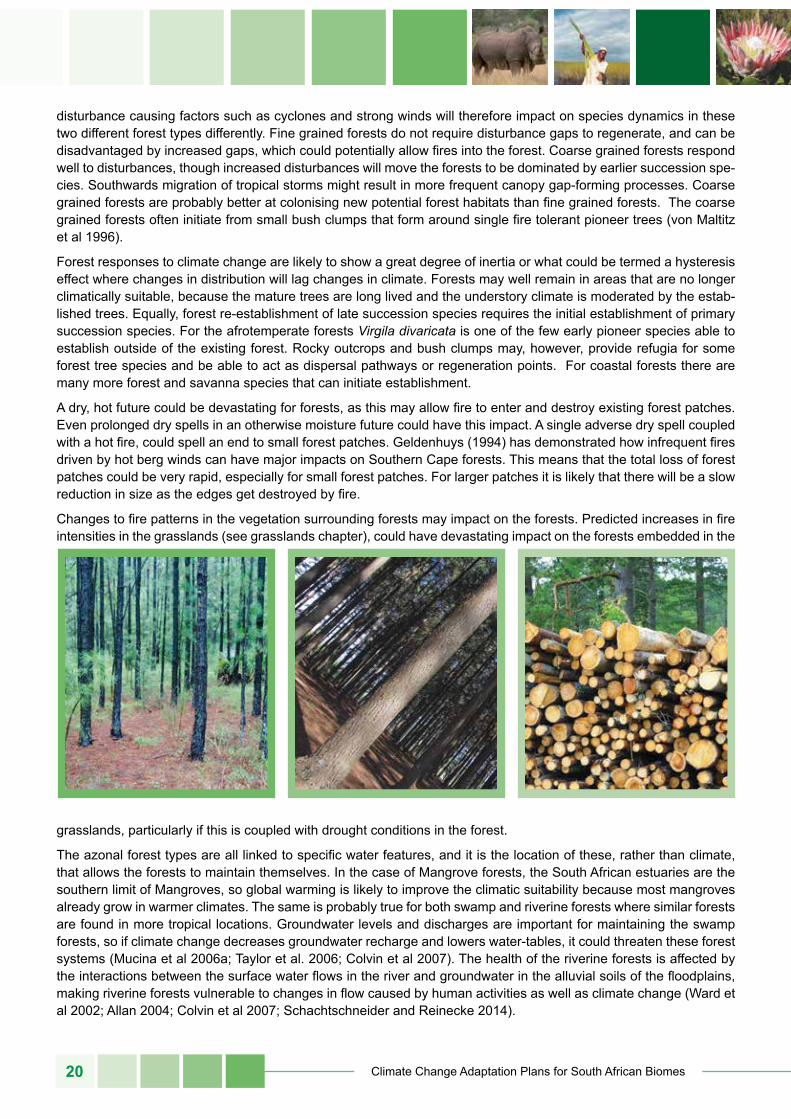
Climate Change Adaptation Plans for South African Biomes20
disturbance causing factors such as cyclones and strong winds will therefore impact on species dynamics in these two different forest types differently. Fine grained forests do not require disturbance gaps to regenerate, and can be disadvantaged by increased gaps, which could potentially allow fires into the forest. Coarse grained forests respond well to disturbances, though increased disturbances will move the forests to be dominated by earlier succession spe-cies. Southwards migration of tropical storms might result in more frequent canopy gap-forming processes. Coarse grained forests are probably better at colonising new potential forest habitats than fine grained forests. The coarse grained forests often initiate from small bush clumps that form around single fire tolerant pioneer trees (von Maltitz et al 1996).
Forest responses to climate change are likely to show a great degree of inertia or what could be termed a hysteresis effect where changes in distribution will lag changes in climate. Forests may well remain in areas that are no longer climatically suitable, because the mature trees are long lived and the understory climate is moderated by the estab-lished trees. Equally, forest re-establishment of late succession species requires the initial establishment of primary succession species. For the afrotemperate forests Virgila divaricata is one of the few early pioneer species able to establish outside of the existing forest. Rocky outcrops and bush clumps may, however, provide refugia for some forest tree species and be able to act as dispersal pathways or regeneration points. For coastal forests there are many more forest and savanna species that can initiate establishment.
A dry, hot future could be devastating for forests, as this may allow fire to enter and destroy existing forest patches. Even prolonged dry spells in an otherwise moisture future could have this impact. A single adverse dry spell coupled with a hot fire, could spell an end to small forest patches. Geldenhuys (1994) has demonstrated how infrequent fires driven by hot berg winds can have major impacts on Southern Cape forests. This means that the total loss of forest patches could be very rapid, especially for small forest patches. For larger patches it is likely that there will be a slow reduction in size as the edges get destroyed by fire.
Changes to fire patterns in the vegetation surrounding forests may impact on the forests. Predicted increases in fire intensities in the grasslands (see grasslands chapter), could have devastating impact on the forests embedded in the
grasslands, particularly if this is coupled with drought conditions in the forest.
The azonal forest types are all linked to specific water features, and it is the location of these, rather than climate, that allows the forests to maintain themselves. In the case of Mangrove forests, the South African estuaries are the southern limit of Mangroves, so global warming is likely to improve the climatic suitability because most mangroves already grow in warmer climates. The same is probably true for both swamp and riverine forests where similar forests are found in more tropical locations. Groundwater levels and discharges are important for maintaining the swamp forests, so if climate change decreases groundwater recharge and lowers water-tables, it could threaten these forest systems (Mucina et al 2006a; Taylor et al. 2006; Colvin et al 2007). The health of the riverine forests is affected by the interactions between the surface water flows in the river and groundwater in the alluvial soils of the floodplains, making riverine forests vulnerable to changes in flow caused by human activities as well as climate change (Ward et al 2002; Allan 2004; Colvin et al 2007; Schachtschneider and Reinecke 2014).
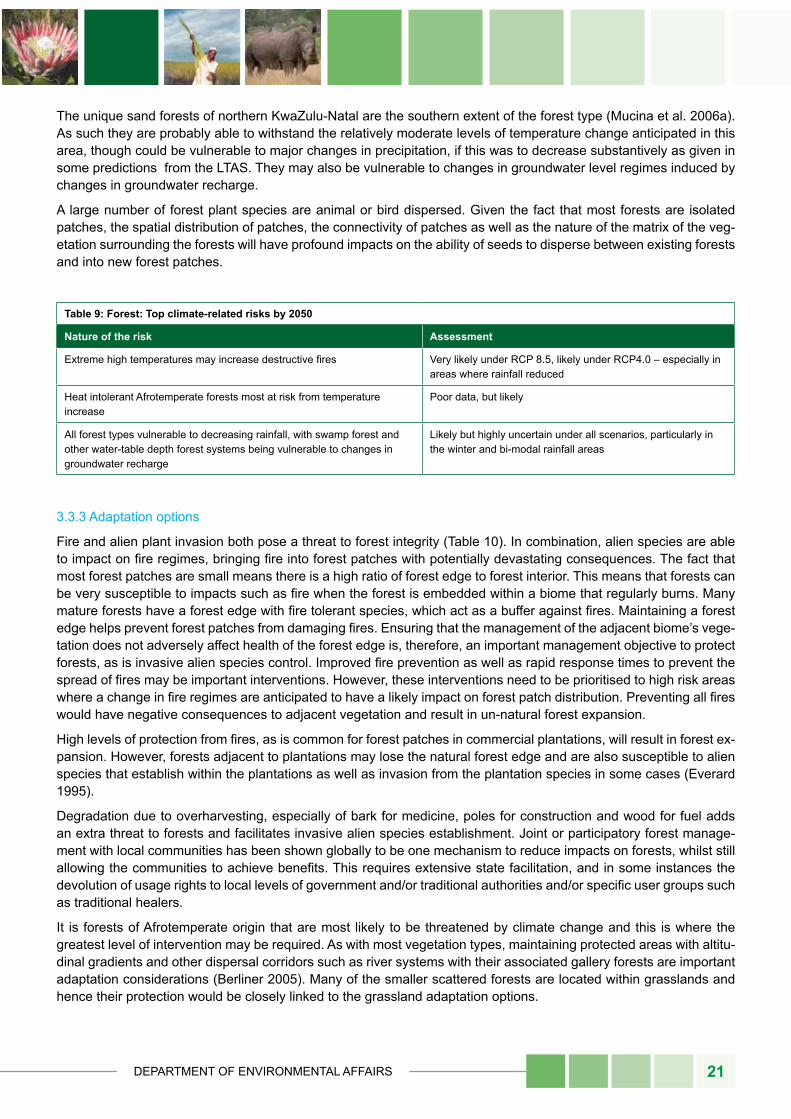
DEPARTMENT OF ENVIRONMENTAL AFFAIRS 21
The unique sand forests of northern KwaZulu-Natal are the southern extent of the forest type (Mucina et al. 2006a). As such they are probably able to withstand the relatively moderate levels of temperature change anticipated in this area, though could be vulnerable to major changes in precipitation, if this was to decrease substantively as given in some predictions from the LTAS. They may also be vulnerable to changes in groundwater level regimes induced by changes in groundwater recharge.
A large number of forest plant species are animal or bird dispersed. Given the fact that most forests are isolated patches, the spatial distribution of patches, the connectivity of patches as well as the nature of the matrix of the veg-etation surrounding the forests will have profound impacts on the ability of seeds to disperse between existing forests and into new forest patches.
table 9: forest: top climate-related risks by 2050
nature of the risk Assessment
Extreme high temperatures may increase destructive fires Very likely under RCP 8.5, likely under RCP4.0 – especially in areas where rainfall reduced
Heat intolerant Afrotemperate forests most at risk from temperature increase
Poor data, but likely
All forest types vulnerable to decreasing rainfall, with swamp forest and other water-table depth forest systems being vulnerable to changes in groundwater recharge
Likely but highly uncertain under all scenarios, particularly in the winter and bi-modal rainfall areas
3.3.3 Adaptation options
Fire and alien plant invasion both pose a threat to forest integrity (Table 10). In combination, alien species are able to impact on fire regimes, bringing fire into forest patches with potentially devastating consequences. The fact that most forest patches are small means there is a high ratio of forest edge to forest interior. This means that forests can be very susceptible to impacts such as fire when the forest is embedded within a biome that regularly burns. Many mature forests have a forest edge with fire tolerant species, which act as a buffer against fires. Maintaining a forest edge helps prevent forest patches from damaging fires. Ensuring that the management of the adjacent biome’s vege-tation does not adversely affect health of the forest edge is, therefore, an important management objective to protect forests, as is invasive alien species control. Improved fire prevention as well as rapid response times to prevent the spread of fires may be important interventions. However, these interventions need to be prioritised to high risk areas where a change in fire regimes are anticipated to have a likely impact on forest patch distribution. Preventing all fires would have negative consequences to adjacent vegetation and result in un-natural forest expansion.
High levels of protection from fires, as is common for forest patches in commercial plantations, will result in forest ex-pansion. However, forests adjacent to plantations may lose the natural forest edge and are also susceptible to alien species that establish within the plantations as well as invasion from the plantation species in some cases (Everard 1995).
Degradation due to overharvesting, especially of bark for medicine, poles for construction and wood for fuel adds an extra threat to forests and facilitates invasive alien species establishment. Joint or participatory forest manage-ment with local communities has been shown globally to be one mechanism to reduce impacts on forests, whilst still allowing the communities to achieve benefits. This requires extensive state facilitation, and in some instances the devolution of usage rights to local levels of government and/or traditional authorities and/or specific user groups such as traditional healers.
It is forests of Afrotemperate origin that are most likely to be threatened by climate change and this is where the greatest level of intervention may be required. As with most vegetation types, maintaining protected areas with altitu-dinal gradients and other dispersal corridors such as river systems with their associated gallery forests are important adaptation considerations (Berliner 2005). Many of the smaller scattered forests are located within grasslands and hence their protection would be closely linked to the grassland adaptation options.
Climate Change Adaptation Plans for South African Biomes22
Species compositional changes rather than total forest collapse is likely as a consequence of global warming for many forest patches. However the disjointed nature of forest patches may make species migration exceptionally difficult. Protecting existing and newly formed forest patches from human degradation and fire is an important mech-anism to allow for natural forest migration.
If, in the future, it becomes apparent that natural dispersal is not possible, then decisions may be needed on whether artificially assisted species migration is justifiable. This would be an extreme measure and holds numerous ethical considerations, but may be the only way to allow forests to track a rapidly changing environment (von Maltitz et al. 2006).
Afrotemperate forests tend to be fine grained, and as such the forest species establish best under an already closed forest canopy. Dr Coert Geldenhuys has shown that timber plantations of exotic timber species can play a valuable role in aiding indigenous forest re-establishment. Plantation forests might, therefore, play a role in allowing forest species to move to new climatically suited locations along altitudinal gradients. The fire control associated with plan-tation forestry also assists indigenous forest spread.
There may be circumstances relating particularly to coastal forests where the limiting of forest expansion may be de-sirable to protect other vegetation types from being invaded by forests. Controlled use of fire and plantings of pioneer trees may be an important tool in this regard.
Forests store more carbon in their woody vegetation than any other southern African vegetation type. However, the soil carbon store tends to be lower than in grasslands of similar climatic conditions. Neverthess, the extremely limited spatial extent of forests means that their total contribution to carbon sequestration in South Africa is relatively low. A decline in the spatial extent of forests will have a small impact on overall emissions, whilst the opposite is true if forests expand. It is also possible that forests may become a net sink in a wetter future due to increased NPP.
Loss of forest would impact primarily on the conservation and tourism sectors. However, in predominantly grassland areas, forests also play an important role in providing fuelwood, poles, and herbal resources to local communities. Loss of this resource would therefore have negative impacts on household budgets as alternative fuel and building materials would need to be sourced. Ironically, the large areas of invasive exotic trees partly mitigates this loss. The informal medicinal trade could be adversely affected from a decrease in medicinal species.
table 10: forest: top climate-related adaptation options
option risk remaining after full adaptation
Fire and alien plant management Small under RCP4.0, high under RCP 8.5,
Spatial planning (often linked to the biomes in which forests are im-bedded)
Will vary extensively for different forest types and specific locations
Maintain ecosystems in which the forest is embedded and control in-vasions of the forest edges
Will reduce risks to forest integrity and persistence under all scenari-os, most effective under the low risk scenario
Restore forest margins and degraded forest areas, including the use of invasive alien species stands to allow for forest species recruit-ment
As above
Remove stress from over-utilisation of forests As above
DEPARTMENT OF ENVIRONMENTAL AFFAIRS 23
Box 5: the southern Cape forestry region
The southern Cape has the single largest block of indigenous forestry in the country, about 60 000 hectares. These forest were extensively exploited in the early days of European settlement in the cape as they were the main source of wood for the growing colony. Historically, the Department of Forestry managed these forests and had dedicated forestry staff as well as a dedicated research team linked to the region. Due to the strategic conservation value of these forests they were transferred to the South African National Parks Board. The forests are now well protected, but sustainable use is allowed in some areas. This area of forest has been extensively studied. It has been mapped in detail and classified into six major subtypes based on moisture and forest height. The area is divided into management blocks with five different man-agement objectives: a) timber utilisation, b) protection, c) nature reserves, d) recreation and e) research (Vermeulen 2001). A key product from this forest is the seven week fern, which is harvested under licence and sold to the national and international florist market. A limited amount of timber is harvested using what has been termed the pre-emptive mortality methodology. Harvested blocks are routinely surveyed, with long term records being kept of all trees. Individual trees are assessed against them showing signs of senility (such as crown dieback or base rot) and these individual trees are harvested. Exceptional care is taken to extract the wood with minimal disturbance to the remainder of the forest (Seydack 1995). The southern cape is one of the key tourism destinations in the country, with the forests being one of the tourism features.
3.4 fynbosAuthors: Daleen Lötter, David le Maitre, Guy Midgley
3.4.1 Description of the biome
Fynbos is the predominant vegetation of the small botanical region known as the Cape Floristic Kingdom (CFR). It has a remarkably high species density and diversity with over 9000 vascular plant species, of which 70% are endem-ic (Goldblatt and Manning, 2000; Rebelo et al 2006). It is estimated that 75 % of South Africa’s rare and threatened plants are found in the fynbos biome, the highest concentration in the world. This status highlights its uniqueness and vulnerability to anthropogenic threats. The biome is particularly vulnerable to climate change as it is already under immense pressure from alien species invasions, extensive land transformation and the associated habitat fragmen-tation and, changes in fire regimes (Cowling et al 2003; Christensen et al 2007; van Wilgen et al 2010). However, there are opportunities for mitigation and for adapting to future climate change in order to reduce the fynbos biome’s vulnerability.
The biome is defined structurally by co-dominance of low shrubs, grass-like reeds and sedges, and tall shrubs, and a low (in the West) to moderate representation (in the East) of grasses (Rutherford and Westfall, 1986). The CFR covers approximately 87,892 km2 at the southern tip of Africa and stretches across the Western (70%), Eastern (25%) and Northern Cape (5%). The fynbos biome is subdivided in two distinct vegetation complexes, fynbos and renosterveld (Goldblatt & Manning, 2000; Rebelo et al 2006). Fynbos plants are readily recognised by the sclero-phyllous (hard, tough and leathery leaved) and microphyllous (small leaved) nature of almost all woody plants. This evergreen, fire-prone shrubland is frequently dominated by representatives of one of more of three plant families: shrubby Proteaceae and Ericaceae and reed-like Restionaceae (Cowling et al 1997). The Proteaceae are an ecolog-ically and economically important plant group and form the basis of an extensive cut flower industry (Turpie, 2003). The high species richness of geophytic plants in the shorter, shrub-dominated renosterveld is a distinctive feature of the vegetation type (Cowling et al 1997). Azonal afro-montane forests occur in relatively fire-free areas such as wind-protected valleys (“kloofs”) and on scree slopes, and can expand spatially if fire is excluded (Midgley et al 1997).
The remarkable plant diversity of the fynbos biome is due in part to the significant variation which exists in altitude, rainfall, aspect, and soil (Cowling et al 1997). The historic reliability of the winter rainfall over many thousands to hundreds of thousands of years is also thought to have been a key factor (Cowling et al 2005; Chase and Meadows, 2007). The western part of the fynbos biome has a typical winter rainfall climate, while further to the east, the rainfall pattern is characterized by spring and autumn peaks. Nutrient-poor soils derived from the sandstones of the Table Mountain Group are a key feature of fynbos, but fynbos community types do grow on heavier shale band soils. By contrast, renosterveld is largely confined to more fertile fine-grained clay or silt soils derived from the shales and granites characteristic of the lowland areas.
The vegetation of the Fynbos biome is fire-dependent and thus requires regular burning for its persistence (Van Wilgen et al 1994, 2010). Most species have specific strategies to ensure regeneration from seeds after fires, al-though many species can resprout following fire (Le Maitre and Midgley, 1992). The optimum fire frequency for fyn-bos is 10 - 15 years, but fire intensity and season of burn also play important roles in the fire ecology of the fynbos biome. Variations in fire season, intensity and frequency are important in providing optimal recruitment conditions for different species, and in maintaining diversity.
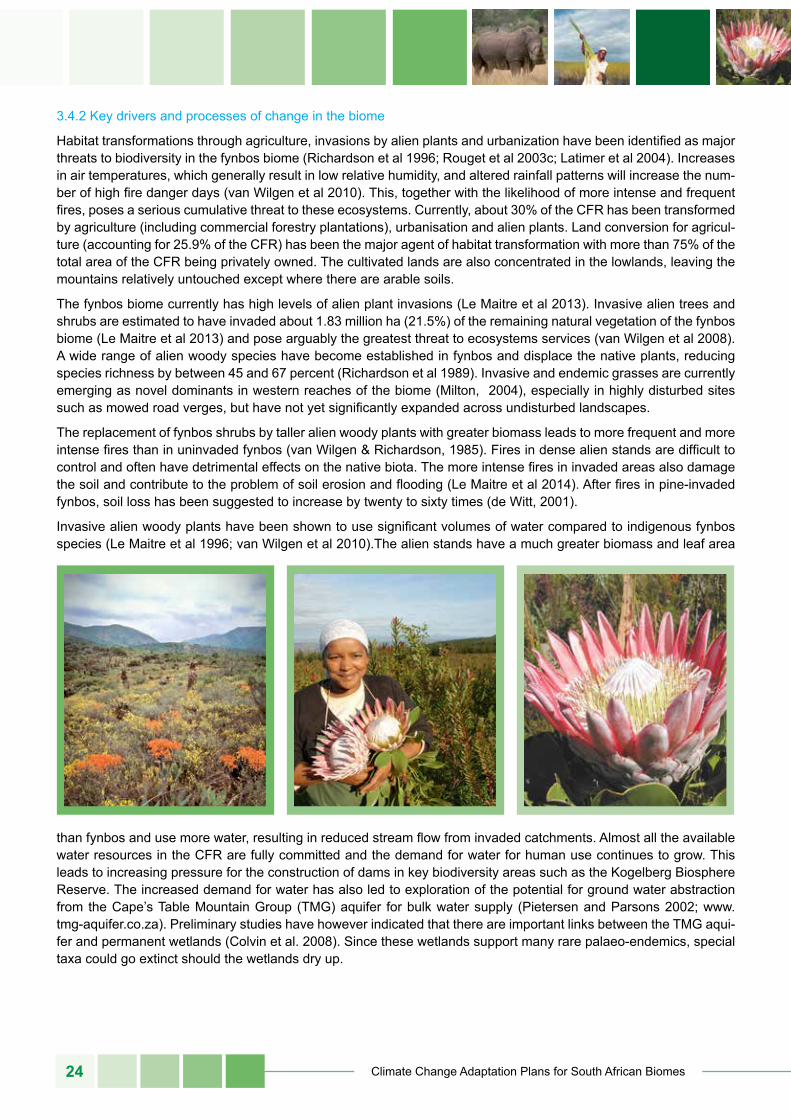
Climate Change Adaptation Plans for South African Biomes24
3.4.2 Key drivers and processes of change in the biome
Habitat transformations through agriculture, invasions by alien plants and urbanization have been identified as major threats to biodiversity in the fynbos biome (Richardson et al 1996; Rouget et al 2003c; Latimer et al 2004). Increases in air temperatures, which generally result in low relative humidity, and altered rainfall patterns will increase the num-ber of high fire danger days (van Wilgen et al 2010). This, together with the likelihood of more intense and frequent fires, poses a serious cumulative threat to these ecosystems. Currently, about 30% of the CFR has been transformed by agriculture (including commercial forestry plantations), urbanisation and alien plants. Land conversion for agricul-ture (accounting for 25.9% of the CFR) has been the major agent of habitat transformation with more than 75% of the total area of the CFR being privately owned. The cultivated lands are also concentrated in the lowlands, leaving the mountains relatively untouched except where there are arable soils.
The fynbos biome currently has high levels of alien plant invasions (Le Maitre et al 2013). Invasive alien trees and shrubs are estimated to have invaded about 1.83 million ha (21.5%) of the remaining natural vegetation of the fynbos biome (Le Maitre et al 2013) and pose arguably the greatest threat to ecosystems services (van Wilgen et al 2008). A wide range of alien woody species have become established in fynbos and displace the native plants, reducing species richness by between 45 and 67 percent (Richardson et al 1989). Invasive and endemic grasses are currently emerging as novel dominants in western reaches of the biome (Milton, 2004), especially in highly disturbed sites such as mowed road verges, but have not yet significantly expanded across undisturbed landscapes.
The replacement of fynbos shrubs by taller alien woody plants with greater biomass leads to more frequent and more intense fires than in uninvaded fynbos (van Wilgen & Richardson, 1985). Fires in dense alien stands are difficult to control and often have detrimental effects on the native biota. The more intense fires in invaded areas also damage the soil and contribute to the problem of soil erosion and flooding (Le Maitre et al 2014). After fires in pine-invaded fynbos, soil loss has been suggested to increase by twenty to sixty times (de Witt, 2001).
Invasive alien woody plants have been shown to use significant volumes of water compared to indigenous fynbos species (Le Maitre et al 1996; van Wilgen et al 2010).The alien stands have a much greater biomass and leaf area
than fynbos and use more water, resulting in reduced stream flow from invaded catchments. Almost all the available water resources in the CFR are fully committed and the demand for water for human use continues to grow. This leads to increasing pressure for the construction of dams in key biodiversity areas such as the Kogelberg Biosphere Reserve. The increased demand for water has also led to exploration of the potential for ground water abstraction from the Cape’s Table Mountain Group (TMG) aquifer for bulk water supply (Pietersen and Parsons 2002; www.tmg-aquifer.co.za). Preliminary studies have however indicated that there are important links between the TMG aqui-fer and permanent wetlands (Colvin et al. 2008). Since these wetlands support many rare palaeo-endemics, special taxa could go extinct should the wetlands dry up.
DEPARTMENT OF ENVIRONMENTAL AFFAIRS 25
table 11: fynbos: top ecosystem services
ecosystem service trends and importance
Water flow and water quality regulation - sustained yield of high quality water
The mountain catchments are critical water source areas, modelling studies indicate that flows have declined
Soil stabilisation Fynbos landscapes are characterised by rugged mountains with stable soils, but granite and shale-derived soils are prone to erosion and deep sands to wind erosion; generally stable
Nature–based tourism, non-consumptive use Tourism is major industry in the CFR and is increasing
Production of wildflowers, herbal and medicinal products and for the horticultural trade
There have been substantial increases in the production for both domestic and international markets, but these developments have also resulted in the cultivation of large areas pristine fynbos
Biodiversity resources - endemic taxa offer unique gene pools, ma-terial for intellectual and scientific exploration, future options; diverse indigenous pollinators for crops
Currently of limited importance but increasing in value and potential-ly high value
3.4.3 Vulnerability of the biome to climate change
Previous studies suggested that the Fynbos and Succulent Karoo biomes would be the most vulnerable to projected climate changes in the 21st century (e.g. Von Maltitz et al. 2006). The main reason for this is the potential reduction in winter rainfall that could follow a southerly shift of the westerly rainfall bearing frontal systems that currently in-crease in prevalence during winter months. More recent projections indicate a potentially lower risk for these biomes if this southerly shift does not eventuate (DEA 2011). The fynbos biome may also experience a decrease in rainfall frequency and increase in the intensity of rain events, as well as a shift in seasonality with increased summer rainfall in the east (e.g., the southern Cape). Changes in rainfall will, in turn, affect critical water resources and fire regimes with significant implications for biodiversity patterns and processes (Bomhard et al., 2005).
The lowland areas are at particular risk of major biodiversity loss because the combined impacts of habitat loss and climate change will render some vegetation types and species exceptionally vulnerable. In relatively flat areas, with more nutrient rich soil, agriculture has caused severe fragmentation of natural habitat. It is estimated that only 4% to 6% of the original renosterveld habitat remains, almost all of it on privately owned land (Low and Rebelo, 1996). This transformation seriously impairs many species’ ability to adapt to changing climate conditions by migration, and through disruption of the fire regime.
Species most at risk are those with limited distribution ranges and/or poor dispersal abilities, habitat specialists, and those that are responsive to specific disturbance regimes. Certain Protea species which have ant-dispersed seed (Bond and Slingsby, 1983) are particularly vulnerable to climate change as fragmented landscapes will greatly limit the distance that the species can migrate. Shifting of species ranges is further limited by the geographic location of the CFR at the south-western tip of the African continent, and to an extent by species-specific soil requirements (Midgley et al. 2006; Schurr et al. 2007). With warming climates, the areas of current climatic conditions supportive of species tend to shrink as they contract up mountain slopes or are displaced southwards beyond the shoreline.
Impacts on the fynbos will, to some extent, be ameliorated by the mountainous terrain which provides more climat-ically suitable refugia than flatter landscapes such as the karoo biome (Cowling et al. 1997; Linder, 2003). South facing mountain slopes and river gorges provide moisture and cooler temperatures with less frequent fires, and may harbour Afromontane forest vegetation. Steep environmental gradients in the fynbos environment also mean that plants and animals may have to move shorter distances to find suitable climatic conditions. This will however depend on the rate of climate change, how fast species can track new habitat and species-specific abilities to disperse seed, and specific soil dependencies.
The fynbos biome is especially vulnerable to species invasions and the interplay of hotter and drier conditions would likely change fire regimes (increasing fire frequency or intensity) and subsequent invasion patterns by alien plants (Midgley et al. 2005; Wilson et al. 2010). Rising atmospheric CO2 levels may provide an additional boost to woody invasive plant growth rates, especially for nitrogen fixers such as Australian Acacia species. Changes in fire regime would not only affect alien invasions but also post-fire regeneration responses of vegetation. Many species are vul-
Climate Change Adaptation Plans for South African Biomes26
nerable to seed bank destruction by high fire intensities, while changes in rainfall seasonality would alter the timing of the fire season and affect all plants which sprouts after fire (Keeley et al. 2010). Under climate change, fire extent may increase due to a higher frequency of fire-storm conditions that encourages greater fire coverage, and this could threaten mammal and bird species that depend on plant resources such as nectar. An increased risk of fire may also pose a particular threat to economic sectors that operate within the fynbos biome, such as forest plantations and the flower, fruit and wine industries.
table 12: fynbos: top climate-related risks by 2050
nature of the risk Assessment
Increased intensity and frequency of fires and more “out-of-season” fires
Very likely under all scenarios and will increase in impact as the magnitude of the change increases
Alien invasive species, especially grasses in lowland ecosystems Likely under all scenarios and will be facilitated by nutrients from agriculture and air pollution
Habitat transformation/fragmentation, particularly on the lowlands through agriculture and urbanisation
Historically, land-transformation has been driven by food prices and more recently by increases in wine consumption; demand from China is expected to increase conversion of land to vineyards significantly; water for irrigation will be a major constraint on such expansion
3.4.4 Adaptation practices and options in the fynbos biome
There are opportunities for mitigation and for adapting to future climate change in order to reduce the vulnerability of the fynbos biome. Adaptation options include a holistic, multi-user-based approach to management of the land-scape outside formally protected areas, purchasing new reserve areas, and prioritising opportunities for successful intervention (Cowling et al 2003; Von Maltitz et al 2006; Freeth et al 2007; Cowling et al 2010). Translocation of species to more suitable locations or conserving biodiversity ex-situ in gene banks, zoos and botanical gardens is often suggested as an option. However, the particularly high diversity of plants and invertebrates and complex web of interactions between plants, pollinators and dispersers, means that this is only an option for a few, key species. Thus the first priority is to focus on in-situ management of biodiversity across mixed-use landscapes and between multiple land management systems, including ecologically sustainable use of soil, water and vegetation resources. The FynbosFire project, funded by the Global Environmental Facility’s Climate Adaptation Fund, is developing the capacity of Fire Protection Agencies in the fynbos to manage and control fires (http://www.fynbosfire.org.za/). The project also supports research into the impacts of climate change on fire hazard and on managing the wildland-ur-ban interface to reduce the vulnerability of human settlements, other infrastructure and agricultural crops, including plantations, to wildfires.
The Biodiversity Stewardship Programme implemented by CapeNature is one mechanism whereby private landown-ers, communities and other stakeholders enter into legal agreements and, in return, are assisted in managing their properties using sound conservation management principles. Support and advice are given to farmers in planning invasive alien species clearing, fire management and establishing or maintaining corridors of natural areas where possible. Priorities are determined on a landscape scale by identifying possible corridors in critical biodiversity areas. The government-supported LandCare programme also encourages the sustainable management and use of agri-cultural natural resources, and in the Western Cape these two programmes work closely together. The benefits for farmers, and society, include greater productivity and food security through increased quantity and quality of water, more productive wetlands, lower risk of soil loss and reduced frequency and intensity of fires and floods. Although both these programmes make significant contributions to creating new protected areas and conserving biodiversity outside protected areas, they are currently under resourced and unable to effectively support landowners.
Other natural resource management programmes which fulfil an important role in addressing threats to the produc-tive use of land and water resources in focal areas include Working for Water, Working for Wetlands and Working on Fire. However, their impact would be greater if there is closer cooperation between programmes, conservation agen-cies and civil society. One example of successful integrated implementation between various parties is the Agulhas
DEPARTMENT OF ENVIRONMENTAL AFFAIRS 27
Biodiversity Initiative where a landscape-level approach is followed to facilitate conservation. The strong partnership between government initiatives, landowners and conservation organisations, with teams complementing each oth-er’s work, secures a healthy natural environment to provide benefits for all.
Specific partnerships between different agricultural industries and the conservation sector have also proven very effective to conserve critical ecosystems on private land through the adoption of biodiversity best practice guidelines. By adhering to biodiversity best practices, farmers not only increase sustainability of their own enterprises but also secure improved ecosystem services to the larger society. An excellent example is the biodiversity and wine initiative (BWI) which has 178 members formally implementing environmentally responsible management practices and also conserving a total area of 130 717 ha between producers.
The ecologically sustainable management, formal conservation and eventual connection of existing natural areas on private land, linked to a network of other conservation areas in the landscape, create an unbroken path (corri-dor) of suitable habitat along which species are able to disperse or migrate (Cowling et al 2003; Rouget et al 2006). This connectivity of the landscape is key to species persistence under projected climate change. To achieve habitat connectivity and expand existing reserve systems, high biodiversity value land can also be purchased in certain cases although it often has high costs associated with acquisition. Making full use of opportunities for Biodiversity Stewardship Programme’s different categories is a viable and effective alternative to purchasing and managing land by the state.
Apart from such formally implemented adaptation strategies, certain civil society focussed adaptation measures can also be encouraged. There are already effective citizen science programmes in place which aim to stimulate public involvement in biodiversity conservation. The South African Protea and Bird Atlas are good examples of public par-ticipation in recording information on plant and bird distribution to stimulate awareness and enjoyment of the environ-ment thus engendering a conservation ethic.
Monitoring (in situ and satellite observations) over time for climate change impacts (e.g. changes in plant diversity and invasive species) offers the basis for adaptive management strategies. Using remote sensing to track species loss is however less useful in the fynbos biome because we are likely to lose species without changing the basic structure of the vegetation. It is also difficult to monitor diversity changes in the fynbos biome since vegetation responses during regeneration phases after fires are strongly affected by conditions preceding and following the particular fire.
table 13: fynbos: top climate-related adaptation options
option risk remaining after full adaptation
Maintaining effective land management on state land through wa-ter-supply based funding, especially for controlling invasive alien plant species and for managing fires; and support effective manage-ment of private land
Moderate at best - although this will minimise the adverse impacts of invasive alien species (on both biodiversity and water resources) and fire-driven species loss, there will be loss
Implement the existing biome-wide and municipal conservation plans, including expanding existing reserve systems, and purchasing high biodiversity value land, especially in the lowlands
Moderate at best because the high endemism and restricted distribu-tions of many species means that substantial species loss and eco-system change is unavoidable
Partnerships between agricultural and conservation sector to find more effective ways of managing landscapes for biodiversity and eco-system services, including: controlling invasive alien species; public and private sector involvement in biodiversity conservation (partner-ships, community-based conservation, citizen science, fire protection associations); in-situ management of biodiversity on private land through Biodiversity Stewardship Programme
Moderate at best because the high endemism and restricted distribu-tions of many species means that substantial species loss and eco-system change is unavoidable
Monitoring plant diversity and invasive species (in situ and satellite observations) to track whether ecosystems are responding as antic-ipated
Moderate but it will be essential to avoid surprises
Climate Change Adaptation Plans for South African Biomes28
Box 6: Case studies on changes in the distribution of species in the fynbos
proteasMidgley et al. (2003), in a study of climate impacts on 330 Protea species projected a loss of 51% to 65% of the area extent of the fynbos biome by 2050, depending on the climate scenario used. One-third of the Protea species were found to have com-plete range dislocation, only 5% would retain more than two-thirds of their current range and ten percent of the species had no predicted range in the future scenar-io. In follow-up work on Proteaceae, migration rate limitations were also assessed (Midgley et al. 2006), and it was found that in persisting species, range loss with climate change slowed with increasing change, possibly because species that did not suffer complete range dislocation (and inferred extinction) had ranges contract-ing into core areas that were relatively more resilient to climate change.
Cape bulbulThe Cape Bulbul (Pycnonotus capensis) is a member of the bulbul family of passerine birds. It is an endemic species and lives among taller fynbos, coastal and riv-erine shrub and in alien trees such as wattles and Port Jackson. Simmons et al. (2005) found that this frugivo-rous winter-rainfall bird may experience a range loss of 37%, (generally southwards) by 2050.
In both of these case studies, predictions of species range change are based on distribution models which have certain limitations associated with them. They are however useful as first-approximations and support tools to explore climate change associated range shifts.
Box 7: Anticipating surprises in the fynbos biome
urbanisation and fertiliser drift/n depositionWith increased urbanisation and agricultural intensification, anthropogenic nitrogen (N) emissions have increased far above natural, biogenic inputs. An increase in N inputs (i.e., through deposition and fertilization) may cause direct harm to fynbos vegetation which grows on some of the most nutrient poor soils in the world. Fynbos shrublands are adapted to low soil N availability and this might be one of the explanations for the extremely high species diversity and endemism in fynbos.
reproductive phenologyFlowering and fruiting phenology of plants are sensitive to environmental cues such as temperature and moisture. Increased temperature might influence the reproductive phenology of fynbos plants and their interdependent pollinators and dispersers with which they have co-evolved. Changes that affect one will have implications for the other. A plant that flowers 2-3 weeks earlier than usual may not be visited by the specialized insect that it needs for pollination, unless the pollinator or disperser has made the shift as well. Hence, fynbos plants and their pollinators and dispersers might become decoupled under scenarios of climate change.
new alien invasives Comprehensive research is dedicated to understand how established invaders may respond to changing climates. However, less is known about the potential of climate change to facilitate new invasions or to enable presently non-invasive naturalised species to become invasive. What if eucalypts began to invade the way they have done in Australia? Could novel ant invaders appear? The seeds of about 20 percent of fynbos species are dispersed by native ant species, including more than half of the huge protea family (Bond and Slingsby, 1983). If novel ant invaders displace local ant species, it could potentially result in the loss, or decline of many ant-dispersed fynbos plants (Adams, 2009).
rising Co2, fuel accumulation and fire frequencyAtmospheric CO2 levels have risen from a measured concentration of 316 parts per million (ppm) in 1960 to 401.88 ppm currently. This con-centration is accelerating from decade to decade. The current average annual rate of increase is 2.07 parts per million (ppm) which is more than double the rate of increase in the 1960s. The predicted increase in temperatures coupled with accelerating CO2 levels, may promote the growth and productivity of certain species in the fynbos biome and have a strong positive response on invasive alien species. This is likely to affect the abundance and composition of fuel loads, and hence the frequency and intensity of fires.
3.5 GrasslandAuthors: RJ Scholes and GP von Maltitz
3.5.1 Description of the biome
Grasslands are defined as ecosystems dominated by grasses. In the South African case these are mostly perennial C44 grasses, but annual grasses, C3 grasses, sedges, forbs and bulbs are also important, and in particular land-scape positions trees can naturally occur. Before widespread European settlement in the 19th century the extent of the grassland biome in South Africa was about 0.33 million km2 (~30 % of the land area), mainly on the central plateau (the ‘Highveld’). There are similar grasslands in the Indian Ocean Coastal Belt, and ecological and species affinities with grass component of the Nama Karoo and Savanna biomes. The grassland biome includes much of
4 C3 and C4 refer to alternative photosynthetic pathways. Most trees and forbs are C3 as are grasses of temperate origin. Tropical grasses tend to be C4.
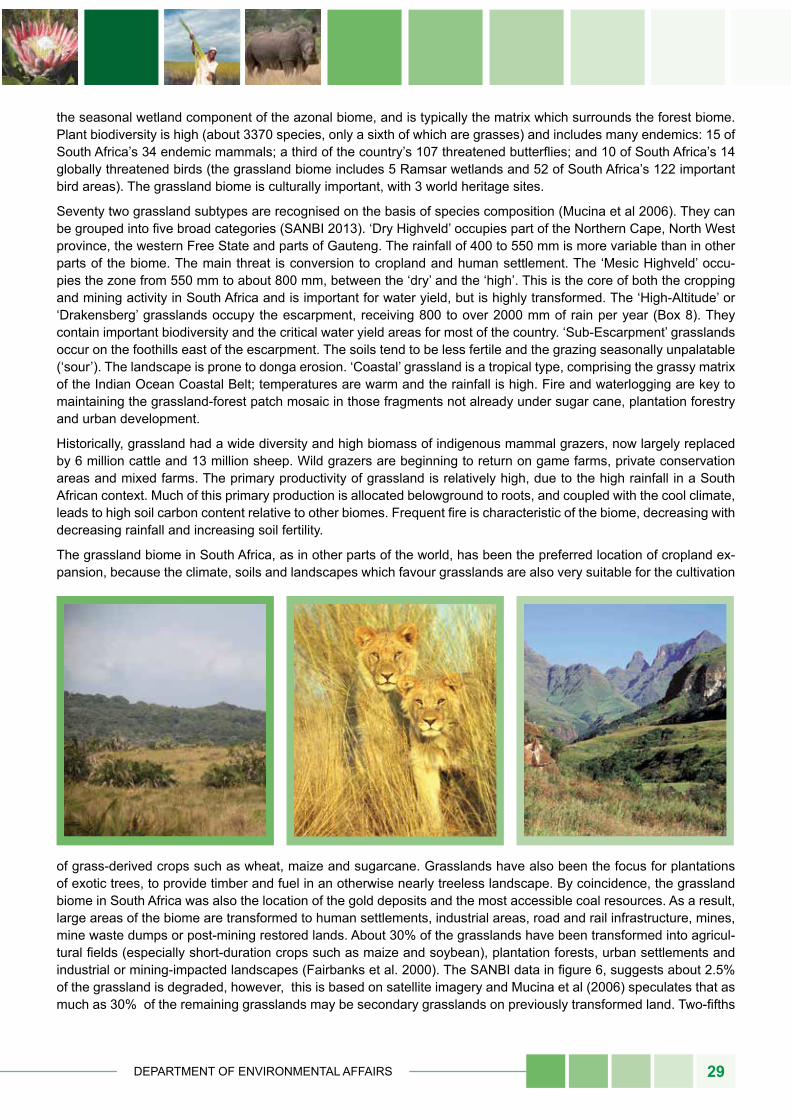
DEPARTMENT OF ENVIRONMENTAL AFFAIRS 29
the seasonal wetland component of the azonal biome, and is typically the matrix which surrounds the forest biome. Plant biodiversity is high (about 3370 species, only a sixth of which are grasses) and includes many endemics: 15 of South Africa’s 34 endemic mammals; a third of the country’s 107 threatened butterflies; and 10 of South Africa’s 14 globally threatened birds (the grassland biome includes 5 Ramsar wetlands and 52 of South Africa’s 122 important bird areas). The grassland biome is culturally important, with 3 world heritage sites.
Seventy two grassland subtypes are recognised on the basis of species composition (Mucina et al 2006). They can be grouped into five broad categories (SANBI 2013). ‘Dry Highveld’ occupies part of the Northern Cape, North West province, the western Free State and parts of Gauteng. The rainfall of 400 to 550 mm is more variable than in other parts of the biome. The main threat is conversion to cropland and human settlement. The ‘Mesic Highveld’ occu-pies the zone from 550 mm to about 800 mm, between the ‘dry’ and the ‘high’. This is the core of both the cropping and mining activity in South Africa and is important for water yield, but is highly transformed. The ‘High-Altitude’ or ‘Drakensberg’ grasslands occupy the escarpment, receiving 800 to over 2000 mm of rain per year (Box 8). They contain important biodiversity and the critical water yield areas for most of the country. ‘Sub-Escarpment’ grasslands occur on the foothills east of the escarpment. The soils tend to be less fertile and the grazing seasonally unpalatable (‘sour’). The landscape is prone to donga erosion. ‘Coastal’ grassland is a tropical type, comprising the grassy matrix of the Indian Ocean Coastal Belt; temperatures are warm and the rainfall is high. Fire and waterlogging are key to maintaining the grassland-forest patch mosaic in those fragments not already under sugar cane, plantation forestry and urban development.
Historically, grassland had a wide diversity and high biomass of indigenous mammal grazers, now largely replaced by 6 million cattle and 13 million sheep. Wild grazers are beginning to return on game farms, private conservation areas and mixed farms. The primary productivity of grassland is relatively high, due to the high rainfall in a South African context. Much of this primary production is allocated belowground to roots, and coupled with the cool climate, leads to high soil carbon content relative to other biomes. Frequent fire is characteristic of the biome, decreasing with decreasing rainfall and increasing soil fertility.
The grassland biome in South Africa, as in other parts of the world, has been the preferred location of cropland ex-pansion, because the climate, soils and landscapes which favour grasslands are also very suitable for the cultivation
of grass-derived crops such as wheat, maize and sugarcane. Grasslands have also been the focus for plantations of exotic trees, to provide timber and fuel in an otherwise nearly treeless landscape. By coincidence, the grassland biome in South Africa was also the location of the gold deposits and the most accessible coal resources. As a result, large areas of the biome are transformed to human settlements, industrial areas, road and rail infrastructure, mines, mine waste dumps or post-mining restored lands. About 30% of the grasslands have been transformed into agricul-tural fields (especially short-duration crops such as maize and soybean), plantation forests, urban settlements and industrial or mining-impacted landscapes (Fairbanks et al. 2000). The SANBI data in figure 6, suggests about 2.5% of the grassland is degraded, however, this is based on satellite imagery and Mucina et al (2006) speculates that as much as 30% of the remaining grasslands may be secondary grasslands on previously transformed land. Two-fifths
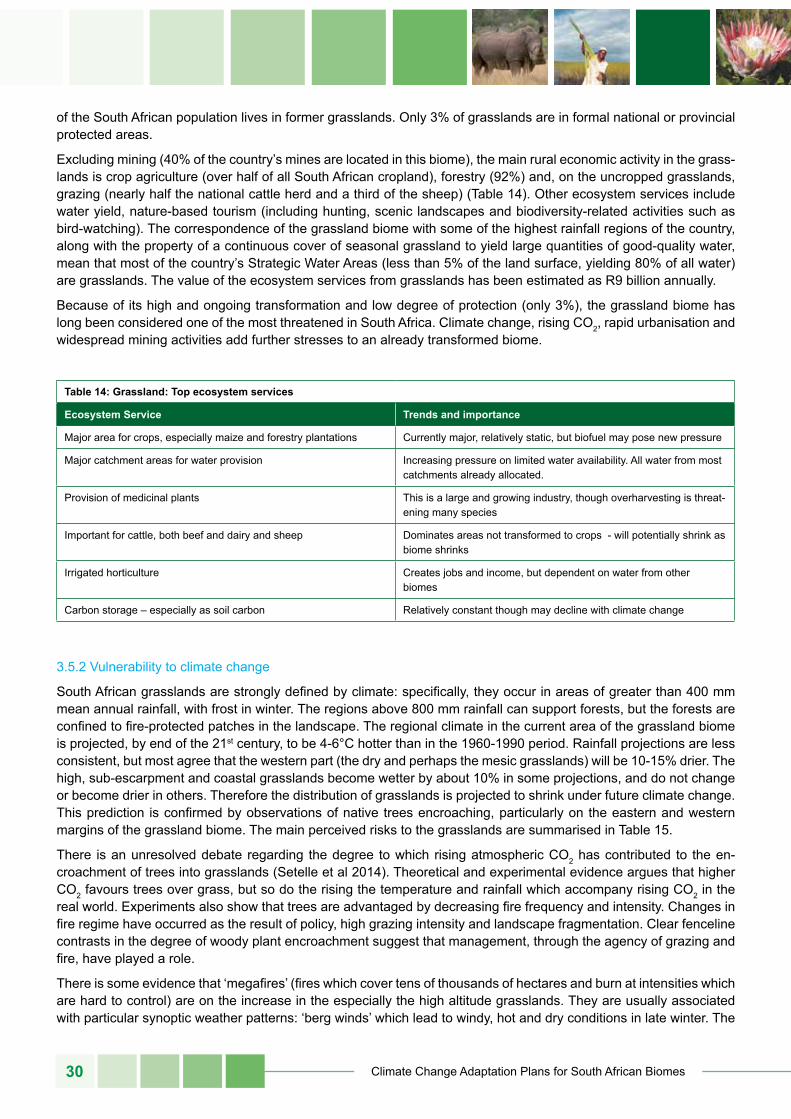
Climate Change Adaptation Plans for South African Biomes30
of the South African population lives in former grasslands. Only 3% of grasslands are in formal national or provincial protected areas.
Excluding mining (40% of the country’s mines are located in this biome), the main rural economic activity in the grass-lands is crop agriculture (over half of all South African cropland), forestry (92%) and, on the uncropped grasslands, grazing (nearly half the national cattle herd and a third of the sheep) (Table 14). Other ecosystem services include water yield, nature-based tourism (including hunting, scenic landscapes and biodiversity-related activities such as bird-watching). The correspondence of the grassland biome with some of the highest rainfall regions of the country, along with the property of a continuous cover of seasonal grassland to yield large quantities of good-quality water, mean that most of the country’s Strategic Water Areas (less than 5% of the land surface, yielding 80% of all water) are grasslands. The value of the ecosystem services from grasslands has been estimated as R9 billion annually.
Because of its high and ongoing transformation and low degree of protection (only 3%), the grassland biome has long been considered one of the most threatened in South Africa. Climate change, rising CO2, rapid urbanisation and widespread mining activities add further stresses to an already transformed biome.
table 14: Grassland: top ecosystem services
ecosystem service trends and importance
Major area for crops, especially maize and forestry plantations Currently major, relatively static, but biofuel may pose new pressure
Major catchment areas for water provision Increasing pressure on limited water availability. All water from most catchments already allocated.
Provision of medicinal plants This is a large and growing industry, though overharvesting is threat-ening many species
Important for cattle, both beef and dairy and sheep Dominates areas not transformed to crops - will potentially shrink as biome shrinks
Irrigated horticulture Creates jobs and income, but dependent on water from other biomes
Carbon storage – especially as soil carbon Relatively constant though may decline with climate change
3.5.2 Vulnerability to climate change
South African grasslands are strongly defined by climate: specifically, they occur in areas of greater than 400 mm mean annual rainfall, with frost in winter. The regions above 800 mm rainfall can support forests, but the forests are confined to fire-protected patches in the landscape. The regional climate in the current area of the grassland biome is projected, by end of the 21st century, to be 4-6°C hotter than in the 1960-1990 period. Rainfall projections are less consistent, but most agree that the western part (the dry and perhaps the mesic grasslands) will be 10-15% drier. The high, sub-escarpment and coastal grasslands become wetter by about 10% in some projections, and do not change or become drier in others. Therefore the distribution of grasslands is projected to shrink under future climate change. This prediction is confirmed by observations of native trees encroaching, particularly on the eastern and western margins of the grassland biome. The main perceived risks to the grasslands are summarised in Table 15.
There is an unresolved debate regarding the degree to which rising atmospheric CO2 has contributed to the en-croachment of trees into grasslands (Setelle et al 2014). Theoretical and experimental evidence argues that higher CO2 favours trees over grass, but so do the rising the temperature and rainfall which accompany rising CO2 in the real world. Experiments also show that trees are advantaged by decreasing fire frequency and intensity. Changes in fire regime have occurred as the result of policy, high grazing intensity and landscape fragmentation. Clear fenceline contrasts in the degree of woody plant encroachment suggest that management, through the agency of grazing and fire, have played a role.
There is some evidence that ‘megafires’ (fires which cover tens of thousands of hectares and burn at intensities which are hard to control) are on the increase in the especially the high altitude grasslands. They are usually associated with particular synoptic weather patterns: ‘berg winds’ which lead to windy, hot and dry conditions in late winter. The
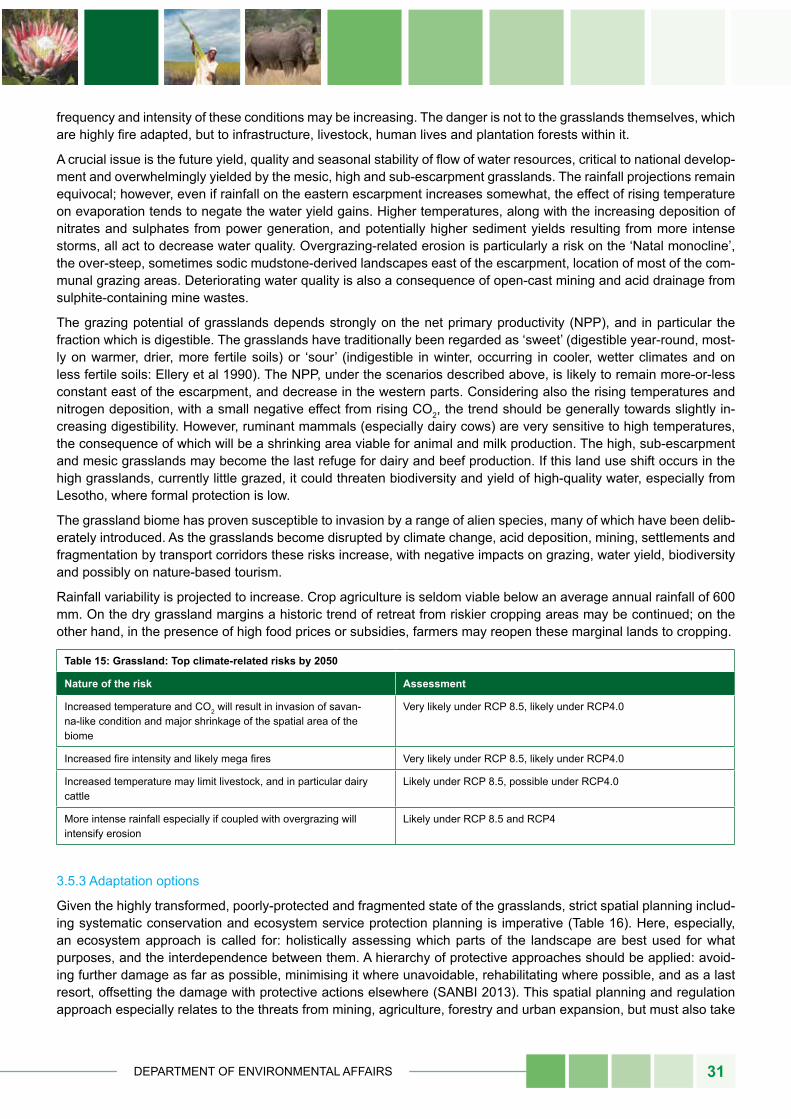
DEPARTMENT OF ENVIRONMENTAL AFFAIRS 31
frequency and intensity of these conditions may be increasing. The danger is not to the grasslands themselves, which are highly fire adapted, but to infrastructure, livestock, human lives and plantation forests within it.
A crucial issue is the future yield, quality and seasonal stability of flow of water resources, critical to national develop-ment and overwhelmingly yielded by the mesic, high and sub-escarpment grasslands. The rainfall projections remain equivocal; however, even if rainfall on the eastern escarpment increases somewhat, the effect of rising temperature on evaporation tends to negate the water yield gains. Higher temperatures, along with the increasing deposition of nitrates and sulphates from power generation, and potentially higher sediment yields resulting from more intense storms, all act to decrease water quality. Overgrazing-related erosion is particularly a risk on the ‘Natal monocline’, the over-steep, sometimes sodic mudstone-derived landscapes east of the escarpment, location of most of the com-munal grazing areas. Deteriorating water quality is also a consequence of open-cast mining and acid drainage from sulphite-containing mine wastes.
The grazing potential of grasslands depends strongly on the net primary productivity (NPP), and in particular the fraction which is digestible. The grasslands have traditionally been regarded as ‘sweet’ (digestible year-round, most-ly on warmer, drier, more fertile soils) or ‘sour’ (indigestible in winter, occurring in cooler, wetter climates and on less fertile soils: Ellery et al 1990). The NPP, under the scenarios described above, is likely to remain more-or-less constant east of the escarpment, and decrease in the western parts. Considering also the rising temperatures and nitrogen deposition, with a small negative effect from rising CO2, the trend should be generally towards slightly in-creasing digestibility. However, ruminant mammals (especially dairy cows) are very sensitive to high temperatures, the consequence of which will be a shrinking area viable for animal and milk production. The high, sub-escarpment and mesic grasslands may become the last refuge for dairy and beef production. If this land use shift occurs in the high grasslands, currently little grazed, it could threaten biodiversity and yield of high-quality water, especially from Lesotho, where formal protection is low.
The grassland biome has proven susceptible to invasion by a range of alien species, many of which have been delib-erately introduced. As the grasslands become disrupted by climate change, acid deposition, mining, settlements and fragmentation by transport corridors these risks increase, with negative impacts on grazing, water yield, biodiversity and possibly on nature-based tourism.
Rainfall variability is projected to increase. Crop agriculture is seldom viable below an average annual rainfall of 600 mm. On the dry grassland margins a historic trend of retreat from riskier cropping areas may be continued; on the other hand, in the presence of high food prices or subsidies, farmers may reopen these marginal lands to cropping.
table 15: Grassland: top climate-related risks by 2050
nature of the risk Assessment
Increased temperature and CO2 will result in invasion of savan-na-like condition and major shrinkage of the spatial area of the biome
Very likely under RCP 8.5, likely under RCP4.0
Increased fire intensity and likely mega fires Very likely under RCP 8.5, likely under RCP4.0
Increased temperature may limit livestock, and in particular dairy cattle
Likely under RCP 8.5, possible under RCP4.0
More intense rainfall especially if coupled with overgrazing will intensify erosion
Likely under RCP 8.5 and RCP4
3.5.3 Adaptation options
Given the highly transformed, poorly-protected and fragmented state of the grasslands, strict spatial planning includ-ing systematic conservation and ecosystem service protection planning is imperative (Table 16). Here, especially, an ecosystem approach is called for: holistically assessing which parts of the landscape are best used for what purposes, and the interdependence between them. A hierarchy of protective approaches should be applied: avoid-ing further damage as far as possible, minimising it where unavoidable, rehabilitating where possible, and as a last resort, offsetting the damage with protective actions elsewhere (SANBI 2013). This spatial planning and regulation approach especially relates to the threats from mining, agriculture, forestry and urban expansion, but must also take
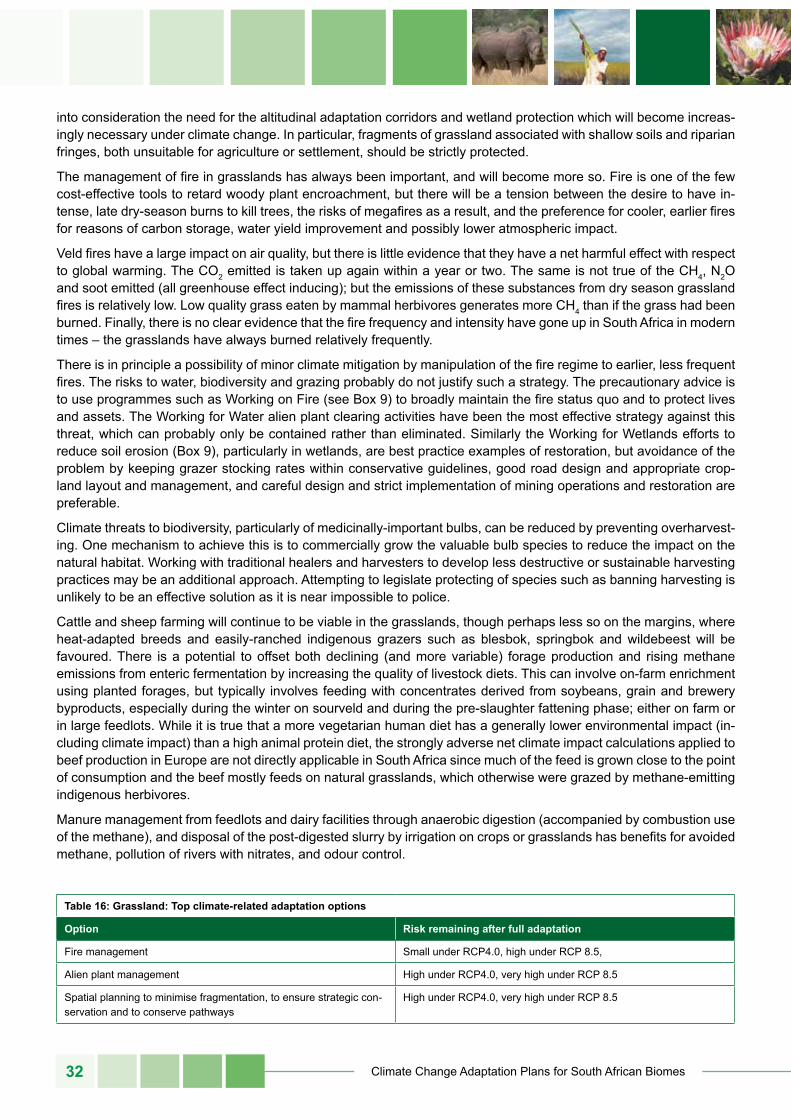
Climate Change Adaptation Plans for South African Biomes32
into consideration the need for the altitudinal adaptation corridors and wetland protection which will become increas-ingly necessary under climate change. In particular, fragments of grassland associated with shallow soils and riparian fringes, both unsuitable for agriculture or settlement, should be strictly protected.
The management of fire in grasslands has always been important, and will become more so. Fire is one of the few cost-effective tools to retard woody plant encroachment, but there will be a tension between the desire to have in-tense, late dry-season burns to kill trees, the risks of megafires as a result, and the preference for cooler, earlier fires for reasons of carbon storage, water yield improvement and possibly lower atmospheric impact.
Veld fires have a large impact on air quality, but there is little evidence that they have a net harmful effect with respect to global warming. The CO2 emitted is taken up again within a year or two. The same is not true of the CH4, N2O and soot emitted (all greenhouse effect inducing); but the emissions of these substances from dry season grassland fires is relatively low. Low quality grass eaten by mammal herbivores generates more CH4 than if the grass had been burned. Finally, there is no clear evidence that the fire frequency and intensity have gone up in South Africa in modern times – the grasslands have always burned relatively frequently.
There is in principle a possibility of minor climate mitigation by manipulation of the fire regime to earlier, less frequent fires. The risks to water, biodiversity and grazing probably do not justify such a strategy. The precautionary advice is to use programmes such as Working on Fire (see Box 9) to broadly maintain the fire status quo and to protect lives and assets. The Working for Water alien plant clearing activities have been the most effective strategy against this threat, which can probably only be contained rather than eliminated. Similarly the Working for Wetlands efforts to reduce soil erosion (Box 9), particularly in wetlands, are best practice examples of restoration, but avoidance of the problem by keeping grazer stocking rates within conservative guidelines, good road design and appropriate crop-land layout and management, and careful design and strict implementation of mining operations and restoration are preferable.
Climate threats to biodiversity, particularly of medicinally-important bulbs, can be reduced by preventing overharvest-ing. One mechanism to achieve this is to commercially grow the valuable bulb species to reduce the impact on the natural habitat. Working with traditional healers and harvesters to develop less destructive or sustainable harvesting practices may be an additional approach. Attempting to legislate protecting of species such as banning harvesting is unlikely to be an effective solution as it is near impossible to police.
Cattle and sheep farming will continue to be viable in the grasslands, though perhaps less so on the margins, where heat-adapted breeds and easily-ranched indigenous grazers such as blesbok, springbok and wildebeest will be favoured. There is a potential to offset both declining (and more variable) forage production and rising methane emissions from enteric fermentation by increasing the quality of livestock diets. This can involve on-farm enrichment using planted forages, but typically involves feeding with concentrates derived from soybeans, grain and brewery byproducts, especially during the winter on sourveld and during the pre-slaughter fattening phase; either on farm or in large feedlots. While it is true that a more vegetarian human diet has a generally lower environmental impact (in-cluding climate impact) than a high animal protein diet, the strongly adverse net climate impact calculations applied to beef production in Europe are not directly applicable in South Africa since much of the feed is grown close to the point of consumption and the beef mostly feeds on natural grasslands, which otherwise were grazed by methane-emitting indigenous herbivores.
Manure management from feedlots and dairy facilities through anaerobic digestion (accompanied by combustion use of the methane), and disposal of the post-digested slurry by irrigation on crops or grasslands has benefits for avoided methane, pollution of rivers with nitrates, and odour control.
table 16: Grassland: top climate-related adaptation options
option risk remaining after full adaptation
Fire management Small under RCP4.0, high under RCP 8.5,
Alien plant management High under RCP4.0, very high under RCP 8.5
Spatial planning to minimise fragmentation, to ensure strategic con-servation and to conserve pathways
High under RCP4.0, very high under RCP 8.5
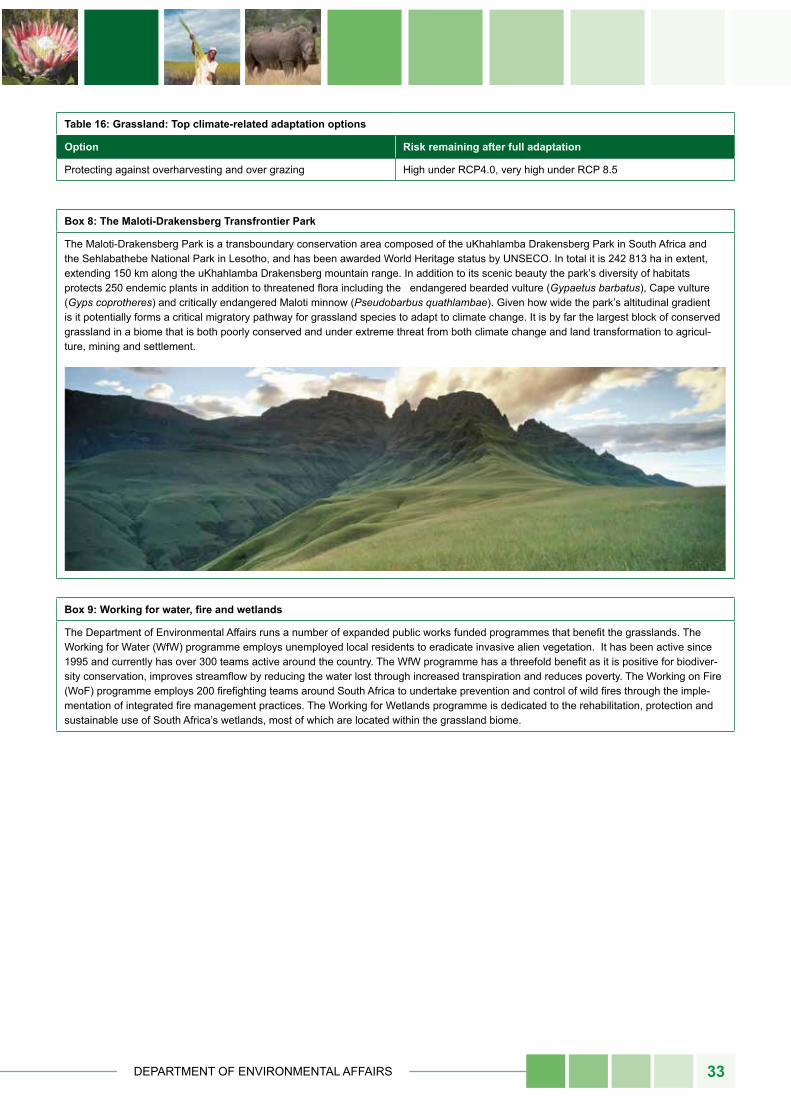
DEPARTMENT OF ENVIRONMENTAL AFFAIRS 33
table 16: Grassland: top climate-related adaptation options
option risk remaining after full adaptation
Protecting against overharvesting and over grazing High under RCP4.0, very high under RCP 8.5
Box 8: the maloti-Drakensberg transfrontier park
The Maloti-Drakensberg Park is a transboundary conservation area composed of the uKhahlamba Drakensberg Park in South Africa and the Sehlabathebe National Park in Lesotho, and has been awarded World Heritage status by UNSECO. In total it is 242 813 ha in extent, extending 150 km along the uKhahlamba Drakensberg mountain range. In addition to its scenic beauty the park’s diversity of habitats protects 250 endemic plants in addition to threatened flora including the endangered bearded vulture (Gypaetus barbatus), Cape vulture (Gyps coprotheres) and critically endangered Maloti minnow (Pseudobarbus quathlambae). Given how wide the park’s altitudinal gradient is it potentially forms a critical migratory pathway for grassland species to adapt to climate change. It is by far the largest block of conserved grassland in a biome that is both poorly conserved and under extreme threat from both climate change and land transformation to agricul-ture, mining and settlement.
Box 9: Working for water, fire and wetlands
The Department of Environmental Affairs runs a number of expanded public works funded programmes that benefit the grasslands. The Working for Water (WfW) programme employs unemployed local residents to eradicate invasive alien vegetation. It has been active since 1995 and currently has over 300 teams active around the country. The WfW programme has a threefold benefit as it is positive for biodiver-sity conservation, improves streamflow by reducing the water lost through increased transpiration and reduces poverty. The Working on Fire (WoF) programme employs 200 firefighting teams around South Africa to undertake prevention and control of wild fires through the imple-mentation of integrated fire management practices. The Working for Wetlands programme is dedicated to the rehabilitation, protection and sustainable use of South Africa’s wetlands, most of which are located within the grassland biome.
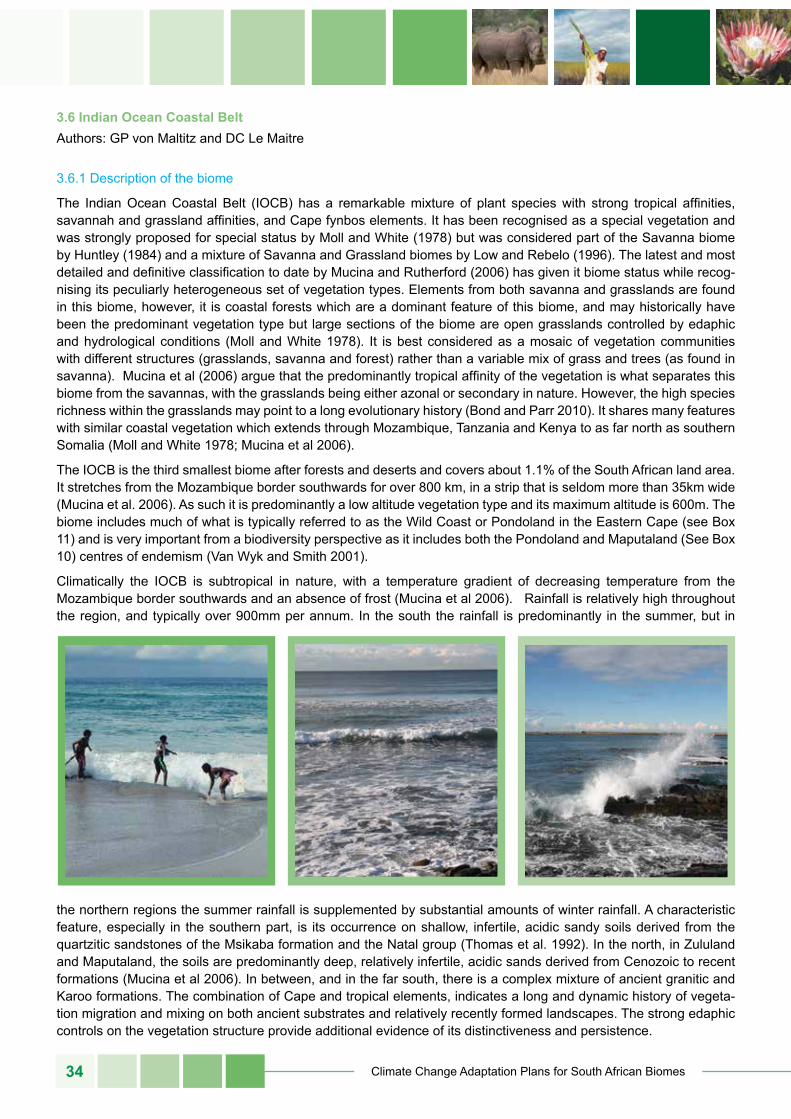
Climate Change Adaptation Plans for South African Biomes34
3.6 indian ocean Coastal Belt Authors: GP von Maltitz and DC Le Maitre
3.6.1 Description of the biome
The Indian Ocean Coastal Belt (IOCB) has a remarkable mixture of plant species with strong tropical affinities, savannah and grassland affinities, and Cape fynbos elements. It has been recognised as a special vegetation and was strongly proposed for special status by Moll and White (1978) but was considered part of the Savanna biome by Huntley (1984) and a mixture of Savanna and Grassland biomes by Low and Rebelo (1996). The latest and most detailed and definitive classification to date by Mucina and Rutherford (2006) has given it biome status while recog-nising its peculiarly heterogeneous set of vegetation types. Elements from both savanna and grasslands are found in this biome, however, it is coastal forests which are a dominant feature of this biome, and may historically have been the predominant vegetation type but large sections of the biome are open grasslands controlled by edaphic and hydrological conditions (Moll and White 1978). It is best considered as a mosaic of vegetation communities with different structures (grasslands, savanna and forest) rather than a variable mix of grass and trees (as found in savanna). Mucina et al (2006) argue that the predominantly tropical affinity of the vegetation is what separates this biome from the savannas, with the grasslands being either azonal or secondary in nature. However, the high species richness within the grasslands may point to a long evolutionary history (Bond and Parr 2010). It shares many features with similar coastal vegetation which extends through Mozambique, Tanzania and Kenya to as far north as southern Somalia (Moll and White 1978; Mucina et al 2006).
The IOCB is the third smallest biome after forests and deserts and covers about 1.1% of the South African land area. It stretches from the Mozambique border southwards for over 800 km, in a strip that is seldom more than 35km wide (Mucina et al. 2006). As such it is predominantly a low altitude vegetation type and its maximum altitude is 600m. The biome includes much of what is typically referred to as the Wild Coast or Pondoland in the Eastern Cape (see Box 11) and is very important from a biodiversity perspective as it includes both the Pondoland and Maputaland (See Box 10) centres of endemism (Van Wyk and Smith 2001).
Climatically the IOCB is subtropical in nature, with a temperature gradient of decreasing temperature from the Mozambique border southwards and an absence of frost (Mucina et al 2006). Rainfall is relatively high throughout the region, and typically over 900mm per annum. In the south the rainfall is predominantly in the summer, but in
the northern regions the summer rainfall is supplemented by substantial amounts of winter rainfall. A characteristic feature, especially in the southern part, is its occurrence on shallow, infertile, acidic sandy soils derived from the quartzitic sandstones of the Msikaba formation and the Natal group (Thomas et al. 1992). In the north, in Zululand and Maputaland, the soils are predominantly deep, relatively infertile, acidic sands derived from Cenozoic to recent formations (Mucina et al 2006). In between, and in the far south, there is a complex mixture of ancient granitic and Karoo formations. The combination of Cape and tropical elements, indicates a long and dynamic history of vegeta-tion migration and mixing on both ancient substrates and relatively recently formed landscapes. The strong edaphic controls on the vegetation structure provide additional evidence of its distinctiveness and persistence.
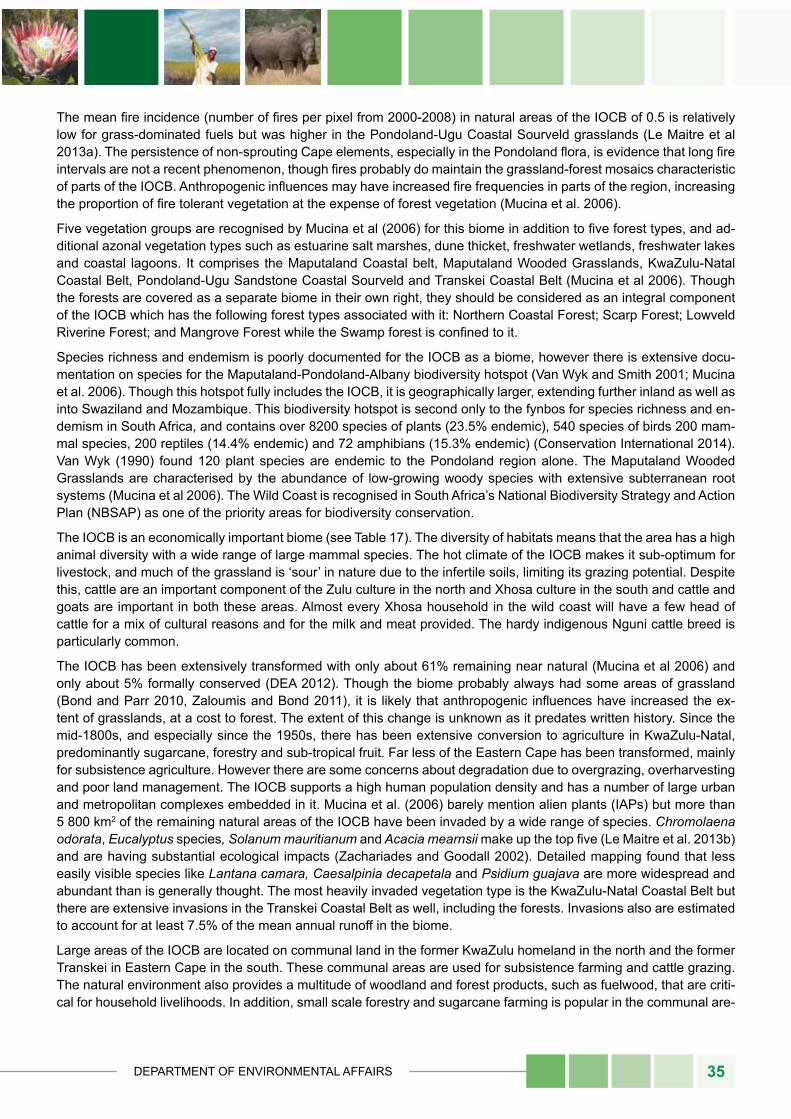
DEPARTMENT OF ENVIRONMENTAL AFFAIRS 35
The mean fire incidence (number of fires per pixel from 2000-2008) in natural areas of the IOCB of 0.5 is relatively low for grass-dominated fuels but was higher in the Pondoland-Ugu Coastal Sourveld grasslands (Le Maitre et al 2013a). The persistence of non-sprouting Cape elements, especially in the Pondoland flora, is evidence that long fire intervals are not a recent phenomenon, though fires probably do maintain the grassland-forest mosaics characteristic of parts of the IOCB. Anthropogenic influences may have increased fire frequencies in parts of the region, increasing the proportion of fire tolerant vegetation at the expense of forest vegetation (Mucina et al. 2006).
Five vegetation groups are recognised by Mucina et al (2006) for this biome in addition to five forest types, and ad-ditional azonal vegetation types such as estuarine salt marshes, dune thicket, freshwater wetlands, freshwater lakes and coastal lagoons. It comprises the Maputaland Coastal belt, Maputaland Wooded Grasslands, KwaZulu-Natal Coastal Belt, Pondoland-Ugu Sandstone Coastal Sourveld and Transkei Coastal Belt (Mucina et al 2006). Though the forests are covered as a separate biome in their own right, they should be considered as an integral component of the IOCB which has the following forest types associated with it: Northern Coastal Forest; Scarp Forest; Lowveld Riverine Forest; and Mangrove Forest while the Swamp forest is confined to it.
Species richness and endemism is poorly documented for the IOCB as a biome, however there is extensive docu-mentation on species for the Maputaland-Pondoland-Albany biodiversity hotspot (Van Wyk and Smith 2001; Mucina et al. 2006). Though this hotspot fully includes the IOCB, it is geographically larger, extending further inland as well as into Swaziland and Mozambique. This biodiversity hotspot is second only to the fynbos for species richness and en-demism in South Africa, and contains over 8200 species of plants (23.5% endemic), 540 species of birds 200 mam-mal species, 200 reptiles (14.4% endemic) and 72 amphibians (15.3% endemic) (Conservation International 2014). Van Wyk (1990) found 120 plant species are endemic to the Pondoland region alone. The Maputaland Wooded Grasslands are characterised by the abundance of low-growing woody species with extensive subterranean root systems (Mucina et al 2006). The Wild Coast is recognised in South Africa’s National Biodiversity Strategy and Action Plan (NBSAP) as one of the priority areas for biodiversity conservation.
The IOCB is an economically important biome (see Table 17). The diversity of habitats means that the area has a high animal diversity with a wide range of large mammal species. The hot climate of the IOCB makes it sub-optimum for livestock, and much of the grassland is ‘sour’ in nature due to the infertile soils, limiting its grazing potential. Despite this, cattle are an important component of the Zulu culture in the north and Xhosa culture in the south and cattle and goats are important in both these areas. Almost every Xhosa household in the wild coast will have a few head of cattle for a mix of cultural reasons and for the milk and meat provided. The hardy indigenous Nguni cattle breed is particularly common.
The IOCB has been extensively transformed with only about 61% remaining near natural (Mucina et al 2006) and only about 5% formally conserved (DEA 2012). Though the biome probably always had some areas of grassland (Bond and Parr 2010, Zaloumis and Bond 2011), it is likely that anthropogenic influences have increased the ex-tent of grasslands, at a cost to forest. The extent of this change is unknown as it predates written history. Since the mid-1800s, and especially since the 1950s, there has been extensive conversion to agriculture in KwaZulu-Natal, predominantly sugarcane, forestry and sub-tropical fruit. Far less of the Eastern Cape has been transformed, mainly for subsistence agriculture. However there are some concerns about degradation due to overgrazing, overharvesting and poor land management. The IOCB supports a high human population density and has a number of large urban and metropolitan complexes embedded in it. Mucina et al. (2006) barely mention alien plants (IAPs) but more than 5 800 km2 of the remaining natural areas of the IOCB have been invaded by a wide range of species. Chromolaena odorata, Eucalyptus species, Solanum mauritianum and Acacia mearnsii make up the top five (Le Maitre et al. 2013b) and are having substantial ecological impacts (Zachariades and Goodall 2002). Detailed mapping found that less easily visible species like Lantana camara, Caesalpinia decapetala and Psidium guajava are more widespread and abundant than is generally thought. The most heavily invaded vegetation type is the KwaZulu-Natal Coastal Belt but there are extensive invasions in the Transkei Coastal Belt as well, including the forests. Invasions also are estimated to account for at least 7.5% of the mean annual runoff in the biome.
Large areas of the IOCB are located on communal land in the former KwaZulu homeland in the north and the former Transkei in Eastern Cape in the south. These communal areas are used for subsistence farming and cattle grazing. The natural environment also provides a multitude of woodland and forest products, such as fuelwood, that are criti-cal for household livelihoods. In addition, small scale forestry and sugarcane farming is popular in the communal are-
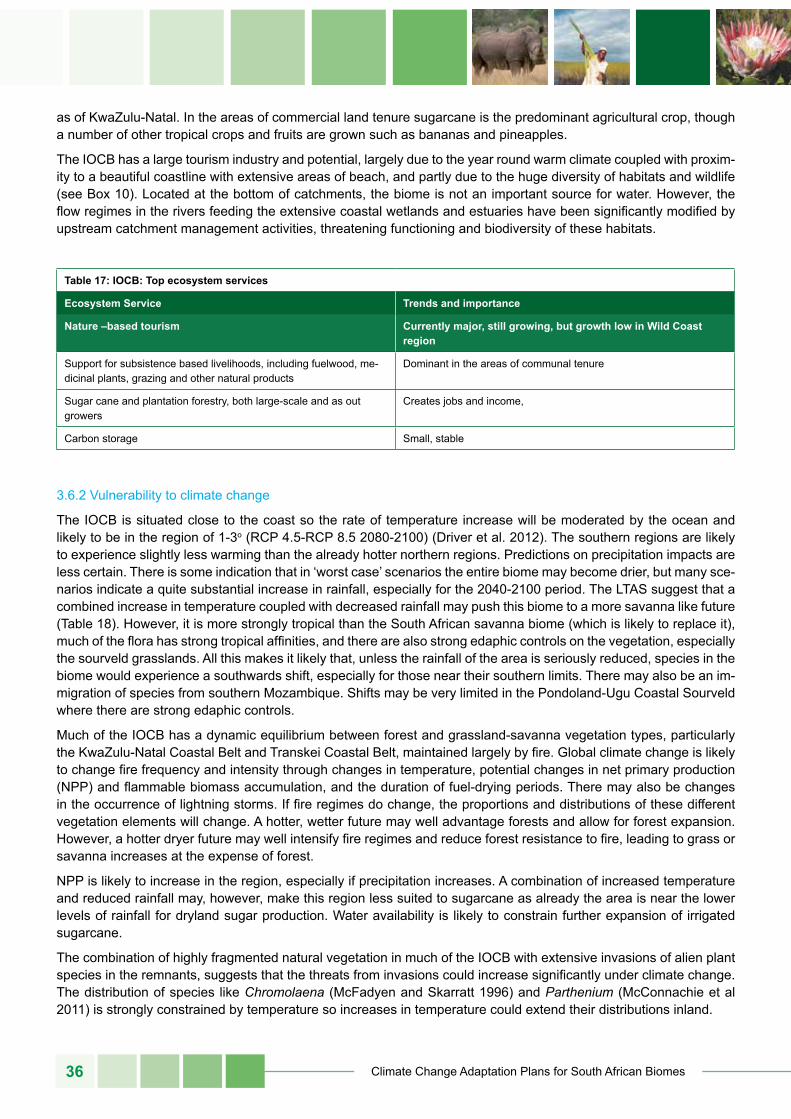
Climate Change Adaptation Plans for South African Biomes36
as of KwaZulu-Natal. In the areas of commercial land tenure sugarcane is the predominant agricultural crop, though a number of other tropical crops and fruits are grown such as bananas and pineapples.
The IOCB has a large tourism industry and potential, largely due to the year round warm climate coupled with proxim-ity to a beautiful coastline with extensive areas of beach, and partly due to the huge diversity of habitats and wildlife (see Box 10). Located at the bottom of catchments, the biome is not an important source for water. However, the flow regimes in the rivers feeding the extensive coastal wetlands and estuaries have been significantly modified by upstream catchment management activities, threatening functioning and biodiversity of these habitats.
table 17: ioCB: top ecosystem services
ecosystem service trends and importance
nature –based tourism Currently major, still growing, but growth low in Wild Coast region
Support for subsistence based livelihoods, including fuelwood, me-dicinal plants, grazing and other natural products
Dominant in the areas of communal tenure
Sugar cane and plantation forestry, both large-scale and as out growers
Creates jobs and income,
Carbon storage Small, stable
3.6.2 Vulnerability to climate change
The IOCB is situated close to the coast so the rate of temperature increase will be moderated by the ocean and likely to be in the region of 1-3o (RCP 4.5-RCP 8.5 2080-2100) (Driver et al. 2012). The southern regions are likely to experience slightly less warming than the already hotter northern regions. Predictions on precipitation impacts are less certain. There is some indication that in ‘worst case’ scenarios the entire biome may become drier, but many sce-narios indicate a quite substantial increase in rainfall, especially for the 2040-2100 period. The LTAS suggest that a combined increase in temperature coupled with decreased rainfall may push this biome to a more savanna like future (Table 18). However, it is more strongly tropical than the South African savanna biome (which is likely to replace it), much of the flora has strong tropical affinities, and there are also strong edaphic controls on the vegetation, especially the sourveld grasslands. All this makes it likely that, unless the rainfall of the area is seriously reduced, species in the biome would experience a southwards shift, especially for those near their southern limits. There may also be an im-migration of species from southern Mozambique. Shifts may be very limited in the Pondoland-Ugu Coastal Sourveld where there are strong edaphic controls.
Much of the IOCB has a dynamic equilibrium between forest and grassland-savanna vegetation types, particularly the KwaZulu-Natal Coastal Belt and Transkei Coastal Belt, maintained largely by fire. Global climate change is likely to change fire frequency and intensity through changes in temperature, potential changes in net primary production (NPP) and flammable biomass accumulation, and the duration of fuel-drying periods. There may also be changes in the occurrence of lightning storms. If fire regimes do change, the proportions and distributions of these different vegetation elements will change. A hotter, wetter future may well advantage forests and allow for forest expansion. However, a hotter dryer future may well intensify fire regimes and reduce forest resistance to fire, leading to grass or savanna increases at the expense of forest.
NPP is likely to increase in the region, especially if precipitation increases. A combination of increased temperature and reduced rainfall may, however, make this region less suited to sugarcane as already the area is near the lower levels of rainfall for dryland sugar production. Water availability is likely to constrain further expansion of irrigated sugarcane.
The combination of highly fragmented natural vegetation in much of the IOCB with extensive invasions of alien plant species in the remnants, suggests that the threats from invasions could increase significantly under climate change. The distribution of species like Chromolaena (McFadyen and Skarratt 1996) and Parthenium (McConnachie et al 2011) is strongly constrained by temperature so increases in temperature could extend their distributions inland.
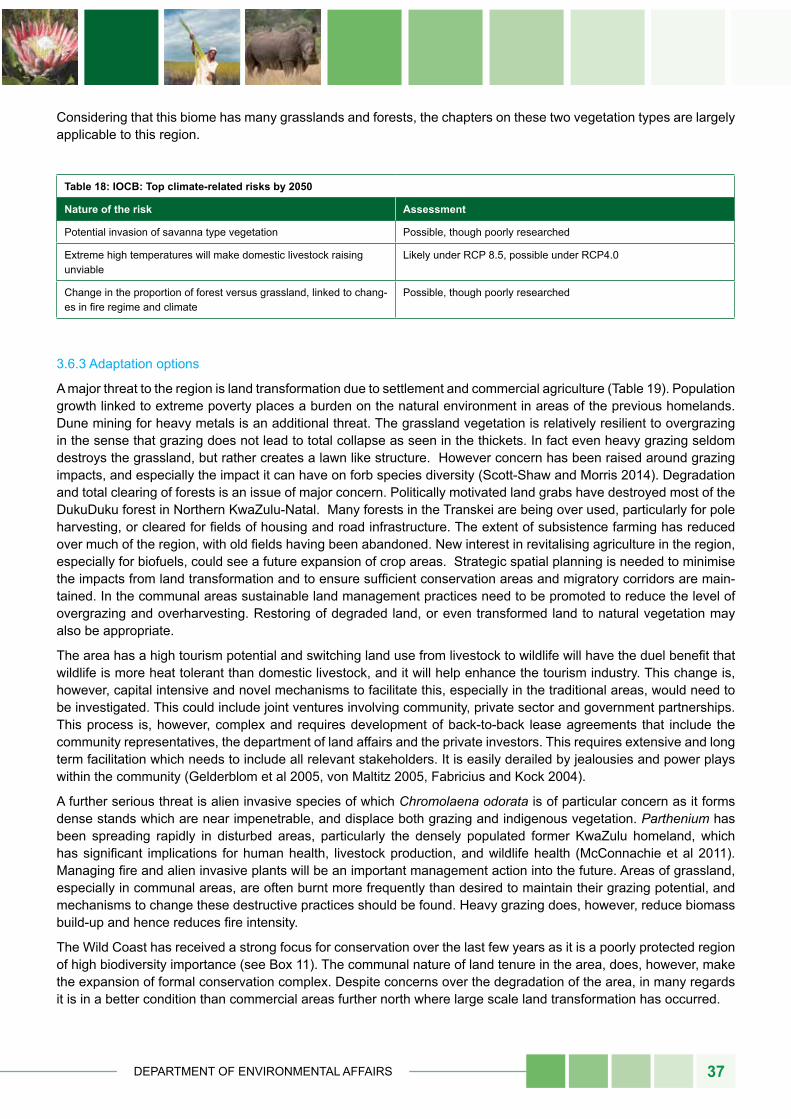
DEPARTMENT OF ENVIRONMENTAL AFFAIRS 37
Considering that this biome has many grasslands and forests, the chapters on these two vegetation types are largely applicable to this region.
table 18: ioCB: top climate-related risks by 2050
nature of the risk Assessment
Potential invasion of savanna type vegetation Possible, though poorly researched
Extreme high temperatures will make domestic livestock raising unviable
Likely under RCP 8.5, possible under RCP4.0
Change in the proportion of forest versus grassland, linked to chang-es in fire regime and climate
Possible, though poorly researched
3.6.3 Adaptation options
A major threat to the region is land transformation due to settlement and commercial agriculture (Table 19). Population growth linked to extreme poverty places a burden on the natural environment in areas of the previous homelands. Dune mining for heavy metals is an additional threat. The grassland vegetation is relatively resilient to overgrazing in the sense that grazing does not lead to total collapse as seen in the thickets. In fact even heavy grazing seldom destroys the grassland, but rather creates a lawn like structure. However concern has been raised around grazing impacts, and especially the impact it can have on forb species diversity (Scott-Shaw and Morris 2014). Degradation and total clearing of forests is an issue of major concern. Politically motivated land grabs have destroyed most of the DukuDuku forest in Northern KwaZulu-Natal. Many forests in the Transkei are being over used, particularly for pole harvesting, or cleared for fields of housing and road infrastructure. The extent of subsistence farming has reduced over much of the region, with old fields having been abandoned. New interest in revitalising agriculture in the region, especially for biofuels, could see a future expansion of crop areas. Strategic spatial planning is needed to minimise the impacts from land transformation and to ensure sufficient conservation areas and migratory corridors are main-tained. In the communal areas sustainable land management practices need to be promoted to reduce the level of overgrazing and overharvesting. Restoring of degraded land, or even transformed land to natural vegetation may also be appropriate.
The area has a high tourism potential and switching land use from livestock to wildlife will have the duel benefit that wildlife is more heat tolerant than domestic livestock, and it will help enhance the tourism industry. This change is, however, capital intensive and novel mechanisms to facilitate this, especially in the traditional areas, would need to be investigated. This could include joint ventures involving community, private sector and government partnerships. This process is, however, complex and requires development of back-to-back lease agreements that include the community representatives, the department of land affairs and the private investors. This requires extensive and long term facilitation which needs to include all relevant stakeholders. It is easily derailed by jealousies and power plays within the community (Gelderblom et al 2005, von Maltitz 2005, Fabricius and Kock 2004).
A further serious threat is alien invasive species of which Chromolaena odorata is of particular concern as it forms dense stands which are near impenetrable, and displace both grazing and indigenous vegetation. Parthenium has been spreading rapidly in disturbed areas, particularly the densely populated former KwaZulu homeland, which has significant implications for human health, livestock production, and wildlife health (McConnachie et al 2011). Managing fire and alien invasive plants will be an important management action into the future. Areas of grassland, especially in communal areas, are often burnt more frequently than desired to maintain their grazing potential, and mechanisms to change these destructive practices should be found. Heavy grazing does, however, reduce biomass build-up and hence reduces fire intensity.
The Wild Coast has received a strong focus for conservation over the last few years as it is a poorly protected region of high biodiversity importance (see Box 11). The communal nature of land tenure in the area, does, however, make the expansion of formal conservation complex. Despite concerns over the degradation of the area, in many regards it is in a better condition than commercial areas further north where large scale land transformation has occurred.
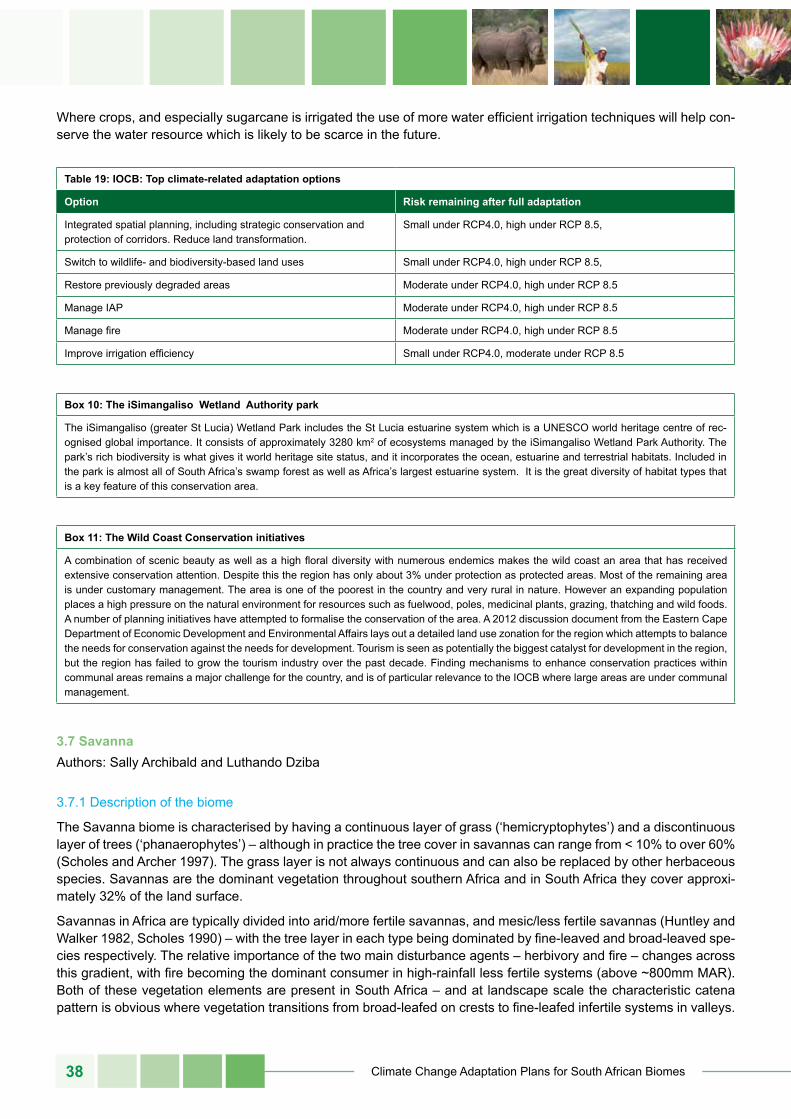
Climate Change Adaptation Plans for South African Biomes38
Where crops, and especially sugarcane is irrigated the use of more water efficient irrigation techniques will help con-serve the water resource which is likely to be scarce in the future.
table 19: ioCB: top climate-related adaptation options
option risk remaining after full adaptation
Integrated spatial planning, including strategic conservation and protection of corridors. Reduce land transformation.
Small under RCP4.0, high under RCP 8.5,
Switch to wildlife- and biodiversity-based land uses Small under RCP4.0, high under RCP 8.5,
Restore previously degraded areas Moderate under RCP4.0, high under RCP 8.5
Manage IAP Moderate under RCP4.0, high under RCP 8.5
Manage fire Moderate under RCP4.0, high under RCP 8.5
Improve irrigation efficiency Small under RCP4.0, moderate under RCP 8.5
Box 10: the isimangaliso Wetland Authority park
The iSimangaliso (greater St Lucia) Wetland Park includes the St Lucia estuarine system which is a UNESCO world heritage centre of rec-ognised global importance. It consists of approximately 3280 km2 of ecosystems managed by the iSimangaliso Wetland Park Authority. The park’s rich biodiversity is what gives it world heritage site status, and it incorporates the ocean, estuarine and terrestrial habitats. Included in the park is almost all of South Africa’s swamp forest as well as Africa’s largest estuarine system. It is the great diversity of habitat types that is a key feature of this conservation area.
Box 11: the Wild Coast Conservation initiatives
A combination of scenic beauty as well as a high floral diversity with numerous endemics makes the wild coast an area that has received extensive conservation attention. Despite this the region has only about 3% under protection as protected areas. Most of the remaining area is under customary management. The area is one of the poorest in the country and very rural in nature. However an expanding population places a high pressure on the natural environment for resources such as fuelwood, poles, medicinal plants, grazing, thatching and wild foods. A number of planning initiatives have attempted to formalise the conservation of the area. A 2012 discussion document from the Eastern Cape Department of Economic Development and Environmental Affairs lays out a detailed land use zonation for the region which attempts to balance the needs for conservation against the needs for development. Tourism is seen as potentially the biggest catalyst for development in the region, but the region has failed to grow the tourism industry over the past decade. Finding mechanisms to enhance conservation practices within communal areas remains a major challenge for the country, and is of particular relevance to the IOCB where large areas are under communal management.
3.7 savannaAuthors: Sally Archibald and Luthando Dziba
3.7.1 Description of the biome
The Savanna biome is characterised by having a continuous layer of grass (‘hemicryptophytes’) and a discontinuous layer of trees (‘phanaerophytes’) – although in practice the tree cover in savannas can range from < 10% to over 60% (Scholes and Archer 1997). The grass layer is not always continuous and can also be replaced by other herbaceous species. Savannas are the dominant vegetation throughout southern Africa and in South Africa they cover approxi-mately 32% of the land surface.
Savannas in Africa are typically divided into arid/more fertile savannas, and mesic/less fertile savannas (Huntley and Walker 1982, Scholes 1990) – with the tree layer in each type being dominated by fine-leaved and broad-leaved spe-cies respectively. The relative importance of the two main disturbance agents – herbivory and fire – changes across this gradient, with fire becoming the dominant consumer in high-rainfall less fertile systems (above ~800mm MAR). Both of these vegetation elements are present in South Africa – and at landscape scale the characteristic catena pattern is obvious where vegetation transitions from broad-leafed on crests to fine-leafed infertile systems in valleys.
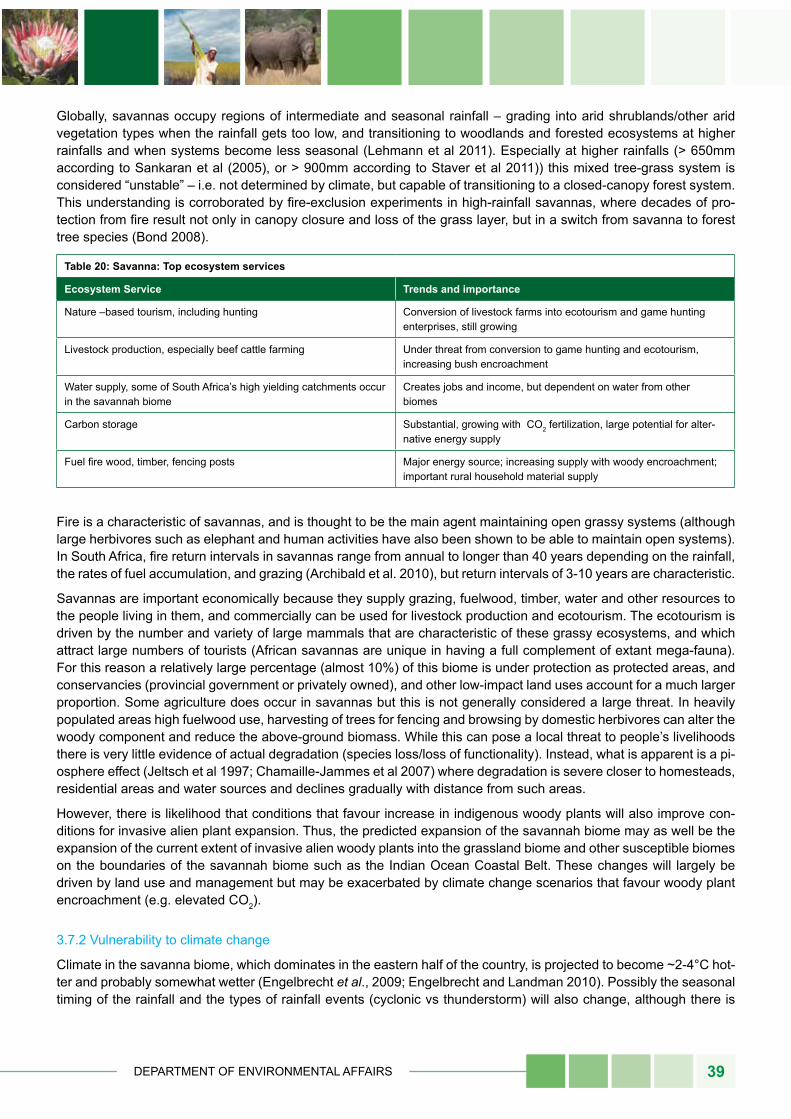
DEPARTMENT OF ENVIRONMENTAL AFFAIRS 39
Globally, savannas occupy regions of intermediate and seasonal rainfall – grading into arid shrublands/other arid vegetation types when the rainfall gets too low, and transitioning to woodlands and forested ecosystems at higher rainfalls and when systems become less seasonal (Lehmann et al 2011). Especially at higher rainfalls (> 650mm according to Sankaran et al (2005), or > 900mm according to Staver et al 2011)) this mixed tree-grass system is considered “unstable” – i.e. not determined by climate, but capable of transitioning to a closed-canopy forest system. This understanding is corroborated by fire-exclusion experiments in high-rainfall savannas, where decades of pro-tection from fire result not only in canopy closure and loss of the grass layer, but in a switch from savanna to forest tree species (Bond 2008).
table 20: savanna: top ecosystem services
ecosystem service trends and importance
Nature –based tourism, including hunting Conversion of livestock farms into ecotourism and game hunting enterprises, still growing
Livestock production, especially beef cattle farming Under threat from conversion to game hunting and ecotourism, increasing bush encroachment
Water supply, some of South Africa’s high yielding catchments occur in the savannah biome
Creates jobs and income, but dependent on water from other biomes
Carbon storage Substantial, growing with CO2 fertilization, large potential for alter-native energy supply
Fuel fire wood, timber, fencing posts Major energy source; increasing supply with woody encroachment; important rural household material supply
Fire is a characteristic of savannas, and is thought to be the main agent maintaining open grassy systems (although large herbivores such as elephant and human activities have also been shown to be able to maintain open systems). In South Africa, fire return intervals in savannas range from annual to longer than 40 years depending on the rainfall, the rates of fuel accumulation, and grazing (Archibald et al. 2010), but return intervals of 3-10 years are characteristic.
Savannas are important economically because they supply grazing, fuelwood, timber, water and other resources to the people living in them, and commercially can be used for livestock production and ecotourism. The ecotourism is driven by the number and variety of large mammals that are characteristic of these grassy ecosystems, and which attract large numbers of tourists (African savannas are unique in having a full complement of extant mega-fauna). For this reason a relatively large percentage (almost 10%) of this biome is under protection as protected areas, and conservancies (provincial government or privately owned), and other low-impact land uses account for a much larger proportion. Some agriculture does occur in savannas but this is not generally considered a large threat. In heavily populated areas high fuelwood use, harvesting of trees for fencing and browsing by domestic herbivores can alter the woody component and reduce the above-ground biomass. While this can pose a local threat to people’s livelihoods there is very little evidence of actual degradation (species loss/loss of functionality). Instead, what is apparent is a pi-osphere effect (Jeltsch et al 1997; Chamaille-Jammes et al 2007) where degradation is severe closer to homesteads, residential areas and water sources and declines gradually with distance from such areas.
However, there is likelihood that conditions that favour increase in indigenous woody plants will also improve con-ditions for invasive alien plant expansion. Thus, the predicted expansion of the savannah biome may as well be the expansion of the current extent of invasive alien woody plants into the grassland biome and other susceptible biomes on the boundaries of the savannah biome such as the Indian Ocean Coastal Belt. These changes will largely be driven by land use and management but may be exacerbated by climate change scenarios that favour woody plant encroachment (e.g. elevated CO2).
3.7.2 Vulnerability to climate change
Climate in the savanna biome, which dominates in the eastern half of the country, is projected to become ~2-4°C hot-ter and probably somewhat wetter (Engelbrecht et al., 2009; Engelbrecht and Landman 2010). Possibly the seasonal timing of the rainfall and the types of rainfall events (cyclonic vs thunderstorm) will also change, although there is
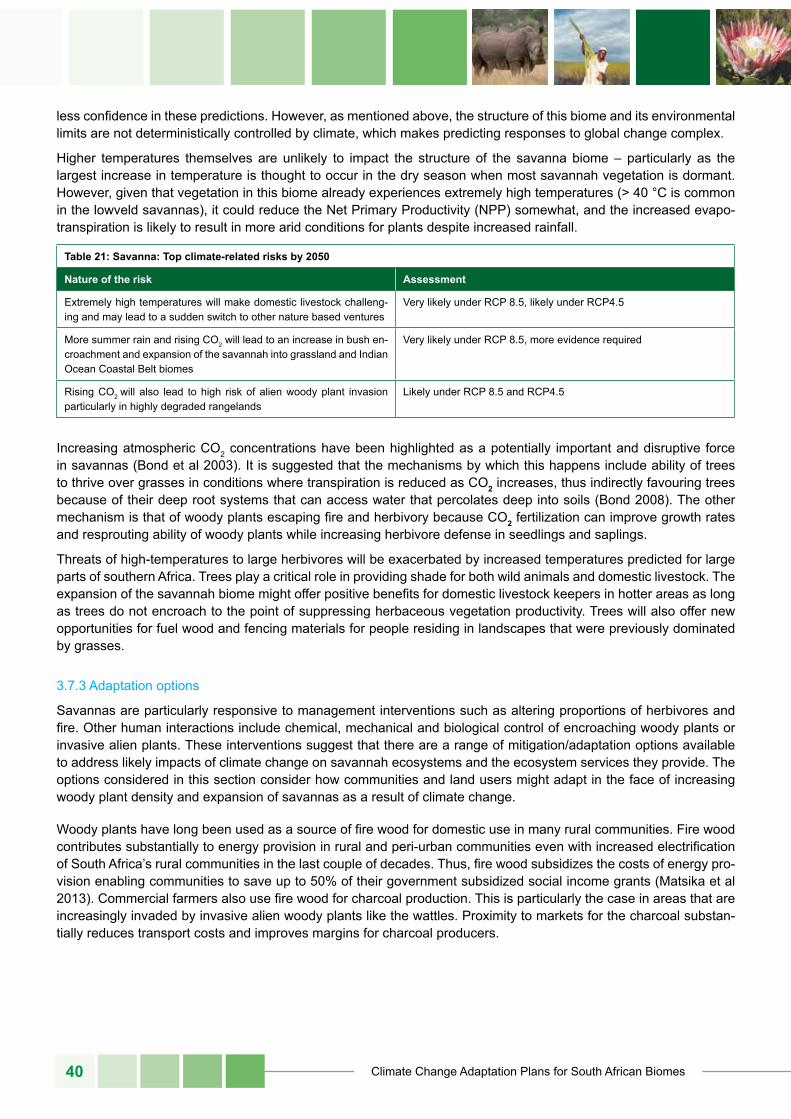
Climate Change Adaptation Plans for South African Biomes40
less confidence in these predictions. However, as mentioned above, the structure of this biome and its environmental limits are not deterministically controlled by climate, which makes predicting responses to global change complex.
Higher temperatures themselves are unlikely to impact the structure of the savanna biome – particularly as the largest increase in temperature is thought to occur in the dry season when most savannah vegetation is dormant. However, given that vegetation in this biome already experiences extremely high temperatures (> 40 °C is common in the lowveld savannas), it could reduce the Net Primary Productivity (NPP) somewhat, and the increased evapo-transpiration is likely to result in more arid conditions for plants despite increased rainfall.
table 21: savanna: top climate-related risks by 2050
nature of the risk Assessment
Extremely high temperatures will make domestic livestock challeng-ing and may lead to a sudden switch to other nature based ventures
Very likely under RCP 8.5, likely under RCP4.5
More summer rain and rising CO2 will lead to an increase in bush en-croachment and expansion of the savannah into grassland and Indian Ocean Coastal Belt biomes
Very likely under RCP 8.5, more evidence required
Rising CO2 will also lead to high risk of alien woody plant invasion particularly in highly degraded rangelands
Likely under RCP 8.5 and RCP4.5
Increasing atmospheric CO2 concentrations have been highlighted as a potentially important and disruptive force in savannas (Bond et al 2003). It is suggested that the mechanisms by which this happens include ability of trees to thrive over grasses in conditions where transpiration is reduced as CO2 increases, thus indirectly favouring trees because of their deep root systems that can access water that percolates deep into soils (Bond 2008). The other mechanism is that of woody plants escaping fire and herbivory because CO2 fertilization can improve growth rates and resprouting ability of woody plants while increasing herbivore defense in seedlings and saplings.
Threats of high-temperatures to large herbivores will be exacerbated by increased temperatures predicted for large parts of southern Africa. Trees play a critical role in providing shade for both wild animals and domestic livestock. The expansion of the savannah biome might offer positive benefits for domestic livestock keepers in hotter areas as long as trees do not encroach to the point of suppressing herbaceous vegetation productivity. Trees will also offer new opportunities for fuel wood and fencing materials for people residing in landscapes that were previously dominated by grasses.
3.7.3 Adaptation options
Savannas are particularly responsive to management interventions such as altering proportions of herbivores and fire. Other human interactions include chemical, mechanical and biological control of encroaching woody plants or invasive alien plants. These interventions suggest that there are a range of mitigation/adaptation options available to address likely impacts of climate change on savannah ecosystems and the ecosystem services they provide. The options considered in this section consider how communities and land users might adapt in the face of increasing woody plant density and expansion of savannas as a result of climate change.
Woody plants have long been used as a source of fire wood for domestic use in many rural communities. Fire wood contributes substantially to energy provision in rural and peri-urban communities even with increased electrification of South Africa’s rural communities in the last couple of decades. Thus, fire wood subsidizes the costs of energy pro-vision enabling communities to save up to 50% of their government subsidized social income grants (Matsika et al 2013). Commercial farmers also use fire wood for charcoal production. This is particularly the case in areas that are increasingly invaded by invasive alien woody plants like the wattles. Proximity to markets for the charcoal substan-tially reduces transport costs and improves margins for charcoal producers.
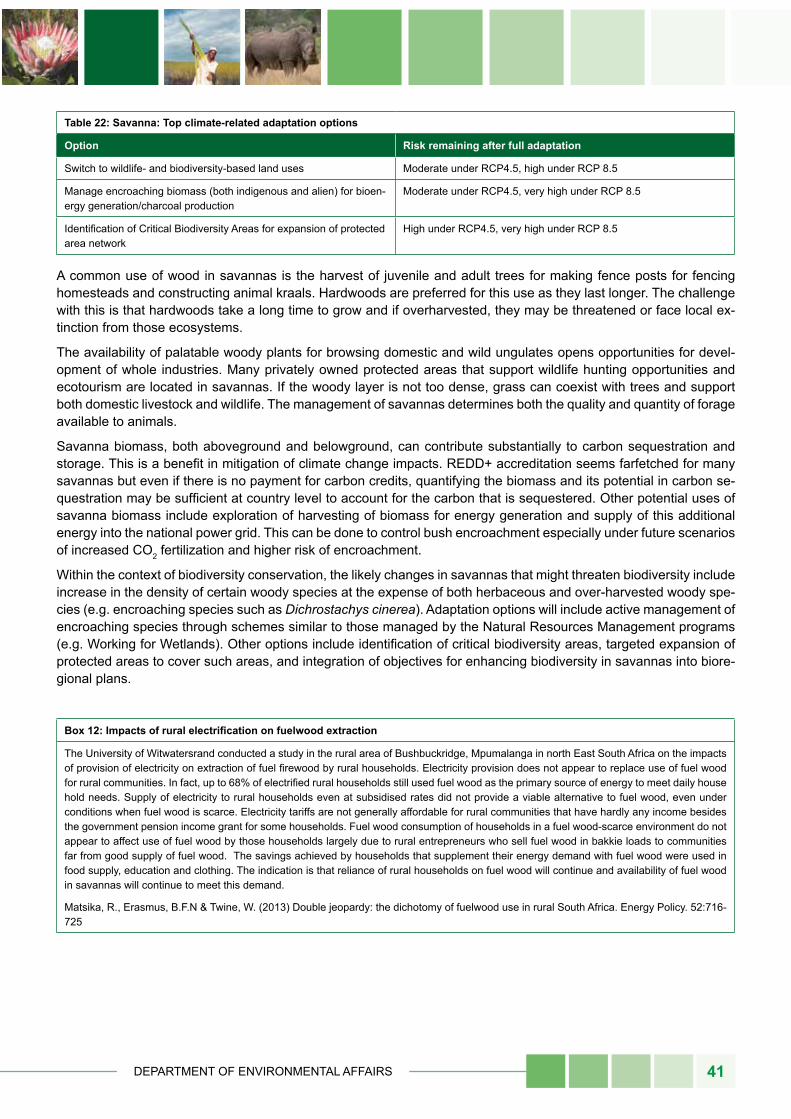
DEPARTMENT OF ENVIRONMENTAL AFFAIRS 41
table 22: savanna: top climate-related adaptation options
option risk remaining after full adaptation
Switch to wildlife- and biodiversity-based land uses Moderate under RCP4.5, high under RCP 8.5
Manage encroaching biomass (both indigenous and alien) for bioen-ergy generation/charcoal production
Moderate under RCP4.5, very high under RCP 8.5
Identification of Critical Biodiversity Areas for expansion of protected area network
High under RCP4.5, very high under RCP 8.5
A common use of wood in savannas is the harvest of juvenile and adult trees for making fence posts for fencing homesteads and constructing animal kraals. Hardwoods are preferred for this use as they last longer. The challenge with this is that hardwoods take a long time to grow and if overharvested, they may be threatened or face local ex-tinction from those ecosystems.
The availability of palatable woody plants for browsing domestic and wild ungulates opens opportunities for devel-opment of whole industries. Many privately owned protected areas that support wildlife hunting opportunities and ecotourism are located in savannas. If the woody layer is not too dense, grass can coexist with trees and support both domestic livestock and wildlife. The management of savannas determines both the quality and quantity of forage available to animals.
Savanna biomass, both aboveground and belowground, can contribute substantially to carbon sequestration and storage. This is a benefit in mitigation of climate change impacts. REDD+ accreditation seems farfetched for many savannas but even if there is no payment for carbon credits, quantifying the biomass and its potential in carbon se-questration may be sufficient at country level to account for the carbon that is sequestered. Other potential uses of savanna biomass include exploration of harvesting of biomass for energy generation and supply of this additional energy into the national power grid. This can be done to control bush encroachment especially under future scenarios of increased CO2 fertilization and higher risk of encroachment.
Within the context of biodiversity conservation, the likely changes in savannas that might threaten biodiversity include increase in the density of certain woody species at the expense of both herbaceous and over-harvested woody spe-cies (e.g. encroaching species such as Dichrostachys cinerea). Adaptation options will include active management of encroaching species through schemes similar to those managed by the Natural Resources Management programs (e.g. Working for Wetlands). Other options include identification of critical biodiversity areas, targeted expansion of protected areas to cover such areas, and integration of objectives for enhancing biodiversity in savannas into biore-gional plans.
Box 12: Impacts of rural electrification on fuelwood extraction
The University of Witwatersrand conducted a study in the rural area of Bushbuckridge, Mpumalanga in north East South Africa on the impacts of provision of electricity on extraction of fuel firewood by rural households. Electricity provision does not appear to replace use of fuel wood for rural communities. In fact, up to 68% of electrified rural households still used fuel wood as the primary source of energy to meet daily house hold needs. Supply of electricity to rural households even at subsidised rates did not provide a viable alternative to fuel wood, even under conditions when fuel wood is scarce. Electricity tariffs are not generally affordable for rural communities that have hardly any income besides the government pension income grant for some households. Fuel wood consumption of households in a fuel wood-scarce environment do not appear to affect use of fuel wood by those households largely due to rural entrepreneurs who sell fuel wood in bakkie loads to communities far from good supply of fuel wood. The savings achieved by households that supplement their energy demand with fuel wood were used in food supply, education and clothing. The indication is that reliance of rural households on fuel wood will continue and availability of fuel wood in savannas will continue to meet this demand.
Matsika, R., Erasmus, B.F.N & Twine, W. (2013) Double jeopardy: the dichotomy of fuelwood use in rural South Africa. Energy Policy. 52:716-725
Climate Change Adaptation Plans for South African Biomes42
3.8 succulent KarooAuthor: Claire Davis and M. Timm Hoffman
3.8.1 Description of the biome
The Succulent Karoo biome is globally recognised as one of only two biodiversity hotpots located within a desert environment (Myers et al. 2000). The biome covers an area of 83 282 km2 or 6.8% of South Africa. The Succulent Karoo boasts the richest variety of succulent flora in the world with 6356 plant species of which 40% are endemic and 936 (17%) are Red Listed (Driver & Maze 2002). The biome extends from the south-east to the north-western parts of South Africa and into southern Namibia. The biome is also the centre of diversity for reptiles and many other invertebrate groups. Despite the importance of the biome’s biodiversity only 7% of the biome is formally protected.
The unique flora of the region can be described as shrubland dominated by leaf-succulents or deciduous-leafed woody perennial dwarf shrubs < 1 m in height (Cowling et al. 2004). The succulent flora is dominated by the fami-lies Aizoaceae (Mesembryanthemaceae), Asteraceae, Crassulaceae, and Euphorbiaceae (Desmet 2007). Annual and geophyte species, which form the main component of the spring mass floral displays, are also abundant in Namaqualand. Tall shrubs, trees and grasses are relatively rare in the Succulent Karoo (Milton et al. 1997; Cowling et al. 2004). There are relatively few invasive plant species (Rouget et al. 2004) with the most prominent invaders including Nicotiana glauca, Acacia cyclops, Prosopis species and Arundo donax (Henderson 2007) especially along the river courses. Fire is not a feature in this biome but the vegetation, particularly perennial species, is susceptible to drought (Hoffman et al. 2009).
The Succulent Karoo is characterised by relatively low rainfall (50-250 mm per annum) which occurs predominantly in the winter months (Desmet 2007). Rainfall is supplemented by heavy dewfalls experienced during mid-winter (July-August) and advective coastal fog experienced during the summer months. Compared to other winter rainfall deserts, mean annual precipitation is relatively predictable and reliable (Desmet 2007; Hoffman & Cowling 1987) and is expressed by low (less than 40%) coefficients of variation. The diversity of life-forms and life-history strategies in Namaqualand can be attributed to these low but reliable rainfall patterns (Desmet & Cowling 1999). Annual average temperatures for the biome are relatively mild, owing to the cold Benguela Current off the west coast of the country (Desmet 2007), and range from 13°C to 21°C. Maximum temperatures only exceed 30°C when berg winds are blow-ing off the plateau to the west (Cowling et al. 1999).
There are two main bioregions within the biome, namely Namaqualand and the Little Karoo. Namaqualand is locat-ed in the north-western part of South Africa extending from the Orange River in the north to Vanrhynsdorp and the Olifants River in the south (Desmet 2007; Cowling & Hilton-Taylor 1999). It is located west and south of the escarp-ment, 200–300 km inland of the west coast and covers a region of approximately 50 000 km2 (Cowling et al. 1999). The Little Karoo is located between the two Cape Fold Mountain ranges in the south of the country and covers ap-proximately 19 730 km2.
The Succulent Karoo has undergone severe transformations since the arrival of pastoral colonists. Today, the Succulent Karoo is influenced by a complex range of economic activities including conservation and tourism, com-mercial livestock production and smallholder livestock production systems (Hoffman & Rohde 2007). Ecosystem services (see below table) are a central component of the economy of the biome and act as a buffer, increasing the resilience of the communities to both climatic and non-climatic risks (Le Maitre et al. 2009). Natural resources pro-vide a free or cheap alternative to other commercial commodities, possibly allowing for financial savings that can be used for other essential goods and services. For example, in the Suid Bokkeveld, at the transition zone between the Succulent Karoo and the Cape Floristic Kingdom, small-scale farmers have been engaged in indigenous rooibos tea production (along with small stock farming), (Archer et al. 2008).
Grazing and browsing by livestock such as sheep, goats, cattle, donkeys and ostriches is the primary land-use in the Succulent Karoo (Reyers et al. 2009) and generates approximately R153 million per annum (Le Maitre et al. 2009). In comparison with the other biomes the economy is relatively small and is highly dependent on natural resources. The tourism sector is based largely on the annual flower displays in Namaqualand and the annual value is estimated at R18 million. Scenic tourism is valued at R156 million per annum.
External stresses such as climate change, shifts in agricultural production and land use (including land reform) are likely to negatively impact the Succulent Karoo (Nel & Hill 2008). Additional challenges facing the biome include small
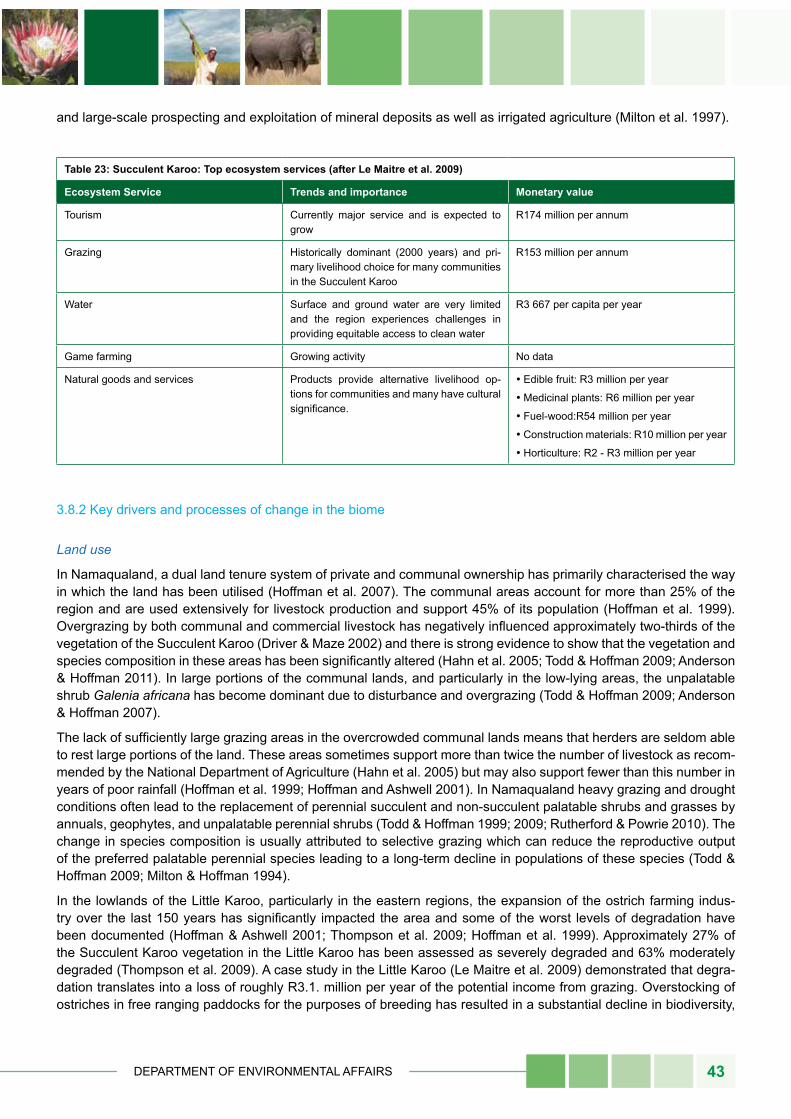
DEPARTMENT OF ENVIRONMENTAL AFFAIRS 43
and large-scale prospecting and exploitation of mineral deposits as well as irrigated agriculture (Milton et al. 1997).
table 23: succulent Karoo: top ecosystem services (after le maitre et al. 2009)
ecosystem service trends and importance monetary value
Tourism Currently major service and is expected to grow
R174 million per annum
Grazing Historically dominant (2000 years) and pri-mary livelihood choice for many communities in the Succulent Karoo
R153 million per annum
Water Surface and ground water are very limited and the region experiences challenges in providing equitable access to clean water
R3 667 per capita per year
Game farming Growing activity No data
Natural goods and services Products provide alternative livelihood op-tions for communities and many have cultural significance.
•Edible fruit: R3 million per year
•Medicinal plants: R6 million per year
•Fuel-wood:R54 million per year
•Construction materials: R10 million per year
•Horticulture: R2 - R3 million per year
3.8.2 Key drivers and processes of change in the biome
Land use
In Namaqualand, a dual land tenure system of private and communal ownership has primarily characterised the way in which the land has been utilised (Hoffman et al. 2007). The communal areas account for more than 25% of the region and are used extensively for livestock production and support 45% of its population (Hoffman et al. 1999). Overgrazing by both communal and commercial livestock has negatively influenced approximately two-thirds of the vegetation of the Succulent Karoo (Driver & Maze 2002) and there is strong evidence to show that the vegetation and species composition in these areas has been significantly altered (Hahn et al. 2005; Todd & Hoffman 2009; Anderson & Hoffman 2011). In large portions of the communal lands, and particularly in the low-lying areas, the unpalatable shrub Galenia africana has become dominant due to disturbance and overgrazing (Todd & Hoffman 2009; Anderson & Hoffman 2007).
The lack of sufficiently large grazing areas in the overcrowded communal lands means that herders are seldom able to rest large portions of the land. These areas sometimes support more than twice the number of livestock as recom-mended by the National Department of Agriculture (Hahn et al. 2005) but may also support fewer than this number in years of poor rainfall (Hoffman et al. 1999; Hoffman and Ashwell 2001). In Namaqualand heavy grazing and drought conditions often lead to the replacement of perennial succulent and non-succulent palatable shrubs and grasses by annuals, geophytes, and unpalatable perennial shrubs (Todd & Hoffman 1999; 2009; Rutherford & Powrie 2010). The change in species composition is usually attributed to selective grazing which can reduce the reproductive output of the preferred palatable perennial species leading to a long-term decline in populations of these species (Todd & Hoffman 2009; Milton & Hoffman 1994).
In the lowlands of the Little Karoo, particularly in the eastern regions, the expansion of the ostrich farming indus-try over the last 150 years has significantly impacted the area and some of the worst levels of degradation have been documented (Hoffman & Ashwell 2001; Thompson et al. 2009; Hoffman et al. 1999). Approximately 27% of the Succulent Karoo vegetation in the Little Karoo has been assessed as severely degraded and 63% moderately degraded (Thompson et al. 2009). A case study in the Little Karoo (Le Maitre et al. 2009) demonstrated that degra-dation translates into a loss of roughly R3.1. million per year of the potential income from grazing. Overstocking of ostriches in free ranging paddocks for the purposes of breeding has resulted in a substantial decline in biodiversity,
Climate Change Adaptation Plans for South African Biomes44
nutrient cycling, forage production, water flow regulation, and erosion control (Reyers et al. 2009). Trampling by os-triches leads to soil compaction and the removal of the biological soil crust, which increases wind driven soil erosion (Cupido 2005). In response to these impacts a switch to pen-breeding farming has been advocated in combination with rehabilitation measures.
Land reform
Uncertainties around land reform add to the challenges of coping with climate change in the Succulent Karoo (Vetter 2009; Hoffman 2014). Given the economic growth potential of conservation as a form of land use in the Succulent Karoo, promoting community based conservation could therefore, play an important role in promoting land reform.
In one of the few studies on the potential effect of the land reform programme on the vegetation of South Africa’s arid zone, Hoffman et al. (2005) investigated the impact of livestock on the vegetation of Riemvasmaak, a 75,000 ha communal area in the Northern Cape. Using a series of 29 repeat photograph pairs taken in 1995 and then 10 years later in 2005, Hoffman et al. (2005) reported little difference in the tree and shrub component over time. However, grass cover declined significantly, particularly on the sandy pediments of the area. This decline was attributed to the increase in livestock in Riemvasmaak. While the sandy pediments in particular had been affected by the introduction of large numbers of domestic herbivores, the livestock industry had also made a significant contribution to the liveli-hoods of people re-settled in the area after their forced removal in 1974. The trade-off between enabling small-scale and emerging farmers to earn a living while sustaining the basic goods and services derived from these areas is one of the most important challenges facing people who live, work and are responsible for South Africa’s semi-arid and arid regions. If a decline in primary production in response to climate change is likely then decisions about carrying capacity, mobility, alternative livelihoods and governance will become even more critical. As Hoffman (2014) has sug-gested, the way in which land is used has important implications for how ecosystems function both on- and off-site. Together with changes in climate, land use influences vegetation cover and composition with important impacts on the choices people have to make a living. Land degradation whether on communal or commercial lands narrows the land use options available to land users and renders them more vulnerable to the shocks from drought and disease as well as changes in market prices of agricultural goods.
3.8.3 Vulnerability to climate change
The latest climate change projections for the Succulent Karoo indicate that both temperature and evapotranspira-tion are likely to increase into the 21st century (Van Jaarsveld & Chown 2001; Pachauri & Reisinger 2007; Archer & Tadross 2009; Tadross et al. 2011). Rainfall is expected to decrease in the future (Tadross et al. 2011; Christensen et al. 2007) as a result of a poleward retreat of rain-bearing mid latitude cyclones (MacKellar et al. 2007). Studies based on bioclimatic envelope models (Rutherford et al. 1999; Midgley & Thuiller 2007) indicate that the Succulent Karoo and Namaqualand in particular will be significantly impacted by the changes in climate. These models suggest that the biome may suffer a reduction in spatial extent, particularly along its eastern border, by the year 2050 as well as consequent reductions in the abundance and diversity of endemic species (Midgley & Thuiller 2007; Hannah et al. 2002). Assuming that the vegetation currently to the east of this retracting margin will expand westwards in re-sponse, then the grass and woody shrub component of the vegetation of this area is likely to increase. Should such shifts occur, then large areas of the Succulent Karoo are likely to resemble the Nama Karoo or Desert biomes in composition and structure. Furthermore, these models predict that as much as 40% of the biome will fall outside the current climate envelope with the Succulent Karoo vegetation being replaced by an unknown arid vegetation type (Rutherford et al. 1999).
Revised biome change predictions based on more recent climate data and analysis methods (Driver et al. 2012) however, demonstrate that the Succulent Karoo biome will remain stable over time with the desert biome expanding into areas previously occupied by the Nama-karoo biome. This differing outcome to the previous assessments can be attributed to the statistically downscaled climate models which project less extreme changes in rainfall for the winter rainfall region of South Africa. Repeat ground and aerial photograph analyses suggest that despite fluctuations in grass and shrub cover over decades (Hongslo et al. 2009) the relatively narrow ecotone between the Succulent Karoo and Nama-karoo biomes in Namaqualand has been remarkably stable over the period 1986-2005 (Shiponeni 2007) and no sign of widespread aridification has yet become evident (Hoffman and Rohde 2007).
DEPARTMENT OF ENVIRONMENTAL AFFAIRS 45
In terms of individual species’ responses, Midgley and Thuiller (2007) modelled the response of 20 endemic succu-lents and although the ranges of the majority of species were predicted to contract, the responses varied consider-ably. Three species increased in range, by as much as 80%, the remaining 17 species, however, all declined by an average of 56% with several species predicted to experience range contractions in excess of 70%. The possibility of range expansion assumes adequate dispersal ability as well as the ability to survive on different substrates. Since substrate plays such a dominant role in determining the distribution of many species in the region (Desmet 2007), it will have an overriding effect on the ability of plants to respond to climate change. Consequently, the ability of many species to track areas of suitable climate or take advantage of increases in potential range will be highly curtailed, and the predictions of Midgley and Thuiller (2007) may in fact represent best-case scenarios. Midgley and Thuiller (2007) further argue that a severe effect of climate change on the succulent flora of the Karoo can be expected because the flora evolved during a period when it was cooler and probably also wetter and atmospheric CO2 content was lower. Consequently, the higher temperatures and CO2 content predicted for the future does not reflect conditions the area is likely to have experienced in recent times and so is likely to push many species outside their tolerance limits or at least require extensive range shifts.
A unique feature of the Succulent Karoo is the high degree of structural diversity (Cowling et al. 1999), which may confer some degree of resilience to climate change impacts because at least some growth forms are likely to tolerate or benefit from the changes. Consequently, future vegetation composition is likely to be derived largely from tolerant species already present in the vegetation, probably with a lesser component consisting of species invading from ad-jacent areas. In the Succulent Karoo particularly, this still leaves considerable scope for large changes in vegetation structure and dominant growth forms. Broennimann et al. (2006) modelled changes in the distribution of different life forms within southern Africa and found that geophytes and succulents were particularly vulnerable to climate change. Overall, Broennimann et al. (2006) predict a minimum decline in species richness of 41% for the Succulent Karoo and Cape Floristic Region. Since succulents and geophytes comprise a large proportion of the diversity of the Succulent Karoo (over 50% in Namaqualand), the impacts on vegetation diversity may exceed those on structure. Dwarf succulents which comprise a large proportion of the endemic species of the Succulent Karoo appear to be particularly vulnerable to climate change (Midgley & Thuiller 2007; Musil et al. 2009). These species are also often edaphic specialists and have very limited dispersal ability (Schmiedel & Jürgens 1999; Klak et al. 2004; Schmiedel & Mucina 2006), which would restrict their potential to track areas of suitable climate. Annuals were, however, par-ticularly resilient in the face of climate change and were the only growth form where large declines in range were not predicted (Broennimann et al. 2006).
Since climate change is also expected to alter the frequency and intensity of drought events (Fauchereau et al. 2003), understanding vegetation responses to such events is also key to predicting the likely future vegetation com-position of the Succulent Karoo. Partly in an attempt to redress this research gap Hoffman et al. (2009) reviewed the responses of succulent and woody shrub species to drought. Although the responses were to some extent case-spe-cific, some succulent shrub seedlings were able to tolerate drought conditions for a lot longer than the woody species that had been included in the study. In the seedling phase, woody shrub seedlings do not yet have access to the deeper water resources and so are vulnerable to drought conditions compared to succulent seedlings which are able to tolerate drought conditions for a significant amount of time due to low transpiration rates and a canopy-stored wa-ter reserve. Other studies have shown that some succulent karoo biome species, such as short-lived, leaf-succulent species within the family Aizoaceae, are more susceptible to the impact of drought than others (Jürgens et al. 1999; Carrick 2001, Midgley and van der Heyden 1999, Milton et al. 1995).
As outlined in the Desert and Nama-Karoo chapter, climate change may impact livestock health and condition, by increasingly exceeding the temperature thresholds above the thermal comfort zone of sheep and goats could induce behavioural and metabolic changes including altering growth rate, reproduction and ultimately mortality (Batima 2003). In terms of risks of changes in rainfall to livestock production, Richardson et al. (2007) explored the impact of a 10% decline in mean annual rainfall for Namaqualand. Their results showed a 35% reduction in the average number of animals that could be maintained on the rangeland over time. Apart from the negative effects this is likely to have on rural livelihoods, it will also increase the minimum viable herd size, since smaller herds will be at greater risk of extinction from stochastic drought effects (Hendricks et al. 2005).
Climate Change Adaptation Plans for South African Biomes46
table 24: succulent Karoo: top climate-related risks by 2050
nature of the risk Assessment
Extreme high temperatures will place constraints on livestock pro-ductivity
Very likely under RCP 8.5, likely under RCP4.0
Higher temperatures could result in the range contraction of succu-lent plant species
Likely under RCP 8.5 and RCP 4.0
Reduced rainfall and increased drought frequency could result in a reduction in forage quality and quantity
Medium, limited agreement between models
3.8.4 Adaptation options
The Succulent Karoo is often considered to be environmentally and economically marginal, particularly since there is a high dependence of people on natural resources, livestock, and agriculture (Benjaminsen et al. 2006; Cousins et al. 2007). Furthermore, employment rates are generally low and the percentage of the population below the mean living level5 is approximately 27% (Statistics South Africa, 2007). The ability of land users to cope with climate change is becoming progressively dictated by the resilience of the rangelands and the diversity of livelihood options. Adaptation options therefore need to focus on enhancing the coping capacity of the land-users and the resilience of the ecosys-tems. For example, there is an opportunity for the establishment of Small, Medium and Micro Enterprises (SMMEs) focused on restoration such as seed production companies.
Changing land-use patterns, such as increases in grazing pressure and the abandonment of cultivation, has had a considerable influence on vegetation change in the biome. Understanding the nature, rate and extent of recent changes in vegetation in the region combined with monitoring programmes linked to long-term field observations and remote sensing techniques is essential to inform planning (Davis 2013). Furthermore, planning for climate change is required in the land reform process in order for the beneficiary communities to be able to cope with expected chang-es in climate (Hoffman 2014). Firstly, a policy or government support system needs to be established for communal rangelands or beneficiaries of land reform (Vetter 2009). Secondly, more extensive land transfer are required to relive the current grazing pressure in the communal areas. Thirdly, the land transfer needs to support diversified economic activities.
The Succulent Karoo Ecosystem Programme (SKEP), (see Box 13) strategy identified a number of adaptation priori-ties and important areas for supporting adaptation which are still relevant (Driver & Maze 2002). In addition to SKEP, there are a number of current programmes and initiatives being carried out in the biome which aim to create a climate resilient ecosystem as well as to increase the adaptive capacity of the people living in the region. In the Namakwa District Municipality, for example, Conservation South Africa has developed pilot projects investigating how ecosys-tem based adaptation can be successfully put into practise (Bourne et al. 2012). This project has made significant strides in engaging local communities and government officials on climate change and biodiversity conservation. Another example is in the Little Karoo where the South African Ostrich Business Chamber (SAOBC) has been work-ing with farmers to reduce the impact of ostrich farming as well as restore some of the previously degraded areas (see Box 14). A successful adaptation plan for the Succulent Karoo will need to build on and (where necessary) add value to what is already planned or under way in the region.
table 25: succulent Karoo: top climate-related adaptation options
option risk remaining after full adaptation
Supporting emerging farmers through the development of economi-cally viable SMMEs
Small under RCP4.0, moderate under RCP 8.5
Restoration of previously degraded areas including mined areas Small under RCP4.0, moderate under RCP 8.5
Mainstream biodiversity best practises into livestock grazing and ostrich farming
Moderate under RCP4.0, high under RCP 8.5
5 Mean living level (MLL) is defined as “the minimum monthly income needed to sustain a household” and varies according to the size of the household (Forsyth et al. 2010).
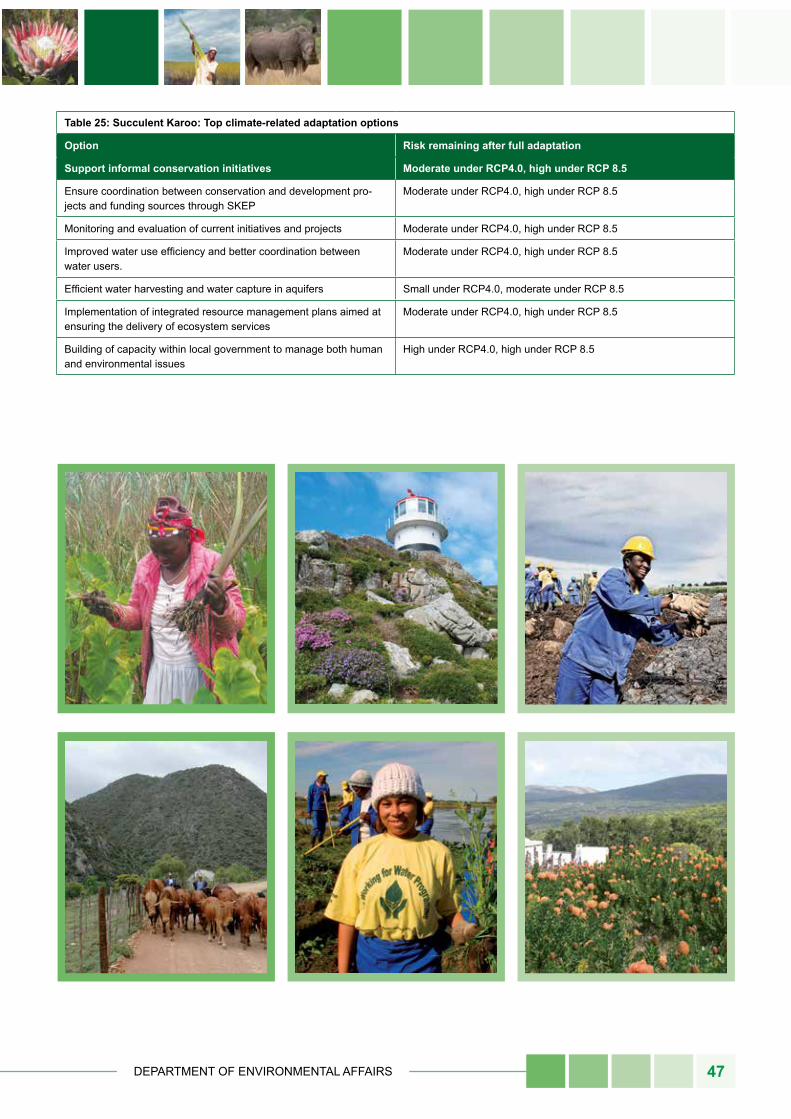
DEPARTMENT OF ENVIRONMENTAL AFFAIRS 47
table 25: succulent Karoo: top climate-related adaptation options
option risk remaining after full adaptation
support informal conservation initiatives moderate under rCp4.0, high under rCp 8.5
Ensure coordination between conservation and development pro-jects and funding sources through SKEP
Moderate under RCP4.0, high under RCP 8.5
Monitoring and evaluation of current initiatives and projects Moderate under RCP4.0, high under RCP 8.5
Improved water use efficiency and better coordination between water users.
Moderate under RCP4.0, high under RCP 8.5
Efficient water harvesting and water capture in aquifers Small under RCP4.0, moderate under RCP 8.5
Implementation of integrated resource management plans aimed at ensuring the delivery of ecosystem services
Moderate under RCP4.0, high under RCP 8.5
Building of capacity within local government to manage both human and environmental issues
High under RCP4.0, high under RCP 8.5
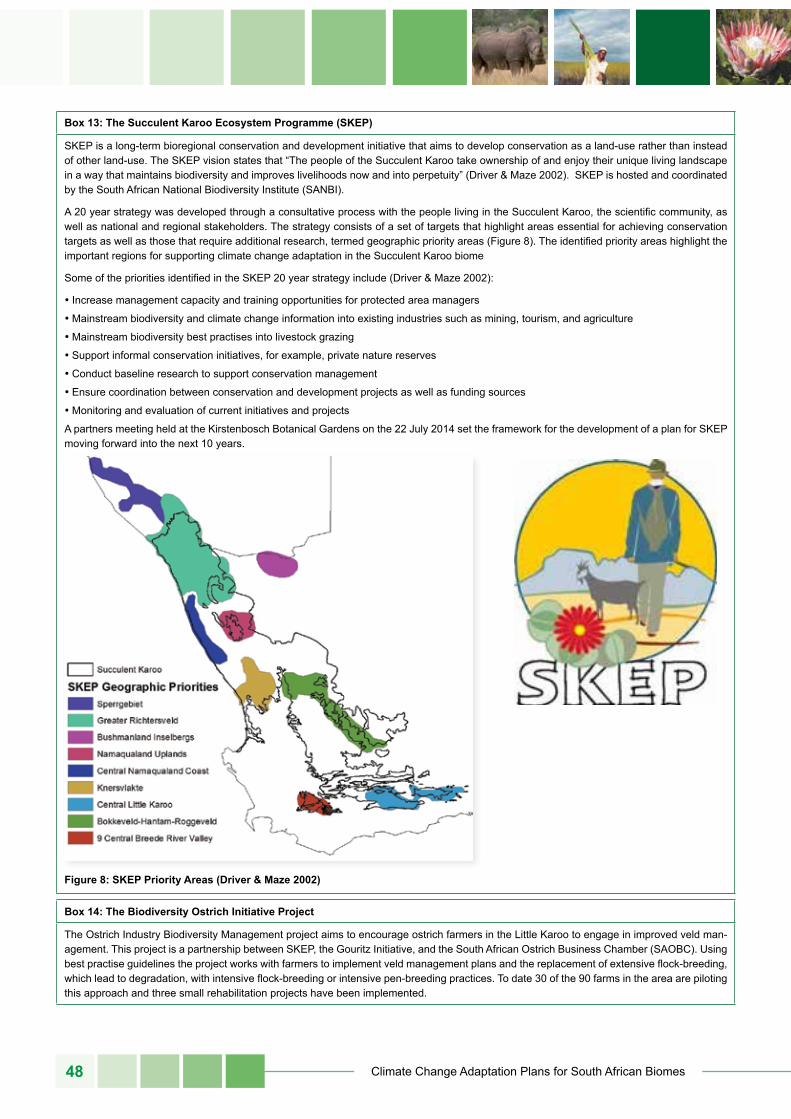
Climate Change Adaptation Plans for South African Biomes48
Box 13: the succulent Karoo ecosystem programme (sKep)
SKEP is a long-term bioregional conservation and development initiative that aims to develop conservation as a land-use rather than instead of other land-use. The SKEP vision states that “The people of the Succulent Karoo take ownership of and enjoy their unique living landscape in a way that maintains biodiversity and improves livelihoods now and into perpetuity” (Driver & Maze 2002). SKEP is hosted and coordinated by the South African National Biodiversity Institute (SANBI).
A 20 year strategy was developed through a consultative process with the people living in the Succulent Karoo, the scientific community, as well as national and regional stakeholders. The strategy consists of a set of targets that highlight areas essential for achieving conservation targets as well as those that require additional research, termed geographic priority areas (Figure 8). The identified priority areas highlight the important regions for supporting climate change adaptation in the Succulent Karoo biome
Some of the priorities identified in the SKEP 20 year strategy include (Driver & Maze 2002):
•Increase management capacity and training opportunities for protected area managers
•Mainstream biodiversity and climate change information into existing industries such as mining, tourism, and agriculture
•Mainstream biodiversity best practises into livestock grazing
•Support informal conservation initiatives, for example, private nature reserves
•Conduct baseline research to support conservation management
•Ensure coordination between conservation and development projects as well as funding sources
•Monitoring and evaluation of current initiatives and projects
A partners meeting held at the Kirstenbosch Botanical Gardens on the 22 July 2014 set the framework for the development of a plan for SKEP moving forward into the next 10 years.
figure 8: sKep priority Areas (Driver & maze 2002)
Box 14: the Biodiversity ostrich initiative project
The Ostrich Industry Biodiversity Management project aims to encourage ostrich farmers in the Little Karoo to engage in improved veld man-agement. This project is a partnership between SKEP, the Gouritz Initiative, and the South African Ostrich Business Chamber (SAOBC). Using best practise guidelines the project works with farmers to implement veld management plans and the replacement of extensive flock-breeding, which lead to degradation, with intensive flock-breeding or intensive pen-breeding practices. To date 30 of the 90 farms in the area are piloting this approach and three small rehabilitation projects have been implemented.
DEPARTMENT OF ENVIRONMENTAL AFFAIRS 49
4. poliCy options for enhAnCinG resilienCe of Biomes to ClimAte ChAnGe
As mentioned earlier, South Africa is world-renowned for exceptionally high levels of biodiversity and, as such, ad-aptation has been identified as a key response measure to reduce the vulnerability to the impacts of climate change. In addition, as mentioned in previous sections, biodiversity itself comprises a key resource in adapting to climate change in the form of ecosystem based adaptation. We seek here to achieve, as mentioned earlier, multiple benefits in our approach to adaptation, achieving synergies between biodiversity/ecosystem conservation, the achievement of sustainable livelihoods, and appropriate and effective response to climate change.
This chapter outlines the priority areas for supporting adaptation, the priority adaptation measures as well as the policy and decision-making mechanisms to facilitate adaptation. With appropriate responses, climate change need not always be detrimental, and indeed proactive responses can exploit opportunities for both the protection of biodi-versity as well as development (Davis 2011). Over the medium to long-term there is great potential to adapt to climate change through mainstreaming adaptation in core activities and programmes (e.g. ‘Working For …’ programmes) within each of the biomes. As mentioned in previous sections, our key priorities here need to be cognizant of exist-ing better and best practice, and to be, as far as possible, transferable, without losing local context and uniqueness. We will refer here extensively to the table provided as a Summary for Policy Makers in the introduction, and repeat it below, for reference.
The primary focus of adaptation in the biodiversity sector has traditionally been on conservation strategies, biodiver-sity planning (for example, the National Spatial Biodiversity Assessment and the National Protected Areas Expansion Strategy) and more recently, as mentioned above, ecosystem based adaptation. As seen above, significant oppor-tunities now exist to think more broadly about response in these areas, including different responses for different biomes, including actions, as described below, that have benefits beyond adaptation, or supporting adaptation to cli-mate change. In the case of grassland, for example, actions include adjustment of land proportions, and optimization of protected areas, which are recommendations under a variety of scenarios, including climate change (for example, areas where significant mining concessions are planned). In the case of the desert biome, education, outreach and extension are considered critical – and we may consider this in the light further of land managers within these areas who, whether under conditions of increasing climate risk or not, need to balance competing requirements for water, and require up to date information and extension/advice to do so. A good example here would be requirements in both the large-scale and smaller proposed concessionary areas for fracking.
It has been argued that traditional conservation strategies that focus for example on increasing connectivity between patches of protected land, although invaluable are likely to be insufficient to curb the impacts of climate change and more strategic approaches are required (Gillson et al. 2013). Evidence-based information at the local scale on the impacts of climate change is essential to guide land-use management and policy decisions. Currently, some of the local scale information does not conform to the projected impacts by climate envelope modelling. Exactly how these climate-driven changes are likely to manifest themselves in the context of the complex range of land-use activities at the local scale remains unclear. Furthermore, the basis of these bioclimatic model outputs is strongly dependent on the input data (Pearson & Dawson 2003; Huntley et al. 2010; Araújo & Peterson 2012) and little effort has been made to assess their key assumptions by relating them to quantitatively-measured vegetation data. A move away from such techniques to more evidence-based approaches with locally relevant case studies will help support and promote policy recommendations.
In the case of ecosystem based adaptation – that is, in using biodiversity as a resource in responding to climate change, the section on the Desert and the Nama Karoo biomes has outlined key best practices that must be under-taken in ecosystem based adaptation, derived from Midgley et al 2012; including:
1. Involving of key stakeholders in integrated and adaptive planning and implementation;
2. Focusing on the development of adaptation measures that are locally contextualized;
3. Linking to national, provincial and local scale ‘enabling’ frameworks;
4. Considering adaptation within the broader landscape;
5. Ensuring safeguarding against risks and costs;
6. Financial sustainability a key consideration from the start;
Climate Change Adaptation Plans for South African Biomes50
7. Development of monitoring and evaluation;
8. Tracking of cost effectiveness and resilience outcomes;
9. Establishment of learning networks and communities of practice.
Examples and expanded descriptions are provided in the relevant section, but we regard these best practice princi-ples as critical in guiding adaptation planning in ways that have not necessarily been a dominant feature of adaptation planning in this and other sectors thus far.
In the Table Summary for Policy Makers provided at the beginning of the report, Ecosystem Based Adaptation is considered from a range of angles, including recommendations for actions around protection of movement corridors, adjustment of burning regimes, and clearing of alien vegetation and restoration of degraded areas. A key example here would be the Greater Cedarberg Biodiversity Corridor, in which existing policy initiatives have been used (such as the “Working for” programmes) to support such initiatives, as well as a variety of biodiversity stewardship agree-ments, both in terms of more traditional approaches to conservation, as well as actually recognizing, at the local gov-ernment and provincial level, that such actions are key in providing resources for adaptation under increasing climate risk (see, for example, work undertaken by the Cedarberg Protected Areas Advisory Committee).
Finally, Monitoring and Evaluation is considered critical as a policy recommendation for all biomes. As shown in the recommendations provided by Midgley et al 2012 above, better practice should always include robust monitoring and evaluation of interventions. Without this, interventions can take place on an adhoc project basis, without real learning about what comprises impact. This is a common challenge in actions in different biomes (and not simply in the context of climate change); and real learning and evolution of proper adaptive responses, both in formal policy and strategy development, can only take place with concrete information around what works, and how well it does so.
5. ACKnoWleDGements
We gratefully acknowledge the comments from reviewers on the individual biome chapters and the inputs received from stakeholders who attended the workshop on the 26 November 2014.
DEPARTMENT OF ENVIRONMENTAL AFFAIRS 51
6. referenCesAcocks J.P.H. 1953. Veld types of South Africa. Memoirs of the Botanical Surveys South Africa. 28: 1-192.
Adams, J.M. (2009) Species Richness – Patterns in the Diversity of Life. Springer, Berlin, Heidelberg. 416pp.
Allan, J. 2004. The influence of land use on stream ecosystems. Annual Review of Ecology, Evolution, and Systematics 35: 257-284.
Anderson, P. & Hoffman, M. 2007, “The impacts of sustained heavy grazing on plant diversity and composition in lowland and upland habitats across the Kamiesberg mountain range in the Succulent Karoo, South Africa”, Journal of Arid Environments, vol. 70, no. 4, pp. 686-700.
Anderson, P. & Hoffman, M. 2011, “Grazing response in the vegetation communities of the Kamiesberg, South Africa: Adopting a plant functional type approach”, Journal of Arid Environments, vol. 75, no. 3, pp. 255-264.
Araújo, M.B. & Peterson, A.T. 2012, “Uses and misuses of bioclimatic envelope modeling”, Ecology, vol. 93, no. 7, pp. 1527-1539.
Archer, E., Oettlé, N., Louw, R. & Tadross, M. 2008, “Farming on the edge in arid western South Africa: climate change and agri-culture in marginal environments”, Geography, vol. 93, pp. 98-107.
Archer, E.R.M. & Tadross, M. 2009, “Climate change and desertification in South Africa—science and response”, African Journal of Range & Forage Science, vol. 26, no. 3, pp. 127-131.
Archer, E.R.M. 2004, “Beyond the “climate versus grazing” impasse: using remote sensing to investigate the effects of grazing system choice on vegetation cover in the eastern Karoo”, Journal of Arid Environments, vol. 57, no. 3, pp. 381-408.
Archibald, S. & Scholes, R.J. 2007. Leaf green-up in a semi-arid African savanna - separating tree and grass responses to envi-ronmental cues. Journal of Vegetation Science, 18, 583-594.
Archibald, S., Nickless, A., Govender, N., Scholes, R. & Lehsten, V. 2010, “Climate and the inter‐annual variability of fire in southern Africa: a meta‐analysis using long‐term field data and satellite‐derived burnt area data”, Global Ecology and Biogeography, vol. 19, no. 6, pp. 794-809.
Bailey, C. L., Shackleton, C.M., Geldenhys, C.J., Moshe, D., Fleming, G., Vink, E.R., Rathogwa, N.R., and Cawe, S.G. 1999. Guide to, and summary of, the meta-database pertaining to selected attributes of South African natural forests and woodlands. ENV-P-C 99027, CSIR, Pretoria.
Batima, P., 2003: Climate change: pasture–livestock. Synthesis report. Potential Impacts of Climate Change, Vulnerability and Adaptation Assessment for Grassland Ecosystem and Livestock Sector in Mongolia, ADMON Publishing, Ulaanbaatar, 36-47.
Benjaminsen, T.A., Rohde, R., Sjaastad, E., Wisborg, P. & Lebert, T. 2006, “Land reform, range ecology, and carrying capacities in Namaqualand, South Africa”, Annals of the Association of American Geographers, vol. 96, no. 3, pp. 524-540.
Berliner 2005. Systematic conservation planning for the forest biome of South Africa. Approach, methods and results of the selec-tion of priority forests for conservation action. Department of Water Affairs and Forestry. Pretoria. South Africa.
Bomhard, B., Richardson, D.M., Donaldson, J.S., Hughes, G.O., Midgley, G.F., Raimondo, D.C., Rebelo, A.G., Rouget, M. & Thuiller, W. 2005, “Potential impacts of future land use and climate change on the Red List status of the Proteaceae in the Cape Floristic Region, South Africa”, Global Change Biology, vol. 11, no. 9, pp. 1452-1468.
Bond W.J. 2008. What Limits Trees in C4 Grasslands and Savannas? Annu. Rev. Ecol. Evol. Syst. 39:641–59.
Bond, W. J., and C.L. Parr. 2010. Beyond the forest edge: ecology, diversity and conservation of the grassy biomes. Biological Conservation, 143(10), 2395-2404.
Bond, W. J., G.F. Midgley, and W.I. Woodward. 2003. The importance of low atmospheric CO2 and fire in promoting the spread of grasslands and savannas. Global Change Biology 9: 973–-982.
Bond, W.J. and P. Slingsby. 1983. Seed dispersal by ants in shrublands of the Cape Province and its evolutionary implications. South African Journal of Science 79: 231-233.
Bond, WJ, Woodward FI, Midgley GF. 2005. The global distribution of ecosystems in a world without fire. New Phytologist 165:525-538.
Bourne, A., Donatti, C., Holness, S. & Midgley, G. 2012, Climate Change Vulnerability Assessment for the Namakwa District Municipality, Conservation South Africa.
Brauman, K A, Daily, G C, Duarte, T K, Mooney, H A. 2007. The nature and value of ecosystem services: An overview highlighting hydrologic services. Annual Review of Environment and Resources 32: 67-98.
Brew, J.W. 1920. The plant ecology of the coastal belt of Natal. Ann, Natal. Mus. 4:367-467
Broennimann, O., Thuiller, W., Hughes, G., Midgley, G.F., Alkemade, J.R. & Guisan, A. 2006, “Do geographic distribution, niche property and life form explain plants’ vulnerability to global change?”, Global Change Biology, vol. 12, no. 6, pp. 1079-1093.
Bruijnzeel, LA 2004. Hydrological functions of tropical forests: not seeing the soil for the trees? Agriculture, Ecosystems and Environment 104: 185-228.
Carrick P. (2001). Shrub community dynamics in a South African semi-desert. PhD thesis, University of Cambridge, Cambridge.
CBD 2013, “Convention on biological diversity”, Convention on Biological Diversity.
Climate Change Adaptation Plans for South African Biomes52
Chamaille-Jammes S, Valeix M and H Fritz. 2007. Managing heterogeneity in elephant distribution: interactions between elephant population density and surface-water availability. Journal of Applied Ecology 44: 625–633
Chapman and White 1970. The evergreen forests of Malawi. Commonwealth Forestry Institute, Oxford, UK.
Chase, B.M. and M.E. Meadows. 2007. Late Quaternary dynamics of southern Africa’s winter rainfall zone. Earth-Science Reviews 84:103-138.
Christensen, J.H., Hewitson, B., Busuioc, A., Chen, A., Gao, X., Held, R., Jones, R., Kolli, R.K., Kwon, W. & Laprise, R. 2007, “Regional climate projections” in Climate Change, 2007: The Physical Science Basis.Contribution of Working group I to the Fourth Assessment Report of the Intergovernmental Panel on Climate Change, ed. S. Solomon, University Press, Cambridge, pp. 847-940.
Cocks, M. L., & Wiersum, K. F. (2003). The significance of biodiversity to rural households in Eastern Cape Province of South Africa. Forests, Trees and Livelihoods, 13, 39–58.
Cocks, ML, Dold, T and Vetter, S. 2012. ‘God is my forest’ – Xhosa cultural values provide untapped opportunities for conservation. South African Journal of Science 108: Art. #880, 8 pages. http://dx.doi.org/10.4102/sajs.v108i5/6.880.
Colvin, C, Le Maitre, D, Saayman, I and Hughes, S 2007. An introduction to aquifer dependent ecosystems in South Africa. WRC Report TT 301/07, Water Research Commission, Pretoria.
Colvin, C., K. Riemann, C. Brown, A. Mlisa, D. Blake, T. Aston, A. Maherry, J. Engelbrecht, C. Pemberton, R. Magoba and A. Soltau 2008. Ecological and environmental impacts of large-scale groundwater development in the Table Mountain Group (TMG) aquifer system. WRC Report No. 1327/1/08, Water Research Commission, Pretoria.
Conservation International 2014. Maputaland-Pondoland-Albany. Copy viewed on 17 March 2014, available at: http://www.con-servation.org/where/priority_areas/hotspots/africa/Maputaland-Pondoland-Albany/Pages/default.aspx.
Cooper K.H. and Swart, W. 1992. Transkei forest survey. Wildlife Society of Southern Africa. Durban, South Africa.
Cooper, K. H. 1985. The conservation status of indigenous forests in Transvaal, Natal and O.F.S., South Africa. Wildlife Society of South Africa, Durban.
Cousins, B., Hoffman, M., Allsopp, N. & Rohde, R. 2007, “A synthesis of sociological and biological perspectives on sustainable land use in Namaqualand”, Journal of Arid Environments, vol. 70, no. 4, pp. 834-846.
Cowling, R. & Hilton-Taylor, C. 1999, “Plant biogeography, endemism and diversity” in The Karoo: ecological patterns and pro-cesses, eds. W.R.J. Dean & S.J. Milton, University Press, Cambridge, pp. 42-56.
Cowling, R. M., A. T. Knight, S. D. J. Privett, and G. Sharma. 2010. Invest in opportunity, not inventory of hotspots. Conservation Biology 24:633-635.
Cowling, R. M., R. L. Pressey, M. Rouget, and A. T. Lombard. 2003. A conservation plan for a global biodiversity hotspot— the Cape Floristic Region, South Africa. Biological Conservation 112:191-216.
Cowling, R., Esler, K. & Rundel, P. 1999, “Namaqualand, South Africa–an overview of a unique winter-rainfall desert ecosystem”, Plant Ecology, vol. 142, no. 1, pp. 3-21.
Cowling, R.M., D.M. Richardson, and P.J. Mustart. 1997. Fynbos. Pages 99-130 in R.M. Cowling, D.M. Richardson, and S.M. Pierce, editors. Vegetation of Southern Africa. Cambridge University Press, Cambridge UK.
Cowling, R.M., Richardson, D.M. & Pierce, S.M. 2004, Vegetation of southern Africa, Cambridge University Press.
Cowling, RM 1983 Phytochorology and vegetation history in the southeastern Cape, South Africa. Journal of Biogeography 10: 393-419.
Cowling, RM, Ojeda, F, Lamont, BB, Rundel, PW and Lechmere-Oertel, R 2005. Rainfall reliability, a neglected factor in explaining convergence and divergence of plant traits in fire-prone mediterranean-climate ecosystems. Global Ecology and Biogeography 14: 509-519.
Cupido, C.F. 2005, Assessment of veld utilisation practices and veld condition in the Little Karoo.
D’Amato, M. E., Alechine, E., Cloete, K. W., Davison, S., and Corach, D. (2013) ‘Where is the game? Wild meat products authen-tication in South Africa: a case study’, Investigative Genetics, vol 4, no 1, pp. 1-13
Davis, C. 2011, Climate Risk and Vulnerability: A Handbook for Southern Africa, First edn, Council for Scientific and Industrial Research, Pretoria, South Africa.
Davis, C.L. 2013, “Trends in vegetation productivity and seasonality for Namaqualand, South Africa between 1986 and 2011: an approach combining remote sensing and repeat photography”, Unpublished MSc thesis, University of Cape Town, Cape Town.
De Wit, M.P., Crookes, D.J. & Van Wilgen, B.W. 2001. Conflicts of interest in environmental management: estimating the costs and benefits of a tree invasion. Biological Invasions 3: 167–178.
DEA 2011. South Africa’s Second National Communication under the United Nations Framework Convention on Climate Change. Department of Environmental Affairs, Republic of South Africa, Pretoria.
DEA 2012. The Vulnerability Assessment for South African Biomes, Department of Environmental Affairs, Pretoria.
DEPARTMENT OF ENVIRONMENTAL AFFAIRS 53
DEA 2013, Long-Term Adaptation Scenarios Flagship Research Programme (LTAS) for South Africa. Climate Change Implications for the Biodiversity Sector in South Africa, Department of Environmental Affairs, Pretoria, South Africa.
Department of Water Affairs and Forestry. 1998. National Forest Act. Act no 84 of 1998.
Desmet, P. & Cowling, R. 1999, “The climate of the Karoo—a functional approach” in The Karoo: ecological patterns and process-es., eds. W.R.J. Dean & S. Milton, University press, Cambridge, pp. 3-16.
Desmet, P. 2007, “Namaqualand--A brief overview of the physical and floristic environment”, Journal of Arid Environments, vol. 70, no. 4, pp. 570-587.
Driver A, Sink, KJ, Nel, JN, Holness, S, Van Niekerk, L, Daniels, F, Jonas, Z, Majiedt, PA, Harris, L and Maze, K 2012. National Biodiversity Assessment 2011: An assessment of South Africa’s biodiversity and ecosystems. Synthesis Report. South African National Biodiversity Institute and Department of Environmental Affairs, Pretoria.
Driver, A. & Maze, K. 2002, “The Succulent Karoo Ecosystem Plan [SKEP]. An introduction to SKEP”, Veld & Flora, vol. 88.
Driver, A. 2005, National spatial biodiversity assessment 2004: priorities for biodiversity conservation in South Africa, South African National Biodiversity Institute.
Driver, A., Sink, K., Nel, J., Holness, S., Van Niekerk, L., Daniels, F., Jonas, Z., Majiedt, P., Harris, L. & Maze, K. 2012, National Biodiversity Assessment 2011: An assessment of South Africa’s biodiversity and ecosystems, Synthesis Report. South African National Biodiversity Institute and Department of Environmental Affairs, Pretoria.
Eeley, H. A. C., M. J. Lawes, and S. E. P. Piper. 1999. The influence of climate change on the distribution of indigenous forest in KwaZulu-Natal, South Africa. Journal of Biogeography 26: 595-617.
Ellery, F., Scholes, R.J. and Mentis M.T. 1991. An initial approach to predicting the sensitivity of the South African grassland biome to climate change. South African journal of science. 87: 499-503.
Engelbrecht F. and Landman W. 2010. Regional scenarios of future climate change over southern Africa. South African Risk and Vulnerability Atlas, pp. 6-14. ISBN 978-0-620-45659-3.
Engelbrecht F.A., McGregor J.L. and Engelbrecht C.J. 2009. Dynamics of the conformal-cubic atmospheric model projected climate-change signal over southern Africa. International Journal of Climatology 29, 1013-1033. DOI: 10/1002/joc.1742. 29 1013-1033.
Everard, D.A. (ed.) 2005. The relevance of island biogeographic theory in commercial forestry. Forestry Forum Group (South Africa), Foundation for Research Development, Pretoria.
Fabricius, C. and Kock, E. (eds) 2004. Rights, resources and rural development. Community based natural resource management in southern Africa. Pp 282. Earthscan
Fairbank, D.H.K., Thompson, M.W., Vink, D.E., and Newby, T.S., van den Berg, H.M. and Everard, D.A.2000. The South African land cover characteristics data-base: a synopsis of the landscape. South African Journal of Science. 96: 69-82
Fairbanks, D., Thompson, M., Vink, D., Newby, T., Van den Berg, H. & Everard, D. 2000, “South African land-cover characteristics database: a synopsis of the landscape”, South African Journal of Science, vol. 96, no. 2, pp. 69-82.
Fauchereau, N., Trzaska, S., Rouault, M. & Richard, Y. 2003, “Rainfall variability and changes in southern Africa during the 20th century in the global warming context”, Natural Hazards, vol. 29, no. 2, pp. 139-154.
Fauchereau, N., Trzaska, S., Rouault, M. & Richard, Y. 2003, “Rainfall variability and changes in southern Africa during the 20th century in the global warming context”, Natural Hazards, vol. 29, no. 2, pp. 139-154.
Feely J.M. 1987. The early farmers of Transkei. South Africa before A.D. 1870. Cambridge Monographs in African Archaeology 24. BAR International Series 378. Oxford, UK.
Feely, J.M. 1980. Did iron age man have a role in the history of Zululand’s wilderness landscapes. South African Journal of Science, 76: 150-152
Forsyth, G., Kruger, F. & Le Maitre, D. 2010, “National Veldfire Risk Assessment: Analysis of Exposure of Social, Economic and Environmental Assets to Veldfire Hazards in South Africa”, National Resources and the Environment CSIR, Pretoria.
Freeth, R and B. Bomhard and G. F. Midgley 2007. Adapting to Climate Change in the Cape Floristic Region: Building Resilience of People and Plants in Protected Areas. South African National Biodiversity Institute (SANBI), Climate Change Research Group, Kirstenbosch Research Center, 2007.
Geldenhuys, C.J. 1992. Richness, composition and relationships of the floras of selected forests in southern Africa. Bothalia 22: 205-233.
Geldenhuys, C.J. 1994. Bergwind fires and the location pattern of forests patches in the southern Cape landscape. South African journal of Biogeography. 21:49-62.
Geldenhuys, C.J. 1997. Composition and biogeography of forest patches in the inland mountains of the southern cape. Bothalia 27:57-74.
Geldenhuys, C.J. 2002. Concepts and approaches towards development of sustainable resource use of non-timber forest prod-ucts: the example of bark harvesting for traditional medicine. In Seydack, A.H.W, Voster, T., Vermeulen, W.J. and van der
Climate Change Adaptation Plans for South African Biomes54
Merwe, I.J. (Eds) Multiple use management of natural forests and woodlands: policy refinements and scientific progress. DWAF. Pretoria, South Africa.
Geldenhuys, C.J. and MacDevette, D.R. 1989. Conservation status of coastal and montane evergreen forest. In: Biotic diversity in southern Africa: concepts and conservation. Huntley, B.J. (Ed). Oxford University Press, Cape Town. pp.224 238.
Geldenhuys, CJ, 1991. Distribution, size and ownership of forests in the southern Cape. South African Journal of Forestry. 158: 51-66
Geldenhuys, CJ. 1994. Bergwind patches and the location of forest patches in the southern Cape landscape. South African Journal of Biogeography, 21:49–62.
Gelderblom, C., Le Maitre, D., Sandwith, T., von Maltitz, G.P., Levendal, M., van Wilgen, B. 2005. The wild coast biodiversity strategy and action plan. CSIR REPORT ENV-S-C 2005-074. CSIR Stellenbosch
Gillson, L., Dawson, T.P., Jack, S. & McGeoch, M.A. 2013, “Accommodating climate change contingencies in conservation strat-egy”, Trends in ecology & evolution, vol. 28, no. 3, pp. 135-142.
Goldblatt, P. and Manning, J. 2000. Cape Plants. A conspectus of the Cape flora of South Africa. Strelitzia 9.
Hahn, B., Richardson, F., Hoffman, M., Roberts, R., Todd, S. & Carrick, P. 2005, “A simulation model of long-term climate, livestock and vegetation interactions on communal rangelands in the semi-arid Succulent Karoo, Namaqualand, South Africa”, Ecological Modelling, vol. 183, no. 2-3, pp. 211-230.
Hall, R. & Cousins, B. 2013, “Livestock and the rangeland commons in South Africa’s land and agrarian reform”, African Journal of Range & Forage Science, vol. 30, no. 1-2, pp. 11-15.
Hall, R. and Du Toit, A. 2014. ‘Smoke and mirrors in government’s farm worker policy’, http://www.plaas.org.za/blog/smoke-and-mir-rors-government%E2%80%99s-farm-worker-policy, April 15th 2014, PLAAS, accessed July 2014
Hannah, L., Midgley, G., Lovejoy, T., Bond, W., Bush, M., Lovett, J., Scott, D. & Woodward, F. 2002, “Conservation of biodiversity in a changing climate”, Conservation Biology, vol. 16, no. 1, pp. 264-268.
Hassan, R.M. and Haveman, J. 1997. The values and rate of harvesting natural forests and woodlands products for direct use by communities in the Eastern Cape Province. Draft Report. Development Bank of Southern Africa. Midrand, South Africa.
Henderson, L. 2007, “Invasive, naturalized and casual alien plants in southern Africa: a summary based on the Southern African Plant Invaders Atlas (SAPIA)”, Bothalia, vol. 37, no. 2, pp. 215.
Hendricks, H.H., Clark, B., Bond, W.J., Midgley, J.J., Novellie, P.A., 2005. Movement response patterns of livestock to rainfall variability in the Richtersveld National Park. African Journal of Range and Forage Science 22, 117-125.
Hoare, DB, L Mucina, MC Rutherford, JHJ Vlok, DIW Euston-Brown, AR Palmer, LW Powrie, RG Lechmere-Oertel, SM Proches, AP Dold and RA Ward 2006 Albany Thicket Biome. In: L Mucina and MC Rutherford (eds) The vegetation of South Africa, Lesotho and Swaziland. Strelitzia 19: 540-566.
Hoffman, M. & Cowling, R. 1987, “Plant physiognomy, phenology and demography” in The Karoo biome: a preliminary synthesis. Part 2, Vegetation and history, eds. R.M. Cowling & P.W. Roux, South African National Scientific Programme Report 142, CSIR, Pretoria, pp. 1-34.
Hoffman, M. & Rohde, R. 2007, “From pastoralism to tourism: the historical impact of changing land use practices in Namaqualand”, Journal of Arid Environments, vol. 70, no. 4, pp. 641-658.
Hoffman, M., Allsopp, N. & Rohde, R. 2007, “Sustainable land use in Namaqualand, South Africa: key issues in an interdisciplinary debate”, Journal of Arid Environments, vol. 70, no. 4, pp. 561-569.
Hoffman, M., Carrick, P., Gillson, L. & West, A. 2009, “Drought, climate change and vegetation response in the succulent karoo, South Africa”, South African Journal of Science, vol. 105, no. 1-2, pp. 54-60.
Hoffman, M., Carrick, P., Gillson, L. & West, A. 2009, “Drought, climate change and vegetation response in the succulent karoo, South Africa”, South African Journal of Science, vol. 105, no. 1-2, pp. 54-60.
Hoffman, M.T. 2014, “Changing Patterns of Rural Land Use and Land Cover in South Africa and their Implications for Land Reform”, Journal of Southern African Studies, vol. 40, no. 4, pp. 707-725.
Hoffman, M.T., Cousins, C., Meyer, T., Petersen, A. & Hendriks, H. 1999, “Historical and contemporary agricultural land use and the desertification of the Karoo” in The Karoo: ecological patterns and processes, eds. W.R.J. Dean & S. Milton, Cambridge University Press, Cambridge.
Hoffman, T. & Ashwell, A. 2001, Nature divided: land degradation in South Africa. University of Cape Town Press.
Hoffman, T., Todd, S. & Duncan, J. 2005, Environmental change in Riemvasmaak 10 years after re-settlement, Unpublished report prepared for FARM-Africa, Leslie Hill Institute for Plant Conservation, University of Cape Town, Cape Town. 88pp.
Hongslo E, Rohde R and Hoffman T 2009. Landscape change and ecological processes in relation to land-use in Namaqualand, South Africa, 1939-2005. South African Geographical Journal, vol. 91, no.2, pp. 63-74.
Huntley BJ and Walker BH, (eds). 1982. Ecology of Tropical Savannas. New York: Springer-Verlag.
Huntley, B., Barnard, P., Altwegg, R., Chambers, L., Coetzee, B.W., Gibson, L., Hockey, P.A., Hole, D.G., Midgley, G.F. & Underhill,
DEPARTMENT OF ENVIRONMENTAL AFFAIRS 55
L.G. 2010, “Beyond bioclimatic envelopes: dynamic species’ range and abundance modelling in the context of climatic change”, Ecography, vol. 33, no. 3, pp. 621-626.
Huntley, B.J. 1984. Characteristics of South African biomes. In Booysen, P. de V and Tainton, N.M. (eds) Ecological effects of fire in South African ecosystems. Pp 1-17. Springer, Berlin.
Jeltsch F, Milton SJ, Dean WRJ and N van Rooyen, Noel. 1997. Simulated pattern formation around artificial waterholes in the semi-arid Kalahari. Journal of Vegetation Science 8: 177-188.
Jürgens N., Gotzmann I.H. and Cowling R.M. (1999). Remarkable medium-term dynamics of leaf succulent Mesembryanthemaceae shrubs in the winter-rainfall desert of northwestern Namaqualand, South Africa. Plant Ecol. 142, 87–96.
Keeley JE, Bond WJ, Bradstock RA, Pausas JG, Rundel PW (2012) Fire in Mediterranean climate ecosystems: ecology, evolution and management. Cambridge University Press, Cambridge
Kgope, B.S., Bond, W.J. & Midgley, G.F. 2010, “Growth responses of African savanna trees implicate atmospheric [CO2] as a driver of past and current changes in savanna tree cover”, Austral Ecology, vol. 35, no. 4, pp. 451-463.
Klak, C., Reeves, G. & Hedderson, T. 2004, “Unmatched tempo of evolution in Southern African semi-desert ice plants”, Nature, vol. 427, no. 6969, pp. 63-65.
Kotzé, I., Beukes, H., Van den Berg, E. & Newby, T. 2010, “National invasive alien plant survey”, Agricultural Research Council, Institute for Soil, Climate and Water, Report No.GW/A/2010/21, .
Latimer, A.M., Silander, J.A., Gelfand, A.E., Rebelo, A.G., Richardson, D.M. 2004. A method for quantifying the magnitude of threat to plant biodiversity from alien plant invasions and other anthropogenic factors a case study in the Cape Floristic Region, South Africa. South African Journal of Science100, 81–86.
Le Maitre, D.C, Forsyth, G.G, Dzikiti, S and Gush, MB 2013. Estimates of the impacts of invasive alien plants on water flows in South Africa. Report No. CSIR/NRE/ECO/ER/2013/0067/B, Natural Resources and the Environment, CSIR, Stellenbosch.
Le Maitre, D.C. & Midgley, JJ 1992. Plant reproductive ecology. In: Ecology of fynbos: diversity, scarcity and fire (ed. RM Cowling), pp 133-174. Oxford University Press, Cape Town.
Le Maitre, D.C., O‘Farrell, P., Milton, S.J., Atkinson, D., Lange, W.D., Egoh, B., Reyers. B., Colvin, C., Maherry, A., Blignaut, J.N., 2009. Assessment and evaluation of ecosystem services in the Succulent Karoo Biome. Report prepared for the Succulent Karoo Ecosystem Programme (SKEP) Coordination Unit, Report number CSIR/NRE/ECO/ER/2009/0043/B. Natural Resources and the Environment, CSIR, Stellenbosch.
Le Maitre, DC, Forsyth, GG, Dzikiti, S and Gush, MB 2013b. Estimates of the impacts of invasive alien plants on water flows in South Africa. Report No. CSIR/NRE/ECO/ER/2013/0067/B, Natural Resources and the Environment, CSIR, Stellenbosch.
Le Maitre, DC, Kotzee, I, and O’Farrell, PJ 2014. Impacts of land-cover change on the water flow regulation ecosystem service: Invasive alien plants, fire and their policy implications. Land Use Policy 36, 171–181.
Le Maitre, DC, Kruger, FJ and Forsyth, GG 2013a. Interfacing ecology and policy: Developing an ecological framework and evi-dence base to support wildfire management in South Africa. Austral Ecology, article first published online: 23 OCT 2013 | DOI: 10.1111/aec.12100.
Le Maitre, DC, van Wilgen, BW, Chapman, RA & McKelly, DH 1996. Invasive plants in the Western Cape, South Africa: modelling the consequences of a lack of management. Journal of Applied Ecology 33: 161-172.
Le Roux, A. & van Huyssteen, E. 2010. The South African socio-economic and settlement landscape. Chapter 4 in Archer, E, Engelbrecht, F, Landman, W et al. 2010. South African Risk and Vulnerability Atlas, pp 62.
Lehmann CER, Archibald S, Hoffmann W, Bond WJ. 2011. Deciphering the distribution of the savanna biome. New Phytologist 191: 197–209.
Lim, B. and E. Spanger-Siegfried (eds). 2004. Adaptation Policy Frameworks for Climate Change: Developing Strategies, Policies and Measures. New York: United Nations Development Programme.
Linder, HP 2003. The radiation of the Cape flora, southern Africa. Biological Review 78, 597–638.Cowling, RM, Holmes, PM and Rebelo, AG 1992. Plant diversity and endemism. In The Ecology of Fynbos: Nutrients, Fire and Diversity (ed. R. M. Cowling), pp. 62–112. Oxford University Press, Cape Town.
Low, B. & Rebelo, A. 1996, Vegetation of Southern Africa, Lesotho and Swaziland: A Companion to the Vegetation Map of South Africa, Lesotho and Swaziland, Department of Environmental Affairs and Tourism, Pretoria.
MacKellar, N., Hewitson, B. & Tadross, M. 2007, “Namaqualand’s climate: Recent historical changes and future scenarios”, Journal of Arid Environments, vol. 70, no. 4, pp. 604-614.
Matsika, R., Erasmus, B.F.N. & Twine, W. (2013) A tale of two villages: Assessing the dynamics of fuelwood supply in communal landscapes within the Kruger to Canyons Biosphere, South Africa. Environmental Conservation 40:71-83
McConnachie, AJ, Strathie, LW, Mersie, W, Gebrewihot, L, Zewdie, K, Abdurehim, A, Abrha, B, Araya, T, Asaregew, F, Assefa, F, Gebrere-Tsadik, R, Nigatu, L., Tadesse, B and Tana, T. 2011. Current and potential geographical distribution of the invasive plant Parthenium hysterophorus (Asteraceae) in eastern and southern Africa. Weed Research 51, 71–84.
McFadyen, RC and Skarratt, B. 1996. Potential distribution of Chromolaena odorata (Siam weed) in Australia, Africa and Oceania.
Climate Change Adaptation Plans for South African Biomes56
Agriculture, Ecosystems and Environment 59, 89-96.
McKenzie, B. 1988. Guidelines for the sustained use of forest and forest products. FRD, Pretoria, South Africa.
MDB (Municipal Demarcation Board), 1999 – references for maps. The determination of metropolitan and district council bound-aries. Pretoria.
Midgley G.F. and Van Der Heyden F. (1999). Form and function in perennial plants. In The Karoo: Ecological Patterns and Processes, eds. W.R.J. Dean and S.J. Milton, pp. 91–106. Cambridge University Press, Cambridge.
Midgley J. J., Cowling R. M., Seydack A. & vanWyk G. F. 1997. Forests. In: Vegetation of Southern Africa (eds R. M. Cowling, D. M. Richardson & S. M. Pierce) pp. 278–99. Cambridge University Press, Cambridge, UK.
Midgley, G. & Thuiller, W. 2007, “Potential vulnerability of Namaqualand plant diversity to anthropogenic climate change”, Journal of Arid Environments, vol. 70, no. 4, pp. 615-628.
Midgley, G. F., L. Hannah, D. Millar, M. C. Rutherford, and L. W. Powrie. 2002. Assessing the vulnerability of species richness to anthropogenic climate change in a biodiversity hotspot. Global Ecology and Biogeography 11:445-451.
Midgley, G. F., L. Hannah, D. Millar, W. Thuiller, and A. Booth. 2003. Developing regional and species-level assessments of climate change impacts on biodiversity in the Cape Floristic Region. Biological Conservation 112:87-97.
Midgley, G. F., R. A. Chapman, B. Hewitson, P. Johnston, M. De Wit, G. Ziervogel, P. Mukheibir, L. Van Niekerk, M. Tadross, B. W. Van Wilgen, B. Kgope, P. D. Morant, A. Theron, R. J. Scholes, and G. G. Forsyth. 2005. A status quo, vulnerability and adapta-tion assessment of the physical and socio-economic effects of climate change in the western Cape. Report to the Western Cape Government, Cape Town, South Africa. CSIR Report No., CSIR Environmentek, Stellenbosch. South Africa.
Midgley, G., Hannah, L., Millar, D., Rutherford, M. & Powrie, L. 2002, “Assessing the vulnerability of species richness to anthropo-genic climate change in a biodiversity hotspot”, Global Ecology and Biogeography, vol. 11, no. 6, pp. 445-451.
Midgley, G., Hannah, L., Millar, D., Thuiller, W. & Booth, A. 2003, “Developing regional and species-level assessments of climate change impacts on biodiversity in the Cape Floristic Region”, Biological Conservation, vol. 112, no. 1, pp. 87-97.
Midgley, G., Marais, S., Barnett, M., & Wågsæther, K. 2012. Biodiversity, climate change and sustainable development–har-nessing synergies and celebrating successes. Final technical report (available at: http://cap.org.za/oid%5Cdownloads%5CBi-odiversity%20Climate%20Change%20and%20Sustainable%20Development%20Final%20Technical%20Report%20April%202012_final.pdf).
Midgley, GF, Hughes, GO, Thuiller, W and Rebelo, AG 2006. Migration rate limitations on climate change-induced range shifts in Cape Proteaceae. Diversity and Distributions 12, 555–562.
Midgley, J. J., M. C. Cameron, and W. J. Bond. 1995. Gap characteristics and replacement patterns in the Knysna Forest, South Africa. J.Veg.Sci. 6:29-36.
Mills, A. J., R. M. Cowling, M. V. Fey, G. I. H. Kerley, J. S. Donaldson, R. G. Lechmere-Oertel, A. M. Sigwela, A. L. Skowno and P. Rundel 2005 Effects of goat pastoralism on ecosystem carbon storage in semiarid thicket, Eastern Cape, South Africa Austral Ecology 30, 797–804.
Mills, A.J. & R.M. Cowling. 2010. Below-ground carbon stocks in intact and transformed subtropical thicket landscapes in semi-ar-id South Africa. Journal of Arid Environments 74 (1): 93- 100.
Milton S.J., Dean W.R.J., Marincowitz C.P. and Kerley G.I.H. (1995). Effects of the 1990/91 drought on rangeland in the Steytlerville Karoo. S. Afr. J. Sci. 91, 78–84.
Milton, S. & Hoffman, M. 1994, “The application of state‐and‐transition models to rangeland research and management in arid succulent and semi‐arid grassy Karoo, South Africa”, African Journal of Range & Forage Science, vol. 11, no. 1, pp. 18-26.
Milton, S., Yeaton, R., Dean, W., Vlok, J. & Cowling, R. 1997, “Succulent karoo”, Vegetation of southern Africa, vol. 649.
Milton, SJ. 2004. Grasses as invasive alien plants in South Africa. South African Journal of Science 100, 69-75.
Moll, EJ and White, F 1978. The Indian Ocean Coastal Belt. In: Werger, MJ (ed.) Biogeography and Ecology of Southern Africa, pp 561-598. Junk, The Hague.
Mucina, L, Geldenhuys, CJ, Rutherford, MC, Powrie, LW, Lotter, MC, von Maltitz, GP, Euston-Brown, DIW, Matthews, WS, Dodson, L and McKenzie, B (2006)b. Afrotemperate, Subtropical and Azonal Forests. In Mucina, L and Rutherford, MC (Eds) The vegetation of South Africa, Lesotho and Swaziland. Strelitzia 19. SANBI. Pretoria.
Mucina, L, Scott-Shaw, R, Rutherford, MC, Camp, Mattews, WS, Powrie, LW and Hoare, DB 2006. Indian Ocean Coastal Belt. In: Mucina, L and Rutherford, MC (Eds) The vegetation of South Africa, Lesotho and Swaziland, pp 568-583. Strelitzia 19, SANBI, Pretoria
Mucina, L. and Rutherford, M.C. (ed). 2006. The Vegetation of South Africa, Lesotho and Swaziland. Strelitzia 19. South African National Biodiversity Institute, Pretoria, South Africa. (808 pp with CD GIS-database)
Musil, C., Van Heerden, P., Cilliers, C. & Schmiedel, U. 2009, “Mild experimental climate warming induces metabolic impairment and massive mortalities in southern African quartz field succulents”, Environmental and experimental botany, vol. 66, no. 1, pp. 79-87.
DEPARTMENT OF ENVIRONMENTAL AFFAIRS 57
Myers, N., Mittermeier, R.A., Mittermeier, C.G., Da Fonseca, G.A.B. & Kent, J. (2000) Biodiversity hotspots for conservation pri-orities. Nature, 403, 853–858.
Myers, N., Mittermeier, R.A., Mittermeier, C.G., da Fonseca, G.A. & Kent, J. 2000, “Biodiversity hotspots for conservation priori-ties”, Nature, vol. 403, no. 6772, pp. 853-858.
Nel, E. & Hill, T. 2008, “Marginalisation and demographic change in the semi-arid Karoo, South Africa”, Journal of Arid Environments, vol. 72, no. 12, pp. 2264-2274.
Nelson, E., Polasky, S., Lewis, D.J., Plantinga, A.J., Lonsdorf, E., White, D., Bael, D. & Lawler, J.J. 2008. Efficiency of incentives to jointly increase carbon sequestration and species conservation on a landscape. Proceedings of the National Academy of Sciences of the United States of America, 105, 9471-6.
Ninan, KN and Inoue, M. 2013. Valuing forest ecosystem services: What we know and what we don’t. Ecological Economics 93: 137-149.
O’Connor TC and GJ Bredenkamp 1997 Grasslands. In vegetation of southern Africa. Cowling, RM, DM Richardson and SM Pierce (eds) pp 215-257. Cambridge University Press
Oettlé, N. 2012. Adaptation with a human face, summary and lessons learnt. Environmental Monitoring Group Newsletter.
Pachauri, R. & Reisinger, A. 2007, “Synthesis Report. Contribution of Working Groups I, II and III to the Fourth Assessment Report of the Intergovernmental Panel on Climate Change” in Climate Change 2007, ed. S. Solomon, Cambridge University Press, Cambridge, UK.
Palmer, A.R., and M.T. Hoffman. 1997. Nama Karoo. Pages 167-186 in R.M. Cowling. D.M. Richardson, and S.M. Pierce, editors. Vegetation of Southern Africa. Cambridge University Press, Cambridge.
Pearson, R.G. & Dawson, T.P. 2003, “Predicting the impacts of climate change on the distribution of species: are bioclimate enve-lope models useful?”, Global Ecology and Biogeography, vol. 12, no. 5, pp. 361-371.
Pietersen, K. and R. Parsons. (Editors) 2002. A synthesis of the hydrogeology of the Table Mountain Group - formation of a re-search strategy. Report no. TT 158/01, Water Research Commission, Pretoria.
Pietersen, K.P & Parsons, R.P. 2011, A synthesis of the hydrogeology of the Table Mountain Group ñ formation of a research strategy; TT 158/01, Water Research Commission, Pretoria
Rebelo, A.G., Boucher, C., Helme, N., Mucina, L., Rutherford, M.C., 2006. Fynbos Biome. In: Mucina, L., Rutherford, M. (Eds.), The Vegetation of South Africa, Lesotho and Swaziland. Strelitzia 19. South African National Biodiversity Institute, Pretoria.
Reyers, B., O’Farrell, P.J., Cowling, R.M., Egoh, B.N., Le Maitre, D.C. & Vlok, J.H. 2009, “Ecosystem services, land-cover change, and stakeholders: finding a sustainable foothold for a semiarid biodiversity hotspot”.
Reynolds, J.F., Smith, D.M.S., Lambin, E.F., Turner, B., Mortimore, M., Batterbury, S.P., Downing, T.E., Dowlatabadi, H., Fernández, R.J. & Herrick, J.E. 2007, “Global desertification: building a science for dryland development”, Science, vol. 316, no. 5826, pp. 847-851.
Richardson FD, Hahn BD and Hoffman M.T. 2007. Modelling the productivity and sustainability of pastoral systems in the commu-nal areas of Namaqualand. Journal of Arid Environments 70: 701-717.
Richardson, D., Macdonald, I. & Forsyth, G. 1989, “Reductions in plant species richness under stands of alien trees and shrubs in the fynbos biome”, South African Forestry Journal, vol. 149, no. 1, pp. 1-8.
Richardson, D.M. & Van Wilgen, B.W. 2004, “Invasive alien plants in South Africa: how well do we understand the ecological im-pacts?: working for water”, South African Journal of Science, vol. 100, no. 1 & 2, pp. p. 45-52.
Richardson, D.M., Van Wilgen, B.W., Higgins, S.I., Trinder-Smith, T.H., Cowling, R.M., & McKelly, D.H. 1996. Current and future threats to plant biodiversity on the Cape Peninsula, South Africa. Biodiversity & Conservation 5: 607-647.
Rouget, M., R. M. Cowling, A. T. Lombaard, A. T. Knight and G.I.H. Kerley 2006. Designing large-scale conservation corridors for pattern and process. Conservation Biology 20:549-561.
Rouget, M., Richardson, D.M., Cowling, R.M., Lloyd, J.W. & Lombard, A.T., 2003. Current patterns of habitat transformation and future threats to biodiversity in terrestrial ecosystems of the Cape Floristic Region, South Africa. Biological Conservation, 112 (1-2) pp. 63 – 85
Rouget, M., Richardson, D.M., Nel, J.L., Le Maitre, D.C., Egoh, B. & Mgidi, T. 2004, “Mapping the potential ranges of major plant invaders in South Africa, Lesotho and Swaziland using climatic suitability”, Diversity and Distributions, vol. 10, no. 5‐6, pp. 475-484.
Rutherford M C and R H Westfall. 1986. Biomes of Southern Africa - an Objective Categorisation. Memoirs of the Botanical Survey of South Africa. Botanical Research Institute, Department of Agricultural and Water Supply. Pretoria. 54:1-98.
Rutherford, M. & Powrie, L. 2010, “Severely degraded rangeland: implications for plant diversity from a case study in Succulent Karoo, South Africa”, Journal of Arid Environments, vol. 74, no. 6, pp. 692-701.
Rutherford, M. C., and R. H. Westfall. 1994. Biomes of Southern Africa: an objective categorization. Memoirs of the Botanical Survey of South Africa 63: 1-94.
Climate Change Adaptation Plans for South African Biomes58
Rutherford, M., Midgley, G., Bond, W., Powrie, L., Roberts, R. & Allsopp, J. 1999, “Plant biodiversity: vulnerability and adaptation assessment”, South African country study on climate change.National Botanical Institute, Cape Town, South Africa, .
SANBI. 2013. Grasslands Ecosystem Guidelines: landscape interpretation for planners and managers. Compiled by Cadman, M., de Villiers, C., Lechmere-Oertel, R. and D. McCulloch. South African National Biodiversity Institute, Pretoria. 139 pages.
Sankaran, M., Hanan, N. P., Scholes, R. J., Ratnam, J., Augustine, D. J., Cade, B. S., Gignoux, J., Higgins, S. I., Le Roux, X., Ludwig, F., Ardo, J., Banyikwa, F., Bronn, A., Bucini, G., Caylor, K. K., Coughenour, M. B., Diouf, A., Ekaya, W., Feral, C. J., February, E. C., Frost, P. G. H., Hiernaux, P., Hrabar, H., Metzger, K. L., Prins, H. H. T., Ringrose, S., Sea, W., Tews, J., Worden, J. & Zambatis, N. (2005) Determinants of woody cover in African savannas. Nature, 438, 846-849.
Schachtschneider, K. and Reinecke, K. 2014. Riparian trees as common denominators across the river flow spectrum: are eco-physiological methods useful tools in environmental flow assessments? Water SA 40: 287-296.
Schmiedel, U. & Jürgens, N. 1999. “Community structure on unusual habitat islands: quartz-fields in the Succulent Karoo, South Africa”, Plant Ecology, vol. 142, no. 1-2, pp. 57-69.
Schmiedel, U. & Mucina, L. 2006. “Vegetation of quartz fields in the Little Karoo, Tanqua Karoo and eastern Overberg (Western Cape Province, South Africa)”, Phytocoenologia, vol. 36, no. 1, pp. 1-44.
Scholes RJ, Archer SR. 1997. Tree-grass interactions in savannas. Annual Review of Ecology and Systematics 28: 517–544.
Scholes RJ. 1990. The influence of soil fertility on the ecology of African savannas. J. Biogeog. 17:417–19.
Schurr, FM, Midgley, GF, Rebelo, AG, Reeves, G, Poschlod, P and Higgins, SI. 2007. Colonization and persistence ability explain the extent to which plant species fill their potential range. Global Ecology and Biogeography 16, 449–459.
Scott-Shaw, R., & Morris, C. D. 2014. Grazing depletes forb species diversity in the mesic grasslands of KwaZulu-Natal, South Africa. African Journal of Range & Forage Science, 1–11.
Settele, J., R. Scholes, R. Betts, S. Bunn, P. Leadley, D. Nepstad, J.T. Overpeck, and M.A. Taboada, 2014: Terrestrial and in-land water systems. In: Climate Change 2014: Impacts, Adaptation, and Vulnerability. Part A: Global and Sectoral Aspects. Contribution of Working Group II to the Fifth Assessment Report of the Intergovernmental Panel on Climate Change [Field, C.B., V.R. Barros, D.J. Dokken, K.J. Mach, M.D. Mastrandrea, T.E. Bilir, M. Chatterjee, K.L. Ebi, Y.O. Estrada, R.C. Genova, B. Girma, E.S. Kissel, A.N. Levy, S. MacCracken, P.R. Mastrandrea, and L.L. White (eds.)]. Cambridge University Press, Cambridge, United Kingdom and New York, NY, USA.
Seydack, AHW. 1995. An unconventional approach to timber yield regulation for multi-aged, multispecies forests. I. Fundamental considerations. Forest Ecology and Management. 77(11-3) 139-153.
Shackleton, C.M., Cawe, S.G., and Geldenhys, C.J. 1999. Review of the definitions and classifications of South African indige-nous forests and woodlands. ENV-P-C 99007, CSIR, Pretoria.
Shiponeni, N. 2007. Spatio-temporal distribution of grass and shrubs at the ecotone between an arid grassland and succulent shrubland: ecological interactions and the influence of soils. Unpublished PhD thesis, University of Cape Town, Cape Town.
Simmons, R., Barnard, P., Dean, W.R.J., Midgley, G.F., Thuiller, W., Hughes, G. 2005. Climate change and birds: perspectives and prospects from southern Africa Ostrich, 75(4), 95–308.
Solomon, S., Qin, D., Manning, M., Chen, Z., Marquis, M., Averyt, K., Tignor, M. & Miller, H. 2007, “Climate change 2007: the Physical Science Basis. Contribution of Working Group I to the Fourth Assessment Report of the Intergovernmental Panel on Climate Change. Summary for Policymakers.”, Climate change 2007: the Physical Science Basis. Contribution of Working Group I to the Fourth Assessment Report of the Intergovernmental Panel on Climate Change. Summary for Policymakers.
SREX, I. 2012, Managing the risks of extreme events and disasters to advance climate change adaptation. Intergovernmental Panel on Climate Change, Special report, Cambridge University Press, Cambridge, UK/New York.
Statistics South Africa, 2007. A National Poverty Line for South Africa. Discussion Paper. Statistics South Africa, National Treasury, Pretoria. http://www.treasury.gov.za/publications/other/povertyline/TreasuryStatsSApovertylinediscussionpaper.pdf.
Staver AC, Archiblad S, Levin S. 2011. The Global Extent and Determinants of Savanna and Forest as Alternative Biome States. Science 334: 230-232.
Stocker, T., Qin, D. & Platner, G. 2013. Climate Change 2013: The Physical Science Basis. Working Group I Contribution to the Fifth Assessment Report of the Intergovernmental Panel on Climate Change. Summary for Policymakers, Cambridge University Press, Cambridge, UK.
Tadross, M., Davis, C., Engelbrecht, F., Joubert, A. & Archer van Garderen, E. 2011, “Regional scenarios of future climate change over southern Africa” in Climate Risk and Vulnerability: a handbook for Southern Africa, ed. C. Davis, CSIR, Pretoria, South Africa, pp. 28.
Taylor, R, Kelbe, B, Haldorsen, S, Botha, GA, Weijden, B, Varet, L and Simonsen, MB. 2006. Groundwater-dependent ecology of the shoreline of the subtropical Lake St Lucia estuary. Environmental Geology 49, 586-600.
Thomas, RJ, Marshall, CGA, Du Plessis, A, Fitch, FJ, Miller, JA, Von Brunn, V and Watkeys, MK 1992. Geological studies in southern Natal and Transkei: implications for the Cape Orogeny. In: de Wit, MJ and Ransome, IGD (eds). Inversion tectonics of the Cape Fold Belt, Karoo and Cretaceous basins of southern Africa, pp 229-236. A.A. Balkema, Rotterdam.
Thompson, M., Vlok, J., Rouget, M., Hoffman, M., Balmford, A. & Cowling, R. 2009, “Mapping grazing-induced degradation in a
DEPARTMENT OF ENVIRONMENTAL AFFAIRS 59
semi-arid environment: a rapid and cost effective approach for assessment and monitoring”, Environmental management, vol. 43, no. 4, pp. 585-596.
Timberlake and Shaw, 1994. Chirinda forest: a visitors guide. Forest commission, Harare.
Todd, S.W. & Hoffman, M.T. 2009, “A fence line in time demonstrates grazing-induced vegetation shifts and dynamics in the sem-iarid Succulent Karoo”, Ecological Applications, vol. 19, no. 7, pp. 1897-1908.
Turpie, J.K., Heydenrych, B.J. & Lamberth, S.J. (2003) Economic value of terrestrial and marine biodiversity in the Cape Floristic Region: implications for defining effective and socially optimal conservation strategies. Biological Conservation, 112, 233–251.
Van Coller, AL, Rogers, KH and Heritage, GL 2000. Riparian vegetation-environment relationships: complimentarity of gradients versus patch hierarchy approaches. Journal of Vegetation Science 11: 337–350.
Van Jaarsveld, A.S. & Chown, S.L. 2001, “Climate change and its impacts in South Africa”, Trends in Ecology & Evolution, vol. 16, no. 1, pp. 13-14.
Van Wilgen B.W., Reyers B., Le Maitre D.C., Richardson D.M. and Schonegevel L. (2008). A biome-scale assessment of the im-pact of invasive alien plants on ecosystem services in South Africa. J. Environ. Man. 89, 336–349.
Van Wilgen, B. & Richardson, D. 1985, “The effects of alien shrub invasions on vegetation structure and fire behaviour in South African fynbos shrublands: a simulation study”, Journal of Applied Ecology, , pp. 955-966.
Van Wilgen, B. W., A. Khan, and C. Marais. 2010. Changing Perspectives on Managing Biological Invasions: Insights from South Africa and the Working for Water programme. Pages 377-393 Fifty Years of Invasion Ecology. Wiley-Blackwell.
van Wilgen, B.W., Forsyth, G.G. & Le Maitre, D.C. 2008, “The prioritization of species and primary catchments for the purposes of guiding invasive alien plant control operations in the terrestrial biomes of South Africa”, Unpublished report. CSIR Natural Resources and the Environment, Stellenbosch.
Van Wilgen, B.W., Forsyth, G.G., De Klerk, H., Das, S., Khuluse, S. & Schmitz, P. (2010) Fire management in Mediterranean-climate shrublands: a case study from the Cape fynbos, South Africa. Journal of Applied Ecology, 47, 631–638.
Van Wilgen, B.W., Richardson, D.M. & Seydack, A.H.W. (1994) Managing fynbos for biodiversity: constraints and options in a fire-prone environment. South African Journal of Science, 90, 322–329.
Van Wyk, AE 1990. The sandstone regions of Natal and Pondoland: Remarkable centres of endemism. Palaeoecology of Africa and the Surrounding Islands 21: 243-257. A.A. Balkema, Rotterdam.
Van Wyk, AE, and Smith, G 2001. Regions of floristic endemism in southern Africa. Umdaus Press, Pretoria.
Vermeulen, W. 2001, “Forests in sustainable mountain development. A state of knowledge report for 2000”, The Southern African Forestry Journal, vol. 190, no. 1, pp. 119-120.
Verstraete, M.M., Scholes, R.J. & Smith, M.S. 2009, “Climate and desertification: looking at an old problem through new lenses”, Frontiers in Ecology and the Environment, vol. 7, no. 8, pp. 421-428.
Vetter, S. 2009, “Drought, change and resilience in South Africa’s arid and semi-arid rangelands”, South African Journal of Science, vol. 105, no. 1-2, pp. 29-33.
von Maltitz, G.P. 2005. Resource use and land tenure in the wild coast: Supporting the development of a biodiversity strategy and action plan for the wild coast. CSIR Report No. ENV-P-C 2005-004. CSIR. Pretoria.
Von Maltitz, G.P., R.J. Scholes, B. Erasmus and A. Letsoalo. 2006. Adapting conservation Strategies to Accommodate Impacts of Climate Change in Southern Africa. AIACC Working Paper No. 35
von Maltitz, G.P., R.J. Scholes, B. Erasmus, and A. Letsoalo. 2007. Adapting conservation strategies to accommodate climate change impacts in southern Africa. In: Climate Change and Adaptation, edited by Neil Leary, James Adejuwon, Vicente Barros, Ian Burton, Jyoti Kulkarni and Rodel Lasco. Earthscan, London, pp 28-52. ISBN 978-1-84407-470-9
Von Maltitz, G.P., van Wyk, G.F. & Everard, D.A. 1996. Successional pathways in disturbed coastal dune forest on the coastal dunes in north-east KwaZulu-Natal, South Africa. South African Journal of Botany 62: 188-195.
von Maltitz, GP. Mucina, L. Geldenhuys, C. Lawes, M. Ealey, H. Adie, H. Vink, D. Fleming, G and Bailey, C. 2003 . Classification system for the South African indigenous forests. An objective classification for the Department of Water Affairs and Forestry. Report ENV-P-2003-017. Environmentek. CSIR Pretoria.
Ward, JV, Malard, F and Tocker, K 2002. Landscape ecology: a framework for integrating pattern and process in river corridors. Landscape Ecology 17 (Suppl. 1): 35-45.
White, F. 1983. The vegetation map of Africa. UNESCO, Paris.
Wilson, A.M., A. M. Latimer, J. A. Silander Jr., A. E. Gelfand and H. de Klerk. 2010. A Hierarchical Bayesian model of wildfire in a Mediterranean biodiversity hotspot: Implications of weather variability and global circulation. Ecological Modelling 221:106-112.
Zachariades, C and Goodall, JM 2002. Distribution, impact and management of Chromolaena odorata in southern Africa. In: Zachariades, C, Muniappan, R and Strathie, LW (Eds), p 34-39. Proceedings of the Fifth International Workshop on Biological Control and Management of Chromolaena odorata, Durban, South Africa, ARC-PPRI, Pretoria.
Zaloumis, N.P. & Bond, W.J. 2011, “Grassland restoration after afforestation: No direction home?”, Austral Ecology, vol. 36, no. 4, pp. 357-366.
Climate Change Adaptation Plans for South African Biomes60
notes.......................................................................................................................................................................................................................................................................................................................................................................................................................................................................................................................................................................................................................................................................................................................................................................................................................................................................................................................................................................................................................................................................................................................................................................................................................................................................................................................................................................................................................................................................................................................................................................................................................................................................................................................................................................................................................................................................................................................................................................................................................................................................................................................................................................................................................................................................................................................................................................................................................................................................................................................................................................................................................................................................................................................................................................................................................................................................................................................................................................................................................................................................................................................................................................................................................................................................................................................................................................................................................................................................................................................................................................................................................................................................................................................................................................................................................................................................................................................................................................................................................................................................................................................................................................................................................................................................................................................................................................................................................................................................................................................................................................................................................................................................................................................................................................................................................................................................................................................................................................................................................................................................................................................................................................................................................................................................................................................................................................................................................................................................................................................................................................................................................................................................................................................................................................................................................................................................................................................................................................................................................................................................................................................................................................................................................................................................................................................................................................................................................................................................................................................................................................................................................................................................................................................................................................................................................................................................................................................................................................................................................................................................................................................................................................................................................................................................................................................................................................................................................................................................................

notes.......................................................................................................................................................................................................................................................................................................................................................................................................................................................................................................................................................................................................................................................................................................................................................................................................................................................................................................................................................................................................................................................................................................................................................................................................................................................................................................................................................................................................................................................................................................................................................................................................................................................................................................................................................................................................................................................................................................................................................................................................................................................................................................................................................................................................................................................................................................................................................................................................................................................................................................................................................................................................................................................................................................................................................................................................................................................................................................................................................................................................................................................................................................................................................................................................................................................................................................................................................................................................................................................................................................................................................................................................................................................................................................................................................................................................................................................................................................................................................................................................................................................................................................................................................................................................................................................................................................................................................................................................................................................................................................................................................................................................................................................................................................................................................................................................................................................................................................................................................................................................................................................................................................................................................................................................................................................................................................................................................................................................................................................................................................................................................................................................................................................................................................................................................................................................................................................................................................................................................................................................................................................................................................................................................................................................................................................................................................................................................................................................................................................................................................................................................................................................................................................................................................................................................................................................................................................................................................................................................................................................................................................................................................................................................................................................................................................................................................................................................................................................................................................................................

DEPARTMENT OF ENVIRONMENTAL AFFAIRS 63
environment house473 steve Biko roadArcadia pretoria0002
Call Centre: 086 111 2468
Website: www.environment.gov.za
To use this QR code conveniently you must have a smartphone equipped with a camera and a QR code reader/scanner application feature
Find us:Department-of-Environmental-A�airs
Follow us:@EnvironmentZA
Follow us:@EnvironmentZA
EnvironmentZA
Find us:Department-of-Environmental-A�airs
Follow us:@EnvironmentZA
Follow us:@EnvironmentZA
EnvironmentZA
Find us:Department-of-Environmental-A�airs
Follow us:@EnvironmentZA
Follow us:@EnvironmentZA
EnvironmentZA
Find us:Department-of-Environmental-A�airs
Follow us:@EnvironmentZA
Follow us:@EnvironmentZA
EnvironmentZA