Embed Size (px)
Citation preview

Climate and Transport: An Introduction
Eric ZusmanMRV Training ClassNovember 26, 2013

Outline
1. Sustainable Low Carbon Transport
2. Climate Finance and Transport
3. MRVing Transport NAMAs

1. Sustainable Low Carbon Transport

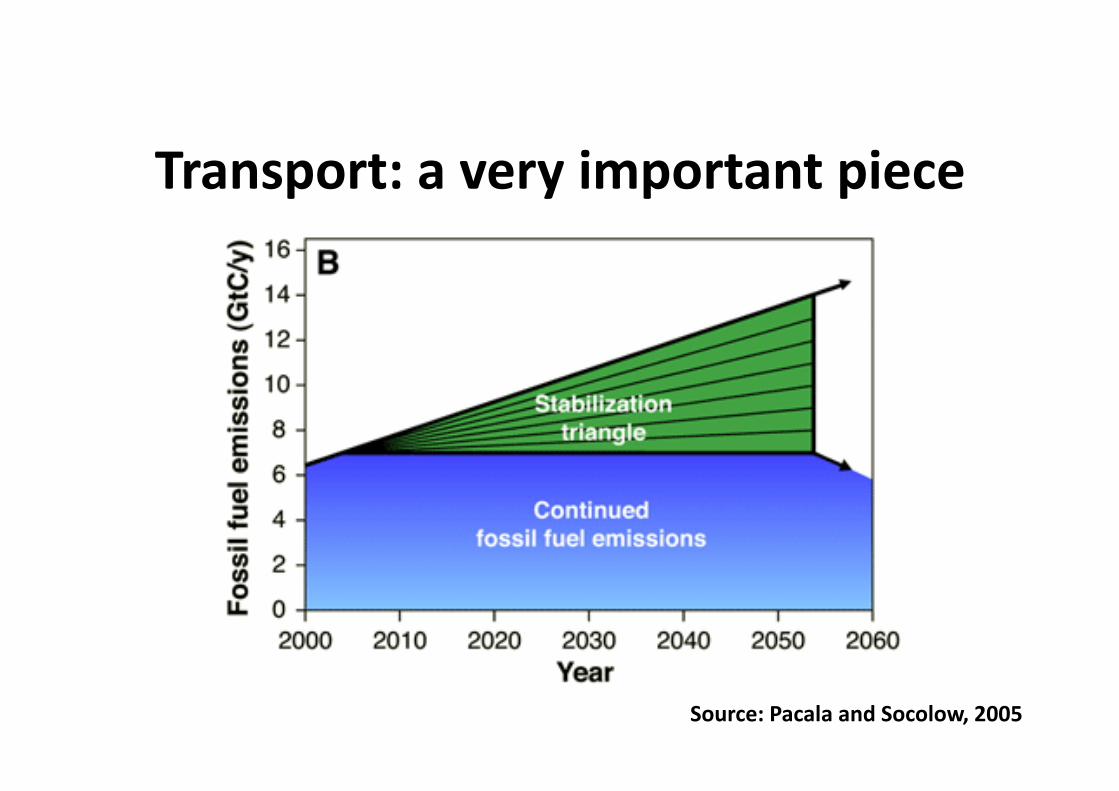
Transport: a very important piece
Source: Pacala and Socolow, 2005

A puzzle that has been difficult to solveChanges (%) in greenhouse gas emissions by source category in the EU, 1990‐2007
Source: European Environment Agency, 2011


Government solutions often promote motorization

Many drivers are behind this trend

Much of Asia is growing out—not up
Source: Perera and Permani, 2012

Energy subsidies help lock in these trends

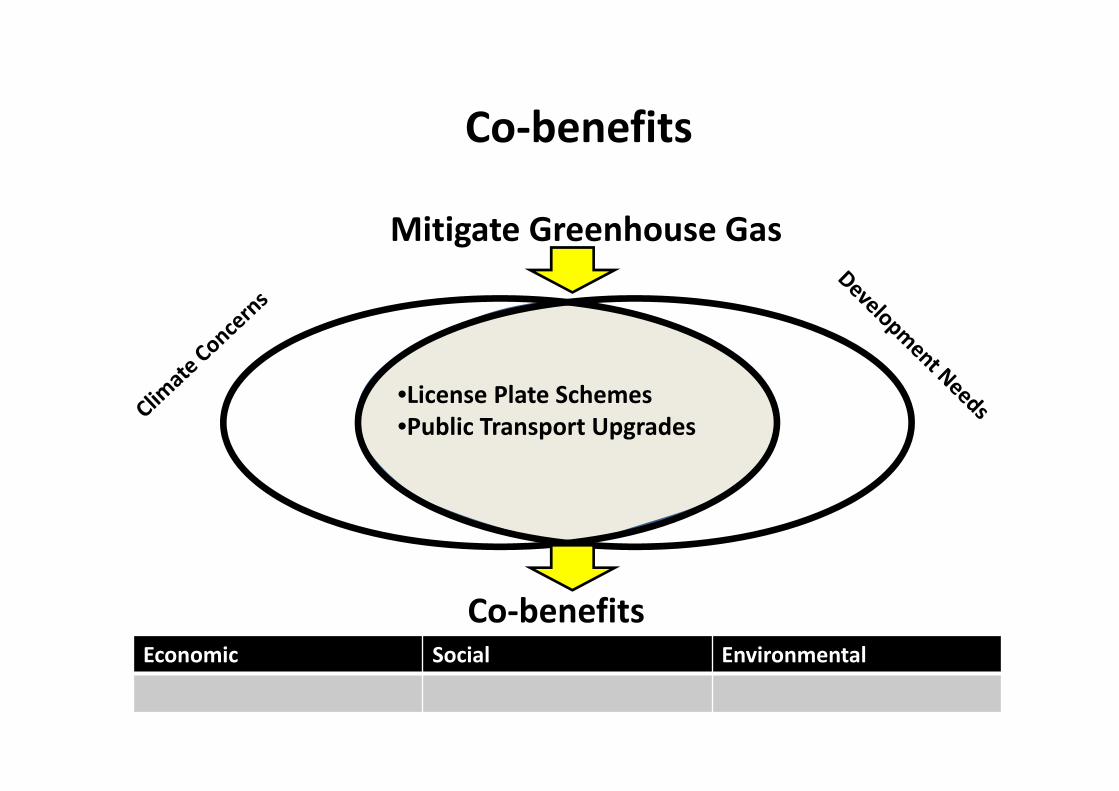
•License Plate Schemes•Public Transport Upgrades
Mitigate Greenhouse Gas
Co‐benefitsEconomic Social Environmental
Co‐benefits

•License Plate Schemes•Public Transport Upgrades
Mitigate Greenhouse GasEconomic Social Environmental
Co‐benefits

Four Options
• Do nothing: business as usual
• Invest in roads and infrastructure
• Control transport demand (road pricing, license plate schemes)
• Improve public transport (buses, metros, and subways)

1.A 2.S. 3.I

Improve

Improve
20
25
30
35
40
45
50
55
2002 2004 2006 2008 2010 2012 2014 2016 2018 2020 2022
MIL
ES P
ER G
ALL
ON
(All
coun
tries
con
verte
d to
CA
FE te
st UNITED STATES EUROPE
JAPAN AUSTRALIACANADA CHINACALIFORNIA S. KOREA
JAPAN
UNITED STATES
EUROPEAN UNION
CHINA AUSTRALIA
CANADA
S. KOREA
CALIFORNIA+ 16 STATES
Dotted line: Proposed or contestedSolid lines: Enacted
Source: Passenger Vehicle Greenhouse Gas and Fuel Economy Standards: A Global Update, International Council on Clean Transportation, 2007
Standardized Comparison of International Fuel Economy and GHG Standar

Toyama: the first compact city in Japan
Source: Visit Toyama (Toyama City)
Avoid

Sticky Rice Ball Planning
Source: Visit Toyama (Toyama City)
Hospital
Work
Leisure
Station
Home
ShoppingStation
Home
School
Stick:Public transport system Rice dumplings:Pedestrian areas around transport system


In Asia: Potential to Shift
Source: UITP

Key Messages• Transport will have a big impact on climate change
• But transport is first and foremost about development
• There is a reason sustainability comes before low carbon
• This is the same reason we need to turn over the approach to co‐benefits
• ASI nicely summarizes key elements of a sustainable low carbon transport strategy
• Many parts of Asia are in a good position to introduce these elements
• There is a potential to get support from the international climate regime

2. Climate Finance and Transport

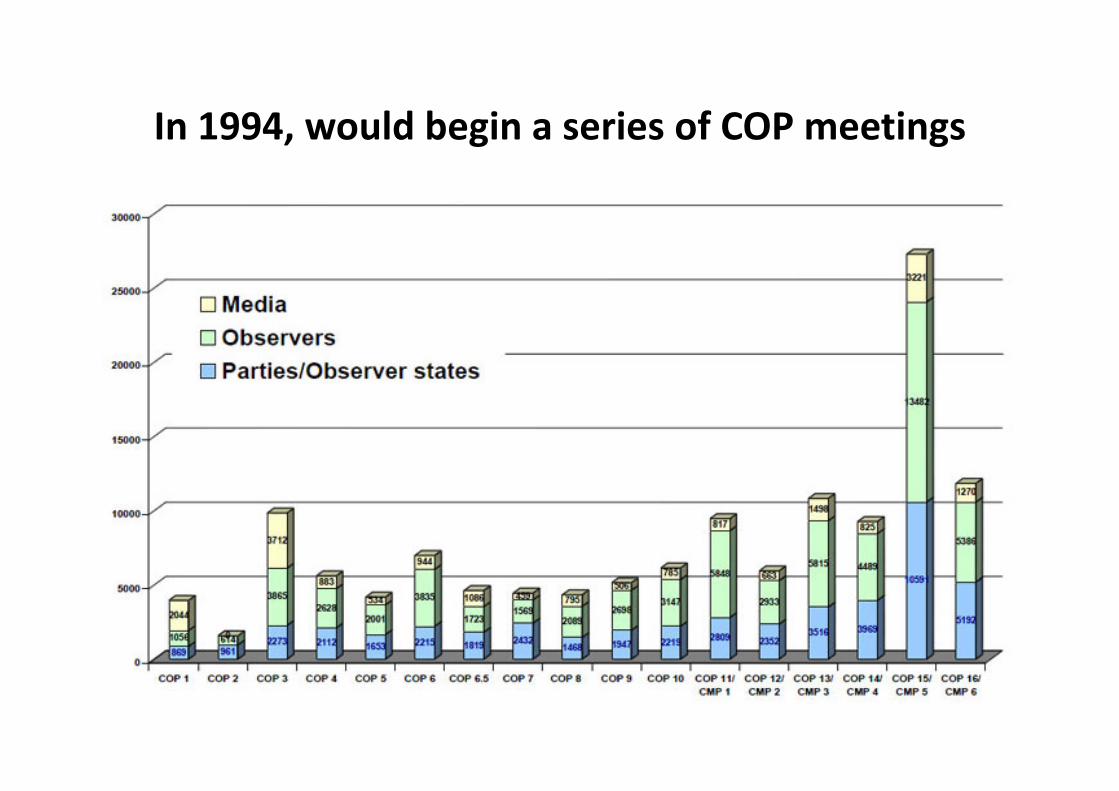
In 1994, would begin a series of COP meetings

What does a meeting in Warsaw have to do with
transportation in your city?

The Kyoto Protocol (1997)
• Commits Annex I parties to targets and timetables
• Average 5% off 1990 levels by 2008-2012
• Basket of six GHGs

The Kyoto Surprise (1997)

The CDM in Theory


CDM Barriers
• Low revenue relative to investment
• Investment often led by public sector
• Multiple small sources
• Transaction costs

Key messages
• The Kyoto protocol was developed out of the UNFCCC
• It employed a top down approach with targets and timetables for Annex 1 countries
• Though the CDM was more bottom‐up in orientation
• It did not fit well with the transport sector

3. MRVing Transport NAMAs


The Bali Action Plan
1(b)(ii): Nationally appropriate mitigation actions (NAMAs)
Finance
Technology
Capacity building
in a measurable, reportable and verifiable (MRV) manner

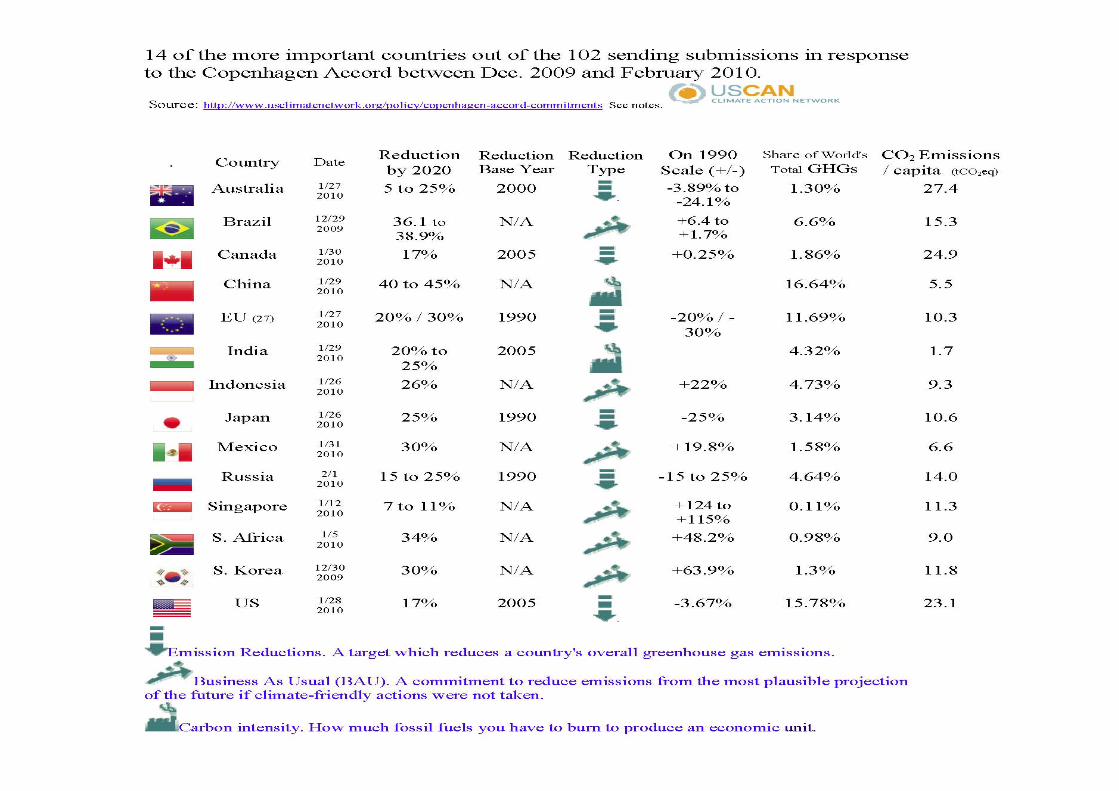
The Copenhagen Accord (2010‐)
Unilateral
Supported
Credited
Finance
Technology
Capacity building
NAMAs
MRV
2010‐2012
• Immediate financing
• 30 USD billion
2020
• Green Climate Fund
• 100 USD billion per year

How can transport get access to a greater share of climate finance.
• Voluntary pledge of 10 billion dollars between 2013‐2015
• Scaling up to $100 billion dollars by 2020.
2010‐2012 2013‐2015 2020
50
100
Billion dollars
Green Climate Fund

Example of a NAMA

Bila
tera
l
Climate Funds
$1.5b
$3.9b
UNFCCC
GCF $$$$$
GEF
GEF Trust FundGEF4(2006-2010) $$$GEF5(2011-2014) $$$$
LDCF $
SCCF $
AF $
UN REDD $UN-agencies
World Bank
CIFs
CTF(2009-2012) $$$$
SCF(2009-2012) $$$$
PPCR $$ FIP $$ SREP $
CarbonFinance Unit
FCPF $
PMR $
The EU
Kyoto Protocol
GCCA $
GEEREF $
CBFF $
Fund size<$500M $$500M-$1B $$$1B-$2B $$$$2B-$10B $$$$$10B- $100B $$$$$
AF: Adaptation FundCBFF: Congo Basin Forest FundCIFs: Climate Investment FundsCTF: Clean Technology FundFCPF: Forest Carbon Partnership FacilityFIP: Forest Investment ProgramGCCA: Global Climate Change AllianceGCF: Green Climate FundGEEREF: Global Energy Efficiency and Renewable Energy FundGEF: Global Environment FacilityLDCF: Least Developed Countries FundPMR: Partnership for Market ReadinessPPCR: Pilot Program on Climate ResilienceSCCF: Special Climate Change FundSCF: Strategic Climate FundSREP: Scaling Up Renewable Energy ProgramUN REDD: United Nations Collective Program on Reducing Emissions from Deforestration and Forest Degradation
General
Mitigation
Adaptation
REDD+
Fund type
European Investment BankAfrican Development Bank
Mul
tilat
eral
Australia IFCIAusAID 31.4
ICIBMU 89.7Germany
Brazil BNDES5.8MAI
FA 26.9
Guyana GRIFMultiple donors
0.4
Japan FSFJICA799.7
Norway ICFINORAD 517
UK 78.2
IFCI
ICFDFID DECC
General
REDD+
Fund type
BFI Fund
Amount in 2011/2012 (USD million)
BFIAusAID: Australian Agency for International DevelopmentBNDES: Brazilian Development BankBMU: Federal Ministry for Environment, Natural Conservation and Nuclear SafetyJICA: Japan International Cooperation AgencyNORAD: Norwegian Agency for Development CooperationDFID: Department for International DevelopmentDECC: Department of Energy and Climate Change USAID: US Agency for International Development
FundIFCI: International Forest Carbon InitiativeMAI: Mata Atlantica InitiativeFA: Amazon Fund (Fundo Amazonia)ICI: International Climate InitiativeGRIF: Guyana REDD+ Investment FundFSF: Fast-Start FinanceICFI: International Climate and Forest InitiativeICF: International Climate FundGCCI: Global Climate Change Initiative
US GCCIUSAID 858
$2.4b
Development Finance Institutions
Sub-regional and national• Largest National Development Banks• Sub-regional development banks;
(Development Bank of Latin America);• Smaller players, like the Mexican
Nacional Financiera (NAFIN)
$42.7b Bilateral• Agence Francaise de Development and
Proparco (AFD)• KfW Entwicklungsbank and DEG (KfW)• Japan International Cooperation Agency (JICA)• Overseas Private Investment Corporation (OPIC)
$11.3b Multilateral• The World Bank Group• Regionally oriented agencies, like
AfDB and ADB• Entities without a banking basis, like
the EU
$21.2b
$75.2b
Private sector
Commercial institutions• Profit-driven investment banks• Carbon brokers and funds• Banks and insurance companies
$36b Other intermediaries• Venture capital funds• Private equity funds• Infrastructure funds
$2.4b Private sector actors• Corporate actors • Institutional investors• Project developers• Households
$230b
$268b
$364b
Adaptation
Mitigation (including REDD+)
Government budgets
Carbon market revenues $2b Carbon taxes $7.3b General tax revenues NE
$16b
$14b
$350b
Note: Figures are expressed in USD billions for the latest year available (2011 or 2012).Sources: CPI, 2012; Caravani et al, 2012; Lattanzio, 2013c
Actually, many sources of climate finance; all will require some form of MRV

MRV is not new
1936 Flood Control Act
1980 Executive Order 122911804‐1866
Jules Dupuit
1999 ASIFTransport NAMAS
1950 Detroit Area Transportation Study


Applications: the next big challenge
0
2,000,000
4,000,000
6,000,000
8,000,000
10,000,000
12,000,000
Metro Traffic Police Tax Revenue Office
Number of Vehicles (Jakarta)
Motorcycle
Bus
Truck
Passenger car
Source: Suhadi, 2010

Key messages
• The Bali Action Plan began to change the nature of the climate change regime
• It allowed countries to pledge their own actions or NAMAs
• Some of these will qualify for support from international institutions
• MRV will be a requirement for what could be increasingly diverse sources of finance