Embed Size (px)
Citation preview
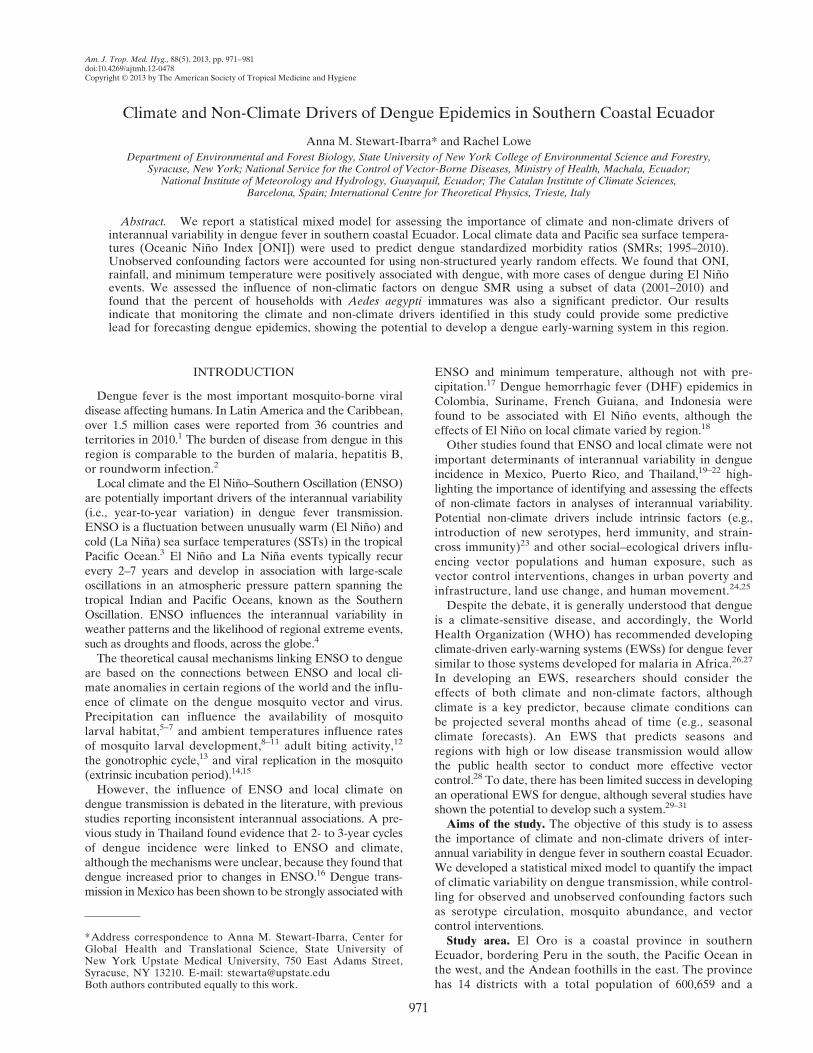
Am. J. Trop. Med. Hyg., 88(5), 2013, pp. 971–981doi:10.4269/ajtmh.12-0478Copyright © 2013 by The American Society of Tropical Medicine and Hygiene
Climate and Non-Climate Drivers of Dengue Epidemics in Southern Coastal Ecuador
Anna M. Stewart-Ibarra* and Rachel Lowe
Department of Environmental and Forest Biology, State University of New York College of Environmental Science and Forestry,Syracuse, New York; National Service for the Control of Vector-Borne Diseases, Ministry of Health, Machala, Ecuador;
National Institute of Meteorology and Hydrology, Guayaquil, Ecuador; The Catalan Institute of Climate Sciences,Barcelona, Spain; International Centre for Theoretical Physics, Trieste, Italy
Abstract. We report a statistical mixed model for assessing the importance of climate and non-climate drivers ofinterannual variability in dengue fever in southern coastal Ecuador. Local climate data and Pacific sea surface tempera-tures (Oceanic Nino Index [ONI]) were used to predict dengue standardized morbidity ratios (SMRs; 1995–2010).Unobserved confounding factors were accounted for using non-structured yearly random effects. We found that ONI,rainfall, and minimum temperature were positively associated with dengue, with more cases of dengue during El Ninoevents. We assessed the influence of non-climatic factors on dengue SMR using a subset of data (2001–2010) andfound that the percent of households with Aedes aegypti immatures was also a significant predictor. Our resultsindicate that monitoring the climate and non-climate drivers identified in this study could provide some predictivelead for forecasting dengue epidemics, showing the potential to develop a dengue early-warning system in this region.
INTRODUCTION
Dengue fever is the most important mosquito-borne viraldisease affecting humans. In Latin America and the Caribbean,over 1.5 million cases were reported from 36 countries andterritories in 2010.1 The burden of disease from dengue in thisregion is comparable to the burden of malaria, hepatitis B,or roundworm infection.2
Local climate and the El Nino–Southern Oscillation (ENSO)are potentially important drivers of the interannual variability(i.e., year-to-year variation) in dengue fever transmission.ENSO is a fluctuation between unusually warm (El Nino) andcold (La Nina) sea surface temperatures (SSTs) in the tropicalPacific Ocean.3 El Nino and La Nina events typically recurevery 2–7 years and develop in association with large-scaleoscillations in an atmospheric pressure pattern spanning thetropical Indian and Pacific Oceans, known as the SouthernOscillation. ENSO influences the interannual variability inweather patterns and the likelihood of regional extreme events,such as droughts and floods, across the globe.4
The theoretical causal mechanisms linking ENSO to dengueare based on the connections between ENSO and local cli-mate anomalies in certain regions of the world and the influ-ence of climate on the dengue mosquito vector and virus.Precipitation can influence the availability of mosquitolarval habitat,5–7 and ambient temperatures influence ratesof mosquito larval development,8–11 adult biting activity,12
the gonotrophic cycle,13 and viral replication in the mosquito(extrinsic incubation period).14,15
However, the influence of ENSO and local climate ondengue transmission is debated in the literature, with previousstudies reporting inconsistent interannual associations. A pre-vious study in Thailand found evidence that 2- to 3-year cyclesof dengue incidence were linked to ENSO and climate,although the mechanisms were unclear, because they found thatdengue increased prior to changes in ENSO.16 Dengue trans-mission inMexico has been shown to be strongly associated with
ENSO and minimum temperature, although not with pre-cipitation.17 Dengue hemorrhagic fever (DHF) epidemics inColombia, Suriname, French Guiana, and Indonesia werefound to be associated with El Nino events, although theeffects of El Nino on local climate varied by region.18
Other studies found that ENSO and local climate were notimportant determinants of interannual variability in dengueincidence in Mexico, Puerto Rico, and Thailand,19–22 high-lighting the importance of identifying and assessing the effectsof non-climate factors in analyses of interannual variability.Potential non-climate drivers include intrinsic factors (e.g.,introduction of new serotypes, herd immunity, and strain-cross immunity)23 and other social–ecological drivers influ-encing vector populations and human exposure, such asvector control interventions, changes in urban poverty andinfrastructure, land use change, and human movement.24,25
Despite the debate, it is generally understood that dengueis a climate-sensitive disease, and accordingly, the WorldHealth Organization (WHO) has recommended developingclimate-driven early-warning systems (EWSs) for dengue feversimilar to those systems developed for malaria in Africa.26,27
In developing an EWS, researchers should consider theeffects of both climate and non-climate factors, althoughclimate is a key predictor, because climate conditions canbe projected several months ahead of time (e.g., seasonalclimate forecasts). An EWS that predicts seasons andregions with high or low disease transmission would allowthe public health sector to conduct more effective vectorcontrol.28 To date, there has been limited success in developingan operational EWS for dengue, although several studies haveshown the potential to develop such a system.29–31
Aims of the study. The objective of this study is to assessthe importance of climate and non-climate drivers of inter-annual variability in dengue fever in southern coastal Ecuador.We developed a statistical mixed model to quantify the impactof climatic variability on dengue transmission, while control-ling for observed and unobserved confounding factors suchas serotype circulation, mosquito abundance, and vectorcontrol interventions.Study area. El Oro is a coastal province in southern
Ecuador, bordering Peru in the south, the Pacific Ocean inthe west, and the Andean foothills in the east. The provincehas 14 districts with a total population of 600,659 and a
*Address correspondence to Anna M. Stewart-Ibarra, Center forGlobal Health and Translational Science, State University ofNew York Upstate Medical University, 750 East Adams Street,Syracuse, NY 13210. E-mail: [email protected] authors contributed equally to this work.
971
land area of 5,818 km2 (3 °03¢ S to 3 °53 ¢ S, 80 °16¢ W to79 °21¢ W). According to the National Institute of Statis-tics and Census (INEC), more than 85% of people in theprovince live in the coastal lowlands, where dengue trans-mission is concentrated. However, in recent years, denguehas been documented in mountain valleys up to 650 mabove sea level (m.a.s.l). The Aedes aegypti mosquito isthe only known dengue vector in Ecuador.As in most of Latin America, dengue fever was eradi-
cated from Ecuador in the 1950s. In 1988, the first newcases of dengue were reported in the country, and in 1990,the first cases of dengue were reported in El Oro province.Since 2003, all four serotypes have circulated through theprovince, and in 2005, the first cases of DHF were reported.In 2010, the province experienced its worst dengue epi-demic, with approximately 3,900 cases of dengue fever and108 cases of DHF. During the epidemic, 48% of cases
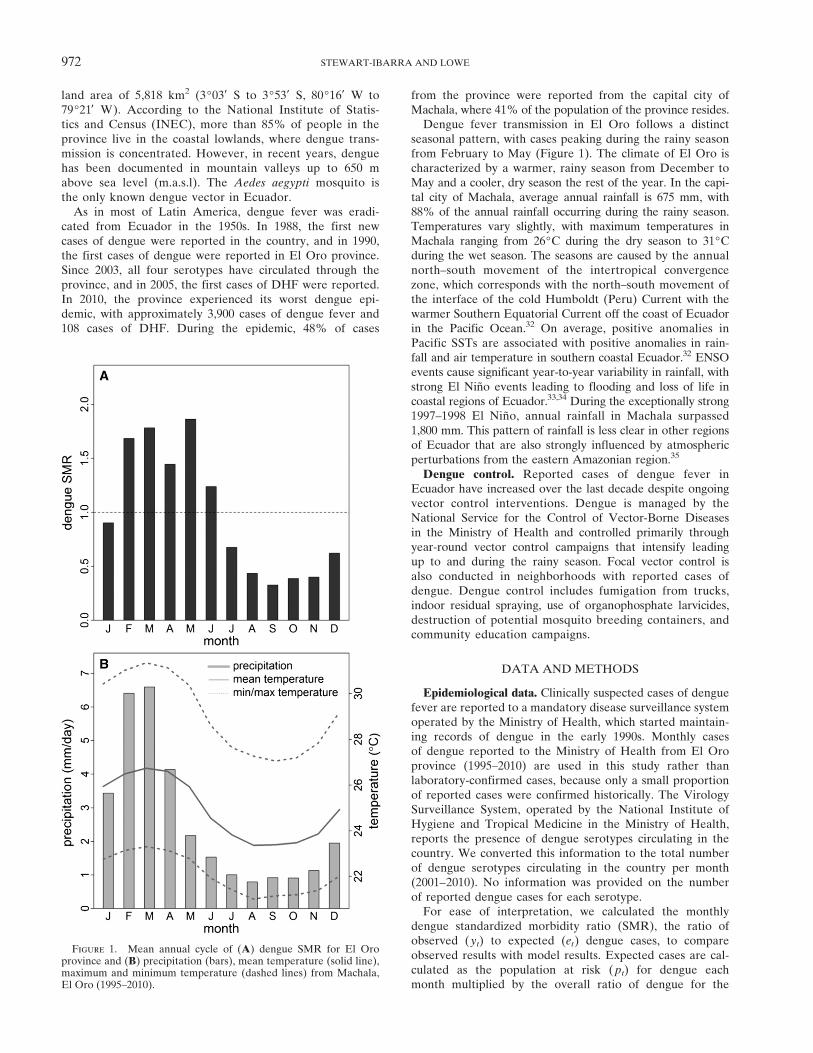
from the province were reported from the capital city ofMachala, where 41% of the population of the province resides.Dengue fever transmission in El Oro follows a distinct
seasonal pattern, with cases peaking during the rainy seasonfrom February to May (Figure 1). The climate of El Oro ischaracterized by a warmer, rainy season from December toMay and a cooler, dry season the rest of the year. In the capi-tal city of Machala, average annual rainfall is 675 mm, with88% of the annual rainfall occurring during the rainy season.Temperatures vary slightly, with maximum temperatures inMachala ranging from 26°C during the dry season to 31°Cduring the wet season. The seasons are caused by the annualnorth–south movement of the intertropical convergencezone, which corresponds with the north–south movement ofthe interface of the cold Humboldt (Peru) Current with thewarmer Southern Equatorial Current off the coast of Ecuadorin the Pacific Ocean.32 On average, positive anomalies inPacific SSTs are associated with positive anomalies in rain-fall and air temperature in southern coastal Ecuador.32 ENSOevents cause significant year-to-year variability in rainfall, withstrong El Nino events leading to flooding and loss of life incoastal regions of Ecuador.33,34 During the exceptionally strong1997–1998 El Nino, annual rainfall in Machala surpassed1,800 mm. This pattern of rainfall is less clear in other regionsof Ecuador that are also strongly influenced by atmosphericperturbations from the eastern Amazonian region.35
Dengue control. Reported cases of dengue fever inEcuador have increased over the last decade despite ongoingvector control interventions. Dengue is managed by theNational Service for the Control of Vector-Borne Diseasesin the Ministry of Health and controlled primarily throughyear-round vector control campaigns that intensify leadingup to and during the rainy season. Focal vector control isalso conducted in neighborhoods with reported cases ofdengue. Dengue control includes fumigation from trucks,indoor residual spraying, use of organophosphate larvicides,destruction of potential mosquito breeding containers, andcommunity education campaigns.
DATA AND METHODS
Epidemiological data. Clinically suspected cases of denguefever are reported to a mandatory disease surveillance systemoperated by the Ministry of Health, which started maintain-ing records of dengue in the early 1990s. Monthly casesof dengue reported to the Ministry of Health from El Oroprovince (1995–2010) are used in this study rather thanlaboratory-confirmed cases, because only a small proportionof reported cases were confirmed historically. The VirologySurveillance System, operated by the National Institute ofHygiene and Tropical Medicine in the Ministry of Health,reports the presence of dengue serotypes circulating in thecountry. We converted this information to the total numberof dengue serotypes circulating in the country per month(2001–2010). No information was provided on the numberof reported dengue cases for each serotype.For ease of interpretation, we calculated the monthly
dengue standardized morbidity ratio (SMR), the ratio ofobserved (yt) to expected (et) dengue cases, to compareobserved results with model results. Expected cases are cal-culated as the population at risk (pt) for dengue eachmonth multiplied by the overall ratio of dengue for the
Figure 1. Mean annual cycle of (A) dengue SMR for El Oroprovince and (B) precipitation (bars), mean temperature (solid line),maximum and minimum temperature (dashed lines) from Machala,El Oro (1995–2010).
972 STEWART-IBARRA AND LOWE
entire time period in El Oro et = pt(yt
(pt
!. The population
of the province was obtained from national censuses (1990,2001, and 2010) conducted by INEC, and the population inthe intervening years was estimated assuming linear growth.The model formulated below predicts the counts of denguecases (yt) but includes the expected number of cases as anoffset, therefore predicting the dengue SMR (or relativerisk) at each time step.Entomological data. The National Service for the Control
of Vector-Borne Diseases provided quarterly (2001–2010)estimates of various indicators of vector abundance forEl Oro: Breteau Index (BI), House Index (HI), and an esti-mate of vector control efforts. The BI is the number ofcontainers with Ae. aegypti immatures per 100 households,and the HI is the number of households with Ae. aegypti
immatures per 100 households. Monthly vector control effortswere estimated by the average number of vector controltechnician labor days and kilograms of larvicide used.Climate data. Daily precipitation,mean temperature (Tmean),
maximum temperature (Tmax), and minimum temperature(Tmin) for the study period were provided by the NationalInstitute of Meteorology and Hydrology from the GranjaSanta Ines weather station located in Machala (3°17¢26² S,79°54¢5² W, 5 m.a.s.l.). This station provided the most com-plete climatological time series for the coastal region ofEl Oro. To fill gaps in the time series, a linear statisticalmodel was formulated to predict missing station data usinggridded temperature and rainfall data from the grid boxwithin which the meteorological station is located. Rainfalldata were obtained from the Global Precipitation ClimatologyProject (GPCP).36 Temperature data were obtained from theEuropean Re-Analysis (ERA)–Interim Reanalysis daily fromthe European Center for Medium-Range Weather Forecasts(ECMWF) Data Server.SST data. The National Oceanic and Atmospheric Adminis-
tration (NOAA) Climate Prediction Center of NOAA/National
Weather Service provided a time series of the Oceanic NinoIndex (ONI) defined as the 3-month running mean of SSTanomalies (1971–2000 base period) in the Nino 3.4 region(5 °N to 5 ° S, 170 ° to 120 ° W).37 The Climate Prediction
Center defines ENSO events when SST anomalies are greaterthan or equal to +0.5 °C for 5 consecutive months for warm(El Nino) events and less than or equal to −0.5 °C for cold(La Nina) events. During the study period (1995–2010), six
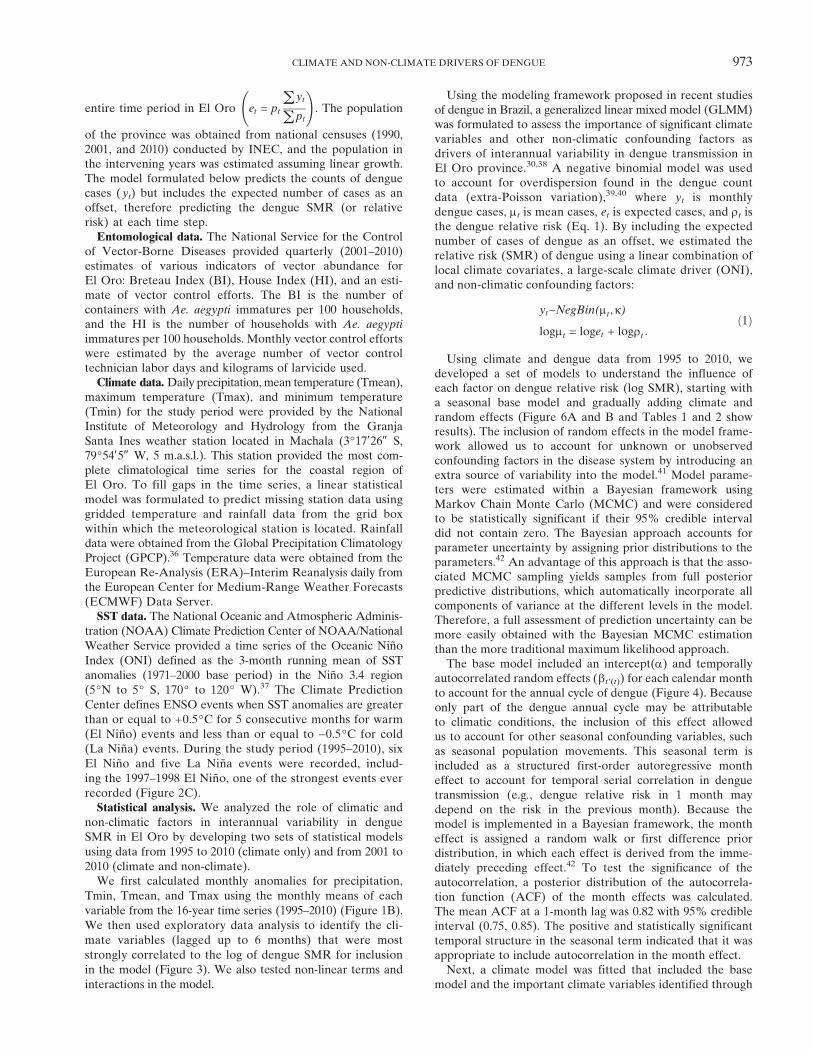
El Nino and five La Nina events were recorded, includ-ing the 1997–1998 El Nino, one of the strongest events everrecorded (Figure 2C).Statistical analysis. We analyzed the role of climatic and
non-climatic factors in interannual variability in dengueSMR in El Oro by developing two sets of statistical models
using data from 1995 to 2010 (climate only) and from 2001 to2010 (climate and non-climate).We first calculated monthly anomalies for precipitation,
Tmin, Tmean, and Tmax using the monthly means of each
variable from the 16-year time series (1995–2010) (Figure 1B).
We then used exploratory data analysis to identify the cli-
mate variables (lagged up to 6 months) that were most
strongly correlated to the log of dengue SMR for inclusion
in the model (Figure 3). We also tested non-linear terms andinteractions in the model.
Using the modeling framework proposed in recent studiesof dengue in Brazil, a generalized linear mixed model (GLMM)was formulated to assess the importance of significant climatevariables and other non-climatic confounding factors asdrivers of interannual variability in dengue transmission inEl Oro province.30,38 A negative binomial model was usedto account for overdispersion found in the dengue countdata (extra-Poisson variation),39,40 where yt is monthlydengue cases, mt is mean cases, et is expected cases, and rt isthe dengue relative risk (Eq. 1). By including the expectednumber of cases of dengue as an offset, we estimated therelative risk (SMR) of dengue using a linear combination oflocal climate covariates, a large-scale climate driver (ONI),and non-climatic confounding factors:
yt~NegBin(mt, k)
logmt = loget + logrt :ð1Þ
Using climate and dengue data from 1995 to 2010, wedeveloped a set of models to understand the influence ofeach factor on dengue relative risk (log SMR), starting witha seasonal base model and gradually adding climate andrandom effects (Figure 6A and B and Tables 1 and 2 showresults). The inclusion of random effects in the model frame-work allowed us to account for unknown or unobservedconfounding factors in the disease system by introducing anextra source of variability into the model.41 Model parame-ters were estimated within a Bayesian framework usingMarkov Chain Monte Carlo (MCMC) and were consideredto be statistically significant if their 95% credible intervaldid not contain zero. The Bayesian approach accounts forparameter uncertainty by assigning prior distributions to theparameters.42 An advantage of this approach is that the asso-ciated MCMC sampling yields samples from full posteriorpredictive distributions, which automatically incorporate allcomponents of variance at the different levels in the model.Therefore, a full assessment of prediction uncertainty can bemore easily obtained with the Bayesian MCMC estimationthan the more traditional maximum likelihood approach.The base model included an intercept(a) and temporally
autocorrelated random effects (bt ¢(t)) for each calendar monthto account for the annual cycle of dengue (Figure 4). Becauseonly part of the dengue annual cycle may be attributableto climatic conditions, the inclusion of this effect allowedus to account for other seasonal confounding variables, suchas seasonal population movements. This seasonal term isincluded as a structured first-order autoregressive montheffect to account for temporal serial correlation in denguetransmission (e.g., dengue relative risk in 1 month maydepend on the risk in the previous month). Because themodel is implemented in a Bayesian framework, the montheffect is assigned a random walk or first difference priordistribution, in which each effect is derived from the imme-diately preceding effect.42 To test the significance of theautocorrelation, a posterior distribution of the autocorrela-tion function (ACF) of the month effects was calculated.The mean ACF at a 1-month lag was 0.82 with 95% credibleinterval (0.75, 0.85). The positive and statistically significanttemporal structure in the seasonal term indicated that it wasappropriate to include autocorrelation in the month effect.Next, a climate model was fitted that included the base
model and the important climate variables identified through
CLIMATE AND NON-CLIMATE DRIVERS OF DENGUE 973
exploratory data analysis (gjxjt� �
. We then developed a
non-climate model by removing the climate variables and
replacing these variable with exchangeable non-structured
random effects for each year (dT ¢(t)) to account for inter-
annual changes in dengue risk attributable to factors that
we are unable to measure for the time period 1995–2010,
such as changes in vector control practices (Figure 4B). Note
that we tested autocorrelation in the yearly random effects
to potentially account for the effects of lasting immunity
between dengue outbreaks. However, when assessing the
posterior distribution of the ACF at 1-year lag, the correla-
tion was found to be weak (−0.09) and not statistically sig-
nificant (i.e., the 95% credible interval contained zero
[−0.33, 0.14]). In the final model, we included both climate
variables and yearly random effects with the base model.The goodness of fit of all models was assessed using the
deviance information criterion (DIC)43 and an R2LR statistic
for mixed effects models based on a likelihood ratio test.44
Smaller values of DIC indicate a better-fitting model, whereas
0 £ R2LR £ 1, with R2
LR = 1 corresponding to a perfect fit
and R2LR ³ 0 valid for any reasonable model specification.
We also assessed the model fitness by comparing the observedhistorical dengue SMR with the posterior predictive distribu-tion of dengue SMR.45 The posterior predictive distributionof dengue served as a reference distribution and was obtainedby simulating new pseudo-observations using samples fromthe posterior distribution of the parameters in the model.We developed a second set of models to further investi-
gate potential non-climatic drivers of interannual variability indengue risk using a subset of the data (2001–2010) for which
additional information on non-climate factors (ej zjt� �
was
available, including the number of dengue serotypes circu-lating in the country, entomological indices (HI and BI),and vector control intensity (number of worker days andkilograms of larvicide) (Figure 5). Dengue serotype datawere converted into a categorical variable with three levels(0 = no information [aliased to the intercept], 1 = one knownserotype in circulation, 2 = two or more known serotypes incirculation). We conducted exploratory analyses to iden-tify the most important non-climate variables and lags forinclusion in the model, and then, we developed this set ofmodels using the same procedure described above. We tested
Figure 2. Three-month running mean anomalies of (A) the dengue SMR in El Oro province, (B) precipitation and mean temperaturefrom Machala, El Oro, and (C) SST in the Nino 3.4 region, also known as ONI.
974 STEWART-IBARRA AND LOWE
the relative influence of the 1997–1998 El Nino on theONI parameter by comparing the 1995–2010 data with the2001–2010 data.
RESULTS
From 1995 to 2010, 18,761 cases of dengue were reportedfrom El Oro province, with 13,852 cases reported from2001 to 2010. The best 1995–2010 model explained 62% of the
variability in dengue transmission, and the best 2001–2010model explained 72% of the variability. ONI and HI werethe most important predictors of dengue in this region.Details on these findings follow.1995–2010 model. The most important climate variables
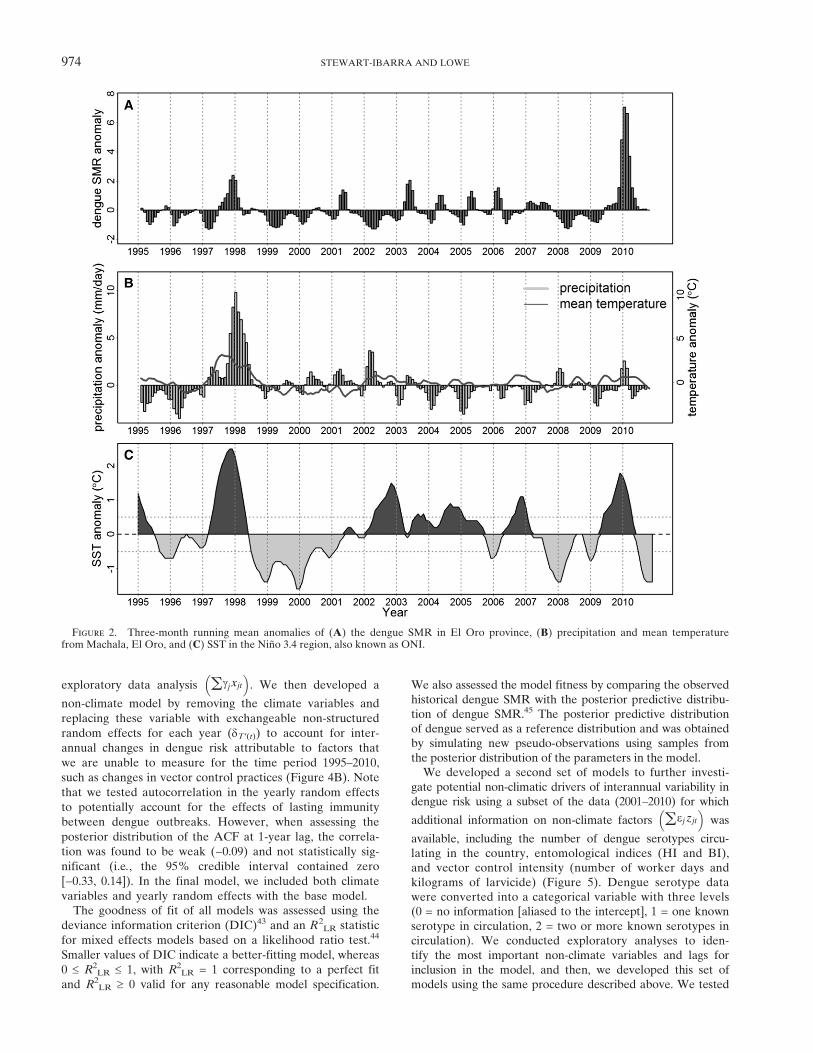
associated with dengue were anomalies in precipitation at a1-month lag, anomalies in Tmin at a 2-month lag, and ONI ata 3-month lag. These variables had positive and statisticallysignificant associations with dengue SMR. Precipitation, Tmin,
Figure 3. Scatter matrix showing the relations between log dengue SMR and anomalies in climate variables at the most significant lags:SMR versus precipitation at a 1-month lag, SMR versus minimum temperature at a 2-month lag, and SMR versus ONI at a 3-month lag.Solid line = linear regression curves for 1995–2010; dashed line = linear regression curves for 2001–2010.
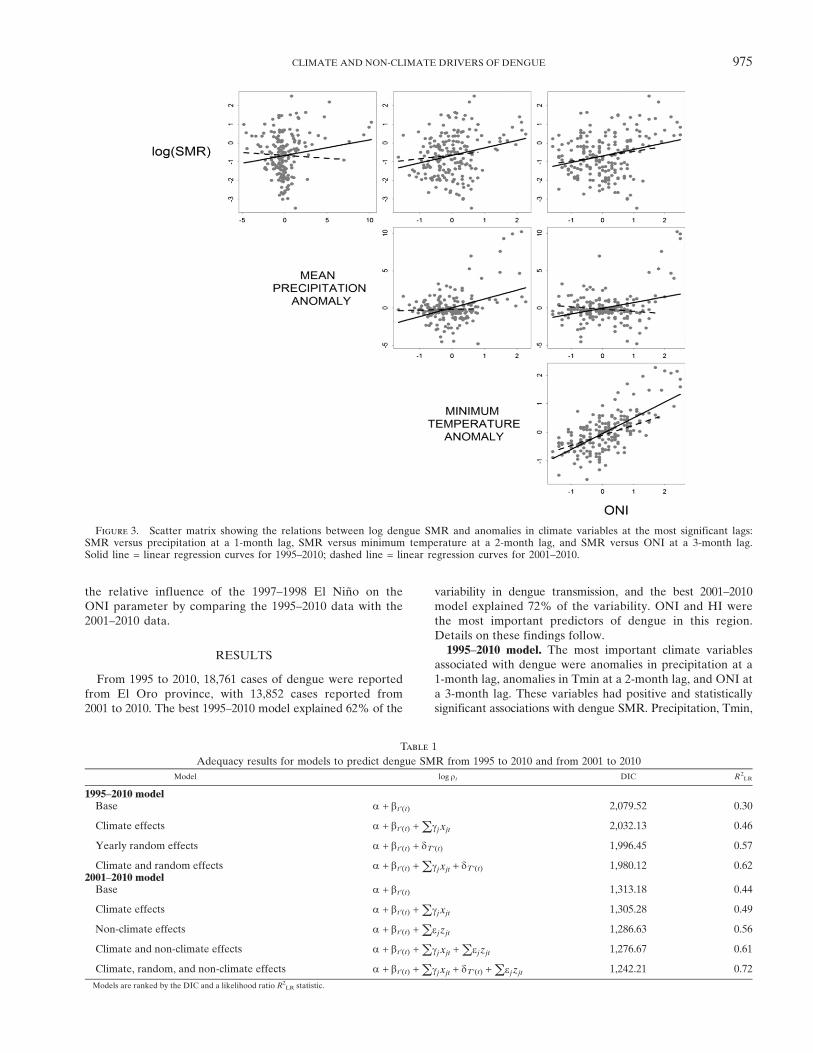
Table 1
Adequacy results for models to predict dengue SMR from 1995 to 2010 and from 2001 to 2010
Model log rt DIC R2LR
1995–2010 modelBase a + bt ¢(t) 2,079.52 0.30
Climate effects a + bt ¢(t) +(gj xjt 2,032.13 0.46
Yearly random effects a + bt ¢(t) + dT ¢(t) 1,996.45 0.57
Climate and random effects a + bt ¢(t) +(gjxjt + dT ¢(t) 1,980.12 0.622001–2010 modelBase a + bt ¢(t) 1,313.18 0.44
Climate effects a + bt ¢(t) +(gjxjt 1,305.28 0.49
Non-climate effects a + bt ¢(t) +(ejzjt 1,286.63 0.56
Climate and non-climate effects a + bt ¢(t) +(gj xjt +(ejzjt 1,276.67 0.61
Climate, random, and non-climate effects a + bt ¢(t) +(gjxjt + dT ¢(t) +(ejzjt 1,242.21 0.72
Models are ranked by the DIC and a likelihood ratio R2LR statistic.
CLIMATE AND NON-CLIMATE DRIVERS OF DENGUE 975
and ONI had significant associations at other lags but at lowermagnitudes. Anomalies in Tmax and Tmean were positivelyassociated with dengue at a lower magnitude than Tmin anddid not improve the model fit. Polynomial terms and inter-actions were not found to be statistically significant.The best model explained 62% of the variability in dengue
transmission and included climate effects, yearly randomeffects, and monthly random effects (Tables 1 and 2). Theseasonal base model (monthly random effects) alone explained30% of the variation in dengue transmission. When climateeffects were added to the base model, an additional 16% ofvariation was explained (46% total), and the goodness of fitimproved. In the final model, adding yearly random effectsto climate effects and the base model explained an additional16% of the variation in dengue (62% total). The influence ofyearly random effects can be interpreted as the effect ofunobservable non-climate annual factors, such as populationimmunity or vector control campaigns. Tmin was not signifi-cant in the final model.To assess the predictive ability of the model, posterior
predictive distributions (posterior predictive mean and 95%prediction intervals) of dengue SMR were simulated usingparameter estimates from the best model (that also accountfor unknown random effects) but omitting the yearly randomeffects from the prediction calculation (Figure 6). The randomeffects are important to allow more accurate parameter esti-
mates for climate and other variable. However, they are notuseful in a prediction model, because they represent unknownfactors. The 1995–2010 model was able to correctly capturethe interannual and intraseasonal variability in dengue risk,although in some instances, the model predicted higherdengue risk than was observed (Figure 6A and B).2001–2010 model. The most important non-climate vari-
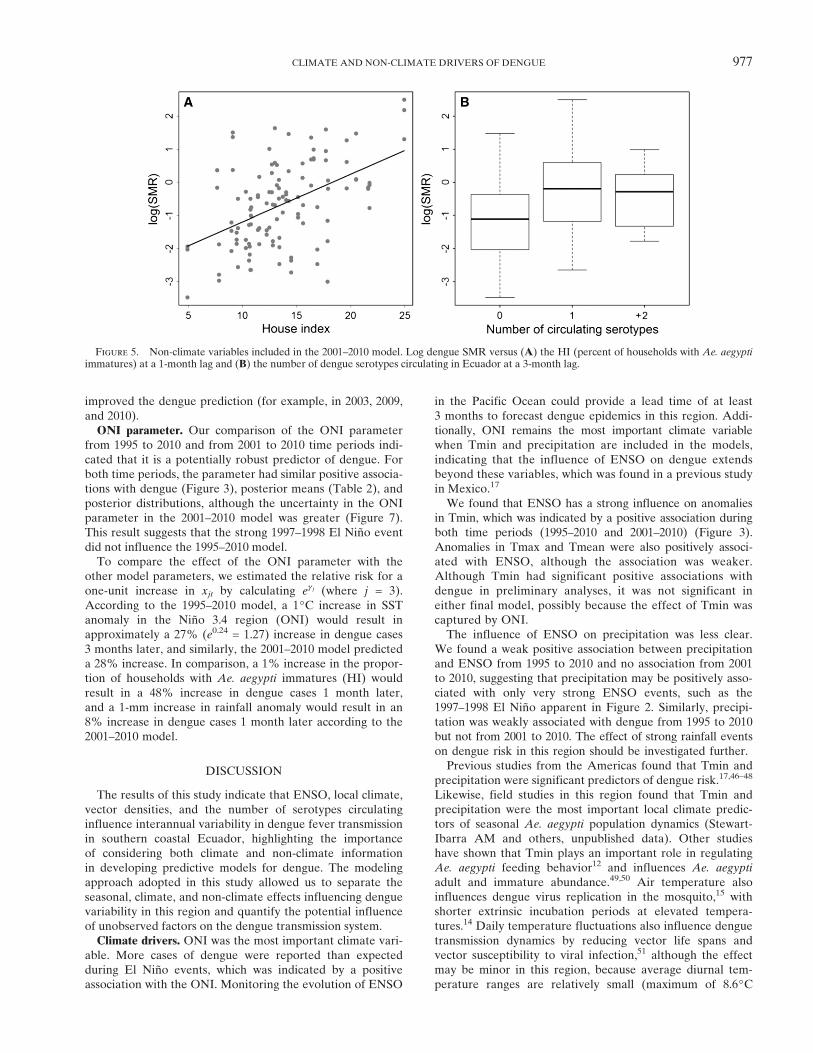
ables associated with dengue were HI at a 1-month lag andthe number of dengue serotypes at a 3-month lag. These vari-ables were included in the model as non-climate effects, andthe same climate variables were included as in the 1995–2010model. Variables accounting for vector control efforts werenot statistically significant.The best model explained 72% of the variability in dengue
transmission and included climate, non-climate, yearly, andmonthly random effects (Tables 1 and 2). The seasonal basemodel alone explained 44% of dengue transmission. Thegoodness of fit of the model improved when climate and non-climate effects were added to the base model independently,although non-climate effects explained 7% more of the varia-tion than climate effects. Climate and non-climate effectstogether explained 61% of the variability in dengue, thesame proportion explained by the best 1995–2010 model. Inthe final 2001–2010 model, yearly random effects explainedan additional 11% of the variability. Anomalies in precipita-tion, anomalies in Tmin, and the number of dengue serotypeswere not statistically significant in the final model. Thelack of association between dengue and local climate factorsfor this time period is apparent in Figure 3. The associationbetween dengue and the serotype variables remained positive,although the serotype variables were not significant.To assess the predictive ability of the 2001–2010 model,
we also simulated the posterior predictive distributions ofdengue SMR using parameter estimates from the best modelbut omitting the yearly random effects (Figure 6C and D).This model captured some of the interannual variabilityin dengue risk, although it predicted higher dengue riskthan was observed in some instances, similar to the 1995–2010 model. Predictions including both climate and non-climate information (Figure 6D, dashed line) and onlynon-climate information (Figure 6D, dotted line) are shown,highlighting years where the inclusion of climate information
Table 2
Posterior means and 95% credible intervals (CIs) for the parame-ters associated with the explanatory variables in the best models(allowing for random effects) fitted to data from 1995 to 2010and from 2001 to 2010
ParameterPosterior mean (95% CI)
1995–2010 modelPosterior mean (95% CI)
2001–2010 model
Precipitation x1 0.09 (0.03, 0.16) 0.08 (−0.01, 0.18)Tmin x2 0.02 (−0.02, 0.09) −0.08 (−0.42, 0.28)ONI x3 0.24 (0.05, 0.42) 0.25 (0.00, 0.52)HI z1 – 0.39 (0.17, 0.60)Number ofcirculating serotypesOne known serotype z2 – 0.20 (−0.12, 0.53)Two or moreknown serotypes
z2 – 0.48 (−0.04, 0.97)
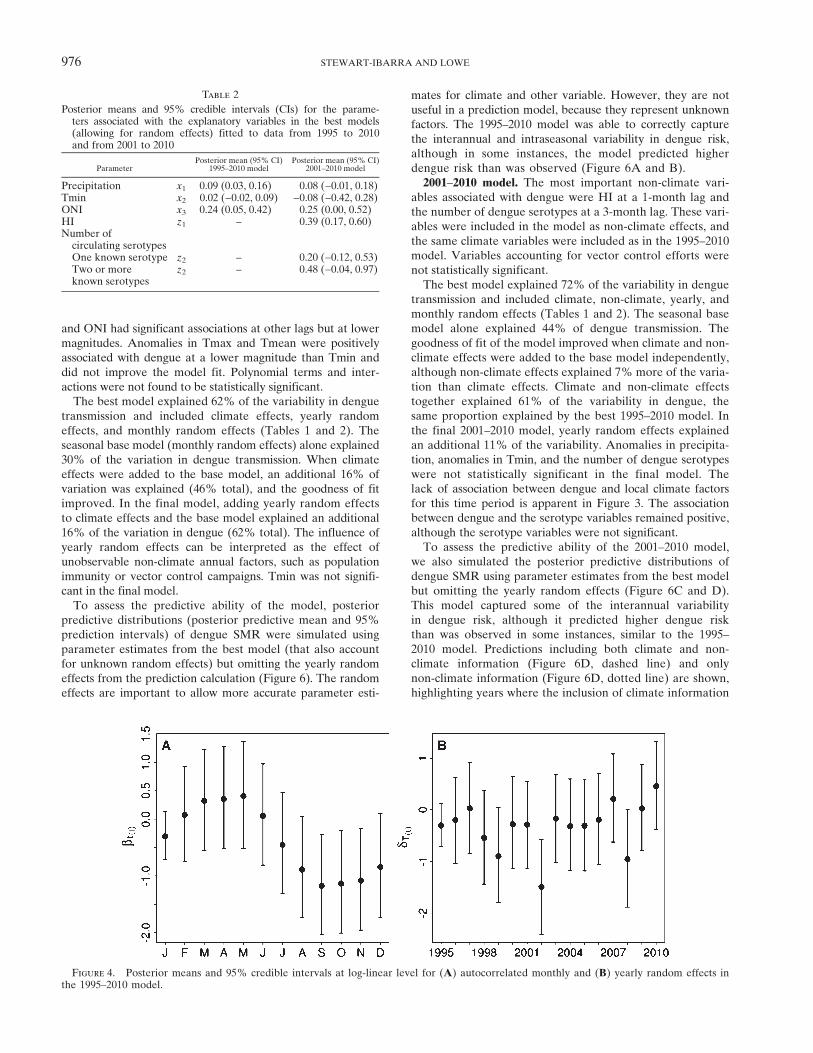
Figure 4. Posterior means and 95% credible intervals at log-linear level for (A) autocorrelated monthly and (B) yearly random effects inthe 1995–2010 model.
976 STEWART-IBARRA AND LOWE
improved the dengue prediction (for example, in 2003, 2009,and 2010).ONI parameter. Our comparison of the ONI parameter
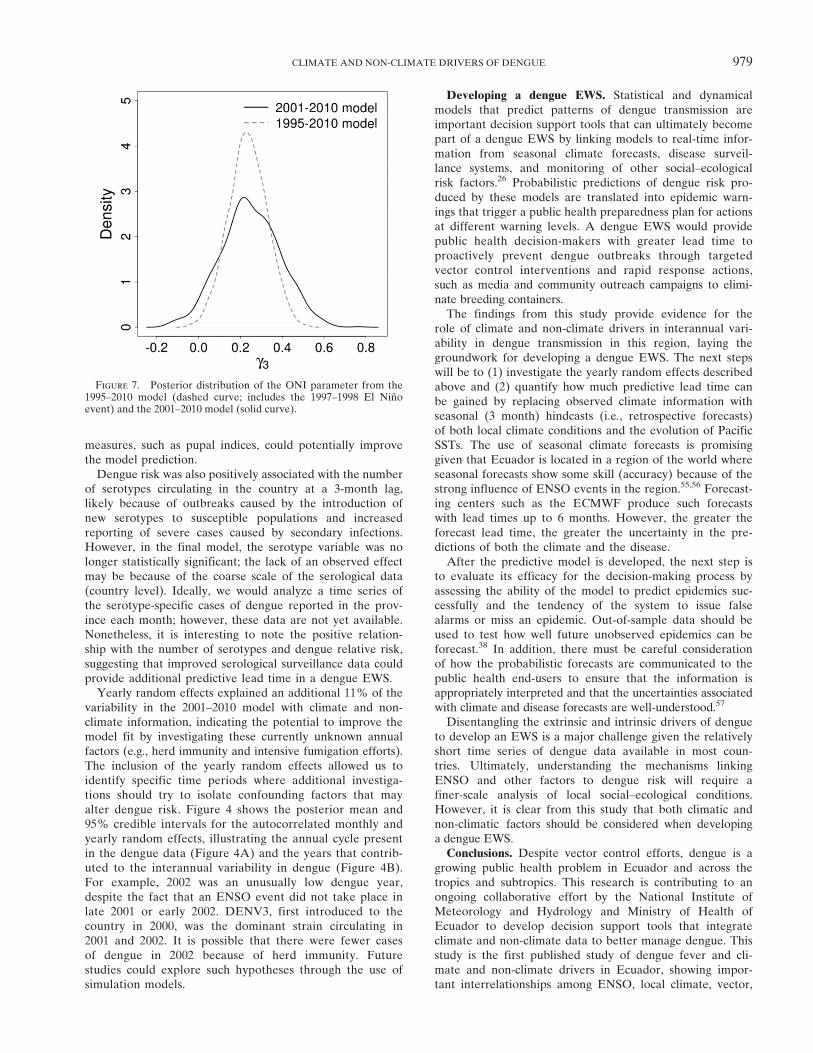
from 1995 to 2010 and from 2001 to 2010 time periods indi-cated that it is a potentially robust predictor of dengue. Forboth time periods, the parameter had similar positive associa-tions with dengue (Figure 3), posterior means (Table 2), andposterior distributions, although the uncertainty in the ONIparameter in the 2001–2010 model was greater (Figure 7).This result suggests that the strong 1997–1998 El Nino eventdid not influence the 1995–2010 model.To compare the effect of the ONI parameter with the
other model parameters, we estimated the relative risk for aone-unit increase in xjt by calculating eg j (where j = 3).According to the 1995–2010 model, a 1°C increase in SSTanomaly in the Nino 3.4 region (ONI) would result inapproximately a 27% (e0.24 = 1.27) increase in dengue cases3 months later, and similarly, the 2001–2010 model predicteda 28% increase. In comparison, a 1% increase in the propor-tion of households with Ae. aegypti immatures (HI) wouldresult in a 48% increase in dengue cases 1 month later,and a 1-mm increase in rainfall anomaly would result in an8% increase in dengue cases 1 month later according to the2001–2010 model.
DISCUSSION
The results of this study indicate that ENSO, local climate,vector densities, and the number of serotypes circulatinginfluence interannual variability in dengue fever transmissionin southern coastal Ecuador, highlighting the importanceof considering both climate and non-climate informationin developing predictive models for dengue. The modelingapproach adopted in this study allowed us to separate theseasonal, climate, and non-climate effects influencing denguevariability in this region and quantify the potential influenceof unobserved factors on the dengue transmission system.Climate drivers. ONI was the most important climate vari-
able. More cases of dengue were reported than expectedduring El Nino events, which was indicated by a positiveassociation with the ONI. Monitoring the evolution of ENSO
in the Pacific Ocean could provide a lead time of at least3 months to forecast dengue epidemics in this region. Addi-tionally, ONI remains the most important climate variablewhen Tmin and precipitation are included in the models,indicating that the influence of ENSO on dengue extendsbeyond these variables, which was found in a previous studyin Mexico.17
We found that ENSO has a strong influence on anomaliesin Tmin, which was indicated by a positive association duringboth time periods (1995–2010 and 2001–2010) (Figure 3).Anomalies in Tmax and Tmean were also positively associ-ated with ENSO, although the association was weaker.Although Tmin had significant positive associations withdengue in preliminary analyses, it was not significant ineither final model, possibly because the effect of Tmin wascaptured by ONI.The influence of ENSO on precipitation was less clear.
We found a weak positive association between precipitationand ENSO from 1995 to 2010 and no association from 2001to 2010, suggesting that precipitation may be positively asso-ciated with only very strong ENSO events, such as the1997–1998 El Nino apparent in Figure 2. Similarly, precipi-tation was weakly associated with dengue from 1995 to 2010but not from 2001 to 2010. The effect of strong rainfall eventson dengue risk in this region should be investigated further.Previous studies from the Americas found that Tmin and
precipitation were significant predictors of dengue risk.17,46–48
Likewise, field studies in this region found that Tmin andprecipitation were the most important local climate predic-tors of seasonal Ae. aegypti population dynamics (Stewart-Ibarra AM and others, unpublished data). Other studieshave shown that Tmin plays an important role in regulatingAe. aegypti feeding behavior12 and influences Ae. aegypti
adult and immature abundance.49,50 Air temperature alsoinfluences dengue virus replication in the mosquito,15 withshorter extrinsic incubation periods at elevated tempera-tures.14 Daily temperature fluctuations also influence denguetransmission dynamics by reducing vector life spans andvector susceptibility to viral infection,51 although the effectmay be minor in this region, because average diurnal tem-perature ranges are relatively small (maximum of 8.6°C
Figure 5. Non-climate variables included in the 2001–2010 model. Log dengue SMR versus (A) the HI (percent of households with Ae. aegyptiimmatures) at a 1-month lag and (B) the number of dengue serotypes circulating in Ecuador at a 3-month lag.
CLIMATE AND NON-CLIMATE DRIVERS OF DENGUE 977

in April and minimum of 5.8°C in October). The averagemonthly minimum temperature in this region ranges from20.8°C in August (dengue low season) to 23.9°C in April(dengue high season), temperatures that fall at the lowerend of the optimal range for endemic dengue transmission(20–30°C).10 This finding suggests that dengue transmission inthis region may be especially sensitive to changes in the mini-mum temperature caused by ENSO or other climate forcings.The effect of precipitation on dengue risk is confounded
by interactions with human behavior (e.g., water storage) andlocal social–ecological conditions (e.g., housing conditionand piped water infrastructure) influencing vector abun-dance. It is generally understood that rainfall can increasedengue risk by increasing the availability of mosquito larvalhabitats. However, studies in Puerto Rico showed that, incommunities where the key Ae. aegypti breeding sites areyear-round water storage containers, vector densities wereless sensitive to seasonal variation in rainfall.52 Other studiesfound that rainfall shortages can increase dengue risk byincreasing the need for water storage around the house-hold.53,54 Therefore, to understand and predict the effectof rainfall on dengue risk may require a finer-scale model-
ing approach that incorporates these context-specific social–ecological parameters.Although precipitation and Tmin were not statistically sig-
nificant after we added non-climatic factors in the 2001–2010model, we believe that these local meteorological variablesshould remain in the model formulation because of themechanistic importance of these variables, and the strengthof the relationship should be continually assessed as newdata become available.Non-climate drivers. Non-climatic factors (i.e., HI and
serotypes) also had an important effect on dengue trans-mission, explaining an additional 12% of the variabilitywhen added to the seasonal base model for 2001–2010.Dengue risk was positively associated with Ae. aegypti
immature abundance at a 1-month lag, indicated by theHI, which was significant even with the inclusion of climatefactors and seasonality. This result suggests that interannualvariability in Ae. aegypti abundance may be influenced bynon-climatic factors, such as changes in urban infrastruc-ture and vector control interventions, although the vectorcontrol variables were not significant in the model. Giventhat HI is a crude measure of vector abundance, better
Figure 6. Observed dengue SMR (solid line) and predicted SMR (dashed/dotted line; shaded area = 95% prediction interval) for bestmodels (not including yearly random effects): (A and B) the 1995–2010 model including climate information and (C and D) the 2001–2010model including climate, vector, and serotype information (dashed line) and only vector and serotype information (dotted line).
978 STEWART-IBARRA AND LOWE
measures, such as pupal indices, could potentially improvethe model prediction.Dengue risk was also positively associated with the number
of serotypes circulating in the country at a 3-month lag,likely because of outbreaks caused by the introduction ofnew serotypes to susceptible populations and increasedreporting of severe cases caused by secondary infections.However, in the final model, the serotype variable was nolonger statistically significant; the lack of an observed effectmay be because of the coarse scale of the serological data(country level). Ideally, we would analyze a time series ofthe serotype-specific cases of dengue reported in the prov-ince each month; however, these data are not yet available.Nonetheless, it is interesting to note the positive relation-ship with the number of serotypes and dengue relative risk,suggesting that improved serological surveillance data couldprovide additional predictive lead time in a dengue EWS.Yearly random effects explained an additional 11% of the
variability in the 2001–2010 model with climate and non-climate information, indicating the potential to improve themodel fit by investigating these currently unknown annualfactors (e.g., herd immunity and intensive fumigation efforts).The inclusion of the yearly random effects allowed us toidentify specific time periods where additional investiga-tions should try to isolate confounding factors that mayalter dengue risk. Figure 4 shows the posterior mean and95% credible intervals for the autocorrelated monthly andyearly random effects, illustrating the annual cycle presentin the dengue data (Figure 4A) and the years that contrib-uted to the interannual variability in dengue (Figure 4B).For example, 2002 was an unusually low dengue year,despite the fact that an ENSO event did not take place inlate 2001 or early 2002. DENV3, first introduced to thecountry in 2000, was the dominant strain circulating in2001 and 2002. It is possible that there were fewer casesof dengue in 2002 because of herd immunity. Futurestudies could explore such hypotheses through the use ofsimulation models.
Developing a dengue EWS. Statistical and dynamicalmodels that predict patterns of dengue transmission areimportant decision support tools that can ultimately becomepart of a dengue EWS by linking models to real-time infor-mation from seasonal climate forecasts, disease surveil-lance systems, and monitoring of other social–ecologicalrisk factors.26 Probabilistic predictions of dengue risk pro-duced by these models are translated into epidemic warn-ings that trigger a public health preparedness plan for actionsat different warning levels. A dengue EWS would providepublic health decision-makers with greater lead time toproactively prevent dengue outbreaks through targetedvector control interventions and rapid response actions,such as media and community outreach campaigns to elimi-nate breeding containers.The findings from this study provide evidence for the
role of climate and non-climate drivers in interannual vari-ability in dengue transmission in this region, laying thegroundwork for developing a dengue EWS. The next stepswill be to (1) investigate the yearly random effects describedabove and (2) quantify how much predictive lead time canbe gained by replacing observed climate information withseasonal (3 month) hindcasts (i.e., retrospective forecasts)of both local climate conditions and the evolution of PacificSSTs. The use of seasonal climate forecasts is promisinggiven that Ecuador is located in a region of the world whereseasonal forecasts show some skill (accuracy) because of thestrong influence of ENSO events in the region.55,56 Forecast-ing centers such as the ECMWF produce such forecastswith lead times up to 6 months. However, the greater theforecast lead time, the greater the uncertainty in the pre-dictions of both the climate and the disease.After the predictive model is developed, the next step is
to evaluate its efficacy for the decision-making process byassessing the ability of the model to predict epidemics suc-cessfully and the tendency of the system to issue falsealarms or miss an epidemic. Out-of-sample data should beused to test how well future unobserved epidemics can beforecast.38 In addition, there must be careful considerationof how the probabilistic forecasts are communicated to thepublic health end-users to ensure that the information isappropriately interpreted and that the uncertainties associatedwith climate and disease forecasts are well-understood.57
Disentangling the extrinsic and intrinsic drivers of dengueto develop an EWS is a major challenge given the relativelyshort time series of dengue data available in most coun-tries. Ultimately, understanding the mechanisms linkingENSO and other factors to dengue risk will require afiner-scale analysis of local social–ecological conditions.However, it is clear from this study that both climatic andnon-climatic factors should be considered when developinga dengue EWS.Conclusions. Despite vector control efforts, dengue is a
growing public health problem in Ecuador and across thetropics and subtropics. This research is contributing to anongoing collaborative effort by the National Institute ofMeteorology and Hydrology and Ministry of Health ofEcuador to develop decision support tools that integrateclimate and non-climate data to better manage dengue. Thisstudy is the first published study of dengue fever and cli-mate and non-climate drivers in Ecuador, showing impor-tant interrelationships among ENSO, local climate, vector,
Figure 7. Posterior distribution of the ONI parameter from the1995–2010 model (dashed curve; includes the 1997–1998 El Ninoevent) and the 2001–2010 model (solid curve).
CLIMATE AND NON-CLIMATE DRIVERS OF DENGUE 979

virus, and dengue dynamics that provide the foundation todevelop a dengue EWS.
Received August 7, 2012. Accepted for publication January 30, 2013.
Published online March 11, 2013.
Acknowledgments: Many thanks to M. Borbor of the Ministry ofEnvironment; E. Beltran, J. Palomeque, J. Real, M. Silva, andT. Ordonez of the Ministry of Health; and R. Mejia, V. Borbor, andC. Recalde of the National Institute of Meteorology and Hydrologyfor providing data and supporting ongoing climate–health initia-tives in Ecuador. The authors thank C. Hall and T. Endy for theirinsightful comments in preparation of this manuscript and T. Baileyfor advice regarding the statistical model. The authors would liketo thank the coordinators of the Columbia University InternationalResearch Institute’s summer institute on Climate Information forPublic Health where this collaboration first developed. We alsoacknowledge support from the Universidad de EspecialidadesEspiritu Santo.
Financial support: A.M.S.-I. received partial support from aFulbright Institute of International Education fellowship. R.L.received partial funding from European Union Projects QuantifyingWeather and Climate Impacts on Health in Developing Countries(QWeCI) Grant 243964 and Dengue Research Framework for Resist-ing Epidemics in Europe (DENFREE) Grant 282 378 funded by theEuropean Commission’s Seventh Framework Research Programme.
Authors’ addresses: Anna M. Stewart-Ibarra, Center for GlobalHealth and Translational Science, State University of New YorkUpstate Medical University, Syracuse, NY, E-mail: [email protected]. Rachel Lowe, The Catalan Institute of Climate Sciences (IC3),Barcelona, Spain, E-mail: [email protected].
REFERENCES
1. PAHO, 2011. Number of Reported Cases of Dengue and SevereDengue (DS) in the Americas by Country (1995–2011). Avail-able at: www.who.int/denguenet. Accessed November 15, 2011.
2. WHO, 2008. The Global Burden of Disease: 2004 Update. Geneva:World Health Organization.
3. Philander SG, 1990. El Nino, La Nina, and the Southern Oscillation.San Diego, CA: Academic Press.
4. Lyon B, Barnston AG, 2005. ENSO and the spatial extentof interannual precipitation extremes in tropical land areas.J Clim 18: 5095–5109.
5. Moore CB, Cline BL, Ruiz-Tiben E, Lee D, Romney-Joseph H,Rivera-Correa E, 1978. Aedes aegypti in Puerto Rico: envi-ronmental determinants of larval abundance and relation todengue virus transmission. Am J Trop Med Hyg 27: 1225–1231.
6. Barrera R, Amador M, Clark GG, 2006. Use of the pupalsurvey technique for measuring Aedes aegypti (Diptera:Culicidae) productivity in Puerto Rico. Am J Trop Med Hyg74: 290–302.
7. Montgomery BL, Ritchie SA, 2002. Roof gutters: a key containerfor Aedes aegypti and Ochlerotatus notoscriptus (Diptera:Culicidae) in Australia. Am J Trop Med Hyg 67: 244–246.
8. Bar-Zeev M, 1958. The effect of temperature on the growth rateand survival of the immature stages of Aedes aegypti (L).Bull Entomol Res 49: 157–163.
9. Rueda LM, Patel KJ, Axtell RC, Stinner RE, 1990. Temperature-dependent development and survival rates of Culexquinquefasciatus and Aedes aegypti (Diptera: Culicidae). J MedEntomol 27: 892–898.
10. Tun-Lin W, Burkot TR, Kay BH, 2000. Effects of tempera-ture and larval diet on development rates and survival of thedengue vector Aedes aegypti in north Queensland, Australia.Med Vet Entomol 14: 31–37.
11. Mohammed A, Chadee DD, 2011. Effects of different tempera-ture regimens on the development of Aedes aegypti (L.)(Diptera: Culicidae) mosquitoes. Acta Trop 119: 38–43.
12. Yasuno M, Tonn RJ, 1970. A study of biting habits of Aedesaegypti in Bangkok, Thailand. Bull World Health Organ 43:319–325.
13. Pant CP, Yasuno M, 1973. Field studies on the gonotrophic cycleof Aedes aegypti in Bangkok, Thailand. J Med Entomol 10:219–223.
14. Watts DM, Burke DS, Harrison BA, Whitmire RE, Nisalak A,1986. Effect of temperature on the vector efficiency ofAedes aegypti for dengue 2 virus. Am J Trop Med Hyg 36:143–152.
15. Thu HM, Aye KM, Thein S, 1998. The effect of temperatureand humidity on dengue virus propagation in Aedes aegyptimosquitoes. Southeast Asian J Trop Med Public Health 29:280–284.
16. Cazelles B, Chavez M, McMichael AJ, Hales S, 2005. Non-stationary influence of El Nino on the synchronous dengueepidemics in Thailand. PLoS Med 2: e106.
17. Colon-Gonzalez FJ, Lake IR, Bentham G, 2011. Climate vari-ability and dengue fever in warm and humid Mexico. Am JTrop Med Hyg 84: 757–763.
18. Gagnon AS, Bush ABG, Smoyer-Tomic KE, 2001. Dengueepidemics and the El Nino Southern Oscillation. Clim Res 19:35–43.
19. Hay SI, Myers MF, Burke DS, Vaughn DW, Endy T, Ananda N,Shanks GD, Snow RW, Rogers DJ, 2000. Etiology of inter-epidemic periods of mosquito-borne disease. Proc Natl AcadSci USA 97: 9335–9339.
20. Keating J, 2001. An investigation into the cyclical incidenceof dengue fever. Soc Sci Med 53: 1587–1597.
21. Thammapalo S, Chongsuwiwatwong V, McNeil D, Geater A,2005. The climatic factors influencing the occurrence ofdengue hemorrhagic fever in Thailand. Southeast Asian JTrop Med Public Health 36: 191–196.
22. Johansson MA, Cummings DAT, Glass GE, 2009. Multiyear cli-mate variability and dengue—El Nino Southern Oscillation,weather, and dengue incidence in Puerto Rico, Mexico, andThailand: a longitudinal data analysis. PLoS Med 6: e1000168.
23. Wearing HJ, Rohani P, 2006. Ecological and immunologicaldeterminants of dengue epidemics. Proc Natl Acad Sci USA103: 11802–11807.
24. Gubler DJ, 2002. Epidemic dengue/dengue hemorrhagic feveras a public health, social and economic problem in the 21stcentury. Trends Microbiol 10: 100–103.
25. Focks DA, Barrera R, 2006. Dengue Transmission Dynamics:Assessment and Implications for Control. Report on the Scien-tific Working Group on Dengue, 2006. Geneva: World HealthOrganization, 92–109.
26. Kuhn K, Campbell-Lendrum D, Haines A, Cox J, 2005. UsingClimate to Predict Infectious Disease Epidemics. Available at:http://www.who.int/globalchange/publications/infectdiseases/en/index.html. Accessed July 24, 2012.
27. Thomson MC, Mason SJ, Phindela T, Connor SJ, 2005. Use ofrainfall and sea surface temperature monitoring for malariaearly warning in Botswana. Am J Trop Med Hyg 73: 214–221.
28. Kovats RS, Bouma MJ, Hajat S, Worrall E, Haines A, 2003.El Nino and health. Lancet 362: 1481–1489.
29. Schreiber KV, 2001. An investigation of relationships betweenclimate and dengue using a water budgeting technique. Int JBiometeorol 45: 81–89.
30. Lowe R, Bailey TC, Stephenson DB, Graham RJ, Coelho CAS,Sa Carvalho M, Barcellos C, 2011. Spatio-temporal modelingof climate-sensitive disease risk: towards an early warningsystem for dengue in Brazil. Comput Geosci 37: 371–381.
31. Yu H-L, Yang S-J, Yen H-J, Christakos G, 2011. A spatio-temporal climate-based model of early dengue fever warningin southern Taiwan. Stochastic Environ Res Risk Assess 25:485–494.
32. Pourrut P, Nouvelot JF, 1995. Anomalies and extreme climatephenomena. Pourrut P, ed. Water in Ecuador: Climate, Precipi-tation, Runoff. Quito, Ecuador: RR Associated Editors, 67–76.
33. Rossel F, Le Goulven P, Cadier E, 1999. Areal distribution of theinfluence of ENSO on the annual rainfall in Ecuador. Journalof Water Science 12: 183–200.
34. Rossel F, Cadier E, Gomez G, 1996. Flooding in coastal Ecuador:causes; exisiting and future protection projects. Bulletin of theFrench Institute of Andean Studies 25: 399–420.
35. INAMHI, 2012. Rainfall during the trimester January - March 2012on the coast of Ecuador. Guayaquil, Ecuador. National Institute
980 STEWART-IBARRA AND LOWE

of Meteorology and Hydrology (INAMHI) Decentralized Pro-cess, Guayas Watershed.
36. Adler RF, Huffman GJ, Chang A, Ferraro R, Xie P, Janowiak J,Rudolf B, Schneider U, Curtis S, Bolvin D, Gruber A,Susskind J, Arkin P, 2003. The Version 2 Global PrecipitationClimatology Project (GPCP) monthly precipitation analysis(1979–present). Journal of Hydrometeorology 4: 1147–1167.
37. NOAA, 2012. National Oceanic and Atmospheric Administration(United Stated Department of Commerce) Climate PredictionCenter. Cold and Warm Episodes by Season (1951–present).Available at: http://www.cpc.ncep.noaa.gov/products/analysis_monitoring/ ensostuff/ensoyears.shtml. Accessed July 24, 2012.
38. Lowe R, Bailey TC, Stephenson DB, Jupp TE, Graham RJ,Barcellos C, Carvalho MS, 2013. The development of an earlywarning system for climate-sensitive disease risk with a focuson dengue epidemics in Southeast Brazil. Stat Med 32: 864–883.
39. Cameron AC, Trivedi PK, 1998. Regression Analysis of CountData. Econometric Society Monograph No 30. New York, NY:Cambridge University Press, 434.
40. Hilbe JM, 2011. Negative Binomial Regression. New York, NY:Cambridge University Press, 264.
41. McCulloch CE, Neuhaus JM, 2001. Generalized Linear MixedModels. New York, NY: John Wiley & Sons, Inc., 358.
42. Gilks WR, Richardson S, Spiegelhalter DJ, 1996. Markov ChainMonte Carlo in Practice. Boca Raton, FL: Chapman & Hall/CRC, 486.
43. Spiegelhalter DJ, Best NG, Carlin BP, Van Der Linde A, 2002.Bayesian measures of model complexity and fit. J R Stat SocSeries B Stat Methodol 64: 583–639.
44. Kramer M, 2005. R2 statistics for mixed models. Proceedings ofthe Conference on Applied Statistics in Agriculture 17: 148–160.
45. Gelman A, Meng X, Stern H, 1996. Posterior predictive assess-ment of model fitness via realized discrepancies. Stat Sin 6:733–759.
46. Chowell G, Sanchez F, 2006. Climate-based descriptive modelsof dengue fever: the 2002 epidemic in Colima, Mexico. J EnvironHealth 68: 40.
47. Hurtado-Dıaz M, Riojas-Rodrıguez H, Rothenberg SJ, Gomez-Dantes H, Cifuentes E, 2007. Impact of climate variability
on the incidence of dengue in Mexico. Trop Med Int Health12: 1327–1337.
48. Chowell G, Torre CA, Munayco-Escate C, Suarez-Ognio L,Lopez-Cruz R, Hyman JM, Castillo-Chavez C, 2008. Spatialand temporal dynamics of dengue fever in Peru: 1994–2006.Epidemiol Infect 136: 1667–1677.
49. Scott TW, Amerasinghe PH, Morrison AC, Lorenz LH, ClarkGG, Strickman D, Kittayapong P, Edman JD, 2000. Lon-gitudinal studies of Aedes aegypti (Diptera: Culicidae) inThailand and Puerto Rico: blood feeding frequency. J MedEntomol 37: 89–101.
50. Nagao Y, Thavara U, Chitnumsup P, Tawatsin A, Chansang C,Campbell-Lendrum D, 2003. Climatic and social risk factorsfor Aedes infestation in rural Thailand. Trop Med Int Health8: 650–659.
51. Lambrecht L, Paaijmans KP, Fansiri T, Carrington LB, KramerLD, Thomas MB, Scott TW, 2011. Impact of daily temper-ature fluctuations on dengue virus transmission by Aedesaegypti. Proc Natl Acad Sci USA 108: 7461–7465.
52. Barrera R, Amador M, MacKay AJ, 2011. Population dynamics ofAedes aegypti and dengue as influenced by weather and humanbehavior in San Juan, Puerto Rico.PLoS Negl Trop Dis 5: e1378.
53. Hayden MH, Uejio CK, Walker K, Ramberg F, Moreno R,Rosales C, Gameros M, Mearns LO, Zielinski-Gutierrez E,Janes CR, 2010. Microclimate and human factors in the diver-gent ecology of Aedes aegypti along the Arizona, US/Sonora,MX border. Ecohealth 7: 64–77.
54. Pontes RJ, Freeman J, Oliveira-Lima JW, Hodgson JC, SpielmanA, 2000. Vector densities that potentiate dengue outbreaksin a Brazilian city. Am J Trop Med Hyg 62: 378–383.
55. Bamston AG, Chelliah M, Goldenberg SB, 1997. Documentationof a highly ENSO-related SST region in the equatorial Pacific:research note. Atmosphere-ocean 35: 367–383.
56. Rossel F, Cadier E, 2009. El Nino and prediction of anomalousmonthly rainfalls in Ecuador. Hydrol Process 23: 3253–3260.
57. Jupp TE, Lowe R, Coelho CA, Stephenson DB, 2012. On thevisualization, verification and recalibration of ternary proba-bilistic forecasts. Philos Transact A Math Phys Eng Sci 370:1100–1120.
CLIMATE AND NON-CLIMATE DRIVERS OF DENGUE 981