Embed Size (px)
Citation preview

CDR Program NOAA MSU Mean Layer Temperature C-ATBD <TBD By CDR Program> Rev. 1 03/01/2014
1
Climate Data Record (CDR) Program
Climate Algorithm Theoretical Basis Document (C-ATBD)
NOAA MSU Mean Layer Temperature
CDR Program Document Number: TBD by CDR Program Document Manager Originator Document Number: N/A Revision 1 / March 1, 2014 DSR Number: DSR-XXX by CDR Program Document Manager

CDR Program NOAA MSU Mean Layer Temperature C-ATBD <TBD By CDR Program> Rev. 1 03/01/2014
2
REVISION HISTORY
Rev. Author DSR No. Description Date
1 Cheng-Zhi Zou and Jian Li
NOAA/NESDIS/STAR
DSR-XXX Initial Submission to CDR Program 03/01/2014

CDR Program NOAA MSU Mean Layer Temperature C-ATBD <TBD By CDR Program> Rev. 1 03/01/2014
3
TABLE of CONTENTS
1. INTRODUCTION .............................................................................................................................. 7
1.1 Purpose ..................................................................................................................................................... 7
1.2 Definitions................................................................................................................................................. 7
1.3 Document Maintenance ............................................................................................................................ 8
2. OBSERVING SYSTEMS OVERVIEW .......................................................................................... 10
2.1 Products Generated ................................................................................................................................ 10
2.2 Instrument Characteristics ...................................................................................................................... 10
3. ALGORITHM DESCRIPTION ...................................................................................................... 13
3.1 Algorithm Overview ................................................................................................................................ 13
3.2 Processing Outline................................................................................................................................... 14
3.2.1 Overall Processing Outline ..................................................................................................................... 14
3.2.2 System configuration ............................................................................................................................. 15
3.2.3 Preparing Ancillary data ......................................................................................................................... 16
3.2.4 Converting Level-1C orbit data to Level-3 gridded data ........................................................................ 17
3.2.5 Removing inter-satellite biases .............................................................................................................. 18
3.3 Algorithm Input ....................................................................................................................................... 19
3.3.1 Primary Sensor Data .............................................................................................................................. 19
3.3.2 Ancillary Data ......................................................................................................................................... 19
3.3.3 Derived Data .......................................................................................................................................... 19
3.3.4 Forward Models ..................................................................................................................................... 20
3.4 Theoretical Description ........................................................................................................................... 20
3.4.1 Physical and Mathematical Description ................................................................................................. 20
3.4.2 Data Merging Strategy ........................................................................................................................... 22
3.4.3 Numerical Strategy ................................................................................................................................ 22
3.4.4 Calculations ............................................................................................................................................ 23
3.4.5 Look-Up Table Description ..................................................................................................................... 23
3.4.6 Parameterization ................................................................................................................................... 24
3.4.7 Algorithm Output ................................................................................................................................... 24
4. TEST DATASETS AND OUTPUTS ............................................................................................. 25
4.1 Test Input Datasets ................................................................................................................................. 25
4.2 Test Output Analysis ............................................................................................................................... 25
4.2.1 Reproducibility and Accuracy ................................................................................................................ 25
4.2.2 Error Budget ........................................................................................................................................... 27
5. PRACTICAL CONSIDERATIONS ................................................................................................ 29
5.1 Numerical Computation Considerations .................................................................................................. 29
5.2 Programming and Procedural Considerations ......................................................................................... 29
5.3 Quality Assessment and Diagnostics ....................................................................................................... 29
5.4 Exception Handling ................................................................................................................................. 30
CDR Program NOAA MSU Mean Layer Temperature C-ATBD <TBD By CDR Program> Rev. 1 03/01/2014
4
5.5 Algorithm Validation ............................................................................................................................... 30
5.6 Processing Environment and Resources .................................................................................................. 30
6. ASSUMPTIONS AND LIMITATIONS ........................................................................................ 32
6.1 Algorithm Performance ........................................................................................................................... 32
6.2 Sensor Performance ................................................................................................................................ 32
7. FUTURE ENHANCEMENTS......................................................................................................... 33
8. REFERENCES .................................................................................................................................. 34
APPENDIX A. ACRONYMS AND ABBREVIATIONS ................................................................... 35

CDR Program NOAA MSU Mean Layer Temperature C-ATBD <TBD By CDR Program> Rev. 1 03/01/2014
5
LIST of FIGURES
Figure 2-1 Weighting functions for the three MSU atmospheric channels that measure temperatures of
the middle-troposphere (TMT), upper-troposphere (TUT), and lower-stratosphere (TLS). The weighting
functions correspond to nadir observing conditions for the US standard atmospheric temperature profile
.................................................................................................................................................................... 11
Figure 3-1 High level flowchart of the MSU TCDR algorithm illustrating the main processing section. .... 15
Figure 3-2 Input parameter processing flowcharts for (a) generation of level-3 data of individual
satellites and (b) merged layer temperature TCDR for different channels ................................................ 16
Figure 3-3 Flowchart for processing IMICA calibrated Level-1c brightness temperature to generate Level-
3 gridded monthly temperature records for individual satellites .............................................................. 17
Figure 3-4 Flowchart for processing level-3 gridded monthly temperature records of all satellites to
generate merged deep-layer atmospheric temperature products ............................................................ 18
Figure 4-1 Global ocean-mean inter-satellite brightness temperature difference time series for MSU
channel 2 onboard TIROS-N through NOAA-14 derived from (a) the IMICA inter-calibrated radiances, and
(b) after applying all bias correction algorithms to the IMICA calibrated radiances. ................................. 26
LIST of TABLES
Table 2-1 Products generated in this CDR, which are 28 year-long, global monthly data with 2.5o
latitudes by 2.5o longitudes grid resolution ................................................................................................ 10
Table 2-2 MSU instrument parameters ...................................................................................................... 11
Table 3-1 MSU primary sensor data used for developing atmospheric layer temperature TCDR. The
dimension ‘xsize’ is the pixel number per scan-line (11 for MSU) and ‘ysize’ is the total scan-line number
in an orbital file. All these data are available in the NOAA MSU radiance FCDR orbital files. ................... 19
Table 4-1 Mean standard derivation (K) of global mean inter-satellite difference time series for
overlapping observations between all satellite pairs for both the IMICA calibrated (input) and after
applying all bias correction algorithms. ...................................................................................................... 26
Table 4-2 Global mean temperature trends (K/Decade) for 1978-2006 derived from global mean merging
and averages of spatial trends of the gridded products. ............................................................................ 27
Table 4-3 Mean layer temperature trends (K/Decade) during 1978-2006 derived from global ocean mean
and global land mean .................................................................................................................................. 27
Table 4-4 Error budget ................................................................................................................................ 28

CDR Program NOAA MSU Mean Layer Temperature C-ATBD <TBD By CDR Program> Rev. 1 03/01/2014
6
Table 5-1 MSU processing environment and resource requirements. ....................................................... 30
CDR Program NOAA MSU Mean Layer Temperature C-ATBD <TBD By CDR Program> Rev. 1 03/01/2014
7
1. Introduction
1.1 Purpose
The purpose of this document is to describe the algorithm submitted to the National Climatic Data Center (NCDC) by Cheng-Zhi Zou at NOAA/NESDIS/Center for Satellite Applications and Research that will be used to create the NOAA MSU Mean Layer Temperature Climate Data Record (CDR), using the Microwave Sounding Unit (MSU) onboard historical NOAA polar orbiting satellites TIROS-N through NOAA-14 . The actual algorithm is defined by the computer program (code) that accompanies this document, and thus the intent here is to provide a guide to understanding that algorithm, from both a scientific perspective and in order to assist a software engineer or end-user performing an evaluation of the code.
1.2 Definitions Following is a summary of the phrases and symbols used to define the algorithm.
Atmospheric Layer Temperature (or Mean Layer Temperature or Deep-Layer Atmospheric Temperature): Averaged brightness temperatures of those binned into grid cells within a predefined time interval. Since MSU brightness temperature comes from a weighted average of temperatures in a layer of the atmosphere with different levels within the layer having different weightings to the average, the gridded brightness temperature is thus interpreted as atmospheric layer temperature or mean layer temperature
Brightness Temperature: Satellite observation at the top of the atmosphere at each scan position; it is converted from Radiance using the Planck Function with instrument channel frequency as input
Radiance: Satellite observation of the radiation emitted to space from the earth and atmosphere; it is converted from raw counts data of satellite observations using instrument calibration equation. Refer to ‘CDRP C-ATBD: MSU/AMSU Radiances FCDR Derived from Integrated Microwave Inter-Calibration Approach’ for derivation of radiances from satellite raw counts observations
Diurnal Drift Correction: It adjusts the scene brightness temperatures at different observational times from all different satellites to the 12-noon local time using the following equation
TtTtT bunoonba ),(),( 12 XX
where
),( tTbu X = IMICA-calibrated, limb-adjusted Level-1C scene brightness
temperature at geo-location X and time t
),( 12 noonba tT X = the adjusted brightness temperature at the 12-noon local time
CDR Program NOAA MSU Mean Layer Temperature C-ATBD <TBD By CDR Program> Rev. 1 03/01/2014
8
),(),( 12 noonbsbs tTtTT XX = estimated diurnal anomaly from model
simulations
Removal of Warm Target Effect: Removing warm target effect requires solving the following multi-satellite regression equations:
)()( '' kTajTabbTT wkwjkjbuba
where
Tba = adjusted brightness temperatures after removing warm target effect
Tbu = IMICA-calibrated, limb-adjusted level-1c scene brightness temperature
'
wT = global ocean mean warm target temperature anomaly
j = satellite index running from TIROS-N through NOAA-14
k= satellite index running from TIROS-N through NOAA-14
b j= constant regression coefficients to be solved
bk= constant regression coefficients to be solved
aj = warm target factor for satellite j, a regression coefficient to be solved
ak=warm target factor for satellite k, a regression coefficient to be solved
Three types of data sets are frequently discussed in this document. Unless otherwise specified, these data types are defined as follows:
Level-1C data: Orbital data containing IMICA calibrated swath radiances at scan positions as well as other satellite geo-location and calibration information taken from satellite Level-1b files
Level-3 data: Gridded dataset generated from Level-1C data for individual satellites; they are actually the atmospheric layer temperature for individual satellites
Merged Layer Temperature Products: Merged Level-3 data products (layer temperature) from multiple satellites
1.3 Document Maintenance
MSU observation had stopped since 2007 and it was replaced by its successor, Advanced Microwave Sounding Unit (AMSU) since 1998. As such, the MSU-only product that is described in this document is not expected to be updated. Instead, frequent data

CDR Program NOAA MSU Mean Layer Temperature C-ATBD <TBD By CDR Program> Rev. 1 03/01/2014
9
and algorithm updates will be expected for the merged MSU and AMSU data products which will be documented by an independent C-ATBD. However, the algorithm for generating the atmospheric layer temperature Thematic Climate Data Record (TCDR) from MSU observations was based on current understanding of the data issues and bias characteristics of the observations. Improved understanding of the data issues may often occur. An update on the MSU-only algorithm and product may occur only if substantially improved understanding of the MSU data issues is available in the future which may result in substantially different conclusions from the data product described in this document.

CDR Program NOAA MSU Mean Layer Temperature C-ATBD <TBD By CDR Program> Rev. 1 03/01/2014
10
2. Observing Systems Overview
2.1 Products Generated
Three channel-based, monthly gridded atmospheric layer temperature TCDR are generated by using merging algorithms described in this document and previous publications. These are temperatures of middle-troposphere (TMT), upper-troposphere (TUT), and lower-stratosphere (TLS), corresponding to measurements from MSU channels 2, 3, and 4, respectively. Table 2-1 lists the vertical coverage and spatial resolution of these products. These products are derived from nine NOAA polar orbiting satellites, TRIOS-N and NOAA-6 through NOAA-14, covering time period from November 1978 through September 2006.
Table 2-1 Products generated in this CDR, which are 28 year-long, global monthly data with 2.5o latitudes by 2.5o longitudes grid resolution
Products MSU channels Vertical Layer Coverage
TMT (Temperature Middle Troposphere) 2 Surface-15km
TUT or TTS (Temperature Upper Troposphere or Temperature Troposphere Stratosphere)
3 3-20 km
TLS (Temperature Lower Stratosphere) 4 12-26km
2.2 Instrument Characteristics The MSU on board NOAA polar orbiting satellite series had been the primary
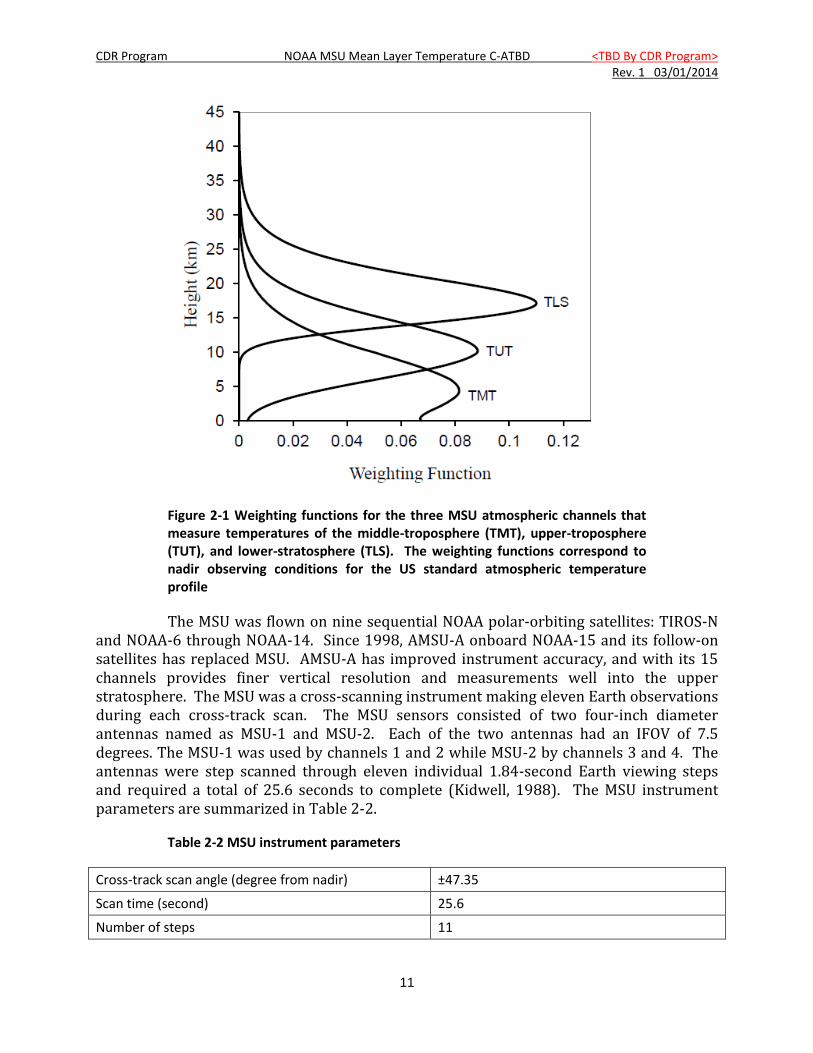
instruments for measuring upper-air temperature profiles under all weather conditions, excluding precipitation, during 1978-2007. MSU was a microwave Dicke radiometer with four-channels to make passive measurements in the 5.5 millimeter oxygen region. The four channels responded to the following spectral frequencies: 50.3, 53.74, 54.96, and 57.95 GHz, respectively, with a channel bandwidth of 200 MHz in each case and a typical NE∆T of 0.3K. The radiance measured by each frequency channel comes from a different layer of the atmosphere, depending on the strength of the absorption at that frequency. The percentage contribution of individual levels within the layer to the measured layer temperature is represented by a vertical weighting function, which is typically bell-shaped, peaking at a certain level in the height coordinate (Figure 2-1; the lower parts of the near surface channels are often cut off by the surface). Among these, MSU channel 1 (50.3 GHz) measured surface temperature, and channels 2, 3 and 4 measured temperatures of the middle-troposphere (TMT), upper-troposphere (TUT), and lower-stratosphere (TLS) with their weighting functions peaking respectively near 550, 250, and 100 hPa (Figure 2-1).
CDR Program NOAA MSU Mean Layer Temperature C-ATBD <TBD By CDR Program> Rev. 1 03/01/2014
11
Figure 2-1 Weighting functions for the three MSU atmospheric channels that measure temperatures of the middle-troposphere (TMT), upper-troposphere (TUT), and lower-stratosphere (TLS). The weighting functions correspond to nadir observing conditions for the US standard atmospheric temperature profile
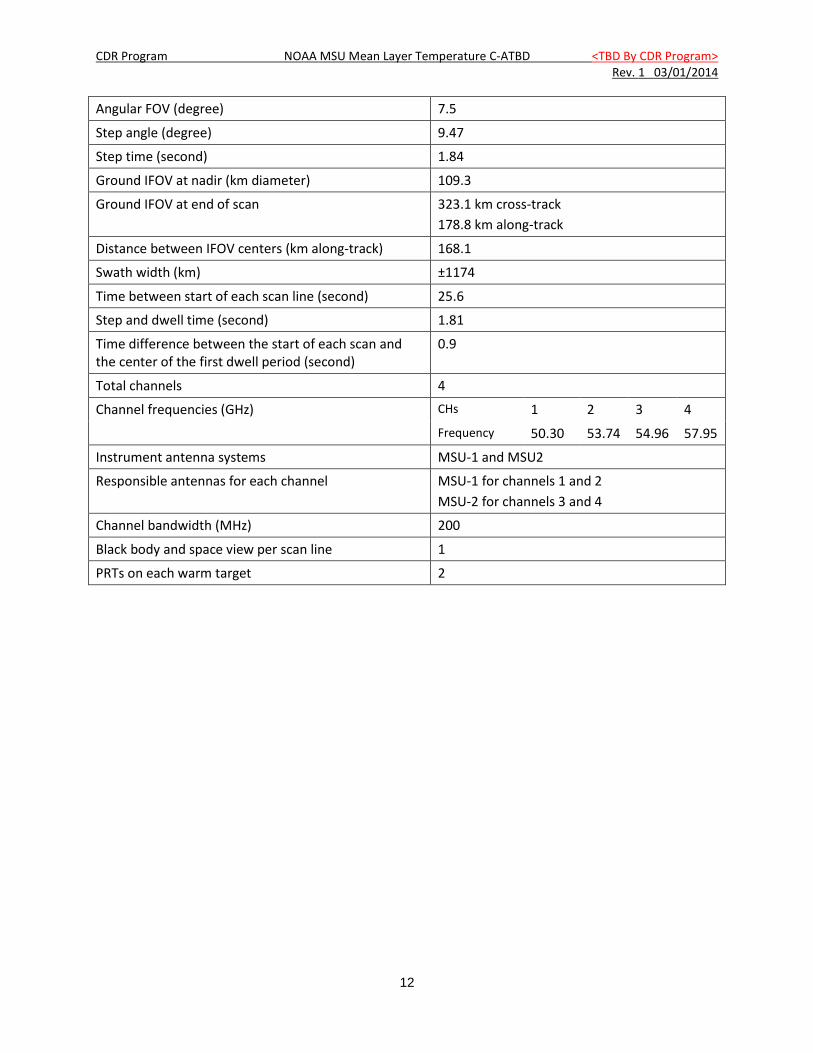
The MSU was flown on nine sequential NOAA polar-orbiting satellites: TIROS-N and NOAA-6 through NOAA-14. Since 1998, AMSU-A onboard NOAA-15 and its follow-on satellites has replaced MSU. AMSU-A has improved instrument accuracy, and with its 15 channels provides finer vertical resolution and measurements well into the upper stratosphere. The MSU was a cross-scanning instrument making eleven Earth observations during each cross-track scan. The MSU sensors consisted of two four-inch diameter antennas named as MSU-1 and MSU-2. Each of the two antennas had an IFOV of 7.5 degrees. The MSU-1 was used by channels 1 and 2 while MSU-2 by channels 3 and 4. The antennas were step scanned through eleven individual 1.84-second Earth viewing steps and required a total of 25.6 seconds to complete (Kidwell, 1988). The MSU instrument parameters are summarized in Table 2-2.
Table 2-2 MSU instrument parameters
Cross-track scan angle (degree from nadir) ±47.35
Scan time (second) 25.6
Number of steps 11
CDR Program NOAA MSU Mean Layer Temperature C-ATBD <TBD By CDR Program> Rev. 1 03/01/2014
12
Angular FOV (degree) 7.5
Step angle (degree) 9.47
Step time (second) 1.84
Ground IFOV at nadir (km diameter) 109.3
Ground IFOV at end of scan 323.1 km cross-track
178.8 km along-track
Distance between IFOV centers (km along-track) 168.1
Swath width (km) ±1174
Time between start of each scan line (second) 25.6
Step and dwell time (second) 1.81
Time difference between the start of each scan and the center of the first dwell period (second)
0.9
Total channels 4
Channel frequencies (GHz) CHs 1 2 3 4
Frequency 50.30 53.74 54.96 57.95
Instrument antenna systems MSU-1 and MSU2
Responsible antennas for each channel MSU-1 for channels 1 and 2
MSU-2 for channels 3 and 4
Channel bandwidth (MHz) 200
Black body and space view per scan line 1
PRTs on each warm target 2

CDR Program NOAA MSU Mean Layer Temperature C-ATBD <TBD By CDR Program> Rev. 1 03/01/2014
13
3. Algorithm Description
3.1 Algorithm Overview
The main purpose of the merging algorithm is to derive homogeneous temperature CDR from the sequential overlapping MSU observations onboard NOAA polar orbiting satellites channel by channel. Deriving such time series requires a number of steps:
Inter-calibrating the satellite sensors
Removing instrument temperature effects on observations
Adjusting the observations to a common reference time (usually chosen as local noon time) to minimize diurnal effect related to satellite orbital drifts
Adjusting observations made at different viewing angles to nadir views (limb effect)
Removing residual inter-satellite biases and their drifts
The Level-1c radiances data used for deriving the layer temperature TCDR were already inter-calibrated by the Integrated Microwave Inter-Calibration Approach (IMICA, formerly known as simultaneous nadir overpass approach; Zou and Wang 2013). In addition, limb-adjusted brightness temperatures are also provided in the IMICA calibrated Level-1c files. As such, only adjustments other than sensor inter-calibrations and limb-adjustments were needed for satellite merging. The IMICA calibrated MSU radiances and limb adjustments were described in details in the C-ATBD associated with the MSU Level-1c radiance dataset (Zou and Wang 2013). This has substantially simplified the processing procedure for developing MSU layer temperature TCDR. In summary, the following steps and algorithms are needed to derive the atmospheric layer temperature TCDR:
1. Extracting limb-adjusted MSU swath brightness temperatures on scan positions for channels 2, 3 and 4 from the IMICA calibrated MSU orbital Level-1c datasets
2. Adjusting the MSU brightness temperatures for diurnal drift effect at each scan position
3. Binning limb- and diurnal-adjusted brightness temperatures at scan positions into grid cells of 2.50x2.50 spatial resolution in monthly interval for each satellite and then averaging the binned data at each grid cell to produce Level-3 layer temperature data for each satellite
4. Removing residual inter-satellite biases including instrument temperature effect using satellite overlap observations of the Level-3 data

CDR Program NOAA MSU Mean Layer Temperature C-ATBD <TBD By CDR Program> Rev. 1 03/01/2014
14
5. Bias-removed, multiple satellite Level-3 temperature data are then averaged to generate a 28-year long, merged and homogeneous layer temperature TCDR from 1978 to 2007. The final product is saved as NetCDF format
3.2 Processing Outline
This section is the general description of the MSU layer temperature production system with a set of multiple flowcharts.
3.2.1 Overall Processing Outline
The overall processing outline of MSU atmospheric layer temperature TCDR algorithm is summarized in Figure 3-1. Each of the components is described in the following subsections.

CDR Program NOAA MSU Mean Layer Temperature C-ATBD <TBD By CDR Program> Rev. 1 03/01/2014
15
Figure 3-1 High level flowchart of the MSU TCDR algorithm illustrating the main processing section
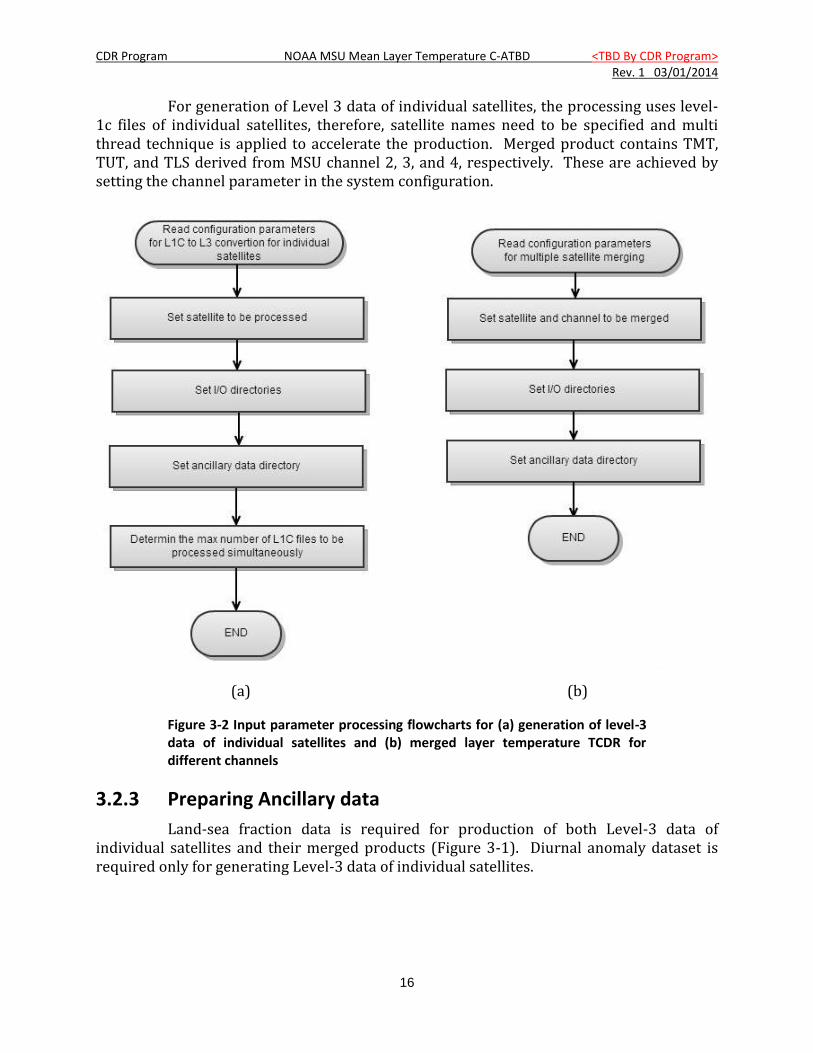
3.2.2 System configuration
The system configuration is designed separately for the generation of level 3 layer temperature data of individual satellites and their merged products (Figures 3-2a and 3-2b). Both configurations are common in setting I/O directories and ancillary data directory.
CDR Program NOAA MSU Mean Layer Temperature C-ATBD <TBD By CDR Program> Rev. 1 03/01/2014
16
For generation of Level 3 data of individual satellites, the processing uses level-1c files of individual satellites, therefore, satellite names need to be specified and multi thread technique is applied to accelerate the production. Merged product contains TMT, TUT, and TLS derived from MSU channel 2, 3, and 4, respectively. These are achieved by setting the channel parameter in the system configuration.
(a) (b)
Figure 3-2 Input parameter processing flowcharts for (a) generation of level-3 data of individual satellites and (b) merged layer temperature TCDR for different channels
3.2.3 Preparing Ancillary data
Land-sea fraction data is required for production of both Level-3 data of individual satellites and their merged products (Figure 3-1). Diurnal anomaly dataset is required only for generating Level-3 data of individual satellites.
CDR Program NOAA MSU Mean Layer Temperature C-ATBD <TBD By CDR Program> Rev. 1 03/01/2014
17
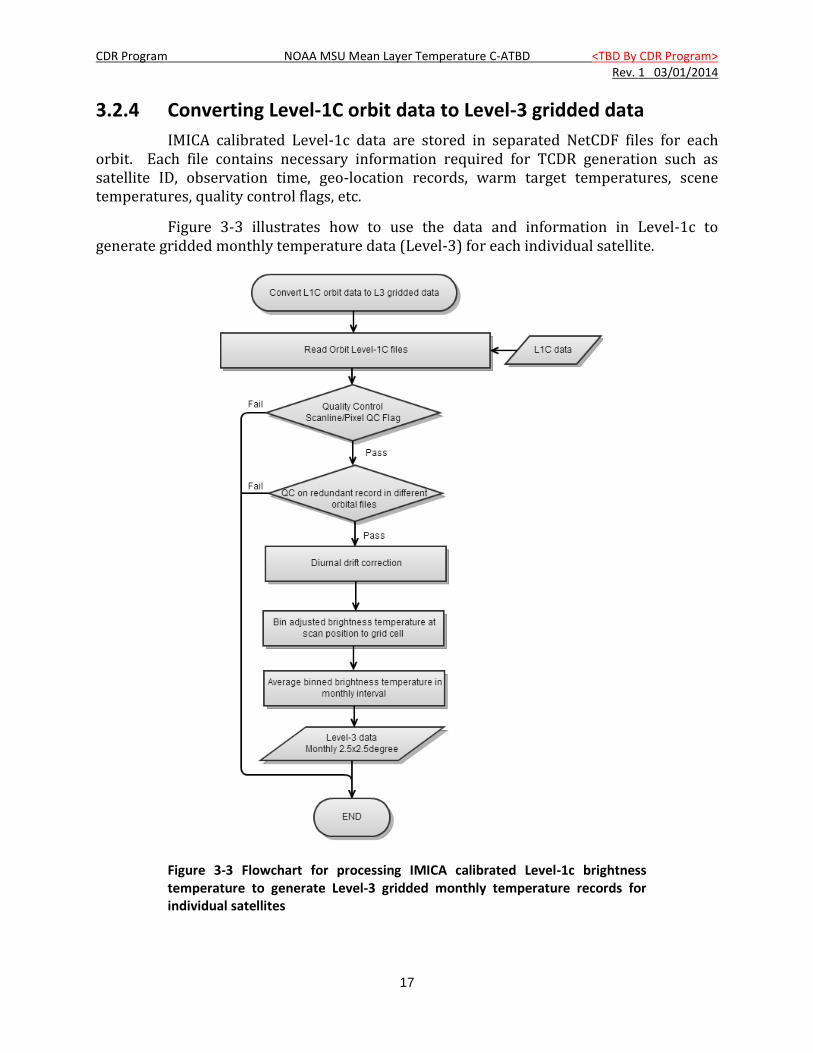
3.2.4 Converting Level-1C orbit data to Level-3 gridded data
IMICA calibrated Level-1c data are stored in separated NetCDF files for each orbit. Each file contains necessary information required for TCDR generation such as satellite ID, observation time, geo-location records, warm target temperatures, scene temperatures, quality control flags, etc.
Figure 3-3 illustrates how to use the data and information in Level-1c to generate gridded monthly temperature data (Level-3) for each individual satellite.
Figure 3-3 Flowchart for processing IMICA calibrated Level-1c brightness temperature to generate Level-3 gridded monthly temperature records for individual satellites
CDR Program NOAA MSU Mean Layer Temperature C-ATBD <TBD By CDR Program> Rev. 1 03/01/2014
18
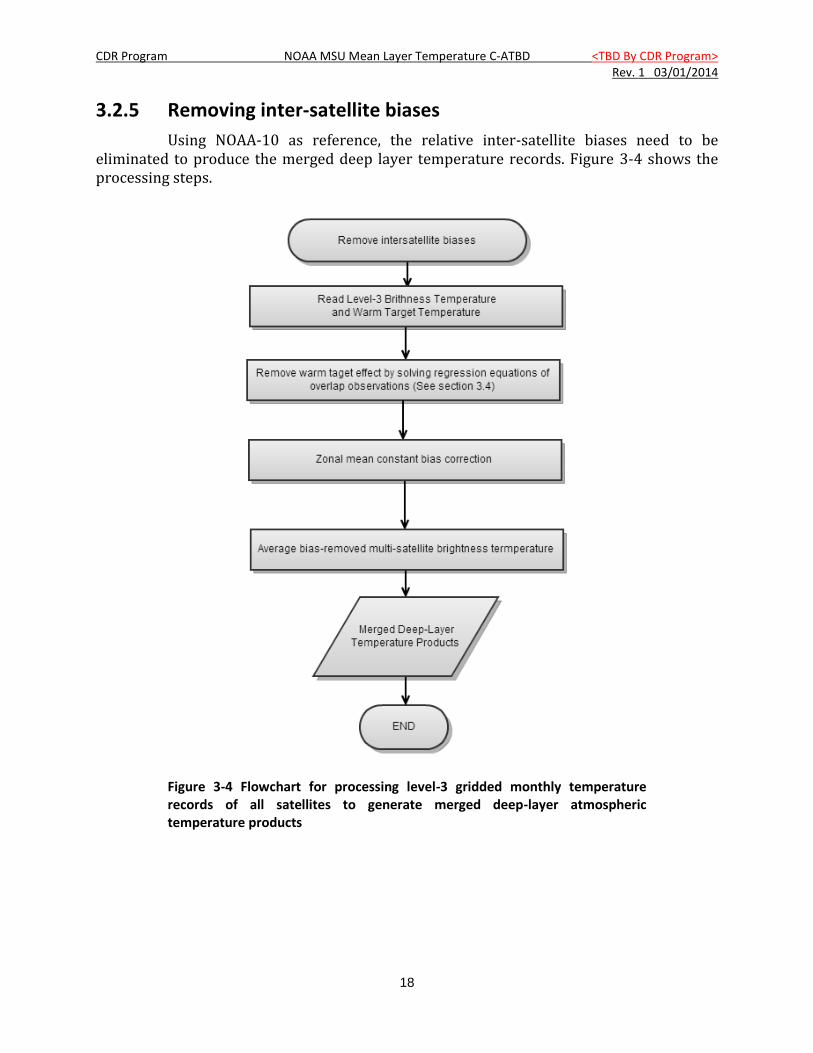
3.2.5 Removing inter-satellite biases
Using NOAA-10 as reference, the relative inter-satellite biases need to be eliminated to produce the merged deep layer temperature records. Figure 3-4 shows the processing steps.
Figure 3-4 Flowchart for processing level-3 gridded monthly temperature records of all satellites to generate merged deep-layer atmospheric temperature products

CDR Program NOAA MSU Mean Layer Temperature C-ATBD <TBD By CDR Program> Rev. 1 03/01/2014
19
3.3 Algorithm Input
3.3.1 Primary Sensor Data
The primary sensor data used to derive the atmospheric layer temperature TCDR were the IMICA calibrated, limb-adjusted brightness temperatures saved in the NOAA MSU radiance FCDR orbital files which were downloaded from the NOAA NCDC CDR website (address: http://www.ncdc.noaa.gov/cdr/operationalcdrs.html). Other primary sensor data also needed were warm target temperatures, geo-location information, and sensor quality flags. These were orbital swath data for each scan positions (Table 3-1). Detailed characteristics of the IMICA calibrated brightness temperatures can be found in the C-ATBD for NOAA MSU FCDR (Zou and Wang 2013) available from the NDCD CDR website (http://www.ncdc.noaa.gov/cdr/operationalcdrs.html).
Table 3-1 MSU primary sensor data used for developing atmospheric layer temperature TCDR. The dimension ‘xsize’ is the pixel number per scan-line (11 for MSU) and ‘ysize’ is the total scan-line number in an orbital file. All these data are available in the NOAA MSU radiance FCDR orbital files.
Name Type Description Dimension
Limb-adjusted brightness temperature
Input Limb-adjusted, IMICA calibrated brightness temperature for MSU channels 2, 3, and 3.
pixel (xsize, ysize)
Warm target temperature
Input Warm target temperatures, average of available good PRT readings
pixel (xsize, ysize)
Latitude Input Pixel center latitude pixel (xsize, ysize)
Longitude Input Pixel center longitude pixel (xsize, ysize)
QC flags Input quality control flags from level-1c data pixel (xsize, ysize)
3.3.2 Ancillary Data
The algorithm requires two sets of ancillary data
i. Land-sea mask [A grid cell is considered as ocean (land) if the ocean percentage in the grid cell is greater(smaller) than 50%]
ii. Diurnal anomaly dataset for diurnal drift correction (Available in the system package for generation of layer temperature TCDR)
3.3.3 Derived Data
The IMICA calibrated MSU brightness temperatures (radiances) were actually derived data from satellite raw counts data. The derivation procedure was described in

CDR Program NOAA MSU Mean Layer Temperature C-ATBD <TBD By CDR Program> Rev. 1 03/01/2014
20
details in the C-ATBD for NOAA radiance MSU FCDR (Zou and Wang 2013, available from the NCDC CDR website for MSU FCDR) and related publications (Zou et al. 2006, 2009, and 2010). These IMICA calibrated radiances or brightness temperature are treated as primary sensor data as described in Section 3.3.1 since they were directly extracted from the MSU radiance FCDR orbital data files.
3.3.4 Forward Models
N/A
3.4 Theoretical Description This section reviews various bias correction algorithms for developing merged
MSU atmospheric layer temperature TCDR.
3.4.1 Physical and Mathematical Description
Development of atmospheric temperature TCDR involved proper treatment of errors from several different sources. These included, but were not limited to, incident angle effect, diurnal drift errors, warm target effect, short overlaps between certain satellite pairs, earth-location dependency in biases, orbital-decay and residual biases left from imperfect instrument calibration. Adjustment algorithms for these effects had been developed by different investigators for TCDR development. In the following, the physics and algorithms implemented in the NOAA MSU mean layer temperature TCDR are briefly described.
3.4.1.1 Limb Adjustment
A limb-correction adjusts different incident angles of the off-nadir footprints to the nadir direction. This adjustment is necessary for use of the off-nadir footprints in the time series to increase observational samples and reduce noise and sampling-related biases. Limb-adjustment algorithms and coefficients have been developed by Goldberg et al. (2001) for MSU satellites using statistical methods. Zou et al. (2009) examined the impact of the limb-adjustment on the MSU time series and found robust trend results when different limb-corrected footprints were included in the time series. In developing NOAA MSU Level-1c radiance FCDR datasets, limb-adjustment based on Goldberg et al. (2001) approach was applied to the IMICA calibrated radiances for each scan positions. These limb-adjusted radiances were saved in the corresponding MSU Level-1c orbital files which were directly extracted and used in the development of merged MSU layer temperature products. Therefore, limb-adjustment was not part of the merging algorithms as provided in this software package.
3.4.1.2 Diurnal Drift Correction
The diurnal drift effect was caused by satellite orbital drifts which resulted in changes in local observational time that, if not corrected, may introduce false climate trend by introducing diurnal trend into it. Orbital differences between morning and afternoon satellites also caused differences in observational time. Averages of satellite ascending and

CDR Program NOAA MSU Mean Layer Temperature C-ATBD <TBD By CDR Program> Rev. 1 03/01/2014
21
descending orbits cancel out the diurnal mode in the drift effects, but the asymmetric semi-diurnal mode between day and night in the diurnal changes cannot be canceled out in the averaging process. Its effect is particularly large for land areas of the mid-tropospheric channel (MSU channel 2) where diurnal amplitude is large.
Techniques for removing the diurnal-drift effect in this CDR development were to adjust the scene brightness temperatures at different observational times from all different satellites to the 12-noon local time before binning them into grid cells. This process is expressed by
TtTtT bnoonba ),(),( 12 XX (1)
where ),( tTb X represents the IMICA-calibrated, limb-adjusted Level-1c scene brightness
temperature at time t and geographic location X, ),( 12 noonba tT X the adjusted brightness
temperature at the 12-noon local time, and ),(),( 12 noonbsbs tTtTT XX an estimated
diurnal anomaly used for the adjustment. The diurnal anomaly is a function of time and geo-location. In this CDR, the Remote Sensing Systems (RSS) diurnal anomalies were adopted in the correction. The RSS diurnal anomaly was a monthly mean hourly dataset developed from climate model simulations (Mears et al. 2003). The dataset may contain potential errors related to climate modeling uncertainties. To minimize these uncertainties, a diurnal scaling factor was introduced. The scaling factor was found to be 0.875 by minimizing inter-satellite differences over land (Zou and Wang 2010), which resulted in best fitting of multi-satellite overlap observations over land and consistent temperature trends between land and oceans (Zou and Wang 2010).
The above process effectively eliminated diurnal drift effects for TMT. TUT and TLS did not include diurnal drift adjustment since its effect was negligible for these channels (Zou et al. 2009; Zou and Wang 2010).
3.4.1.3 Instrument temperature variability in radiances
The warm target was an onboard blackbody used to calibrate the MSU raw observations for obtaining level-1c radiances. The warm target temperature was measured by the Platinum Resistance Thermometer (PRT) embedded on the blackbody. However, this temperature incurred a large variability and trend due to solar heating on the instrument, which originated from seasonal solar angle changes relative to the satellite orbit normal over a year and its yearly differences due to orbital-drift (Zou and Wang 2011). This variability and trend was mostly removed by IMICA level-1c calibration (Zou et al. 2009, Zou and Wang 2010, 2011), however, small residual variability and biases may still exist due to imperfect calibration. These small residual biases need to be further removed before merging the satellite data for TCDR generation. Christy et al. (2000) developed an empirical correction algorithm to remove radiance variability due to this warm target effect. This approach finds a best fit empirical relationship between the correction term of the Level-3 gridded brightness temperature and warm target temperatures and then removes the best fit from the unadjusted time series. It was shown
CDR Program NOAA MSU Mean Layer Temperature C-ATBD <TBD By CDR Program> Rev. 1 03/01/2014
22
that using this empirical approach on top of the IMICA level-1c calibration yielded stable MSU trends (Zou and Wang 2010).
Using Tba and Tbu to respectively represent adjusted and unadjusted brightness temperatures, this empirical approach can be mathematically expressed as
)()( '' kTajTabbTT wkwjkjbuba (2)
where '
wT denotes the global ocean mean warm target temperature anomaly, and the
subscripts j and k represent satellite indexes in a satellite pair. The satellites j and k went through all NOAA polar orbiting satellites from TRIOS-N to NOAA-14. This forms a set of multiple satellite regression questions. Assuming NOAA-10 as a reference satellite so that b(NOAA-10)=0, then the constant (bj –bk) between satellites j and k and the target factors aj and ak for all other satellites were solved simultaneously from these multiple satellite regression equations using ocean-mean overlapping observations.
3.4.1.4 Correction of the Earth-Location Dependent Biases
Although IMICA calibration minimized inter-satellite biases in the Level-1c radiance data, zonal dependent inter-satellite biases may still exist for certain channels on certain satellites in the Level-3 gridded time series (Zou et al. 2009). This occurred because the nonlinearity of the Level-1c calibration equation was assumed to be of quadratic type. It is possible that higher order nonlinearities exist for certain channels and these unresolved nonlinearities may cause inter-satellite biases to depend on latitudes (Zou et al. 2009). To remove these biases, a zonal dependent constant bias correction was always applied as a final step before merging the satellite data. This correction ensures inter-satellite biases at all latitudes to be minimized so that more reliable regional trends may be obtained from the merged time series.
3.4.2 Data Merging Strategy
After applying the set of adjustments mentioned in the previous sections, the mean of the inter-satellite biases was numerically close to zero. The standard deviation of the inter-satellite biases was also significantly reduced compared with unadjusted data. As a result, the MSU layer temperature data from different spacecrafts can be treated as a homogenous CDR and then these observations were simply averaged on each grid cells to obtain a merged layer temperature TCDR.
3.4.3 Numerical Strategy
Most of the bias adjustment procedures are straightforward in numerical calculations once the IMICA level-1c radiances are extracted from MSU radiance FCDR data files. However, removing warm target temperature effect requires solving a set of multiple satellite regression equations. This requires a computer system to contain an internal library which has a software program to be called directly for solving multiple linear equations.

CDR Program NOAA MSU Mean Layer Temperature C-ATBD <TBD By CDR Program> Rev. 1 03/01/2014
23
3.4.4 Calculations
The algorithm steps for generating the MSU atmospheric layer temperature records are as follows:
1) Read ancillary datasets including land-sea fraction and diurnal anomaly dataset
2) Processing each MSU level-1c orbital file
Read in information including quality control flags, geo-location, observational time, warm target temperature, scene temperature, etc.
Continue processing qualified data records
Skip redundant temperature records
Diurnal drift correction for MSU channel 2
Bin the warm target temperature and scene brightness temperature into corresponding time slots and grid cells
3) Repeat step 2) until all level-1c files are processed and level-3 NetCDF files are generated for all satellites
4) Processing each channel of MSU instrument
Read in gridded level-3 brightness temperatures of one channel and corresponding gridded warm target temperatures from all satellites
Solve for regression coefficients (target factors) of the multi-satellite regression equations for removing warm target effect. NOAA-10 was defined as a reference
Perform zonal mean constant bias correction
Generate merged layer temperature records
5) Stop after all channels are processed
3.4.5 Look-Up Table Description
The RSS diurnal anomaly dataset is actually a look-up table. It provides diurnal anomaly values (T, Equation 1) relative to a daily average. It is a yearly mean hourly data available for each day for the 12 months in a year. For a satellite observation falling within a specific day and month between two evenly hours, diurnal adjustment converts the observations to the 12-noon local time based on the look-up table (Equation 1).

CDR Program NOAA MSU Mean Layer Temperature C-ATBD <TBD By CDR Program> Rev. 1 03/01/2014
24
3.4.6 Parameterization
N/A
3.4.7 Algorithm Output
Twenty-eight-year MSU monthly atmospheric layer temperatures, including TMT, TUT, and TLS, are the output products. The datasets have global coverage with 2.50x2.50 grid resolution covering time period from October 1978 to September 2006. All products are in NetCDF format which meet the requirements of NetCDF Metadata Guidelines for IOC Climate Data Records.

CDR Program NOAA MSU Mean Layer Temperature C-ATBD <TBD By CDR Program> Rev. 1 03/01/2014
25
4. Test Datasets and Outputs
4.1 Test Input Datasets
The MSU atmospheric layer temperature TCDR has such a high accuracy and precision that no other datasets are good enough to validate it. Reproducibility and accuracy of the datasets can only be demonstrated by examining the accuracy and precision of the merging algorithm. Algorithm evaluation was conducted in many different ways for the MSU layer temperature TCDR (Zou et al. 2009, Zou and Wang 2010) and they are summarized below.
4.2 Test Output Analysis
4.2.1 Reproducibility and Accuracy
The MSU atmospheric layer temperature TCDR was derived from merging MSU observations onboard multiple satellites and its primary purpose was to detect climate trends. As such, accuracy and precision of the merging algorithm is critical to determine the dataset accuracy in trend detection. A quantitative approach for assessing the accuracy and precision of the merging algorithm is to examine inter-satellite biases. Ideally, inter-satellite biases must be zero throughout satellite overlaps; otherwise, bias drifts between satellite pairs may cause ambiguity in the resulting trends.
Figure 4-1 demonstrates the performance of the algorithm by showing global ocean mean difference time series between all satellite pairs for their overlapping observations for the IMICA calibrated data, which are the inputs to the algorithm (Figure 4-1a), compared to those after all bias corrections were implemented (Figure 4-1b). As seen, small but non-zero inter-satellite biases on the order of less than 0.2 K existed for the IMICA calibrated brightness temperatures. After applying bias corrections including diurnal drift correction, removal of warm target effect, and constant inter-satellite bias correction, inter-satellite biases became zero over all overlapping observations between satellite pairs. Furthermore, the standard deviation of the inter-satellite difference time series was also minimized. Table 4-1 compared the mean standard deviations for all satellite pairs before and after applying bias correction algorithms to the IMICA calibrated brightness temperatures. These zero inter-satellite biases and minimized standard deviation of the global mean inter-satellite differences are the two primary quantities ensuring accuracy and precision of the merged layer temperature TCDR.

CDR Program NOAA MSU Mean Layer Temperature C-ATBD <TBD By CDR Program> Rev. 1 03/01/2014
26
Figure 4-1 Global ocean-mean inter-satellite brightness temperature difference time series for MSU channel 2 onboard TIROS-N through NOAA-14 derived from (a) the IMICA inter-calibrated radiances, and (b) after applying all bias correction algorithms to the IMICA calibrated radiances.
Table 4-1 Mean standard derivation (K) of global mean inter-satellite difference time series for overlapping observations between all satellite pairs for both the IMICA calibrated (input) and after applying all bias correction algorithms.
IMICA Calibrated Radiances IMICA+ all bias correction algorithms
Products Ocean mean Land mean Ocean mean Land mean
TMT 0.021 0.058 0.015 0.034
TUT 0.032 0.042 0.023 0.038
TLS 0.040 0.040 0.032 0.040
Two additional methods were also used to ensure reproducibility of the trends of the products. The first one was to compute global means of level-3 gridded products for each satellite and then applying bias correction algorithm to these global means. The merging of the global mean data from different satellites may yield more reliable trend since random errors from grid cells were averaging out in the global mean process so the bias structures were believed to be simpler in global means (Zou et al. 2009). The trend from the global mean merging was then compared to the global mean trends calculated from the gridded layer temperature TCDR and Table 4-2 showed the results. It is seen that the two methods yielded nearly identical trends from 1978-2006, indicating robustness and reproducibility of the gridded products in trend detection.

CDR Program NOAA MSU Mean Layer Temperature C-ATBD <TBD By CDR Program> Rev. 1 03/01/2014
27
Table 4-2 Global mean temperature trends (K/Decade) for 1978-2006 derived from global mean merging and averages of spatial trends of the gridded products.
Product Global mean trend from global mean merging
Global mean trend from averaging spatial trend of TCDR
TMT 0.165 0.163
TUT 0.081 0.088
TLS -0.348 -0.345
The second approach was to examine trend differences between land and oceans. It is expected that trends over the global land and ocean are consistent with each other since the atmosphere is well-mixed for long-term climate process (Zou and Wang 2010). The diurnal drift correction has significant impact on trends over the land. After diurnal correction, trends over the land and ocean are close to each other, with trends over land being slightly larger than the oceans (Table 4-3). This indicated that diurnal drift correction meet the accuracy requirement for the merging.
Table 4-3 Mean layer temperature trends (K/Decade) during 1978-2006 for global ocean mean and global land mean
Product Trend of global ocean mean Trend of global land mean
TMT 0.165 0.176
TUT 0.081 0.096
TLS -0348 -0.348
4.2.2 Error Budget
Total uncertainty of the MSU layer temperature products are between 0.5 to 1 K. This is the uncertainty when merged temperatures (not anomalies) are compared to observations from other instruments such as radiosondes or Global Positioning System Radio Occultation (GPSRO). This uncertainty is the absolute bias of the MSU layer temperature products. It is a combined effect from inaccurate instrument calibration, uncertainty in antenna pattern correction, and many other sources. Although relatively large, this uncertainty is believed not significantly changing with time after different satellite instruments were inter-calibrated against a reference satellite. Since absolute values of the observations are unknown and there are no SI-traceable standards to compare with, this absolute bias cannot be removed. In layer temperature time series, this uncertainty is treated as a constant which does not affect trends. The changing with time of
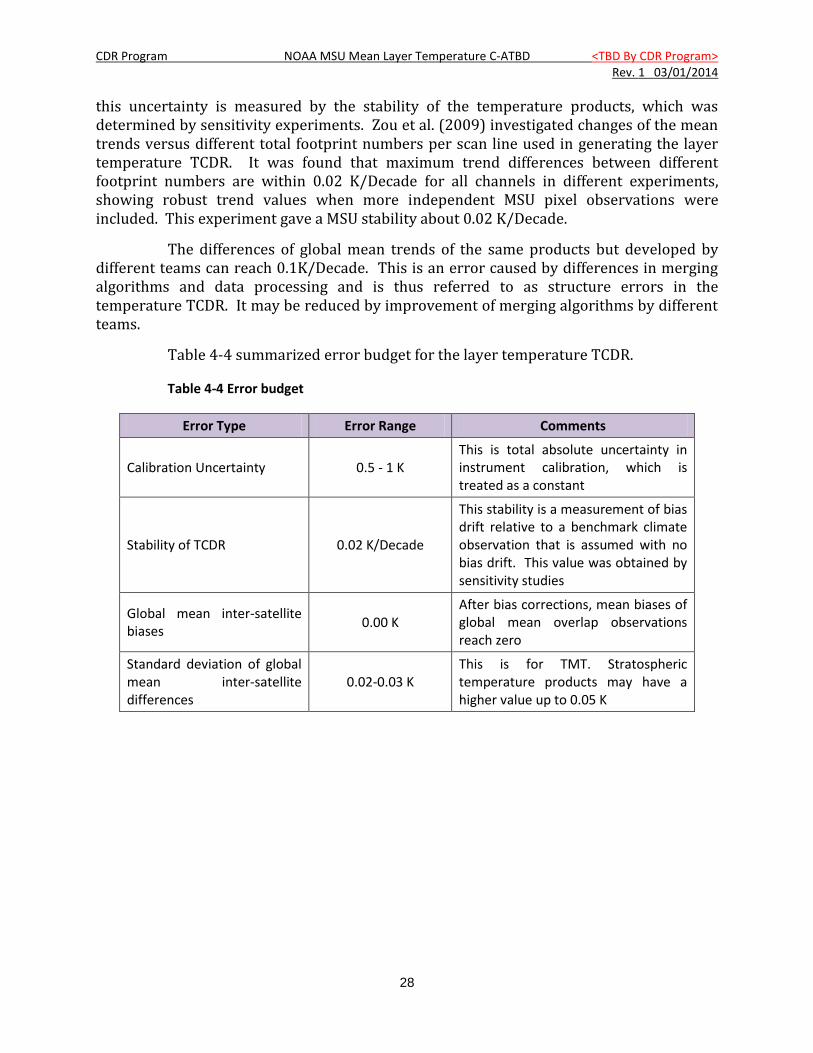
CDR Program NOAA MSU Mean Layer Temperature C-ATBD <TBD By CDR Program> Rev. 1 03/01/2014
28
this uncertainty is measured by the stability of the temperature products, which was determined by sensitivity experiments. Zou et al. (2009) investigated changes of the mean trends versus different total footprint numbers per scan line used in generating the layer temperature TCDR. It was found that maximum trend differences between different footprint numbers are within 0.02 K/Decade for all channels in different experiments, showing robust trend values when more independent MSU pixel observations were included. This experiment gave a MSU stability about 0.02 K/Decade.
The differences of global mean trends of the same products but developed by different teams can reach 0.1K/Decade. This is an error caused by differences in merging algorithms and data processing and is thus referred to as structure errors in the temperature TCDR. It may be reduced by improvement of merging algorithms by different teams.
Table 4-4 summarized error budget for the layer temperature TCDR.
Table 4-4 Error budget
Error Type Error Range Comments
Calibration Uncertainty 0.5 - 1 K This is total absolute uncertainty in instrument calibration, which is treated as a constant
Stability of TCDR 0.02 K/Decade
This stability is a measurement of bias drift relative to a benchmark climate observation that is assumed with no bias drift. This value was obtained by sensitivity studies
Global mean inter-satellite biases
0.00 K After bias corrections, mean biases of global mean overlap observations reach zero
Standard deviation of global mean inter-satellite differences
0.02-0.03 K This is for TMT. Stratospheric temperature products may have a higher value up to 0.05 K

CDR Program NOAA MSU Mean Layer Temperature C-ATBD <TBD By CDR Program> Rev. 1 03/01/2014
29
5. Practical Considerations
5.1 Numerical Computation Considerations 1. To speed up the generation of level-3 data (from swath scene brightness temperature to
gridded temperature), multithread technique is employed in TCDR software code. This technique allows the TCDR software to run faster on a computer system that has multiple CPUs, CPU with multiple cores, or across a cluster of machines. Multiple MSU level-1c files can be processed simultaneously to produce level-3 files with this approach.
2. Unqualified level-3 data: The monthly level-3 data of individual satellites may incur relatively larger errors in certain months. This may be caused by insufficient swath scene temperature and invalid level-1c scan lines, etc for the month. It may lead to outliers in the merged time series. To ensure data quality, all monthly level-3 files generated from the level-1c were sifted manually month by month before applying bias correction and merging algorithms.
5.2 Programming and Procedural Considerations MSU TCDR software package does not implement any numerical model.
5.3 Quality Assessment and Diagnostics
The quality of the final products was evaluated in the following ways:
1. Inter-satellite biases for each satellite pair during their overlapped observational period is evaluated as an indicator of the product quality and accuracy of merging algorithm. Mean inter-satellite biases were shown to be zero and standard deviations were minimized compared to those without bias corrections. These indicated high quality and accuracy of the merged products.
2. As discussed in the algorithm accuracy section, trend consistencies between land and ocean and between different merging methods served as another indicator of product quality.
3. Different footprint numbers per scan line were used to construct different merged layer temperature TCDR (Zou et al. 2009). Experiments included using one footprint number (scan position #6), three footprint numbers (scan positions 5-7), five footprint numbers (scan positions 4-8), seven footprint numbers (scan positions 3-9), nine footprint numbers (scan positions 2-10), and all eleven footprint numbers (scan positions 1-11). All different experiments yielded similar trend results and climate variability, indicating robustness of the trend and high quality of the products.
4. Monthly images of the layer temperatures for the entire observational period from 1978-2006 were put on the project website for frequent check of possible data quality issues (see http://www.star.nesdis.noaa.gov/smcd/emb/mscat/imageBrowser.php). If
CDR Program NOAA MSU Mean Layer Temperature C-ATBD <TBD By CDR Program> Rev. 1 03/01/2014
30
outliers were found for a particular month, input data will be reexamined to find the root causes and then more rigorous quality controls on the input data will be implemented until the problem is resolved. Animation of monthly images show continuous changes of the climate event both locally and globally, indicting high quality of products.
5.4 Exception Handling
Exceptions considered in the MSU processing codes include:
1. Class Not Found Exception will be reported and the system stops running when the code tries to load in a class but no definition for the class could be located due to misplacement of external libraries
2. Out of Memory Exception will be identified when the system cannot allocate a block a memory. If this exception occurs, the system will report the exception and exit running
3. File Not Found Exception will be reported and the system exits running when an ancillary file does not exist or inaccessible
4. EOF Exception will be reported when an end of file has been reached unexpectedly during file reading operations
5. IO Exception will be reported and the system stops running when a failed I/O operation, other than exceptions 3 and 4, occurs.
5.5 Algorithm Validation As described in sections 4.1, 4.2 and 5.3.
5.6 Processing Environment and Resources Table 5-1 lists the environment and resource requirements for the MSU TCDR
processing codes.
Table 5-1 MSU processing environment and resource requirements.
Computer Hardware
Minimum Configuration:
Processor: 2.0GHz
Memory: 100 MB
Disk Space 100 GB
A system with multiple CPUs is preferred
Operating System Linux or Windows
Programming Languages JAVA
Bash script
Compilers Sun JAVA Compiler

CDR Program NOAA MSU Mean Layer Temperature C-ATBD <TBD By CDR Program> Rev. 1 03/01/2014
31
External Library NetCDF-JAVA 4.1
Jscience4.3
Storage Requirement 100GB
Execution Time Requirement Single CPU ~20 hours for 9 satellites
Varied when using parallel computing

CDR Program NOAA MSU Mean Layer Temperature C-ATBD <TBD By CDR Program> Rev. 1 03/01/2014
32
6. Assumptions and Limitations
6.1 Algorithm Performance
NOAA-10 was assumed as a reference satellite during the merging process, meaning all satellites were adjusted to observations from NOAA-10. However, biases relative to an unknown absolute truth may exist in NOAA-10 MSU observation. The actual value of this bias cannot be determined since no SI-traceable standard exist at the time of this writing for the MSU observations.
6.2 Sensor Performance The stability of the MSU temperature trends depends on performance of the
sensor channel frequencies, which were assumed to be stable for all satellite channels. Possible MSU frequency shift is a current research topic. If it is confirmed in the future that MSU channel frequency incurred shifts during satellite operation, additional adjustment may need to be implemented for algorithm consistency and product accuracy. Methods for frequency adjustments had been developed for merging MSU and AMSU channels at NOAA/STAR. These methods can be adopted for merging MSU channels with frequency shifts.
CDR Program NOAA MSU Mean Layer Temperature C-ATBD <TBD By CDR Program> Rev. 1 03/01/2014
33
7. Future Enhancements Diurnal drift adjustment generally contains larger uncertainty and it affects TMT
trends over the land areas. Research is being conducted to find more accurate diurnal anomaly datasets that can improve the TMT products over the entire land area and the entire observational period. If such datasets were found, an update of the TMT product will be provided with improved diurnal drift corrections.

CDR Program NOAA MSU Mean Layer Temperature C-ATBD <TBD By CDR Program> Rev. 1 03/01/2014
34
8. References
Christy,J.R., R.W. Spencer, W.D. Braswell (2000). MSU tropospheric temperatures: Dataset construction and radiosonde comparisons. J. Atmos. Oceanic. Technol. 17:1153–1170
Goldberg, M.D., D.S. Crosby, L. Zhou (2001). The limb adjustment of AMSU-A observations: methodology and validation. J. App. Meteor. 40:70–83.
Kidwell, K.B., edited, (1998). NOAA Polar Orbiter Data User’s Guide, available at http://www.ncdc.noaa.gov/oa/pod-guide/ncdc/docs/podug/index.htm
Mears, C.A., M.C. Schabel, F.J. Wentz (2003). A reanalysis of the MSU channel 2 tropospheric temperature record. J. Climate 16:3650–3664
Zou, C.-Z., et al. (2006). Recalibration of microwave sounding unit for climate studies using simultaneous nadir overpasses. J. Geophys. Res., 111(D19), D19114
Zou, C.-Z., et al. (2009). Error structure and atmospheric temperature trends in observations from the Microwave Sounding Unit. Journal of Climate, 22(7), 1661-1681
Zou, C.-Z., and W. Wang (2010). Stability of the MSU-derived atmospheric temperature trend. Journal of Atmospheric and Oceanic Technology, 27(11), 1960-1971
Zou, C.-Z., and W. Wang (2011). Intersatellite calibration of AMSU-A observations for weather and climate applications. J. Geophys. Res., 116(D23), D23113
Zou, C.-Z. and W. Wang (2013). MSU/AMSU Radiance Fundamental Climate Data Record Calibrated Using Simultaneous Nadir Overpasses Climate Algorithm Theoretical Basis Document (C-ATBD), NOAA/NESDIS

CDR Program NOAA MSU Mean Layer Temperature C-ATBD <TBD By CDR Program> Rev. 1 03/01/2014
35
Appendix A. Acronyms and Abbreviations
Acronym or Abbreviation
Meaning
AMSU Advanced Microwave Sounding Unit
CATBD Climate Algorithm Theoretical Basis Document
CDR Climate Data Record
CDRP Climate Date Record Program
FCDR Fundamental Climate Data Record
FOV Field of View
GPSRO Global Positioning System Radio Occultation
IFOV Instantaneous Field of View
IMICA Integrated Microwave Inter-Calibration Approach
MSU Microwave Sounding Unit
NCDC National Climatic Data Center
NESDIS National Environmental Satellite, Data, and Information Services
NetCDF Network Common Data Form
NOAA National Oceanic and Atmospheric Administration
PRT Platinum Resistance Thermometer
RSS Remote Sensing Systems
SNO Simultaneous Nadir Overpass
STAR Center for Satellite Applications and Research
TCDR Thematic Climate Data Record
TLS Temperature of lower-stratosphere
TMT Temperature of mid-troposphere
TUT Temperature of upper-troposphere