Embed Size (px)
Citation preview

Monthly Climate PacketFebruary ����
Climate Assessment for the SouthwestInstitute for the Study of Planet Earth
University of ArizonaPO Box ������
Tucson� Arizona ��������(���) �����
CLIMASCLIMASCLIMASCLIMASCLIMAS
Southwest Climate Outlook

TABLE OF CONTENTS Background Feature: Ranchers split on supporting grazing permit buyout Monthly Climate Outlook Recent Conditions Temperature ....................................................................................................1 Precipitation .....................................................................................................2 Annual Precipitation Anomalies and Daily Event Totals...................................3 U.S. Drought Monitor .......................................................................................4 Drought: Recent Drought Status for New Mexico ............................................5 Arizona Reservoir Levels .................................................................................6 New Mexico Reservoir Levels..........................................................................7 Snowpack in the Southwestern United States .................................................8 Forecasts Temperature: Multi-season Outlooks ...............................................................9 Precipitation: Multi-season Outlooks..............................................................10 Drought: Seasonal Drought and PHDI Outlook Maps ....................................11 Streamflow Forecast for Spring and Summer ................................................12 National Wildland Fire Outlook ......................................................................13 Tropical Pacific Sea Surface Temperature Forecast......................................14 Temperature Verification: November 2003 – January 2004...........................15 Precipitation Verification: November 2003 – January 2004 ...........................16 Focus on PDSI Products Focus on National Agricultural Decision Support Monthly PDSI Product.......17 Focus on National Agricultural Decision Support Weekly PDSI Product........18

Section A
BACKGROUND

Ranchers split on supporting grazing permit buyoutBY MELANIE LENART
With drought withering the landscapeand government regulations increas-ingly cutting into profits, some ranch-ers are supporting a plan that wouldallow a one-time buyout of cattle-grazing permits on federal lands.
More than 165 Arizona ranchers sup-port a bill introduced into Congressby Rep. Raúl Grijalva (Arizona Dis-trict 7) to pay ranchers $175 per “ani-mal unit month” to retire their grazingpermits on federal lands. One animalunit month is equivalent to a cow andher calf grazing for one month, so arancher who typically has grazed 100cow-calf pairs for six months of theyear would gain $105,000 in the one-time-only deal, if the bill were ap-proved by Congress. The bill has beenassigned to committees for study.
Grijalva’s bill (House Resolution 3337)suggests that Arizona serve as the pi-lot project for a grazing permitbuyout. In addition, he has supportedan earlier bill (H.R. 3324) that would
provide a similar opportunity to otherranchers across the nation.
Grijalva cited the ongoing drought andthe fact that ranchers and environmen-talists worked together to come upwith the plan as two good reasons forstarting a program in Arizona.
“Many ranchers in Arizona are suffer-ing financially because of the changingeconomics in cattle production, butalso because of environmentalchanges. The drought is requiringthem to reduce livestock numbers onthe land, and some simply cannotmake a living,” the congressmanstated.
Researchers on the Climate Assess-ment for the Southwest (CLIMAS)project found that the four-year cool-season precipitation average from1999–2002 was the worst in the instru-mental record, with the period from1901–1904 ranking second and 1954–1957 ranking fourth. The period at thebeginning of the 20th century spelleddisaster for ranchers at the time, someof whom took to selling the bones of
dead cattle for fertilizer to get by(Bahre and Shelton, 1996),and some modern ranchersstill remember the strugglescaused by the 1950s drought.
Ranchers who depend on theTonto National Forest near
Phoenix for ranching have beenparticularly hard-hit by the cur-
rent drought and the required re-ductions in cattle grazing. Perhaps
this helps explain the predominanceamong the nine ranchers spearhead-ing the buyout plan along with repre-sentatives from several environmental
CLIMASSouthwest Climate OutlookSouthwest Climate OutlookSouthwest Climate OutlookSouthwest Climate OutlookSouthwest Climate Outlook
Integrating science� policy� and community
February ����February ����February ����February ����February ����
continued on page 2
groups on the Arizona Grazing PermitBuyout Campaign. John Whitney IV,campaign chairman and part of thefamily-owned Circle Bar Ranch justoutside Phoenix, said the U.S. Depart-ment of Agriculture Forest Service’sresponse to the drought is threateningto put many ranchers out of business.
Right now, only 3 percent of the cattlepermitted for grazing on the TontoNational Forest are actually occupyingthe land, according to Buck McKinney,range conservationist for the Tonto.The drought has reduced vegetationcover, causing the Forest Service tolimit cattle grazing. But in some cases,ranchers themselves have made thedecision not to graze cattle on theTonto, McKinney said.
Whitney challenged the notion thatthe ranchers had a choice in the reduc-tion in cattle-grazing numbers.
“These are not hobby ranchers. Theyranch for a living. So why would theynot put cattle on the land if theycould?” he asked rhetorically.
The Circle Bar Ranch has been re-stricted from putting any cattle on itsallotment for several years because ofthe drought, Whitney said. In addi-tion, they have been notified that theywill only be allowed to graze abouthalf of the usual 1,250 cow-calf pairswhen they do get the green light tostart grazing again, he said.
“The ranchers look at it as, ‘If you’regoing to cut my cattle in half, you’regoing to put me out of business,’ ” hesaid. He compared the ranchers’ frus-tration to that of car dealers trying to

Southwest Climate Outlook� page �
make a living while being told howmany cars they can sell each year.
Forest Service policy and managementpractices for grazing allotments irkedmany of the roughly 50 Arizona ranch-ers surveyed between 1998 and 2002by researchers for CLIMAS, the Uni-versity of Arizona group that producesthe Southwest Climate Outlook,among other activities. The surveyedranchers indicated they rarely vieweddrought as a primary motivation forranch sales, but rather saw govern-ment regulations as the main culprit.
The number of ranching operationsdropped by 17 percent in Arizona andby about 6 percent in New Mexicofrom 1995 to 2002 (Figure 1), accordingto data from the National AgriculturalStatistics Service (NASS). In Arizona,the drop occurred in all size classes, soconsolidation of ranches into largerunits would not explain the decrease.Similarly, in New Mexico, the declineoccurred mainly in larger operations,while the number of operations withless than 50 heads of cattle increasedslightly.
In addition, Arizona ranchers in-creased the number of cattle onsupplemental feed by 45 percent whilethe total number of cattle dropped by 1percent for that same time period(1995–2002), according to NASS fig-ures (Figure 2). In New Mexico, theproportion of cattle on supplementalfeed actually declined by 30 percentduring that time frame, while the totalnumber of cattle increased by about 5percent. However, the number of cattlein New Mexico dropped by about 6percent between 1998 and 2004, andwere generally lower during the 1980s,so timing of severe agriculturaldrought impacts probably differed inthe two southwestern states.
Although the proposed buyout billframes the current ranching woes inthe context of the drought, a spokes-person for the Arizona Cattle GrowersAssociation (ACGA) considers dealingwith drought all in a day’s work.
Permit buyout, continued
Figure 2. The number of cattle in Arizona has declined since 1992, with some of this dropattributable to drought impacts on the landscape. In New Mexico, the number of cattlewas lower during much of the 1980s than in more recent years, but numbers began todrop again in the year 2000. Data were gathered from the National Agricultural StatisticsService website.
0
0.5
1.0
1.5
2.0
2.5
3.0
Southwest cattle
New Mexico cattle
Arizona cattle
Nu
mb
er o
f Cat
tle
(Mill
ion
s)
19791981
19831985
19871989
19911993
19951997
19992001
2003
Year
0
2000
4000
6000
8000
10000
12000
14000
16000
Nu
mb
er o
f Ran
chin
g O
per
atio
ns
Southwest operations
New Mexico operations
Arizona operations
19791981
19831985
19871989
19911993
19951997
19992001
YearFigure 1. The total number of ranching operations in the southwestern states of Arizonaand New Mexico has been declining in recent years. The early to mid-1980s representeda peak in ranching operations for the Southwest during this time frame, 1979—2002. Datawere gathered from the National Agricultural Statistics Service website.

Southwest Climate Outlook� page �
“It’s the same as it’s always been. Thelivestock people all over the worldhave spent their whole life dealing withdrought,” maintained ACGA NaturalResources Director Charles “Doc”Lane. “We believe in raising fat, con-tented animals. If you depend on theland and the climate, the only way toraise fat, contented animals is to havefewer of them during the drought.”
The association opposes the grazingpermit buyout plan, putting dozens ofindividual ranchers in the unusual po-sition of agreeing with environmental-ists more than their fellow rancherswho run the ACGA.
During a recent phone call, Lane ex-pressed the Association’s stance thatranchers who are suffering financiallyshould sell their ranch to others whowill carry on the ranching tradition. “IfI sell a ranch during a drought, chancesare someone will come along and buyit because they know the drought willbreak sometime,” he added.
Meanwhile, Lane feared that retiringranching permits would threaten therural lifestyle that ranchers love, wouldreduce regional food security, andwould challenge the Forest Service’straditional “multiple use” of forests.
Forest Service land managers havebeen responding to a push from manymembers of society to consider issuesof water quality, fire hazards, and rec-reational values of forests when de-signing plans for their “multiple use,”which traditionally have involved tim-ber harvesting, mineral extraction, andcattle grazing.
“The point is we can’t just have aplace to play. We have to have a placeto produce goods and services,” hesaid, adding that Phoenix’s local foodsupply would run out in seven dayswere it not for continual replenish-ment. “If disaster struck, and importa-tion of food from other parts of the na-tion cannot occur, in eight days thepeople of Phoenix are fighting overthe last of the food. But on Day Eight
you cannot say, ‘OK, we have decidedwe do need to produce food.’ ”
The buyout campaign chairman chal-lenged the contention that continuedranching on federal lands would helpguarantee an ongoing food supply inan emergency.
“The cows produced in Arizonawouldn’t provide for anybody verylong,” Whitney noted.
The ranchers also disagree on whichapproach, business as usual or a paid-off retirement of grazing permits,would be more likely to encourage de-velopment of rural areas via subdivi-sion of ranches.
Only 3 percent of the nation’s beefproducers hold federal grazing per-mits, said Daniel Patterson, an ecolo-gist with the Center for Biological Di-versity (CBD) in Tucson. The centerhas a representative on the campaignsteering committee headed byWhitney, and a CBD meeting withPhoenix ranchers in August 2002helped launch the Arizona grazingpermit buyout proposal.
“Drought is a climate reality in theSouthwest, and it will be an issue inthe future because it certainly affectsthe permittees and the land. Some ofthem have been more supportive ofthe buyout because of the desertifica-tion,” Patterson said.
Meanwhile, private conservationgroups have already successfullybought grazing permits from permit-tees to protect the desert tortoise inCalifornia’s Mohave National Pre-serve, Patterson said. But he notedthat grazing changes proposed latelast year by the Bush administrationwould threaten such solutions.
“It’s important to have Congressweigh in on this solution and stop theBush administration from derailing awin-win buyout solution to end publiclands ranching conflicts,” Pattersonsaid. The CBD expects to devote a full-
time staff member to this project foryears to come, if necessary, he said.Despite agreement between someranchers and environmentalists, thedisagreement within the ranchingcommunity promises to make this anissue of contention that eludes a quickfix. The conflict does serve to illus-trate, however, how drought can ag-gravate existing societal tensions overresources.
The complexity of balancing economicand cultural values with riparian con-servation and fire management valueson public lands becomes all the moreapparent during times of drought. Al-though it may be unrealistic to expecta simple solution that receives univer-sal support, it seems clear thatdrought will provoke discussions thatwould otherwise be relegated to theback burner, including the issue ofcattle grazing on public lands.
Related Links and PapersRelated Links and PapersRelated Links and PapersRelated Links and PapersRelated Links and PapersAs part of the “Reconstructing PastClimate in the Southwest” project, theCLIMAS website provides instrumen-tal records for 1896–2002 and tree-ringrecords to reconstruct cool-season pre-cipitation for 1000–1896. An onlinetool to access this data is available athttp://www.ispe.arizona.edu/climas/research/paleoclimate/product.html.
The National Agricultural StatisticsService compiles a variety of data re-lated to ranching. The database can besearched for specific data by selecting“U.S. and State Data” and then“Cattle” from the following website:http://www.nass.usda.gov:81/ipedb/.
The Arizona Grazing Permit BuyoutCampaign website allows cattle andsheep ranchers to calculate their pos-sible compensation for a grazing per-mit buyout, and lists ranchers whopublicly support the campaign,among other features. http://www.azbuyout.org/buyout/cont.htm.
Bahre, C. J., and M. L. Shelton. 1996.Rangeland destruction: Cattle anddrought in southeastern Arizona atthe turn of the century. Journal of theSouthwest, 38(1):1–22.
Southwest Climate Outlook� page �
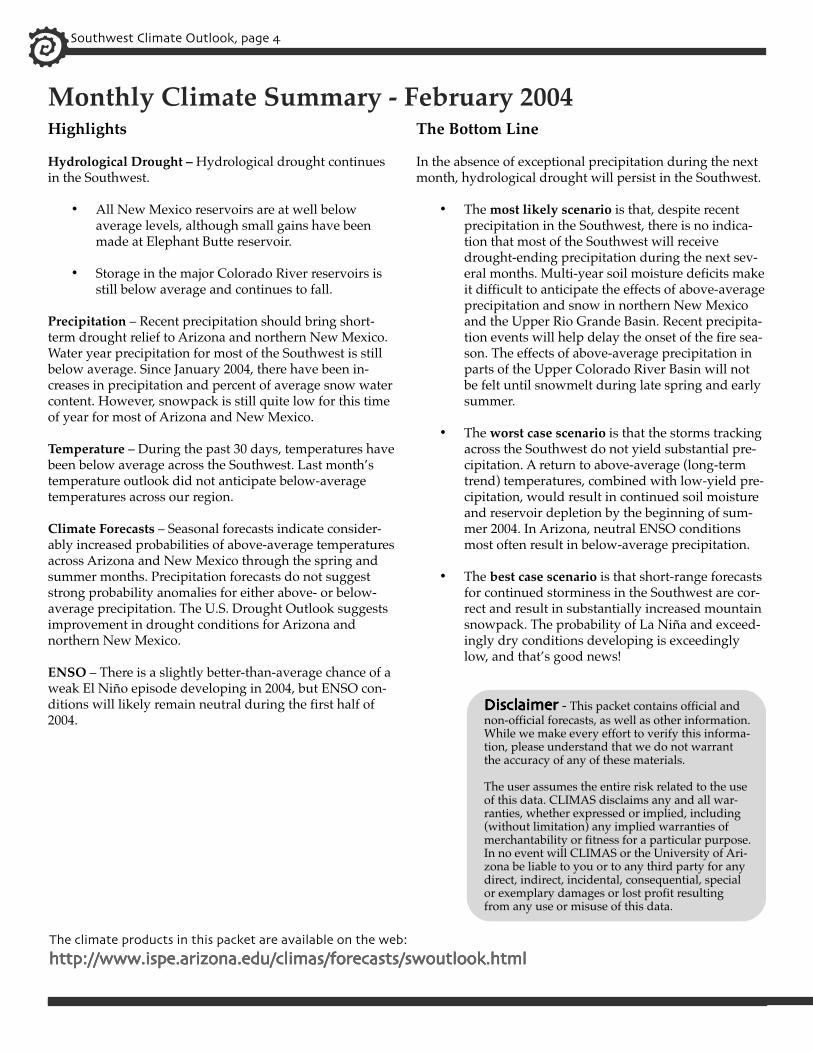
Monthly Climate Summary - February 2004Highlights
Hydrological Drought – Hydrological drought continuesin the Southwest.
• All New Mexico reservoirs are at well belowaverage levels, although small gains have beenmade at Elephant Butte reservoir.
• Storage in the major Colorado River reservoirs isstill below average and continues to fall.
Precipitation – Recent precipitation should bring short-term drought relief to Arizona and northern New Mexico.Water year precipitation for most of the Southwest is stillbelow average. Since January 2004, there have been in-creases in precipitation and percent of average snow watercontent. However, snowpack is still quite low for this timeof year for most of Arizona and New Mexico.
Temperature – During the past 30 days, temperatures havebeen below average across the Southwest. Last month’stemperature outlook did not anticipate below-averagetemperatures across our region.
Climate Forecasts – Seasonal forecasts indicate consider-ably increased probabilities of above-average temperaturesacross Arizona and New Mexico through the spring andsummer months. Precipitation forecasts do not suggeststrong probability anomalies for either above- or below-average precipitation. The U.S. Drought Outlook suggestsimprovement in drought conditions for Arizona andnorthern New Mexico.
ENSO – There is a slightly better-than-average chance of aweak El Niño episode developing in 2004, but ENSO con-ditions will likely remain neutral during the first half of2004.
The Bottom Line
In the absence of exceptional precipitation during the nextmonth, hydrological drought will persist in the Southwest.
• The most likely scenario is that, despite recentprecipitation in the Southwest, there is no indica-tion that most of the Southwest will receivedrought-ending precipitation during the next sev-eral months. Multi-year soil moisture deficits makeit difficult to anticipate the effects of above-averageprecipitation and snow in northern New Mexicoand the Upper Rio Grande Basin. Recent precipita-tion events will help delay the onset of the fire sea-son. The effects of above-average precipitation inparts of the Upper Colorado River Basin will notbe felt until snowmelt during late spring and earlysummer.
• The worst case scenario is that the storms trackingacross the Southwest do not yield substantial pre-cipitation. A return to above-average (long-termtrend) temperatures, combined with low-yield pre-cipitation, would result in continued soil moistureand reservoir depletion by the beginning of sum-mer 2004. In Arizona, neutral ENSO conditionsmost often result in below-average precipitation.
• The best case scenario is that short-range forecastsfor continued storminess in the Southwest are cor-rect and result in substantially increased mountainsnowpack. The probability of La Niña and exceed-ingly dry conditions developing is exceedinglylow, and that’s good news!
The climate products in this packet are available on the web:
http://www�ispe�arizona�edu/climas/forecasts/swoutlook�htmlhttp://www�ispe�arizona�edu/climas/forecasts/swoutlook�htmlhttp://www�ispe�arizona�edu/climas/forecasts/swoutlook�htmlhttp://www�ispe�arizona�edu/climas/forecasts/swoutlook�htmlhttp://www�ispe�arizona�edu/climas/forecasts/swoutlook�html
DisclaimerDisclaimerDisclaimerDisclaimerDisclaimer - This packet contains official andnon-official forecasts, as well as other information.While we make every effort to verify this informa-tion, please understand that we do not warrantthe accuracy of any of these materials.
The user assumes the entire risk related to the useof this data. CLIMAS disclaims any and all war-ranties, whether expressed or implied, including(without limitation) any implied warranties ofmerchantability or fitness for a particular purpose.In no event will CLIMAS or the University of Ari-zona be liable to you or to any third party for anydirect, indirect, incidental, consequential, specialor exemplary damages or lost profit resultingfrom any use or misuse of this data.

Section B
RECENT CONDITIONS

1a. Water year '03-'04 (through 2/21) departure from average
temperature (°F).1b. Water year '03-'04 (through 2/21) average temperature (°F).
1c. Previous 30 days (1/24 - 2/22) departure from average
temperature (°F, interpolated).
1d. Previous 30 days (1/24 - 2/22) departure from average
temperature (°F, data collection locations only).
-1
+2
+3
30
50
45
35
25
60
55
40
65
-2
0
-2
-4
-6
-10
-8
0
+1
0
-2
-4
-6
-10
-8
Notes:The water year begins on October 1 and ends on September 30 of the following year. Water year is more commonly used in association with precipitation; water year temperature can be used to measure the temperatures associated with the hydrological activity during the water year.
Average refers to the arithmetic mean of annual data from 1971–2000. Data are in degrees Fahrenheit (°F).
Departure from average temperature is calculated by subtracting current data from the average. The result can be positive or negative.
The continuous color maps (Figures 1a, 1b, 1c) are derived by taking measurements at individual meteorological stations and mathematically interpolating (estimating) values between known data points. The blue numbers in Figure 1a, the red numbers in Figure 1b, and the dots in Figure 1d show data values for individual stations.
Note: Interpolation procedures can cause aberrant values in data-sparse regions.
Figures 1c and 1d are experimental products from the High Plains Regional Climate Center (HPRCC).
1. Recent Conditions: Temperature (up to 2/21/04) Sources: WRCC, HPRCC
������
Highlights: Despite the fact that temperatures since October 1, 2003 have been mostly above average across our region (Figure 1a), temperatures during the past 30 days have been well below average (Figures 1c and 1d). Late January to mid-February temperatures were as much as 7-8°F below average at many locations across our region. The Tucson National Weather Service forecast office reported that, at many locations in southeastern Arizona, temperatures for the first half of February have not been this cold for more than 15 years. Some locations have not been this cold since 1964. According to reports from the Western Regional Climate Center (figures not shown), maximum temperatures at Southwest airport weather stations have been well below average during the past 30 days.
For these and other temperature maps, visit: http://www.wrcc.dri.edu/recent_climate.html andhttp://www.hprcc.unl.edu/products/current.htmlFor information on temperature and precipitation trends, visit: http://www.cpc.ncep.noaa.gov/trndtext.htm

2a. Water year '03-'04 (through 2/22) percent of average
precipitation (interpolated).
2c. Previous 30 days (1/24 - 2/22) percent of average
precipitation (interpolated).
2d. Previous 30 days (1/24 - 2/22) percent of average
precipitation (data collection locations only).
2b. Water year '03-'04 (through 2/22) percent of average
precipitation (data collection locations only).
150
90
50
300
5
110
200
130
100
70
25
150
90
50
300
5
110
200
130
100
70
25
200
75
25
800
2
125
400
150
100
50
5
200
75
25
800
2
125
400
150
100
50
5
Notes:The water year begins on October 1 and ends on September 30 of the following year. As of October 1, 2003 we are in the 2004 water year. The water year is a more hydrologically sound measure of climate and hydrological activity than is the standard calendar year.
Average refers to the arithmetic mean of annual data from 1971–2000.
Percent of average precipitation is calculated by taking the ratio of current to average precipitation and multiplying by 100.
The continuous color maps (Figures 2a, 2c) are derived by taking measurements at individual meteorological stations and mathematically interpolating (estimating) values between known data points.
Note: Interpolation procedures can cause aberrant values in data-sparse regions.
The dots in Figures 2b and 2d show data values for individual meteorological stations.
These figures are experimental products from the High Plains Regional Climate Center (HPRCC).
2. Recent Conditions: Precipitation (up to 2/22/04) Source: High Plains Regional Climate Center
������
Highlights: During the past 30 days, our region has received scattered precipitation (heavy in places) from three events—one at the end of January (affecting mostly the Southern half of our region), one at the beginning of February, and one as this Southwest Climate Outlook goes to press. The highest precipitation totals were received in south-central Arizona and central New Mexico (Figures 2c and 2d). Precipitation from these events, however, did not put much of a dent in water year precipitation totals, which are still below average for most of our region (Figures 2a and 2b). Persistently dry conditions and high winds in southeastern New Mexico and west Texas generated severe dust storms that resulted in two deaths as 30 vehicles crashed on U.S. Highway 84, southeast of Lubbock, Texas (Associated Press, February 20, 2004).
For these and other precipitation maps, visit: http://www.hprcc.unl.edu/products/current.htmlFor National Climatic Data Center monthly precipitation and drought reports for Arizona, New Mexico, and the Southwest region, visit: http://lwf.ncdc.noaa.gov/oa/climate/research/2003/perspectives.html#monthly

Winslow, ArizonaTucson, ArizonaPhoenix, Arizona
Albuquerque, New Mexico Roswell, New Mexico Farmington, New Mexico
10-
0-
1-
2-
3-
4-
5-
6-
7-
8-
9-
Inches250
0
25
50
75
100
125
150
175
200
225
mm10-
0-
1-
2-
3-
4-
5-
6-
7-
8-
9-
Inches250
0
25
50
75
100
125
150
175
200
225
mm
10-
0-
1-
2-
3-
4-
5-
6-
7-
8-
9-
Inches250
0
25
50
75
100
125
150
175
200
225
mm
1.0-
0.0-
0.1-
0.2-
0.3-
0.4-
0.5-
0.6-
0.7-
0.8-
0.9-
0
5
10
15
20
25 1.0-
0.0-
0.1-
0.2-
0.3-
0.4-
0.5-
0.6-
0.7-
0.8-
0.9-
0
5
10
15
20
25 1.0-
0.0-
0.1-
0.2-
0.3-
0.4-
0.5-
0.6-
0.7-
0.8-
0.9-
0
5
10
15
20
25
10-
0-
1-
2-
3-
4-
5-
6-
7-
8-
9-
Inches250
0
25
50
75
100
125
150
175
200
225
mm
1.0-
0.0-
0.1-
0.2-
0.3-
0.4-
0.5-
0.6-
0.7-
0.8-
0.9-
0
5
10
15
20
25
20-
0-
2-
4-
6-
8-
10-
12-
14-
16-
18-
Inches
20-
0-
2-
4-
6-
8-
10-
12-
14-
16-
18-
Inches
Daily Observed Daily Observed Daily Observed
Daily ObservedDaily ObservedDaily Observed
0.0-
0.3-
0.6-
0.9-
1.2-
1.5-
1.8-
2.1-
2.4-
0
10
20
30
40
50
60
500
0
50
100
150
200
250
300
350
400
450
mm
500
0
50
100
150
200
250
300
350
400
450
mm
MAR2003
APR MAY JUN JUL AUG SEP OCT NOV DEC JAN2004
FEB
MAR2003
APR MAY JUN JUL AUG SEP OCT NOV DEC JAN2004
FEB
MAR2003
APR MAY JUN JUL AUG SEP OCT NOV DEC JAN2004
FEB
MAR2003
APR MAY JUN JUL AUG SEP OCT NOV DEC JAN2004
FEB
MAR2003
APR MAY JUN JUL AUG SEP OCT NOV DEC JAN2004
FEB
MAR2003
APR MAY JUN JUL AUG SEP OCT NOV DEC JAN2004
FEB
MAR2003
APR MAY JUN JUL AUG SEP OCT NOV DEC JAN2004
FEB
MAR2003
APR MAY JUN JUL AUG SEP OCT NOV DEC JAN2004
FEB
MAR2003
APR MAY JUN JUL AUG SEP OCT NOV DEC JAN2004
FEB
MAR2003
APR MAY JUN JUL AUG SEP OCT NOV DEC JAN2004
FEB
MAR2003
APR MAY JUN JUL AUG SEP OCT NOV DEC JAN2004
FEB
MAR2003
APR MAY JUN JUL AUG SEP OCT NOV DEC JAN2004
FEB
1.0-
0.0-
0.1-
0.2-
0.3-
0.4-
0.5-
0.6-
0.7-
0.8-
0.9-
0
5
10
15
20
25
3. Annual Precipitation Anomalies and Daily Event Totals Source: NOAA Climate Prediction Center
������
Notes: Based on a long-term average (1971–2000) of daily precipitation, these graphs contrast how much precipitation actually has accumulated at each station over the past year (beginning in mid-December 2002) with how much precipitation typically is received.The top of each of the pairs of graphs shows average (dotted line) and actual (solid line) accumulated precipitation (i.e., each day’s precipitation total is added to the previous day’s total for a 365-day period). If accumulated precipitation is below the long-term average, the region between the long-term average and the actual precipitation is shaded brown, and if accumulated precipitation is above the long-term average, the region between the actual precipitation and the long-term average precipitation is shaded green.The green bars at the bottom of each of the pairs of graphs show the daily precipitation amounts (in both inches and millimeters) for the past year. Thus, one can get a sense of how frequent and intense individual precipitation events have been at the selected stations.It is important to note that the scales for both the accumulated precipitation and the daily precipitation vary from station to station.This type of graph is available for several other stations in Arizona and New Mexico as well as for many other places in the world. The graphs are updated daily by NOAA CPC at http://www.cpc.noaa.gov/products/global_monitoring/precipitation/global_precip_accum.html.

3.4. U.S. Drought Monitor (updated 2/19/04) Source: USDA, NDMC, NOAA
������
Highlights: Drought conditions persist across much of the Intermountain West and western Great Plains. In Arizona and New Mexico, hydrological drought conditions are still evident in the four corners area and across the southern tier of our region stretching from southeastern Arizona to west Texas. Drought conditions in southern New Mexico and west Texas have been exceedingly severe; high winds and dry conditions resulted in severe dust storm events on February 19, 2004. United States Secretary of the Interior Gale Norton visited Arizona and told members of a Phoenix Rotary Club that the current drought is “a warning call for the future” (Arizona Republic, February 7, 2004). Norton suggested that more efficient agricultural use of water would free up water for the West’s growing urban areas.
Animations of the current and past weekly drought monitor maps can be viewed at: http://www.drought.unl.edu/dm/monitor.html
Notes:The U.S. Drought Monitor is released weekly (every Thursday) and represents data collected through the previous Tuesday. This monitor was released on 2/19 and is based on data collected through 2/17.
The best way to monitor drought trends is to pay a weekly visit to the U.S. Drought Monitor website (see left and below).
The U.S. Drought Monitor maps are based on expert assessment of variables including (but not limited to) PDSI, soil moisture, stream flow, precipitation, and measures of vegetation stress, as well as reports of drought impacts.

Notes: New Mexico drought status maps are produced by the New Mexico Drought Monitoring Workgroup (NMDMW). As with the U.S. Drought Monitor maps (see page 4), the New Mexico maps are based on expert assessment of variables including, but not limited to, precipitation, drought indices, reservoir levels, and streamflow. The New Mexico drought status maps (http://www.nm.nrcs.usda.gov/snow/drought/drought.html) are produced monthly. When near-normal conditions exist, they are updated quarterly. Information on Arizona drought can be found at: http://www.water.az.gov/gdtf/
Highlights: Changes in New Mexico meteorological drought status since November 2003, include the following: increases to emergency drought status in Socorro and Sierra counties; a decrease from emergency to warning status in north-central New Mexico; a decrease from warning to alert status in west central New Mexico. Hydrological drought has increased to emergency drought status in the northwest Pecos River Basin, since November 2003. The National Weather Service Albuquerque forecast office reports that soils are still suffering from multi-year drought over much of New Mexico. Despite average to above-average snowfall over parts of northwestern and north-central New Mexico, runoff into many New Mexico streams may be below average because, as in 2003, extremely dry soils can absorb a substantial volume of water.
5. Drought: Recent Drought Status for New Mexico (updated 01/21/04) Source: New Mexico NRCS
������
Meteorological Drought MapDrought Status as of January 21, 2004
Normal
Advisory
Alert
Warning
Emergency
Hydrological Drought MapDrought Status as of January 21, 2004
Normal
Advisory
Alert
Warning
Emergency
Note: Map is delineated by
drainage basins (bold) and
county lines.
Note: Map is delineated by
climate divisions (bold) and
county lines.

Salt River
Basin System
Verde River
Basin System
San Carlos
Painted Rock
Dam
Lyman Reservoir
Show Low Lake
Lake Havasu
Lake Mohave
Lake Mead
Lake Powell
current as % of capacity (current storage*/total capacity*)
current as % of average (current storage*/average storage*)
current as % of last year (current storage*/last year's storage*)
*Units are in thousands of acre-feet
151% (842.5 / 558.8)*
187% (117 / 62.7)*
75% (27.2 / 36.1)*
0% (0 / 0)*
95% (2.1 / 2.2)*
160% (3.2 / 2.0)*
95% (510.6 / 537.1)*
95% (1623.4 / 1705.3)*
92% (15434 / 16854)*
83% (10984 / 13269)*
71% (842.5 / 1189.3)*
78% (117 / 150.8)*
6% (27.2 / 421.8)*
0% (0 / 166)*
14% (2.1 / 14.7)*
110% (3.2 / 2.9)*
93% (510.6 / 551.8)*
97% (1623.4 / 1672.3)*
70% (15434 / 21992)*
59% (10984 / 18463)*
42% (842.5 / 2025.8)*
41% (117 / 287.4)*
3% (27.2 / 875)*
0% (0 / 2492)*
7% (2.1 / 30)*
63% (3.2 / 5.1)*
82% (510.6 / 619)*
90% (1623.4 / 1810)*
59% (15434 / 26159)*
45% (10984 / 24322)*
Highlights: There have been slight gains in some Arizona reservoirs during the past month. In particular, the Salt and Verde River Basins have seen slight increases in current storage and percent of total capacity. Total Colorado River reservoir current storage levels continue to decline.
The Arizona Republic (February 1, 2004) reported that the Williams City Council approved a preliminary master plan for a $32 million Arizona Territory theme park. Investors in the project will probably need to drill their own well or haul water, as the city’s surface water ponds have dried significantly due to drought.
According to a February 6, 2004 Arizona Republic report, the Central Arizona Project (CAP) could continue to fill orders if our multi-year drought persists into the next decade. CAP investigated prolonged drought scenarios and determined that, by shifting water from agricultural to municipal/industrial and tribal use, CAP could provide supplies to homes and businesses in an even more prolonged drought.
6. Arizona Reservoir Levels (through the end of January 2004) Source: USDA NRCS
������
Notes: Reservoir reports are updated monthly and are provided by the National Water and Climate Center (NWCC) of the U.S. Department of Agriculture’s Natural Resource Conservation Service (NRCS). Portions of the information provided in this figure can be accessed at the NRCS website: http://www.wcc.nrcs.usda.gov/wsf/reservoir/resv_rpt.html
As of 2/16/04, Arizona’s report had been updated through the end of January.
For additional information, contact Tom Pagano of the NWCC-NRCS-USDA ([email protected]; 503-414-3010) or Larry Martinez, NRCS, USDA, 3003 N. Central Ave, Suite 800, Phoenix, Arizona 85012-2945; 602-280-8841; [email protected])

Conchas Reservoir
Brantley
Sumner
Caballo
Costilla
Elephant Butte
Navajo Reservoir
Heron
El Vado
Cochiti
Abiquiu
Santa Rosa
Lake Avalon
current as % of capacity (current storage*/total capacity*)
current as % of average (current storage*/average storage*)
current as % of last year (current storage*/last year's storage*)
*Units are in thousands of acre-feet
55% (14.4 / 26)*
230% (2.3 / 0)
51% (8.4 / 16.5)*
40% (5.1 / 12.9)*
112% (13.6 / 12.1)*
197% (86.1 / 43.7)*
34% (13.1 / 39)*
97% (48.5 / 50)*
177% (4.6 / 2.6)*
257% (30.6 / 11.9)*
63% (241.7 / 380.8)*
68% (109.8 / 161.3)*
87% (707.2 / 814.6)*
8% (14.4 / 187.1)*
82% (2.3 / 2.8)*
36% (8.4 / 23.5)*
8% (5.1 / 64.5)*
32% (13.6 / 42)*
80% (86.1 / 107.6)*
14% (13.1 / 91.8)*
84% (48.5 / 58)*
84% (4.6 / 5.5)*
32% (30.6 / 96.7)*
19% (241.7 / 1291)*
39% (109.8 / 278)*
57% (707.2 / 1250.3)*
6% (14.4 / 254)*
38% (2.3 / 6)*
6% (8.4 / 147.5)*
1% (5.1 / 447)*
13% (13.6 / 102)*
16% (86.1 / 554.5)*
4% (13.1 / 331.5)*
10% (48.5 / 502.3)*
29% (4.6 / 16)*
16% (30.6 / 186.3)*
12% (241.7 / 2065)*
27% (109.8 / 400)*
42% (707.2 / 1696)*
Highlights: Many New Mexico reservoirs registered slight gains since January 2004. Total reservoir storage for the state increased one percentage point (about 40,000 acre-feet) from what it was in January, according to a USDA-NRCS report. An acre-foot is the amount of water required to fill one acre to the level of one foot, and is approximately enough water to provide for the water needs of several families for one year. Overall reservoir levels continue to be well below average across the state.
Recent precipitation could result in increases, but dry soils might absorb significant volumes of moisture. “It’s much like having that snowpack sitting on a dry sponge,” said Richard Armijo, a snow surveyor for USDA-NRCS in Albuquerque (El Paso Times, February 12, 2004). According to a February 20, 2004 report in the Albuquerque Journal, recent snow has provided Santa Fe city reservoirs with more water than they have recorded in mid-February during the past two years.
An El Paso Times report (February 12, 2004) suggests that water allocations for the Elephant Butte Irrigation District will again be down from average allocations. Officials say that farmers are planning for shortage by planting fewer crops and supplementing surface water supplies with groundwater.
7. New Mexico Reservoir Levels (through the end of January 2004) Source: USDA NRCS
������
Notes: Reservoir reports are updated monthly and are provided by the National Water and Climate Center (NWCC) of the U.S. Department of Agriculture’s Natural Resource Conservation Service (NRCS). Reports can be accessed at their website: http://www.wcc.nrcs.usda.gov/wsf/reservoir/resv_rpt.html.
As of 2/16/04, New Mexico’s report had been updated through the end of January.
For additional information, contact Tom Pagano of the NWCC-NRCS-USDA ([email protected]; 503-414-3010) orDan Murray, NRCS, USDA, 6200 Jefferson NE, Albuquerque, NM 87109; 505-761-4436; [email protected])

8. Snowpack in the Southwestern United States (updated 2/23/04) Source: USDA NRCS, WRCC
Notes:The data shown on this page are from snowpack telemetry (SNOTEL) stations grouped according to river basin. These remote stations sample snow, temperature, precipitation, and other parameters at individual sites.
Snow water content (SWC) and snow water equivalent (SWE) are different terms for the same parameter.
The SWC in Figure 8 refers to the snow water content found at selected SNOTEL sites in or near each basin compared to the average value for those sites on this day. Average refers to the arithmetic mean of annual data from 1971-2000. SWC is the amount of water currently in snow. It depends on the density and consistency of the snow. Wet, heavy snow will produce greater SWC than light, powdery snow.
Each box on the map represents a river basin for which SWC data from individual SNOTEL sites have been averaged. Arizona and New Mexico river basins for which SNOTEL SWC estimates are available are numbered in Figure 8. The colors of the boxes correspond to the percent of average SWC in the river basins.
The dark lines within state boundaries delineate large river basins in the Southwest.
These data are provisional and subject to revision. They have not been processed for quality assurance. However, they provide the best available land-based estimates during the snow measurement season.
Highlights: Snowpack remains below-average throughout Arizona and New Mexico. Snow water content (SWC) across Arizona and southwestern New Mexico is between 59–77 percent of average as this Southwest Climate Outlook goes to press. Above-average SWC has been received in the headwaters of the Rio Grande River Basin. However, soils depleted by multi-year drought might deprive the Rio Grande of the benefits of these increases. Below-average snowfall since the mid-1990s has financially hurt the 777-acre Arizona Snowbowl ski area in the San Francisco Peaks, north of Flagstaff, Arizona (Tucson Citizen, February 16, 2004). There has been some controversy over USDA-Forest Service officials support snowmaking plans at the Arizona Snowbowl, in order to maintain ski operations during low-snow (drought) years. The snowmaking plan requires Flagstaff to sell reclaimed water to the Snowbowl.For color maps of SNOTEL basin SWC, visit: http://www.wrcc.dri.edu/snotelanom/basinswe.htmlFor a numeric version of the SWC map, visit: http://www.wrcc.dri.edu/snotelanom/basinswen.htmlFor a list of river basin SWC and precipitation, visit http://www.wrcc.dri.edu/snotelanom/snotelbasin
������
1 Verde River Basin2 Central Mogollon Rim3 Little Colorado -
Southern Headwaters4 Salt River Basin
5 Mimbres River Basin6 San Francisco River Basin
7 Gila River Basin
8 Zuni/Bluewater River Basin9 Pecos River
10 Jemez River Basin
11 San Miguel, Dolores, Animas, and
San Juan River Basins12 Rio Chama River Basin
13 Cimarron River Basin14 Sangre de Cristo Mountain Range Basin15 San Juan River Headwaters
Arizona Basins New Mexico Basins
8. Basin average snow water content (SWC) for available monitoring sites as of
2/23/04 (% of average).
1 2 3
4
5
6
7
8
11
109
1312
1415
Basin
Boundaries
110% to 125%
90% to 110%
75% to 90%
50% to 75%
25% to 50%
125% to 150%
150% to 175%
175% to 200%
> 200%
< 25%
No snow reported

Section C
FORECASTS

9a. Long-lead national temperature forecast
for March - May 2004.9b. Long-lead national temperature forecast
for April - June 2004.
9c. Long-lead national temperature forecast
for May - July 2004.9d. Long-lead national temperature forecast
for June - August 2004.
Overlapping 3-month long-lead temperature forecasts (released 2/19/04).
EC
Percent Likelihood
of Above and Below
Average Temperatures*
*EC indicates no forecasted
anomalies due to lack of
model skill.
33% - 39.9%
40% - 49.9%
A = Above
EC
EC
EC
EC
EC
EC
EC
50% - 59.9%
60% - 69.9%
EC
EC
33% - 39.9%
40% - 49.9%B = Below
EC
EC
EC
EC
EC
> 70%
9. Temperature: Multi-season Outlooks Source: NOAA Climate Prediction Center
Notes:The NOAA CPC (National Oceanic and Atmospheric Administration Climate Prediction Center) outlooks predict the likelihood (chance) of above-average, average, and below-average temperature, but not the magnitude of such variation. The numbers on the maps do not refer to degrees of temperature.
In a situation where there is no forecast skill, one might look at average conditions in order to get an idea of what might happen. Using past climate as a guide to average conditions and dividing the past record into 3 categories, there is a 33.3 percent chance of above-average, a 33.3 percent chance of average, and a 33.3 percent chance of below-average temperature.
Thus, using the NOAA CPC likelihood forecast, in areas with light brown shading there is a 33.3-40.0 percent chance of above-average, a 33.3 percent chance of average, and a 26.7-33.3 percent chance of below-average temperature.
The term average refers to the 1971–2000 average. This practice is standard in the field of climatology.
Equal Chances (EC) indicates areas where reliability (i.e., the ‘skill’) of the forecast is poor and no anomaly prediction is offered.
Highlights: The NOAA-CPC temperature outlooks for March through August 2004 continue to show considerably increased probabilities of above-average temperatures for many areas of the Southwest. Although the maximum likelihood of above-average temperatures through June is somewhat decreased compared to the previous month’s outlook, temperature projections for July and August suggest maximum likelihoods of above-average temperatures of greater than 60 to 70 percent over much of Arizona. The CPC predictions are based primarily on agreement between long-term temperature trends for the region and statistical models. The predictions indicate very good agreement among dynamical models regarding an atmospheric circulation pattern that favors high temperatures over the western United States. The International Research Institute for Climate Prediction temperature forecasts (not pictured) also indicate increased probabilities of above-average temperature for the southwestern United States through at least June 2004. For more information on CPC forecasts, visit:http://www.cpc.ncep.noaa.gov/products/predictions/multi_season/13_seasonal_outlooks/color/churchill.htmlPlease note that this website has many graphics and may load slowly on your computer.For IRI forecasts, visit: http://iri.columbia.edu/climate/forecast/net_asmt/
������
10a. Long-lead U.S. precipitation forecast
for March - May 2004.10b. Long-lead U.S. precipitation forecast
for April - June 2004.
10c. Long-lead U.S. precipitation forecast
for May - July 2004.
10d. Long-lead U.S. precipitation forecast
for June - August 2004.
Overlapping 3-month long-lead precipitation forcasts (released 2/19/04).
EC
EC
EC
Percent Likelihood
of Above or Below
Average Precipitation*
*EC indicates no forecasted
anomalies due to lack of
model skill.
> 40%
33% - 40%
33% - 40%
> 40%A = Above
B = Below
EC
ECEC
EC
ECEC
EC
EC
EC
EC
EC
EC
EC
EC
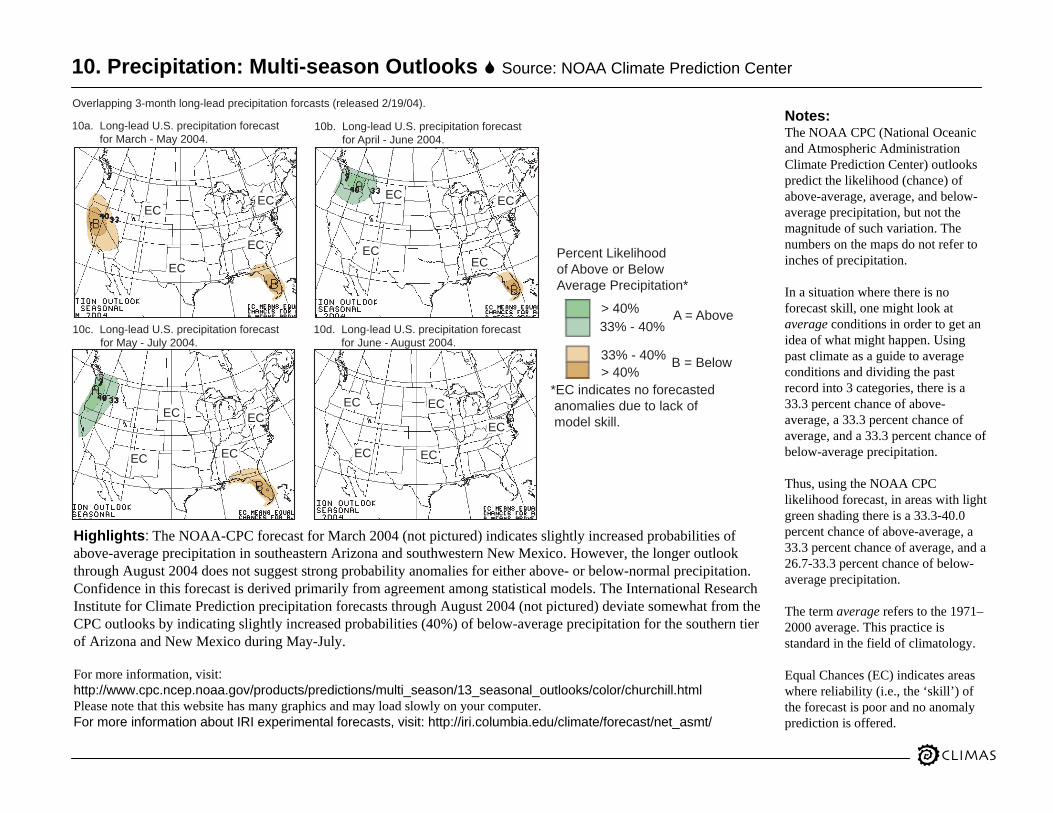
10. Precipitation: Multi-season Outlooks Source: NOAA Climate Prediction Center
Notes:The NOAA CPC (National Oceanic and Atmospheric Administration Climate Prediction Center) outlooks predict the likelihood (chance) of above-average, average, and below-average precipitation, but not the magnitude of such variation. The numbers on the maps do not refer to inches of precipitation.
In a situation where there is no forecast skill, one might look at average conditions in order to get an idea of what might happen. Using past climate as a guide to average conditions and dividing the past record into 3 categories, there is a 33.3 percent chance of above-average, a 33.3 percent chance of average, and a 33.3 percent chance of below-average precipitation.
Thus, using the NOAA CPC likelihood forecast, in areas with light green shading there is a 33.3-40.0 percent chance of above-average, a 33.3 percent chance of average, and a 26.7-33.3 percent chance of below-average precipitation.
The term average refers to the 1971–2000 average. This practice is standard in the field of climatology.
Equal Chances (EC) indicates areas where reliability (i.e., the ‘skill’) of the forecast is poor and no anomaly prediction is offered.
Highlights: The NOAA-CPC forecast for March 2004 (not pictured) indicates slightly increased probabilities of above-average precipitation in southeastern Arizona and southwestern New Mexico. However, the longer outlook through August 2004 does not suggest strong probability anomalies for either above- or below-normal precipitation. Confidence in this forecast is derived primarily from agreement among statistical models. The International Research Institute for Climate Prediction precipitation forecasts through August 2004 (not pictured) deviate somewhat from the CPC outlooks by indicating slightly increased probabilities (40%) of below-average precipitation for the southern tier of Arizona and New Mexico during May-July.
For more information, visit:http://www.cpc.ncep.noaa.gov/products/predictions/multi_season/13_seasonal_outlooks/color/churchill.htmlPlease note that this website has many graphics and may load slowly on your computer.For more information about IRI experimental forecasts, visit: http://iri.columbia.edu/climate/forecast/net_asmt/
������

11a. Seasonal drought outlook through
May 2004 (accessed 2/19).
11b. January 2004 PHDI conditions (accessed
2/19).
-no data-
11c. Precipitation (in.) required to end cur-
rent drought conditions in three months.
11d. Percent of average precipitation
required to end current drought
conditions in three months.
-no data-
11e. Probability of receiving precipitation
required to end current drought
conditions in three months.
-4.00 andbelow
extreme drought
severe drought
moderatedrought
mid-range drought
moderatelymoist
verymoist
extremelymoist
-3.00 to -3.99
-2.00 to -2.99
-1.99 to 1.99
+2.00 to 2.99
+3.00 to 3.99
+4.00 and above
trace to 3.00
3.01 to 6.00
6.01 to 9.00
9.01 to 12.00
12.01 to 15.00
15.01 to 18.00
18.01 to 21.00
below 75%
75% to100%
100% to125%
125% to150%
150% to175%
175% to200%
200% to412%
0.0% to 2.0%
2.0% to4.0%
4.0% to6.0%
6.0% to 8.0%
8.0% to10.0%
10.0% to 12.0%
12.0% to60.0%
drought to persistor intensify
drought ongoing,some improvement
drought development likely -no data-
-no data-
-no data--no data-
11. Drought: Seasonal Drought and PHDI Outlook Maps Sources: NOAA-CPC, NCDC
������
white have a current PHDI value greater than –2.0 (e.g., in Figure 11b - e, these regions are not in hydrological drought).
The season in which the precipitation falls greatly influences the amount of precipitation needed to end a drought. For example, during a typically wet season more precipitation may be required to end a drought than during a typically dry season. Also, because soil moisture conditions generally are lower in the dry seasons, the precipitation needed to bring soil conditions back to normal may be less than that required to return soil moisture conditions to normal during a generally wetter season. Figure 11d shows the percent of average precipitation needed to end drought conditions in three months, based on regional precipitation records from 1961–1990. A region that typically experiences extreme precipitation events during the summer, for example, may be more likely to receive enough rain to end a drought than a region that typically is dry during the same season. The seasons with the greatest probability of receiving substantially more precipitation than average are those subject to more extreme precipitation events (such as hurricane-related rainfall), not necessarily those seasons that normally receive the greatest average amounts of precipitation. Figure 11e shows the probability, based on historical precipitation patterns, of regions in Arizona and New Mexico receiving enough precipitation in the next three months to end the drought. Note that these probabilities do not take into account atmospheric and climatic variability (such as El Niño-Southern Oscillation), which also influence seasonal precipitation probabilities.
Highlights: The U.S. Seasonal Drought Outlook (Figure 11a) indicates that improvement in drought conditions is likely for Arizona and northern New Mexico through May 2004. However, the probability of ending drought within the next three months, based on analysis of historical data, is still exceedingly low for most of the Southwest.
For more information, visit: http://www.drought.noaa.gov/ —and— http://www.ncdc.noaa.gov/oa/climate/research/drought/drought.html
including outputs of short- and long-term forecasting models.
Figures 11b-e are based on the Palmer Hydrological Drought Index (PHDI), which reflects long-term precipitation deficits. PHDI is a measure of reservoir and groundwater level impacts, which take arelatively long time to develop and to recover from drought. Figure 11b shows the current PHDI status for Arizona and New Mexico.
Figure 11c shows the amount of precipitation, in inches, needed over the next three months to change a region’s PHDI status to -0.5 or greater—in other words, to end the drought. Regions shown in
Notes: The delineated areas in the Seasonal Drought Outlook (Fig. 11a) are defined subjec-tively and are based on expert assess-ment of numerousindicators,

12. Streamflow Forecast for Spring and Summer Source: USDA NRCS National Water and Climate Center
Highlights: Below-average streamflow is most likely this spring and summer for most of Arizona and New Mexico river basins. The San Juan and Upper Rio Grande are the only river basins in the two states that are predicted to have streamflows near or slightly-above average. The most probable inflow to Lake Powell is predicted to be 82 percent of the 1971–2000 average (Figure 12b), with only a 30 percent chance of near-average (98 percent) inflow. The most probable inflow to the Rio Grande at Otowi Bridge is predicted to be 84 percent of average. New Mexico has entered into purchase agreements with landowners in the Pecos River Basin, in order to secure land and water rights so the state can ensure water deliveries to Texas (Associated Press, February 18, 2004). However, State Engineer John D’Antonio is concerned that a lack of funds could delay plans. Texas senator Kay Bailey Hutchinson called on the government of Mexico to repay a more than one million acre-feet of water debt to the United States (Houston Chronicle, February 17, 2004). Northern Mexico, which, like the Southwest has experienced multi-year drought, began falling behind on its water payments to the United States about a decade ago. For state river basin streamflow probability charts, visit: http://www.wcc.nrcs.usda.gov/water/strm_cht.plFor information on interpreting streamflow forecasts, visit: http://www.wcc.nrcs.usda.gov/factpub/intrpret.htmlFor western U.S. water supply outlooks, visit http://www.wcc.nrcs.usda.gov/water/quantity/westwide.html
Notes:The forecast information provided in Figures 12a-c is updated monthly and is provided by the National Resources Conservation Service (NRCS). Unless otherwise specified, all streamflow forecasts are for streamflow volumes that would occur naturally without any upstream influences, such as reservoirs and diversions.
Each month, five streamflow volume forecasts are made by the NRCS for several river basins in the United States. These five forecasts correspond to standard exceedence percentages, which can be used as approximations for varying ‘risk’ thresholds when planning for short-term future water availability.
NRCS provides the 90, 70, 50, 30, and 10 percent exceedence streamflow volumes. Each exceedence percentage level corresponds to the following statement: “There is an (X) percent chance that the streamflow volume will exceed the forecast volume value for that exceedence percentage.” Conversely, the forecast also implies that there is a (100-X) percent chance the volume will be less than this forecasted volume. In Figure 12c for example, there is a 30 percent chance that Rio Grande at Otowi Bridge will exceed 878.1 acre-feet of water (116 percent of average) between March and July and a 70 percent chance that it will not exceed that volume. Note that for an individual location, as the exceedence percentage declines, forecasted streamflow volume increases.
In addition to monthly graphical forecasts for individual points along rivers (Figures 12b and 12c), the NRCS provides a forecast map (Figure 12a) of basin-wide streamflow volume averages based on the forecasted 50 percent exceedence threshold.
������
>150
130 - 150
110 - 129
90 - 109
70 - 89
50 - 69
<50
12a. NRCS spring and summer streamflow forecast as of
February 1, 2004 (% of average).
12b. NRCS percent exceedence forecast chart
for Lake Powell inflow (as of 02/04/04).
12c. NRCS percent exceedence forecast chart
for the Rio Grande (as of 02/04/04).
Lake Powell Inflow
forecast period: April - July 2004
average storage: 7.93 million acre-feet
*the likelihood of exceeding forecasted
streamflow volume.
90%
70%
50%
30%
10%
associated forecasted streamflow volume (thousands
of acre-feet) and percent of average volume.
percent chance
of exceedence*
†
3410 (43%)
5234 (66%)
6503 (82%)
7771 (98%)
9595 (121%)
Rio Grande at Otowi Bridge
forecast period: March - July 2004
average storage: 757 thousand acre-feet
90%
70%
50%
30%
10%
percent chance
of exceedence*
113.6 (15%)
393.6 (52%)
635.9 (84%)
878.1 (116%)
1226 (162%)
†
†
†
†
†
†
†
†
†
†

Below Normal Potential
Above Normal Potential
13a. Monthly wildfire outlook (valid February 1 - 29). 13b. Monthly fire danger outlook (valid February 1 - 29).
Near-
Normal
Potential
Notes: The National Interagency Coordination Center (NICC) at the National Interagency Fire Center (NIFC) produces monthly (Figure 13a) wildland fire outlooks. These forecasts consider climate forecasts and surface-fuels conditions in order to assess fire potential. They are subjective assessments, based on synthesis of regional fire danger outlooks. The Southwest Coordination Center (SWCC) produces more detailed monthly subjective assessments for Arizona, New Mexico, and west Texas (Figure 13b).
Highlights: The February 1-29, 2004 SWCC outlook is for normal to above-normal fire danger across southern New Mexico and west Texas (Figure 13b). The NICC forecast (Figure 13a) indicates below near-normal fire potential for our region, based on the potential for fires greater than 100 acres. Other indicators, such as observations of large fuel moisture readings (1000-hour fuels), and experimental measures of vegetation health and greenness for the Southwest (not pictured) indicate relatively low potential for large fires across northern Arizona and New Mexico. However, fine fuels, such as grass, are reported by the SWCC to be in a cured condition as of late January 2004.For more detailed discussions, visit the National Wildland Fire Outlook web page: http://www.nifc.gov/news/nicc.htmland the Southwest Area Wildland Fire Operations (SWCC) web page: http://www.fs.fed.us/r3/fire/For an array of climate and fire assessment tools, visit the Desert Research Institute program for Climate, Ecosystem, and Fire Applications (CEFA) web page: http://cefa.dri.edu/Assessment_Products/assess_index.htm
13. National Wildland Fire Outlook Source: National Interagency Coordination Center
������

14. Current (red) and past La Niña event sea surface temperature anomalies (°C)
for the El Niño 3.4 monitoring region of the equatorial Pacific Ocean.
-3
-2
-1
0
1
2
3
Jul Oct Jan Apr Jul Oct Jan Apr Jul Oct
SS
T d
ep
art
ure
fro
m a
ve
rag
e (
°C
)
current (2004)
1999-2000
1998-1999
1995-1996
1988-1989
1975-1976
1973-1974
1970-1971
1955-1956
Yr. -1 Yr. 0 Yr. +1
Dec
14. Tropical Pacific Sea Surface Temperature Forecast Sources: NOAA-CPC, IRI
Notes: The graph (Figure 14) shows sea-surface temperature (SST) departures from the long-term average for the Niño 3.4 region in the central-eastern equatorial Pacific Ocean. SSTs in this region are a sensitive indicator of ENSO conditions.
Each line on the graph represents SST departures for previous La Niña events, beginning with the year before the event began (Yr. –1), continuing through the event year (Yr. 0), and into the decay of the event during the subsequent year (Yr. +1).
The most recent SST departures are plotted as a thick red line. The magnitude of the SST departure, its timing during the seasonal cycle, and its exact location in the equatorial Pacific Ocean are some of the factors that determine the degree of impacts experienced in the Southwest.
Highlights: Sea-surface temperatures (SSTs) remained slightly above average for most of the equatorial Pacific Ocean. The above-average SSTs experienced since early summer were not warm enough to constitute an official El Niño event. The International Research Institute for Climate Prediction states that the chance that an El Niño episode will develop between May and mid-summer is less than 50 percent. The chances of a La Niñaepisode developing during the same period are much less than that of an average year. Both IRI and NOAA’s Climate Prediction Center agree that atmospheric conditions in the Pacific do not show trends that would support the development of an El Niño episode.
For a technical discussion of current El Niño conditions, visit: http://www.cpc.ncep.noaa.gov/products/analysis_monitoring/enso_advisory/ For more information about El Niño and to access graphics similar to the figure above, visit: http://iri.columbia.edu/climate/ENSO/
������

Percent Likelihood
of Above and Below
Average Temperatures*
*EC indicates no forecasted
anomalies due to lack of
model skill.
33% - 39%40% - 49% A = Above
15
25
35
45
55
40
60
30
50
10
20
15a. Long-lead U.S. temperature forecast for November 2003 -
January 2004.15b. Average temperature (in °F) for November 2003 - January 2004.
-8
-6
-4
-2
0
+2
+4
+6
+8
15c. Average temperature departure (in °F) for November 2003 -
January 2004.
Notes: Figure 15a shows the NOAA Climate Prediction Center (CPC) temperature outlook for the months November 2003–January 2004. This forecast was made in October 2003.
The November 2003–January 2004 NOAA CPC outlook predicts the likelihood (chance) of above-average, average, and below-average temperature, but not the magnitude of such variation. The numbers on the maps do not refer to degrees of temperature. Care should be exercised when comparing the forecast (probability) map with the observed temperature maps described below.
Using past climate as a guide to average conditions and dividing the past record into 3 categories, there is a 33.3 percent chance of above-average, a 33.3 percent chance of average, and a 33.3 percent chance of below-average temperature. Thus, using the NOAA CPC likelihood forecast, in areas with light brown shading there is a 33.3-39.9 percent chance of above-average, a 33.3 percent chance of average, and a 26.8-33.3 percent chance of below-average precipitation. Equal Chances (EC) indicates areas where reliability (i.e., the skill) of the forecast is poor and no prediction is offered.
Figure 15b shows the observed average temperature between November 2003–January 2004 (°F). Figure 15c shows the observed departure of temperature (°F) from the average for November 2003–January 2004.
In all of the figures on this page, the term average refers to the 1971-2000 average. This practice is standard in the field of climatology.
������
Highlights: The NOAA-CPC November–January temperature outlook forecasted increased probabilities for above-average temperatures for all of the southwestern United States (Fig 15a). Most of this area saw normal to slightly below average temperatures during the forecast period. Slightly above average temperatures were generally confined to the four corners area and eastern New Mexico.
15. Temperature Verification: November 2003–January 2004 Source: NOAA Climate Prediction Center

Percent Likelihood
of Above or Below
Average Precipitation*
*EC indicates no forecasted
anomalies due to lack of
model skill.
40% - 49%33% - 39%
33% - 39%40% - 49% A = Above
B = Below
16a. Long-lead U.S. precipitation forecast for November 2003 -
January 2004.
0.5
2.5
5
10
17.5
25
32.5
40
47.5
16b. Observed precipitation for November 2003 - January 2004 (inches).
25%
50%
70%
90%
200%
150%
100%
110%
130%
5%
300%
16c. Percent of average precipitation observed between November 2003 -
January 2004.
Notes: Figure 16a shows the NOAA Climate Prediction Center (CPC) precipitation outlook for the months November 2003–January 2004. This forecast was made in October 2003.
The November 2003–January 2004 NOAA CPC outlook predicts the likelihood (chance) of above-average, average, and below-average precipitation, but not the magnitude of such variation. The numbers on the forecast map (Figure 16a) do not refer to inches of precipitation. Care should be exercised when comparing the forecast (probability) map with the observed precipitation maps described below.
Using past climate as a guide to average conditions and dividing the past record into 3 categories, there is a 33.3 percent chance of above-average, a 33.3 percent chance of average, and a 33.3 percent chance of below-average precipitation. Thus, using the NOAA CPC likelihood forecast, in areas with light brown shading there is a 33.3-39.9 percent chance of above-average, a 33.3 percent chance of average, and a 26.8-33.3 percent chance of below-average precipitation. Equal Chances (EC) indicates areas where reliability (i.e., the skill) of the forecast is poor and no prediction is offered.
Figure 16b shows the total precipitation observed between November 2003–January 2004 in inches. Figure 16c shows the observed percent of average precipitation for November 2003–January 2004.
In all of the figures on this page, the term average refers to the 1971-2000 average. This practice is standard in the field of climatology.
������
Highlights: The NOAA-CPC November–January 2004 precipitation outlook forecasted increased probabilities of below-average precipitation for all of Arizona (Figure 16a). The forecast was correct for Arizona, with precipitation amounts ranging from 25-70 percent for the forecast period. The forecast for above-normal precipitation across eastern Texas, Oklahoma, and Arkansas did not verify well. Precipitation amounts were highly variable across this area but generally below average.
16. Precipitation Verification: November 2003–January 2004 Source: NOAA Climate Prediction Center

Section D
FOCUS ON PDSI PRODUCTS

17. Focus on National Agricultural Decision Support System Monthly PDSI Product
������
Notes: The University of Nebraska Lincoln provides a collection of decision support tools designed to help agricultural producers access a variety of risks. The National Agricultural Decision Support System includes drought indices such as the Palmer Drought Severity Index (PDSI). This website is accessible at http://www.nadss.unl.edu/index.php. Additional information about the PDSI can be found in the CLIMAS October 2002 END Insight focus pages http://www.ispe.arizona.edu/climas/forecasts/archive/oct2002/swoutlook.html.
To access the PDSI “Quicklink” section, use the link on the left side of the page. To view monthly data, choose a state and click the monthly data radio button in the box labeled Generate a PDSI Report.
Under Parameters, there are a number of options to set to produce PDSI maps for Arizona and New Mexico. For the end month, go at least one month back to get enough sample sites. Interpolation method refers to how contour lines on the map are created. Each method should produce similar results; however, some methods require more stations. Under analysis format, if table is used, a table showing values at individual stations will be shown. The analysis format will effect how the interpolation occurs. For example, if the County-level Mapis used, then the interpolation will use the average value for the county in the interpolation. Raster maps are recommended in ordert to increase the geographic specificity of the map.
Highlights: For the month of September 2003, most of New Mexico experienced moderate to extreme drought conditions. This analysis was conducted using 139 stations; spline interpolation was used on county-level data using the original PDSI index.
The overlay layer allows information to be overlaid on top of the map analysis. For example, to examine what districts might be affected by drought, choose to overlay the congressional districts. To choose multiple overlay layers, hold the “Ctrl” key (Command Key on Macintosh) as selections are made.
To examine specific stations, click on their name from the list. Holding the “Ctrl” key will allow for multiple station selections. All available sites are selected by default.
Resolution settings alter the level of detail used in analysis. Using the low resolution (3000 m) provides a reasonable level of detail for most analyses. Increasing the resolution will result in longer download times.
-0.50 to -0.99 (Incipient Dry Spell)-1.00 to -1.99 (Mild Drought)-2.00 to -2.99 (Moderate Drought)-3.00 to -3.99 (Severe Drought)-4.00 and less (Extreme Dought)
17. PDSI Map for New Mexico during September 2003

+0.49 to -0.49 (Near Normal)-0.50 to -0.99 (Incipient Dry Spell)-1.00 to -1.99 (Mild Drought)-2.00 to -2.99 (Moderate Drought)-3.00 to -3.99 (Severe Drought)-4.00 and less (Extreme Dought)
18. PDSI Map for Arizona between September 10 to September 23, 2003
18. Focus on National Agricultural Decision Support System Weekly PDSI Product
������
Highlights: For the period between September 10 and September 23, 2003, most of Arizona experienced moderate to extreme drought conditions. This analysis was conducted using 135 stations; a spline interpolation method was used on PDSI data.
The overlay layer allows information to be overlaid on top of the map analysis. For example, to examine what districts might be affected by drought, choose to overlay the congressional districts. To choose multiple overlay layers, hold the “Ctrl” key (Command Key on Macintosh) as selections are made.
To examine specific stations, click on their name from the list. Holding the “Ctrl” key will allow for multiple station selections. All available sites are selected by default.
Resolution settings alter the level of detail used in analysis. Using the low resolution (3000 m) provides a reasonable level of detail for most analyses. Increasing the resolution will result in longer download times.
Notes: The University of Nebraska, Lincoln provides a collection of decision support tools designed to help agricultural producers access a variety of risks. The National Agricultural Decision Support System includes drought indices such as the Palmer Drought Severity Index (PDSI). This website is accessible at http://www.nadss.unl.edu/index.php. Additional information about the PDSI can be found in the CLIMAS October 2002 END Insight focus pages http://www.ispe.arizona.edu/climas/forecasts/archive/oct2002/swoutlook.html.
To access the PDSI Quicklink section, use the link on the left side of the page. To view monthly data, choose a state and click the monthly data radio button in the box labeled Generate a PDSI Report.
Under Parameters, there are a number of options to set to produce PDSI maps for Arizona and New Mexico. For the end month, go at least one month back to get enough sample sites. Interpolation method refers to how contour lines on the map are created. Each method should produce similar results; however, some methods require more stations. Under analysis format, if table is used, a table showing values at individual stations will be shown. The analysis format will effect how the interpolation occurs. For example, if the County-level Mapis used, then the interpolation will use the average value for the county in the interpolation. Raster maps are recommended in ordert to increase the geographic specificity of the map.


![Manula Cultivo Mrosenbergii Climas Templados[1]](https://img.pdfslide.us/doc/110x75/577cde181a28ab9e78ae60e1/manula-cultivo-mrosenbergii-climas-templados1.jpg)