Embed Size (px)
Citation preview
13
Cliffed and rocky coasts
13.1 I Synopsis
The focus of this chapter is on coasts where the shoreline is largely developed in rocks, or in sedi-ments that possess some strength due to cohe-sion and thus are able to offer resistance to wave action. Beach material is generally scarce and is found primarily as a thin layer frontillg the cliff toe, or in isolated pod<et beaches. The term cliff is used where the slope angle >40° and thus cliffed shorelines are those characterised by steep slopes rising abruptly from the water or from the bad< of a platform that is narrow enough for the toe of the slope to be affected by wave action during storms. Cliffed shorelines develop in sedimentary rocks ranging from recent deposits with some cohesion due to the presence of clays or to overconsolidation due to glacial loading, throughwealdy cemented shale and sandstone. The most resistant cliffs are found in rocks such as limestone, where chem-ical bonding is important, and in massive igne-ous and metamorphic rocl<s such as basalt or granite that possess strength due to crystallisa-tion from melt and high pressures. Unlike sandy coasts where erosion may be reversed by deposi-tion and progradation, erosion of bedrock coasts destroys the bonding that provided strength and thus there is no reversal of the erosion process -cliffs remain stationary or they recede.
On hard, strong bedrock coasts rock strength greatly exceeds the erosional forces of individual waves and erosion tal<es place very slowly -perhaps millimetres to a few centimetres per
century. Since sea level has been at the present level in most parts of the world for <5000 years, cliffs in these materials reflect the operation of both coastal and subaerial processes operating over 103-105 years and often the shoreline merely reflects the position of the sea against a pre-existing topography. The spectacular cliffs of fjords associated with glaciated highlands are a good example of this. Coastal processes act to modify the shoreline but most of the coastal morphology is inherited.
On soft coasts, such as those developed in glacial till and shale, wave action is able to erode the toe of the cliff relatively rapidly and to remove the eroded debris. Recession of the cliffs can be on the order of decimetres to metres per year and thus the cliff form is controlled by modern coastal processes and is not an inherited feature. Because of their relatively high rates of recession, these coasts offer an opportunity to study the controls on cliff erosion and profile evolution, and to extrapolate the results of these studies to hard rock coasts. Studies of soft rock coasts are also timely because the high recession rates may result in threats to houses and infrastructure located on the cliff top and lead to calls for inter-vention in the form of shore protection.
13.2 I Cliffed coast morphology
13.2.1 Cliff form and occurrence While cliffed coasts are occasionally formed in cohesionless sands where plant roots and soil moisture provide some strength, most cliffed
Tableland
shorelines develop in material that possesses strength due to cohesion provided by the bond-ing of clay minerals, cementation by chemical precipitates or the crystal bonding of igneous and metamorphic rocks. The term cliff is used here for all shorelines with a steep subaerial slope - strictly speal<ing some portion of the slope should exceed 40°. The height of the cliff should exceed the maximum height of wave run-up and overtopping (though wave spray may reach the top of the cliff). If the cliff is so low that wave overtopping can occur then the shore-line feature is termed a bani<. The term bluff can be used interchangeably with cliff, but here its use is restricted to describing cliffs formed in unconsolidated or wealdy consolidated sedi-ments, including sand, silt, clay and till. These cliffed coasts are termed cohesive coasts to dis-tinguish them from coasts formed in much stronger bedrock where coastal processes mod-ifY the shoreline relatively slowly. While the ter-minology is a bit ambiguous because muddy coasts (e.g., estuarine mudflats) are also cohesive and because cohesion can equally apply to crys-talline rocks, practically it is useful to mal<e the distinction between them.
13.2 CLIFFED COAST MORPHOLOGY 397
The presence of a cliffed shoreline reflects the existence of relatively high ground near the coast and this in turn may reflect tectonic forces on a continental scale, local folding and faulting, fluvial or glacial erosion, water level change, or simply recession due to coastal erosion on a gen-tly sloping plain. Thus, the height of the coastal cliff is controlled primarily by the relief of the coastal zone and secondarily due to the opera-tion of coastal processes.
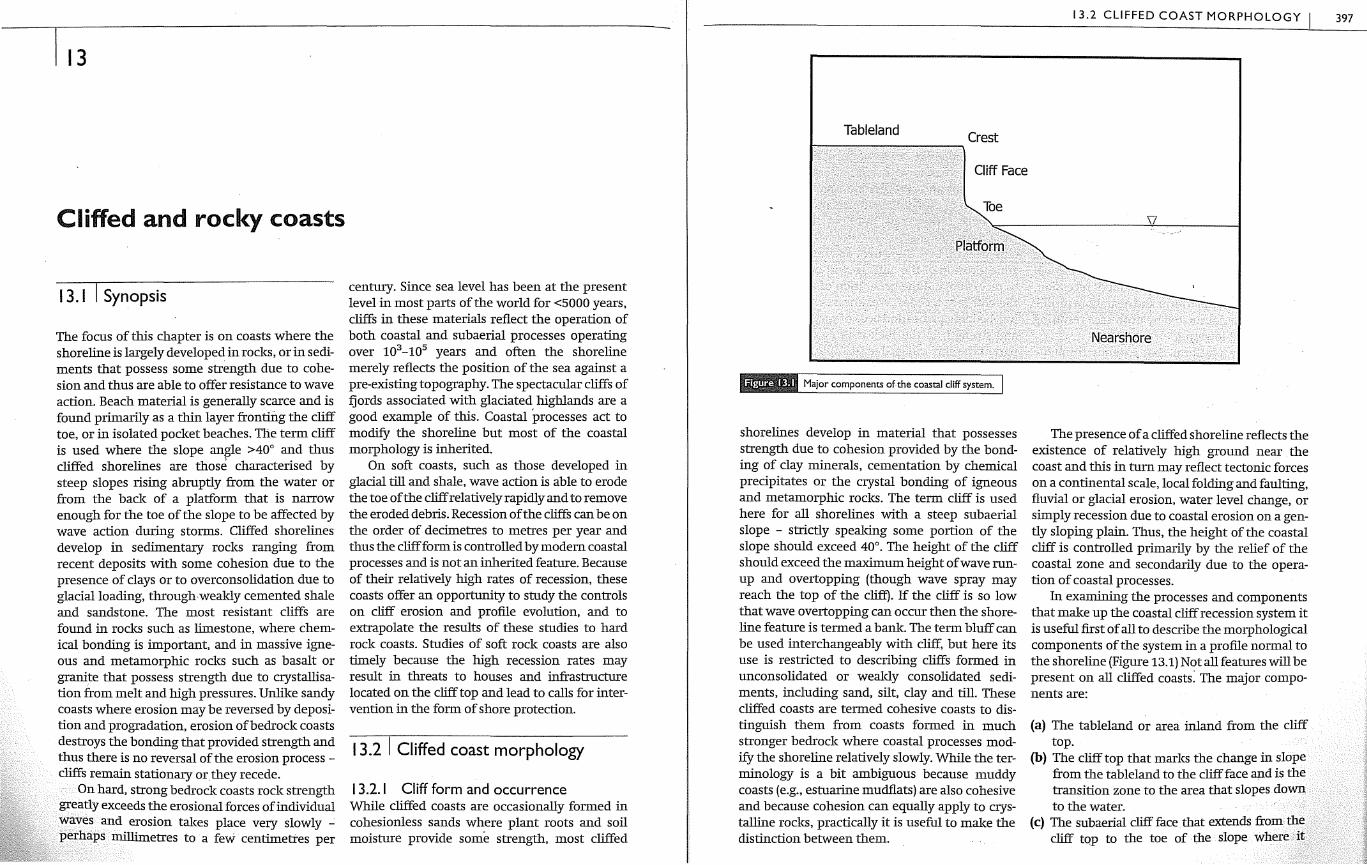
In examining the processes and components that mal<e up the coastal cliff recession system it is useful first of all to describe the morphological components of the system in a profile normal to the shoreline (Figure 13.1) Not all features will be present on all cliffed coasts: The major compo-nents are:
(a) The tableland or area inland from the cliff top.
(b) The clifftop that marks the change in slope from the tableland to the cliff face and is the transition zone to the area that slopes down to the water.
(c) The subaerial difffacethat extends from the cliff top to the toe of the slope where it

398 CLIFFED AND ROCKY COASTS
intersects the beach or platform. This area is dominated by erosion due to processes result-ing from mass wasting as well as overland flow and gullying. In the case of plunging cliffs the face extends below the water level.
(d) The cliff toe that is the transition area between the subaerial cliff and the beach and shore platform. The upper limit of the cliff toe is marked by height to which wave action (not including spray) can reach and the lower limit by junction with the more gently slopingshore platform. It also marks the transition from the cliff face which is dominated by subaerial erosional processes leading to horizontal recession, and the shore platform and nearshore profile which are dominated by processes resulting in vertical lowering.
(e) The shore platform that extends from the base of the cliff offshore to a point at, or just below spring low tide. The shore plat-form may be overlain 'by varying amounts of surficial sediments. The platform itself is subject to wave action as well as weathering processes during subaerial exposure.
(f) The nearshore slope that forms the subaqu-eous extension of the intertidal platform, and is a zone of shoaling and breald.ng waves extending offshore to the limit of wave ero-sion and transport of sediment.
13.2.2 Cliff coast classification Two major types of cliffed coast can be recognised on the basis of the profile form normal to the shore and sea level (Figure 13.2). Plunging cliffs occur where the cliff extends below the water line to some considerable depth (Figures 13.2a, 13.3a, b). Waves break l:iirectly against the cliff face, and there is no beach, ramp or platform that would lead to wave breald.ng offshore and to the accu-mulation of sediments. Plunging cliffs usually occur in resistant bedrock where the slope and relief are determined by tectonic events (e.g., folding or block faulting) or where erosion by glaciers or rivers, and subsequent drowning due to sea level rise, has produced a steep cliff with deep water at the cliff base. Over time, jointing and vertical wealmesses may be exploited by
wave action to produce chimneys and small pocket beaches, and irregularities in the cliff face may be enhanced by runoff and gully devel-opment. However, erosional processes are gen-erally very slow on these coasts so these features form slowly. Plunging cliffs are not generally found on cohesive coasts because the cliff mate-rial is too weal< to withstand direct wave attacl< for very long and cliff recession soon leads to the formation of a sloping platform and beach.
Where the overall slope of the inherited coastal morphology is less steep the toe of the cliff face will be located in or above the intertidal zone. Erosion of the cliff toe will occur, leading to recession and the generation of a platform as the cliff face recedes. Wealmesses such as joint-ing, bedding planes and beds ofvaryinglithology and strength in the rock malting up the lower part of the cliff will lead to spatially uneven rates of erosion and the development of a variety of erosional forms such as notches, blowholes, caves, arches and stacks (Figures 13.3c, d). The coastline tends to become highly irregular and the inner nearshore is often rocky with a variety of shallow reefs and emergent boulders (Figures 13.3c, d). These features are absent on cohesive coasts where rapid erosion on the beach and shallow nearshore quicldy removes any irregularities.
Horizontal erosion is focused at the toe of the cliff, and recession of the cliff itself will tend to produce a quasi-horizontal erosion surface or platform. However, erosional processes in the intertidal and sub-tidal zones also act on the plat-form leading to vertical lowering of the surface. This in turn generates a profile with an intertidal zone that slopes away from the base of the cliff and grades into the underwater nearshore profile without any abrupt transition (Figure 13.2b ). Type A platforms (Sunamura, 1992) are the most com-mon form of platform on cliffed shorelines, par-ticularly in rocks of moderate to low strength and in areas where sand and gravel are present in the intertidal zone. However, in some areas vertical erosion of the platform in the intertidal and shal-low sub-tidal zone is relatively slow compared to horizontal recession of the cliff toe. This leads to the development of a Type B shore platform that has a nearly horizontal surface away from the
Plunging cliff
base of the cliff, and then terminate abruptly in a seaward drop to the nearshore (Figures 13.2c and 13.3e). The elevation of the platform may be close to the high-tide level, the low-tide level, or some-where in between. Type A platforms reflect con-ditions where vertical lowering of the platform in the intertidal area is similar to that in the inner nearshore and keeps pace with horizontal retreat of the cliff toe. The development of the nearly
13.2 CLIFFED COAST MORPHOLOGY
Profiles associated with the major types
horizontal platform associated with type B must therefore reflect much slower vertical lowering of the intertidal platform compared to the recession of the cliff toe. The quasi-horizontal Type B plat-forms have generated much interest and there is considerable debate about the processes ing on them and the controls on their origin. We will examine this problem at the end of the chap-ter after we look at cliffed coast processes
39
400 I CUFFED AND'ROCKY COASTS
generally, and at processes operating on cohesive and rock coasts.
13.3 I Cliffed coast erosion system
Unlike coasts dominated by sedimentary depos-its, where the beach and nearshore can be
altered continuously but maintain a long-term equilibrium form and location, the dominant focus in cliffed coasts is on erosional processes. Thus, while on a sedimentary coast erosion can be balanced by subsequent accretion, on a cliffed coast erosion results in the breal<down of the constituent material forming the cliff and it is a process that cannot be reversed. Attention is
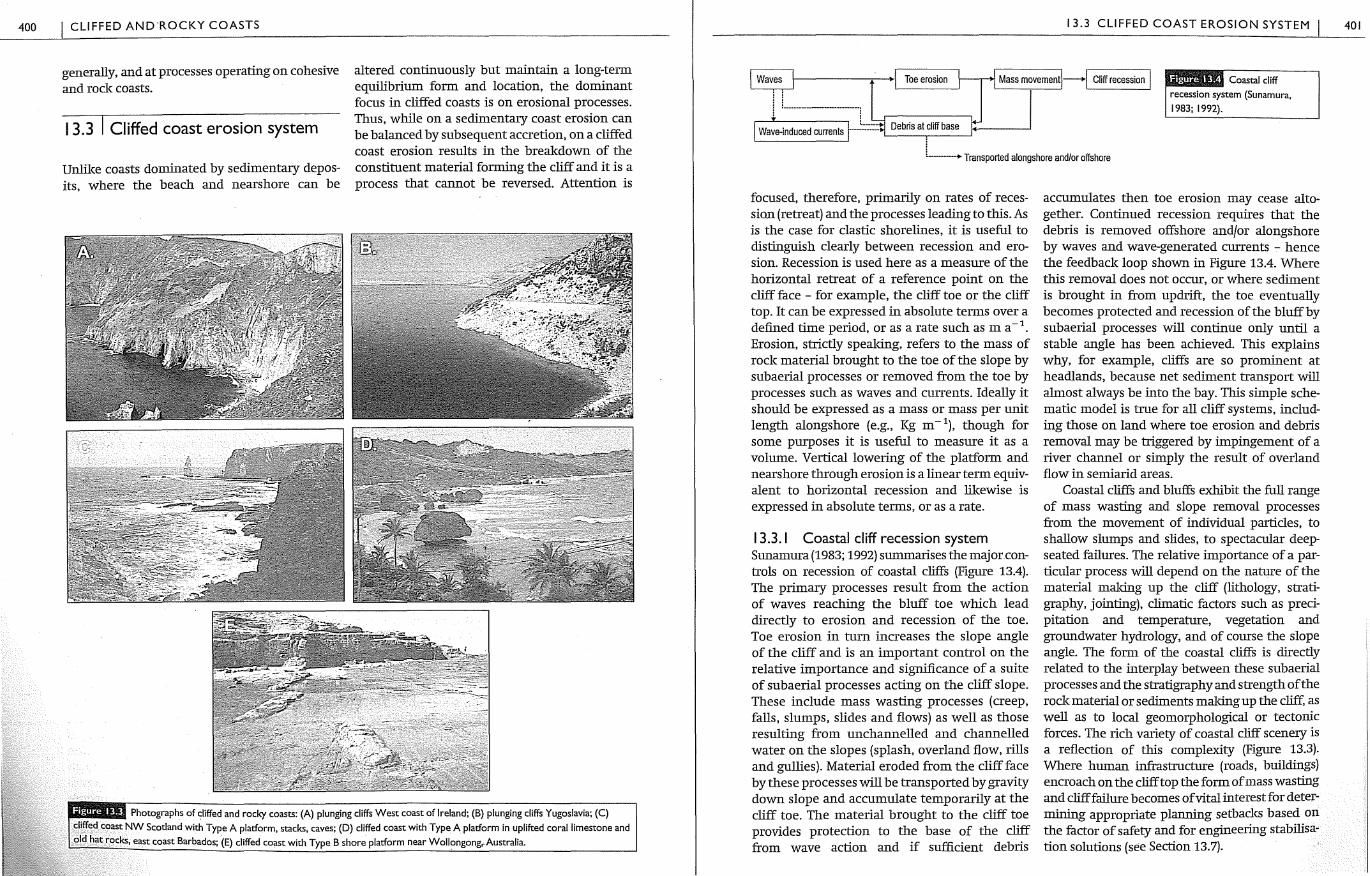
Photographs of cliffed and rocky coasts: (A) plunging cliffs West coast of Ireland; (B) plunging cliffs Yugoslavia; (C) cliffed coast NW Scotland with Type A platform, stacks, caves; (D) cliffed coast with Type A platform in uplifted coral limestone and old hat rocks, east coast Barbados; (E) cliffed coast with Type B shore platform near Wollongong,Australia.
I Waves
! !_ _____________ ! Wave-induced currents t----:-. Debris at cliff base
!
13.3 CUFFED COAST EROSION SYSTEM
Coastal cliff recession system (Sunamura, 1983; 1992).
L___,. Transported alongshore and/or offshore
focused, therefore, primarily on rates of reces-sion (retreat) and the processes leading to this. As is the case for clastic shorelines, it is useful to distinguish dearly between recession and ero-sion. Recession is used here as a measure of the horizontal retreat of a reference point on the cliff face - for example, the cliff toe or the cliff top. It can be expressed in absolute terms over a defined time period, or as a rate such as m a - 1 .
Erosion, strictly spealting, refers to the mass of rock material brought to the toe of the slope by subaerial processes or removed from the toe by processes such as waves and currents. Ideally it should be expressed as a mass or mass per unit length alongshore (e.g., Kg m- 1), though for some purposes it is useful to measure it as a volume. Vertical lowering of the platform and nearshore through erosion is a linear term equiv-alent to horizontal recession and likewise is expressed in absolute terms, or as a rate.
13.3.1 Coastal cliff recession system Sunamura (1983; 1992) summarises the major con-trols on recession of coastal cliffs (Figure 13.4). The primary processes result from the action of waves reaching the bluff toe which lead directly to erosion and recession of the toe. Toe erosion in turn increases the slope angle of the cliff and is an important control on the relative importance and significance of a suite of subaerial processes acting on the cliff slope. These include mass wasting processes (creep, falls, slumps, slides and flows) as well as those resulting from unchannelled and channelled water on the slopes (splash, overland flow, rills and gullies). Material eroded from the cliff face by these processes will be transported by gravity down slope and accumulate temporarily at the cliff toe. The material brought to the cliff toe provides protection to the base of the cliff from wave action and if sufficient debris
accumulates then toe erosion may cease alto-gether. Continued recession requires that the debris is removed offshore and/or alongshore by waves and wave-generated currents - hence the feedback loop shown in Figure 13.4. Where this removal does not occur, or where sediment is brought in from updri.ft, the toe eventually becomes protected and recession of the bluff by subaerial processes will continue only until a stable angle has been achieved. This explains why, for example, cliffs are so prominent at headlands, because net sediment transport will almost always be into the bay. This simple sche-matic model is true for all cliff systems, includ-ing those on land where toe erosion and debris removal may be triggered by impingement of a river channel or simply the result of overland flow in semiarid areas.
Coastal cliffs and bluffs exhibit the full range of mass wasting and slope removal processes from the movement of individual particles, to shallow slumps and slides, to spectacular deep-seated failures. The relative importance of a par-ticular process will depend on the nature of the material malting up the cliff (lithology, strati-graphy, jointing), climatic factors such as preci-pitation and temperature, vegetation and groundwater hydrology, and of course the slope angle. The form of the coastal cliffs is directly related to the interplay between these subaerial processes and the stratigraphy and strength of the rock material or sediments malting up the cliff, as well as to local geomorphological or tectonic forces. The rich variety of coastal cliff scenery is a reflection of this complexity (Figure 13.3). Where human infrastructure (roads, buildings) encroach on the clifftop the form of mass wasting and cliff failure becomes of vital interest for deter-mining appropriate planning setbacks based on the factor of safety and for engineering stabilisa-tion solutions (see Section 13.7).
401

402 CLIFFED AND ROCKY COASTS
However, it can be argued that toe erosion and removal of sediment at the cliff toe are the pri-mary controls on the rate of coastal cliff recession and that, while the subaerial processes of mass movement and water acting on the cliff face are interesting, they are irrelevant in determining the long-term ( decadal to century) recession rate. In effect, the balance between erosion due to sub-aerial processes on the cliff face and erosion at the cliff toe acts primarily to influence the short-term pattern of recession of the clifftop and the slope angle of the cliff. If the rate of toe erosion is faster than the slope processes, undercutting will occur, leading to an increase in the slope angle and, therefore, to an increase in the rate of operation of the slope processes. Ultimately, this may result in the creation of a notch or overhang and the complete undercutting of the slope support, lead-ing to massive slope failure. lf the rate of erosion on the cliff face is faster than the rate of toe erosion, then the slope angle will decrease, lead-ing to a reduction in the rate at which the sub-aerial cliff processes operate and bringing them into balance with the rate of toe erosion. Thus, while coastal cliffs provide fruitful sites for the study of slope processes,' such processes can largely be ignored in developing a deterministic process-response model for predicting long-term rates of coastal cliff retreat.
13.3.2 Wave-induced cliff erosion model The· schematic cliff system model shown in Figure 13.4 can be expanded to incorporate a more detailed examination of the interrelation-ship among the processes and factors controlling erosion of the cliff toe (Sunamura 1983, 1992 -see Figure 13.5). The approach here is a mecha-nical, deterministic one with toe erosion being controlled by the relative magnitude of two groups of factors: {1) those determining the ero-sional forces produced by waves reaching the toe of the cliff - the assailing force; and (2) those controlling the strength of the material forming the lower cliff- the resisting force. Conceptually this is nice and relatively simple; and it does point to the need to quantifY the processes of erosion in terms of forces. Note that in this model there is no consideration of subaerial processes on the cliff
face and that there is the explicit assumption that material is removed alongshore and therefore does not provide any substantial protective role.
The schematic model outlined by Sunamura (Figure 13.5) is divided into two components: the wave system and the cliff system. Offshore wave energy (determined by the wave climate) is trans-formed through shoaling, refraction and breal<:-ing over the nearshore profile towards the beach/ platform (if present) and cliff toe. The characte-ristics of the waves at the cliff toe then depend on the nearshore and intertidal morphology, mean sea level and short-term fluctuations due to tides and storm surge, and the effects of these operating together on wave shoaling and breal<:-ing transformation.
Wave action at the toe produces both hydraulic and mechanical forces, which mal<:e up the assailing force of waves Fw. Hydraulic forces include those resulting from compression due to the collision of the wave with the face of the cliff, tension as the water recedes from the cliff, and shearing from moving upward or downward over the cliff face. The compressive force is greatest when the wave breal<:S directly against the cliff face with the plunging jet pro-ducing a nearly horizontal force into the cliff. This direct impact is termed water hammer and the shock oflarge waves brealdng against a rock cliff can produce low-frequency oscillations throughout the cliff (Adams et al., 2005). Much of the time a small layer of air is trapped between the brealdng wave and the cliff face and the rapid compression of this develops high pres-sures within joints and cracks in the rock Repeated impacts from waves and the forcing of water or air into spaces in the rocks results in the expansion of cracl<:S, dislodgement of rock material and can produce blowholes that spurt a mixture of air and water high up onto the cliff. The recession of water in the wave trough and the downward drainage of water generate ten-sion on the face. As material is loosened by repeated wave impacts it may be pulled or pushed off the face in a series of processes termed plucldng or quarrying. Most of the dis-lodged rock material ends up at the base of the cliff, but some can b«: transported right onto the
Waves
Offshore wave energy
Shallow-water bottom and beach topography!---+!
Cliff Material
cliff top by the vertical component of wave brealdng to produce cliff-top storm deposits (Hallet al., 2006).
Where the mean water level is quite high up the cliff face hydrostatic pressures are exerted on the cliff and there are fluctuations in these as a result of wave action, and especially the develop-ment of standing waves (clapotis). The hydro-static pressures are greatest near the foot of the cliff while pressures generated by wave brealdng tend to be focused at, or just above the mean water level. Wave impact forces against vertical or sloping structures as well as hydrostatic forces can be measured in laboratory studies and mod-elled semi-theoretically. However, it is much more difficult to apply this to real cliffs where wave brealdng is often chaotic, the cliff face is irregular and the angle of wave approach often varies significantly from cliff perpendicular. Shearing forces are produced by two different mechanisms. Waves may breal<: on the beach or platform and swash run-up reaching the toe of the cliff can run up for some distance, producing a shearing force right at the toe. Alternatively, where the mean water level is above the cliff toe a portion of the wave breaking on the cliff is usually directed upwards, producing shearing and tensional forces up the cliff face.
13.3 CLIFFED COAST EROSION SYSTEM
Assailing force of waves Fw
In addition to the hydraulic forces generated by the waves, mechanical forces are generated by entrained sand, gravel and rock particles. The impact of rocks and boulders hurled or rolled against the cliff face can be impressive at a point. However, abrasion by sand and gravel is probably more significant because it operates over a greater area and for a greater proportion of time. Abrasion and rock impact are most important at mean water levels ranging from just below the toe, when swash bores frequently reach the toe, to just above the toe where turbu-lence from wave brealdng and orbital velocities at the bed can entrain material. As the water depth at the toe gets large there is less mobili-sation of sediment and hydraulic forces become dominant. Thus, wave-induced forces will vary with the form of the platform and nearshore, as well as with the depth of water at the cliff toe and the availability of clastic material for impact and abrasion. They will also vary tempo-rally as incident wave conditions and water lev-els change.
The significance of each of the hydraulic and mechanical forces associated with wave action can be related to four scenarios that reflect increasing water depth at the cliff toe (Figure 13.6):
403
404 CLIFFED AND ROCKY COASTS
A.
B.
c.
D.
Effects of changes in mean water level relative to the elevation of the cliff toe on the relative significance of hydraulic and abrasional forces leading to toe erosion: (A) mean water level far below cliff/platform junction -waves do not reach cliff toe; (B) mean water level below cliff/platform junction - swash run-up reaches the cliff toe; (C) mean water level just above cliff/platform junction -broken waves reach cliff toe; (D) mean water level considerably above cliff/platform junction - waves break against the cliff face.
(1) In the first scenario the mean water level is well below the bluff toe. Waves shoal and brealc across the nearshore and beach or plat-fonn dissipating their energy in these zones and no waves reach. the cliff toe. Erosion by
waves is focused on the platform and near-shore, and subaerial processes continue on the cliff.
(2) Where water level is below the cliff toe, but wave run-up can reach the toe as swash
bores, the dominant erosional processes result from turbulence in the bore, shearing as the wave runs up on the toe, and abrasion from sediments entrained by the swash bore.
(3) Where the water level is above the toe of the cliff, but water depth is relatively shallow, wave compressional forces are produced from wave impacts. Most waves will begin breaking seaward of the cliff face, so impact
- forces are moderate. Hydrostatic forces are also significant, but still relatively small because of the shallow water depths. Abrasion remains significant where there is sand and gravel present on the platform.
(4) When the water at the cliff toe is quite deep, wave breaking frequently takes place right at the cliff face producing maximum water hammer and compressive forces. Hydrostatic forces also become more significant because of the greater water depth, while abrasion is greatly reduced because of the reduction in turbulence and oscillatory motion near the base.
The strength of the cliff system is designated the resisting force FR (Figure 13.5). This is deter-mined by intrinsic properties such as lithology, which determine the hardness of the rock mate-rial, and by the structure of the rock, including bed thickness and dip angle, joints and fractures and the relative strength and position of inter-bedded units - see Box 13.1. Qualitatively it is easily understood that relatively hard rocks such as granite, basalt and limestone are much more resistant to wave erosion than soft shale or cohe-sive till. Similarly, massive sandstone and challc are lilcely to be much more resistant than thinly bedded sandstones because there are few wealc-nesses that can be exploited by water hammer, and compression of air by waves brealcing against the cliff face. However, where resistant rock units are interbedded with weaker units such as shale, failure usually results from exploi-tation of the wealcer beds, so the stratigraphic position of beds relative to mean sea level is important (Figure 13.7).
In the short term, seconds to days, if FR > Fw then no erosion will occur. However, over a lon-ger period it is likely that the value of FR at points
13.3 CLIFFED COAST EROSION SYSTEM I
on the cliff toe will decrease as a result of weath-ering thus producing the feedback loop in Figure 13.5. In this model, the term weathering is used here to include chemical weathering which may reduce cementation of sandstones of the breakdown of rock crystals through hydrolysis, oxidation, etc., mechanical weather-ing due to wetting and drying, freezing and thaw-ing, growth of salts and the effects of a variety of biological agents, including plants and boring organisms. In the broader sense it also includes various forms of mechanical weakening due to loading and unloading or fatigue failure. This may result from repetitive flexing due to impact pressure fluctuations, the effects of air compres-sion in joints, and hydrostatic pressure fluctua-tions produced by fluctuating water depths.
Erosion of the cliff occurs if Fw > FR. This should not be envisioned as a threshold that applies to the cliff as a whole but rather it may be better to thinlc of it as applying to a point on the cliff toe. There will be an infinite number of points on the cliff toe each with its own FR value which together produce a characteristic probabil-ity distribution. In turn, because we are dealing with random seas, complex nearshore topogra-phy and varying brealcer characteristics, there will be a range of instantaneous Fw values also characterised by a probability distribution. Over time Fw may vary systematically with tidal stage and less predictably with changing incident wave conditions. At an instant in time, wherever Fw > FR, erosion will occur. If the mean value of Fw is small and the mean value ofFR is large, there may be long periods of time where there is no overlap between the two probability distributions or only a small area (Figure 13.8).
The increase in the probability of erosion is likely to be a function of increasing Fw. e.g., because of increasing storm intensity andfor tidal height. Thus the upper end of the Fw distri-bution represents conditions that exist for some time in an intense storm, perhaps coinciding with spring high tides, but then do not recur for several months or years. The lower end of the FR distribu-tion reflects the effects of weathering and fatigue failure on rock strength and it may be truncated after a severe storm when much of the weathered material is removed. The strength of hard rock
405
406 CUFFED AND ROCKY COASTS
Box 13.1 Measurement of rock strength
Intuitively from Figure 13.5 it is evident that the rate of erosion of the cliff toe (and by extension, of the beach and nearshore platform) should be controlled by the resistance of the material making up the lower cliff - i.e., some measure of its strength in relation to an applied force or stress. More importantly, if we are to be able to develop some kind of numerical model for predicting toe erosion and cliff recession it is important to be able to quantiJY this strength. Since we have a variety of techniques for measuring the strength of rock and cohesive materials and quite an extensive set of theory and empirical data related to soil and rock mechanics, it would seem relatively simple to produce good estimates of the strength of materials making up a cliff. However, the task is complicated by two sets of factors: (I) strength of material must be measured as a response to an applied force; however erosion processes at on the cliff coast profile, and particularly at the cliff toe produce several types of applied force (e.g., compressive forces, tensional forces, shear forces, and forces due to impact and abrasion). Thus, ideally we should measure the strength in response to all of these. The task is further complicated by the effects of structural weaknesses from bedding planes and jointing, which are difficult to quantifY but which may be extremely important where wave breaking produces cavitation and com-pression of entrapped air; (2) the intrinsic strength of the material may change over time as a result of a variety of weathering processes, which means that any model must account for these effects.
The mechanical strength of materials can be evaluated using a variety of tests used in soil and rock mechanics and described in standard engineering soil mechanics and rock. mechanics texts and in d9cuments from the American Society forT esting and Materials (ASTM) and ASTM International. For cohesive materials compressive strength may be measured using an unconfined compression test Shear strength and compressive strength may be measured in a triaxial compression test with the results plotted as a family of Mohr circles. Shear strength may also be measured using a shear box or directly in the field using a shear vane. The unconfined compressive strength of rocks can also be estimated using a Schmidt Hammer (Aydin and Basu, 2005). When examining erosion of the platform and nearshore profile, resistance to abrasion may be more important Ultimately many of the strength properties may be correlated with compressive strength (Sunamura, 1992; Budetta et a/., 2000) and thus much of the work to date has attempted to relate erosion rates to some measure of this.
coasts made up of massive igneous or metamor-phic rocks is much greater than wave impact forces, even from very large waves and there is almost no overlap between the two probability distributions - erosion here proceeds very slowly. Such rocks are usually also very resistant to weathering and so cliff retreat over many centu-ries may be a couple of metres or less. In softer rocks, especially those where thin bedding or jointing provides weal< points to be exploited by wave ·pressure forces, the overlap of the two
distributions will be greater and recession may be measured in em or even metres per year.
There are numerous published cliff recession rates from individual sites and studies and some attempts to compile these systematically for regions or the world (Sunamura, 1983; Hampton and Griggs, 2004). However, direct measurement through surveying is often difficult, especially where it is desirable to collect the data over some alongshore length rather than at a few pro-files. A relatively simple measurement of bluff
13.3 CUFFED COAST EROSION SYSTEM
--- Erosion of shale at the cliff toe leading to undercutting and failure of blocks of relatively resistant sandy dolomite, Cape Dundas, Georgian Bay, Ontario. The shale is one of the lower units in the Niagara Escarpment. Note the rectangular jointing pattern in the overlying rocks which controls the size of the failure blocks.
crest recession over a small area can be carried out by setting up stal<es on the bluff top and measuring the distance to the edge on a monthly, seasonal or annual basis (Bernatchez and Dubois, 2008). However, over the short term this is driven primarily by subaerial weathering and mass wast-ing processes and there is a disconnect from the processes controlling toe erosion. The compila-tion of a data set involves carrying out measure-ments over a number of years and there are few programs anywhere in the world that do this systematically over periods of decades. Most measurements of long-term recession rates have made use of rectified aerial photographs and measured change over the interval between pho-tographs (Budder and Winters, 1983). Recent advances in digital photogrammetry and the use of DGPS to collect ground control points have made the task easier (Lantuit and Pollard, 2008) and lil<ely improved accuracy. Recession of top of bluff is generally the easiest to measure on aerial photographs, but it is subject to much greater temporal variability than is the toe of bluff. However, the bluff toe, which provides a better estimate of bluff recession rates related to wave
energy, may be difficult to discern because of overhanging vegetation, slumps and shadow. This is especially true for high bluffs. Errors asso-ciated with mapping the bluff toe from aerial photographs are also greater because it is gener-ally difficult to mal<e use of ground control points below the bluff top. The advent of airborne and now land based LiDAR has made it more easy to collect areal data (Gulaeyev and Buckeridge, 2004; Young and Ashford, 2006).
In order to operationalise and test the predic-tive capability of the schematic model illustrated in Figure 13.5, we would need to have data for Fw. FR, and recession rates from a variety of sites. Clearly, the difficulties noted above in measur-ing all three of these parameters mal<e this task a daunting one and there is as yet no practical model available to test. Nevertheless, empirical studies do provide insights into the operation of some of the parameters discussed above. Thus, they allow us to get a sense of how the parame-ters control the type of equilibrium form, and the long-term recession rate that might be pre-dicted to develop at a particular location. Before we examine this, it is useful to consider the time

408 CLIFFED AND ROCKY COASTS
Force----+
Schematic depiction of hypothetical average probability distribution functions for Fw and FR. Erosion occurs only for between the two distributions and the greater the extent of overlap the more frequent is erosion.
scale over which modern coastal cliffs have evolved in relation to cliff recession rates.
Because of the eustatic sea level rise in the Holocene, most coastal cliffs and the nearshore profiles in front of them have been evolving with respect to a (relatively) stable sea level for only 3000-5000 years. As a first step, coastal cliffs can be divided into three groups on the basis of the cliff recession rate: (1) weak cliffs with recession rateR> 0.05 m a- 1; (2) moderately resistant cliffs with R=0.005 < R > 0.05m a-\ and (3) strong cliffs with R < 0.005 m a- 1
. Recession of weal< cliffs will be more than 300m over the time period available, and thus the form of the cliff, shore platform and nearshore is likely to reflect modern sea level and wave conditions. Recession of moderately resistant cliffs will be on the order of 30-40 m in the time available and thus they may be evolving toward some form of equili-brium with modern conditions but have not yet achieved this. Finally, strong cliffs will show little measurable recession since sea levels stabilised, and thus the form is an inherited one. All that can be said about these coasts is that FR >>Fw.
As was noted earlier, while it is evident from Figures 13.4 and 13.5 that the immediate control on cliff recession is erosion at the toe, consider-ation of the long-term evolution of cliffed pro-files where there is a platform present suggests that the ultimate control on the cliff recession is'· the rate of lowering of the platform and
nearshore profile. This is shown in the process-response model for cohesive shores (Davidson-Amort, 1990) which is modified from the original system of Sunamura (Figure 13.9). This model introduces the effects of wave action and water level fluctuation on vertical erosion of the nearshore profile, in addition to consideration of wave-induced forces at the bluff toe. Of particu-lar importance are the feedback relationships shown by dashed lines. If the rate of horizontal retreat of the bluff toe exceeds the vertical low-ering of the nearshore, this leads to an extension of the platform profile and a reduction in the amount of wave energy reaching the bluff toe. This may be aided by the protective effect of sediment supplied from the upper bluff. Conversely, ifbluff recession lags behind vertical lowering of the profile, then the nearshore pro-file deepens, permitting more wave energy to reach the bluff toe rather than being dissipated by bottom friction and wave brealdng. It should be noted also that water level changes act in the opposite direction in the nearshore system com-pared to that at the bluff toe. Thus, a rise in water level tends to increase wave forces at the bluff toe and the platform immediately adjacent to the bluff. Conversely, a fall in water level tends to increase the wave forces on the lower plat-form and on the nearshore profile. In the Great Lal<es, to which the model was initially applied, water level fluctuations are driven by seasonal
I 3.4 COHESIVE BLUFF COASTS I
Water Level high .. t low ...
Wave Induced .I Nearshore Forces Wave Abrasion 'I Energy Hydraulic rw
Cyclic loading? Nearshor7 Profile I -l- Eroston ... ------------. :
Offshore Wave Nearshore Profile i Resisting Forces L.r ____ j Energy !--
Slope .._..] Mechanical strength
I Felch Shape Weathering Wind climate + ........ Shoreline orientation
Bluff Erosion L__ __ Lr ' l .I Wave r Wave Induced Forces 'I Energy at Abrasion Bluff Toe Shock/caVItation
Hydraultc '
Water Level high .... t low .... ,!.
Cohesive shoreline process response model. Note the explicit inclusion of erosion of the nearshore profile as well effects of water level fluctuations on nearshore erosion and toe erosion (Davidson-Arnett, 1990).
and multi-year variations in precipitation in the basins, as well as short-term fluctuations due to storm surge and seiching. On oceanic coasts daily and fortnightly tidal fluctuations act in a similar fashion in addition to the meteorological and wave-induced changes.
The focus of this section has been largely on establishing a conceptual basis for measurement and modelling of coastal cliff erosion and retreat. We can now turn to examining the results of field and laboratory studies of cliffed coast mor-phodynamics. The next section details the results of studies conducted on weal< or soft coasts - coasts where the recession rate is typi-cally tens of centimetres per year. The reasons for choosing to examine this before resistant rock coasts is that the high rate of recession mal<es it much easier to measure recession rates over short time periods, and because the cliff coast profile is much more likely to be in equilibrium with contemporary water levels and coastal processes. Following this we can see how an understanding of processes on these rapidly eroding soft coasts can be applied to studies of resistant rock coasts and the debate over shore platforms.
13.4 I Cohesive bluff coasts
13.4.1 Cohesive coast characteristics The term cohesive shoreline is used to describe cliffed coastlines in which the profile is developed in relatively non-resistant sediments with a high silt and clay content (Hutchinson, 1973, 1986; Prior, 1977; Quigley et al., 1977; McGreal, 1979; Edil and Vallejo, 1980; Bryan and Price, 1980; Carter and Guy, 1988; Hequette and Barnes, 1990; Amin and Davidson-Arnott, 1995, 1997; Brew, 2004). These shorelines are characterised by steep, subaerial bluffs, narrow beaches of mixed sand and gravel, and a moderate to steep, concave intertidal and nearshore profile. Rates of bluff recession typically range from 0.3-2 m a-1, and in places may exceed this. The high rates of recession can lead to very high economic costs through erosion of agricultural land, destruction of roads and buildings, and through efforts to stabilise the shoreline. These shorelines are found extensively in mid- and high latitudes where they are formed in glacial till, glaciofluvial and glaciolacustrine sand, silt and clay, and Holocene mud. In Western .Europe they are
409

410 CUFFED AND ROCKY COASTS
common on many stretches of the east and south coast of England (e.g., the Holderness coast of Yorkshire), parts of Ireland,' and on the Baltic coasts of Denmark and Germany. They are also found on all three marine coasts of Canada (the Pacific, the Arctic and the Atlantic) and on the NE coast of the USA They mal<:e up about 40% of the shoreline of the lower Great Lakes in Ontario (Canada) and the United States and because of the. impact of coastal cliff recession on housing and infrastructure along these shorelines, they have been studied extensively here. Together with coasts characterised by cliffs developed in wealdy cemented sediments, they mal<:e up the group of soft cliff coasts. The focus here is primar-ily on cohesive coasts, though much of it also applies to the other soft rod<: coasts.
The high rates of recession mean that along most of these coasts the modern nearshore profile has evolved over a period of a few thousand years and thus under a relatively stable water level and wave climate. Under these circumstances the rate ofhorizontal recession of the bluff is in dynamic equilibrium with the rate of vertical lowering of the nearshore profile (Davidson-Amort and Askin; 1980; Davidson-Amort, l986a; Davidson-
horizontal
.I
Arnott and Ollerhead, 1995- see Figure 13.10). A simple check on the rate oflowering of the near-shore platform can be done by determining the depth of water for a location where the historical position of the cliff is known or by extrapolating the position from measured cliff retreat rates. Thus on a coast where recession rates average 1ma-1 the blufftoe from 1000 years ago will be located 1 km offshore. Together with the sche-matic model shown in Figure 13.9 this forms the conceptual basis for understanding the controls on soft coast erosion and the evolution of the coastal profile.
13.4.2 Bluff toe erosion Recession of the bluff is initiated by wave action at the base (Figure 13.4; 13.11a, b). In low- energy environments, recession is slow and large amounts of sediment are supplied to the base by mass wasting and sur:fuce runoff. In these envi-ronments waves act primarily to remove the material offshore and alongshore, and subaerial erosion processes dominate (Wilcod<: et al., 1998; Greenwood and Orford, 2008). These processes will also be significant where there is a wide plat-form and wave action oil the bluff toe occurs only
----------------------------------------------____ __
Photographs of toe erosion: (A) wave impact during a small storm with water level at the toe of the bluff (St Catharines); (B) waves breaking at the bluff toe, south shore Lake Erie (Amin and Davidson-Arnott, 1995). Note the rods sticking out of the face of the bluff. In this study they were later replaced with smaller pins; (C) notch formed in till from toe erosion (photographs (B) and (C) Amin).
during intense storm events. Fine materials tend to be dispersed offshore into deep water, while sand and gravel remain on the beach and inner nearshore, and are transported alongshore to a
sinlc. The slumped material may protect the toe of the bluff for a short while, but on these coasts it has little strength and is generally removed very quiddy. On exposed coasts such as those on the Great Lal<:es and the Holderness coast of Yorkshire, recession rates are generally >0.3m a- 1 and direct wave attack at the toe occurs frequently - often several times a month. On the Great Lal<:es, this is dependent somewhat on lal<:e level cycles that occur on a time scale of several years to one or two decades. During periods of rising and high lal<:e level, beaches are very narrow and waves of even minor storms can reach the toe (Quigley et a1., 1977; Carter and Guy, 1988; Amin and Davidson-Amort, 1995). During periods of falling lal<:e level the cliff toe may be protected for several years by a wider beach and platform, but continued downcutting of the plat-form leads to renewed wave attack within a few years.
Erosion rate measurement Wave erosion tal<:es place by both hydraulic forces (impact, compression and cavitation, shearing) and by abrasion, as detailed in Section 13.3. On cohesive coasts developed largely in glacial till, sand and gravel are generally present in appreci-able amounts and thus abrasion is likely to be the most significant process. Toe erosion associated with individual storms or periods of a few weeks, has been measured in several studies (McGreal, 1978; Carter and Guy, 1988; Amin and Davidson-Amort, 1995; Greenwood and Orford, 2008). Carter and Guy measured the distance to the cliff face at a single height from a rope stretched alongshore and fixed to pipes hammered into the beach foreshore at five sites at the west end of Lake Erie 4 sites in till or clay and 1 in weal<: shale. The other three studies were all in glacial till and used pins hammered into the bluff face at various heights above the beach (Figure 13.11b). The frequency of wave attack varied with site exposure (fetch length) and the number of ero-sional events depended on the magnitude of storms and storm surge. In the Great Lal<es, the number of events was also closely related to long-term lake level fluctuations. Carter and Guy (1988) found that the number of events decreased from 1976 to 1980 as lal<e level decreased.

412 CLIFFED AND ROCKY COASTS
Variations in horizontal erosion during a single storm with height above the bluff/toe junction for a site {site 3) on the south shore of Lake Erie {based on data from Amin, 1991 ). The periods are chosen to illustrate the effects of increasing storm intensity {significant wave height and maximum water level) on the amount of erosion and height above the beach up to which erosion occurs: {A) low magnitude storm July 24-August 5, 1986; {B) moderate magnitude storm August 17-28; and {C) intense storm November 2-16. Data are for three lines of erosion pins spaced 2m apart and show that there is considerable variation for each individual storm and for closely spaced points on the bluff face.
A.
E .s. f-c: 6 0 'iii e4 w
2
0 '-- ' 0.25
D Line 1 D Line 2 [lljf Line 3
·• ' ' ' 0.5 0.75 1.25 1.5 1.75 Elevation (m)
B.
c.
D Line 1 D Line 21i!!l Line 3
--
2
0 --,. L--: ---, 0.25 0.5 0.75
Elevation (m)
Jl ' 1.25 1.5 1.75
D Line 1 D Line 2 Line 3
2
0.25 0.5 ' 0.75 Elevation (m)
' 1.25 1.5 1.75
Amin and Davidson-Arnott measured toe ero-sion at four sites near Erie, Pennsylvania during 1986, at the peale of a high water phase when waves reached the bluff toe frequently. Erosion of the toe during individual storms produced recession ranging from <1 em to as much as 10cm (Figures 13.12a, b, c), but differences between measurement lines and between differ-ent elevations above the bed were much smaller
when averaged over six months (Figure 13.13). Wave erosion reached as high as 4 m up the cliff face during intense storms (Amin and Davidson-Amort, 1995), however measured recession was not much greater for intense storms than for moderate ones. This can be attributed to two factors: (1) the impact oflarger waves is spread over a greater height and thus the actual inten-sity of attack is dissipated over a much larger
13.4 COHESIVE BLUFF COASTS
60 Variations in 0 Line 1 D Line 2 Iii Line 3 horizontal erosion of the bluff toe 50 -.- r-- .---E E.. 40 .---.--c: ,_.--0
'(j) 30 -0 ,_
UJ 20
10 ' 0 - -'-'-r '-'- '-'-
0.25 0.5 0.75 1 1.25 Elevation (m)
area. When water level is quite high and waves brealc directly against the bluff face, there is a partitioning of the erosional forces such that the upper section is subject primarily to wave impact forces while the lower section is affected most by abrasion; (2) the unweathered till has a compressive strength of about 16 MPa and is thus relatively resistant to compressive forces. During the interval between storms, a shallow layer a few em thick weathers through wetting and dry-ing or freezing and thawing and this is mani-fested in an increase in the moisture content from about 8% to more than 12%. The reduced strength of this layer means that it can be removed readily by even moderate wave action (Figure 13.11b). As this weathered layer is strip-ped away, the underlying unweathered till is exposed and the erosion rate is slowed consider-ably. Thus weathering during inter-storm peri-ods may be as significant a control on the recession associated with an individual storm event as the absolute wave energy.
While the total erosion can be measured, con-ditions at the bluff toe during major storms malce it difficult to determine the actual process of erosion, and the relative efficacy of impact versus abrasion. The surface of the bluff toe after a storm event tends to be relatively smooth, which could be indicative of either process. The massive nature of the clay till on the south shore of Lalce Erie means that there are relatively few planes of wealmess or fractures that can be exploited by cavitation or air compression and erosion produces a smooth notch or overhang (Figure 13.11c).
over the period July IS-December 9, 1986 at site 3 {based on data from Am in, 1991 ). Note that maximum erosion here occurs
,--- dose to the toe and that the .--differences between the three lines are not significant when averaged over the whole period compared to individual storm events shown
1.5 1.75 in Figure 13.12.
Prediction of erosion ' These studies, as well as others such as McGreal (1978), Wilcoclc et al. (1998) and Manson (2002), suggest that the general framework of the con-trols on bluff toe erosion outlined in Figure 13.9 is reasonable. While we cannot test a physical model of the processes because of the dearth of such measurements at the toe during a storm, several studies have used correlation and regres-sion to explore the contribution of factors thought to control the wave energy reaching the bluff toe with measured erosion rates (McGreal, 1978; Carter and Guy, 1988; Amin and Davidson-Amort, 1997; Greenwood and Orford, 2008). We can expect the erosion during a single storm or over a few months would be some function of significant wave height and total wave energy over the period, and of the strength of the mate-rial at the toe. Wave energy can be derived from a direct measure of offshore waves, for example from a buoy, or it can be an indirect one based on hindcasting from winds and fetch lengths. However, energy actually reaching the toe of the bluff also depends on water levels and the width and height of the beach in front of the bluff, so some or all of these may be incorporated in the correlation analysis. In the Great Lalces during high water phases even small storms may cause significant erosion because of the associated nar-row beach while during periods of falling lalce level only extreme storms lead to significant ereh sian (Gelinas and Quigley, 1973; Carter and Guy, 1988; Amin and Davidson-Arnott, 1995).
The results of these studies all show a signifi-cant correlation between some measure of wave
413
414 I CUFFED AND ROCKY COASTS
energy at the bluff toe and the rate of toe erosion. However, the most significant parameter in an individual study might be some measure of wave height, storm surge or wind speed. The effect of the height and width of the beach in front of the bluff also varied. Amin and Davidson-Arnott found that it was not significant, but this was likely because beach width was always small during the high-water phase over which their measurements were made. Carter et ai. (1986) and Lee (2008) found it to be significant. On marine coasts erosion may be greater during spring tides, and on the California coast Sallenger et ai. (2002) showed a much higher rate of erosion associated with an El Ni:iio period when water levels were elevated beyond sea-sonal norms. Sallenger et ai. (2002) also docu-mented a negative correlation between erosion rates and beach width and found that beach width was more effective in sheltering the bluff toe than the beach elevation. Similar results were reported from Wales Uones and Williams, 1991). A study by Greenwood and Orford (2008) in Strangford Lough, Northern Ireland found a much weaker relationship between wave energy and recession rates, likely because of the small fetch lengths in the loch and generally lower wave energy both of which enhance the role of weathering and debris removal as compared to active wave erosion. Thus, the relative contribu-tion of these factors to predicting toe erosion is quite variable from site to site and through time. In addition, each is likely associated with a par-ticular threshold below which no erosion takes place.
However, it is notable that long-term meas-urements (5-10 decades) generally show quite uniform rates (e.g., Jibson et ai., 1994) and this may in part reflect the controlling influence of nearshore downcuttingwhich is subject to much smaller variability on an annual basis.
In summary, field observations and measure-ments indicate that on exposed sites waves are able to erode the toe of the bluffs by both hydraulic and mechanical forces. Wave energy at the toe is moderated by the slope of the near-shore profile and by water levels, which in turn vary with the extent of storm surge, tides and seasonal and long-term water level variations.
Actual erosion during a storm can exceed 10 em in places, but is moderated by the removal of weathered sediments and exposure of more resistant unweathered till or clay. Toe erosion leads to steepening of the bluff face and can produce notches and overhanging sections that cause failure along planes parallel to the slope. Rapid weathering of till is important for reduc-ing the strength of the bluff toe materials. This likely introduces some hysteresis in the rate of measured erosion relative to incident wave energy, so that the erosion should increase as the time interval between storms increases. It also means that differences in the strength of the unweathered till play a smaller role than might be expected from our model.
13.4.3 Subaerial bluff processes Wave erosion at the toe of the bluff on most cohesive shorelines occurs frequently, leading to very steep cliff profiles. As a result of this, mass movement and water erosion also occurs fre-quently. All forms of mass wa.Sting failures occur on cohesive bluffs (Hutchinson, 1973, 1986; Wilcod< eta!., 1998; Hampton et ai., 2004, Collins and Sitar, 2008). On low bluffs and bluffs with simple stratigraphy most of the retreat results from shallow slides, slumps and mudflows, espe-cially where there is ongoing wave erosion at the toe. Grain-by-grain removal also occurs as a result of overland flow and rill development on slopes that are largely bare ofvegetation (Figure 13.14a). On high bluffs (>6 m) the path length is long . enough for rills and gullies to develop, and head-ward erosion of gullies may complicate crest line retreat and the delivery of sediment to the bluff toe. High bluffs such as the 60 m high Scarborough Bluffs on the north shore of Lal<e Ontario are more lil<ely to have complex stratig-raphy with interbedded units of sand an,d clays. Failure here is often associated with seepage along the junctions of sand units with underlying units oflower permeability and complex failures may occur (Figure 13.14b). Occasionally deep-seated failure occurs, producing large rotational slides (Quigley et ai., 1977), but on most cohesive coasts bluff recession by shallow slides and run-ning water is usually so rapid that deep-seated failures are rare. ·
13.4.4 Vertical erosion and platform evolution
As noted earlier, recession of soft cliffs, and par-ticularly bluffs on cohesive shorelines occurs rap-idly and this is accompanied by vertical lowering of the profile seaward of the base of the bluff. As a result, we can postulate the development of an equilibrium profile, with the horizontal retreat of the bluff tracking the vertical lowering of the profile (Figure 13.11). If this assumption holds, it is possible to predict the rate of vertical lowering of the nearshore from the local slope and the recession rate of the bluff toe using (Zenkovitch, 1967; Philpott, 1986; Sunamura, 1992)
13.4 COHESIVE BLUFF COASTS
dy dx -=-tana dt dt
Subaerial processes on cohesive bluffs: (A) shallow slumps and slides as well as water erosion on the bluff face, Holderness, England; (B) shallow slide and mudflow triggered by piping, Scarborough Bluffs, Lake Ontario.
(13.1)
where: dyfdt is the rate of vertical lowering at a pointy on the profile, dxfdt is the rate ofhorizon-tal recession of the cliff toe and tan a is the nearshore profile slope at a point.
Ideally bluff recession and lowering of the nearshore profile exist in dynamic equilibrium and the rate of lowering anywhere on the near-shore profile can be predicted simply from shift-ing the profile or from the local slope (Figure 13.10). Evaluation of bluff recession and nearshore profile change along the north shore
415
416 CLIFFED AND ROCKY COASTS
A. 0.0
0 MWL=74.85m
-1 -2 -3
:[-4 a-s "' -6 0
-7 -8 -9
I 0
I 50
I 100
I 150
I 200
I 250
I 300
I 350
Distance off shore (m)
B. 70
c 60 E 50 §. c 0 40 u; e (J) 30 m 0 'E 20
10 ------. ' 5 ' 4 ' 3 ' 2 7 8 6
Depth (m)
c. >20-r-------------------,
D SL Catharines <> Bayfield A Grimsby
15 A
E • § 10
A w
5 • <> II
<> A ll A • <>to <> m<> <fll Q' II
<> • AI {j • A A
II • A 1!. . 0 ' ' 0 2 3 4 6 7 Depth(m)
Variation of erosion rates with water depth over the nearshore on a cohesive coast (A) beach and nearshore profile on a cohesive coast, Grimsby,lake Ontario (from Davidson-Arnett, 1986a); (B) weighted average annual measurements at Grimsby based on MEM data from two profiles 1980-84 (from Davidson-Arnett, 1986a); (C) annual erosion for individual stations at Grimsby, St Catharines (lake Ontario) and Bayfield (lake Huron). Grimsby data are from Davidson-Arnett ( 1986a) and data from the other two sites from Davidson-Arnett et a/., ( 1999).
ofLake Erie over an 80 year period (Philpott, 1986) showed average downcutting rates ranging from about 0.5 em a- 1 in a water depth of 6 m to about 5-6 em a- 1 in a water depth of 1m. Similar mag-nitudes were determined for profile erosion at a site on SW' Iiike Ontario based on recession over a 35 .·year period (Davidson-Amort, 1986b). Healy
et al. (1987) estimated the average long-term ero-sion rate for Kiel Bay over the past 5800 years to be 0.06- 0;15em a- 1 out to a depth of about 10m. The much lower average rates here reflect much slower rates of erosion in deep water compared to shallow water and indicate that erosion in depths below about 6 m is indeed quite slow. These
studies all show that (13.1) is a good predictor of nearshore erosion and that the profiles at these locations were in dynamic equilibrium.
The shape of many cohesive profiles is con-cave, with steeper slopes close to shore and the gradient decreasing into deeper water (Figure 13.15a). This indicates in turn that ero-sion is greater close to shore and that the rate of erosion decreases exponentially offshore (Philpott, 1986; Sunamura, 1992). This is reason-able if we assume that the erosion rate is corre-lated with some measure of the bed shear stress under waves. This can be expected to decrease with increasing water depth for any given wave conditions. The erosion rate should also decrease with increasing water depth when evaluated over periods of several years because of the decreasing frequency of high magnitude events capable of eroding the bed in a depth of 6 m or more.
Short-term field measurements of erosion of the nearshore profile in till in Lal<e Ontario and Lal<e Huron provide some insight into the ero-sional mechanisms and the factors controlling their temporal and spatial pattern (Davidson-Amort 1986a; Davidson-Amort and Ollerhead, 1995; Davidson-Amort et al., 1999; Davidson-
13.4 COHESIVE BLUFF COASTS I
Arnott and Langham, 2000). The measurements were made using a modified micro-erosion meter (MEM) which measures the distance to the till surface at stations consisting of three pins set into the till (Askin and Davidson-Amort, 1981 - see Box 13.2). Measurements made along two profiles on Lal<e Ontario between 1980 and 1984 in water depths ranging from about 1m to just over 6 m showed average rates of erosion of 3-7 em a- 1 in water depths <2m with rates decreasing to about 1 em a - 1 in depths greater than 6 m (Davidson-Amort, 1986a- see Figure 13.15b). These weighted aver-age annual values conceal quite high variability from year to year (Figure 13.15c). There is consid-erable variation in the length of time over which the data were collected (from a few months to three years) and this accounts for some of the variability. Measurements made in shallow water are under-represented because of loss of stations due to the high erosion rate, or because the steel pins were damaged or plucked from the surface by ice action over the winter. Vertical erosion rates predicted from the slope of the nearshore profile at Grimsby (Figure 13.15a) using (13.1) with a long-term cliff recession rate of 1.1m a- 1 are very similar to the short-term
100
- 10 "ro E
_£. c: 0 ·c;; e
LU
0.1
• Measured <> Predicted
·······---..... _______ Q _________________ '(>. ________ ¢
• ······II. A
0 2 3 4 Depth {m)
. ..........
5 6 7 8
Predicted vertical erosion rate based on ( 13.1) and bluff recession rate of 1.1 m a-' for Grimsby, lake Ontario erosion rates (Davidson-Arnett, 1986a).
41
418 CLIFFED AND ROCKY COASTS
Box 13.2 I Measurement of vertical erosion
Successful modelling of the morphodynamics of erosion of the intertidal and near-shore platfonns on cohesive or bedrock coasts requires measurements of profile change or rates of vertical lowering. Because the rate of erosion is measured in millimetres, standard surveying along profiles is not practical. Instead, this requires repeated high precision measurements be taken at points along the profile. This has been done almost exclusively through the use of some fonn of micro-erosion meter (MEM). The original design was used first for monitoring solution rates in limestone bedrock (High and Hanna, 1970) and was modified by Robinson ( 1976) for use on intertidal platfonns. It has been used successfully for measuring erosion of intertidal rock platfonns (Kirk. 1977; Robinson, 1977a, b; Stephenson and Kirk. 1996). The instrument consists of a triangular base that is constructed to frt onto three metal pins or studs that are drilled into the rock surface and the tops levelled. A high-precision engineer's dial gauge is mounted vertically on a platfonn that is secured to the base. In some models the base can be rotated to penn it measurements in the centre of each side of the triangle, but simpler models move the whole instrument In making measurements the MEM is brought to the measurement point, frtted over the metal studs and measurements of the distance to the surface are made in the middle of the three sides of the triangle to a precision of< 0.1 mm.
A simpler version of this was used to measure erosion underwater on cohesive profiles (Askin and Davidson-Amott, 1981 ). Because erosion rates on the cohesive profile are mmto em per year, the high precision required for measurements in rock was unnecessary. The engineers gauge was replaced by a simple metal ruler with a mm scale and the rotating assembly was dispensed with in favour of simply lifting the instrument off the pins and rotating it 120 degrees (Figure 13.17a). Metal pins were hammered into the relatively soft till and the surfaces levelled to provide a horizontal surface on which to place this modified MEM. The instrument proved robust and easy to use underwater often under low visibility and with a full wet suit (Figure 13.17b ).
MEM measurements (Figure 3.15b) and provide support for the equilibrium profile concept (Figure 13.16). Note that Figure 13.16 is similar to one produced by Sunamura (1992, Figure 6.2) but he used an incorrect recession rate of 1.4 m a -l
that produced an offset between measured and predicted data.
Measurements of vertical erosion at intervals of2-4 weeks were made in 1992 at 16 stations in water depths of 0.5-3 m at St Catherines on Lake Ontario (Davidson-Arnott and Ollerhead, 1995). A total of 94 measurements was obtained over six intervals (Table 13.1). Erosion was recorded at some stations in each interval and altogether erosion was measured 80% of the time. Only four records had erosion greater than 1.0 em. These data show that even modest wave events
are able to produce some measurable erosion and that erosion of the platform is nearly contin-uous, in contrast to the episodic events that are characteristic of bluff recession.
We can apply the same conceptual approach as for erosion of the bluff toe by envisaging a set of 'assailing forces' Fw and 'resisting forces' FR which control erosion of the nearshore profile (Davidson-Arnott and Asldn, 1980; Sunamura, 1983; Davidson-Arnott and Ollerhead, 1995). In the nearshore zone, erosion of cohesive materi-als has been related primarily to fluid stresses associated with wave orbital motion and near-shore currents, and to the effect of abrasion by coarse sediment rolling over the cohesive sur-face (Davidson-Arnott and Asldn, 1980; Amos and Mosher, 1985; de Vries, 1992; Skafel and
13.4COHESIVE BLUFF COASTS
The modified Micro Erosion Meter developed for measurement erosion underwater on a cohesive coast: (A) photograph of the MEM taken on the foreshore sitting on the aluminium nails which are driven into the till at each measurement point. The rod used to measure distance to the bed slides in a vertical tube and, in contrast to the point measurement used for subaerial bedrock measurements, has a 2 em diameter foot on it to prevent penetration in the softened upper layer of till; (B) Installation of a MEM station underwater. The three pins that mark the station have been hammered into the till surface using a template. The diver at the top of the photograph is about to use the level floating below him to check that the MEM is level in all directions and the diver at the left is waiting to make the initial set of measurements for the station. The station was set up as part of the study byDavidson-Arnott and Langham (2000) and the frame that is partially visible at the bottom of the photograph was used to protect the surface from wave action in order to assess the role of pressure fluctuations in softening the till surface.
41S
420 CUFFED AND ROCKY COASTS
Bishop, 1994; Davidson-Amott and Ollerhead, 1995). In the breaker zone, erosion may be accel-erated by turbulence and the impact of plunging jets in brealdng waves (Skafel and Bishop, 1994; Skafel, 1995). Erosion of fluid mud (vane shear strength <0.5 Pa) and soft cohesive sediments (vane shear strengths 4-25 kPa) can be modelled simply (Parthenaides, 1965; de Vries, 1992) by some form of the equation:
E =M(Tb Tc) (13.2)
where E is the rate of surface erosion (kg m- 2
s- 1 ); M is the erosion rate coefficient (kg m- 2
s- 1 ); rb is the bed shear stress (N m- 2 ); and rc is the critical shear stress (N m- 2).
The critical shear stress Tc is some complex function of the shear strength, clay content, structure and other geotechnical properties (Kamphuis and Hall, 1983; Pachure and Mehta, 1985; Amos and Mosher, 1985).
The cohesive material forming the substrate of many of the cohesive coasts in mid-latitudes is frequently glacial till'that has been overconsoli-dated and that may have a vane shear strength on the order of 40-80 kPa. 'Laboratory studies of the erodibility of till under both unidirectional and oscillatory flows (Kamphuis and Hall, 1983; Zeman, 1986; Kamphuis, 1990; Skafel and Bishop, 1994; Skafel, 1995) show that the critical shear stress for unweathered till is on the order of 10-20 Pa. This is much higher than the shear stress associated with wave orbital motion alone, though they do also identifY the significance ofwealmess associated with dis-continuities and micro-fissures. The laboratory experiments of Skafel and Bishop in a 100m long wave tank did show erosion in a narrow zone associated with plunging breal<ers, while erosion was much reduced with spilling breal<-ers. Observations underwater of scour around individual cobbles and boulders on the till sur-face (Davidson-Amott {1986b) indicate that tur-bulence associated with flow around the obstacle can enhance erosion locally. There is also some evidence of the erosion of small flal<es of the till matrix along micro-fissures.
However, both field and laboratory studies show that fluid processes by themselves can
only account for a small portion of measured erosion in shallow water (depths <6m). Laboratory experiments with unidirectional flow (Kamphuis and Hall, 1983; Zeman, 1986; Kamphuis, 1990) showed that erosion by fluid forces alone was generally small, but increased rapidly with the introduction of small amounts of sand. The wave tanl< experiments of Skafel and Bishop (1994) showed that the introduction of a thin layer of sand produced erosion of about 4 mm h - 1 inside the surf zone and that, except for the location of plunging breal<ers, erosion was negligible in the absence of sand. Field stud-ies (Davidson-Amott and Asldn, 1980; Healy and Wefer, 1980; Nairn, 1986; Davidson-Amott, 1986a; Davidson-Amott and Ollerhead, 1995; Davidson-Amott and Langham, 2000) all point to abrasion as the primary mechanism of erosion of cohesive platforms wherever there is some sand and gravel available - and there almost always is some sand on· cohesive shorelines developed in glacial, glaciofluvial and glaciola-custrine sediments. '
The thiclmess of sand at points along the nearshore profile is shown in Figure 13.18 for profiles at three locations on the Great Lal<es. There is clearly considerable variation along an individual profile, and between profiles. This rai-ses the question of how does the efficacy of abra-sion vary with the thiclmess of the surficial sediment cover? Conceptually we can expect that abrasion under given wave conditions should increase rapidly as surficial sediment thiclmess increases because the greater mass and larger number of contacts should speed up the process. Beyond this, erosion should decrease quicldy to 0 as the sediment becomes thick enough for all movement to tal<e place in the sand layer above the contact with the cohe-sive platform. Skafel and Bishop {1994) found that this occurred in the wave tanl< with a sand thiclmess greater than about 1 em. In the field, with larger waves and the development of bed-forms, a more realistic cut-off is likely to be on the order of 5-10 em. However, this applies to conditions at a point on the profile and we also need to consider the fact that as wave conditions change, the type ofbedform changes. On a larger scale, areas of accurriulation, such as bars in the
A. 4
2
0 :§: li -2 Ql Cl
-4
50
B. 0.5
OA
:§: lll 0.3 (!) c: "" 0 :c 1- 0.2
0.1
0 0 50
- Hmizonview --- Bayfield - St Catharines
100 150 200 250
Distance offshore (m)
- Horizonview --- Bayfield - St Catharines
100 150 200 250 Distance offshore (m)
300 350
300 350
13.4 COHESIVE BLUFF COASTS
Measured thickness of surficial sediment on cohesive profiles at Horizon View and Bayfield (Lake Huron) and St Catharines: (A) profiles; (B) surficial sediment thickness. Note that the profile at Bayfield is completely armoured by cobbles and boulders beyond 130m.
Hypothetical sketch of annual erosion rate versus sand cover thickness for the beach and nearshore area on a cohesive coast.
E 15
c 0
10 <lJ
] 5 t::
0 10 20 30 40 50 Surficial sediment thickness (em)
nearshore and berms on the beach, migrate onshore or offshore and this movement exposes new areas of cohesive substrate while other areas become protected. Some direct evidence of the effect of the mobility of sediment close to shore on abrasion is provided by Davidson-Amort and Ollerhead (1995) and this work
that erosion took place during periods of high wave activity even in areas where the
60
surficial sediment cover during low waves was 30 em or more. As sediment cover increases there are fewer locations and times when exposed areas are subject to abrasion and thus the overall rate of vertical lowering of the platform is reduced. Averaged over time and along the pro-file, the relationship between abrasion rate and surficial sediment thickness probably looks some-thing like that shown in Figure 13:19. Support for
42

422 CLIFFED AND ROCKY COASTS
1.2
1.0
E o.8 c:
0.6 e UJ
0.4
0.2
0 10
D Av. 12 sites 8 Line 1 (95 m)
0 Line 1 (11 0 m)
0 D
• 20 30
0
D
0
0 oo D •
D • • • 40 50 60 70 80
Cumulative wave energy (m2)
Relationship between wave energy and short-term erosion of the nearshore platform at St Catharines, Lake and Ollerhead, 1995).
this also comes indirectly from studies of along-shore sediment transport gradients on cohesive coasts that show a strong relationship between high recession rates and in,creasing rates of pre-dicted longshore transport (Davidson-Amort and Am.in, 1985; Am.in and Davidson-Amort, 1997; Lawrence and Davidson-Amort, 1997).
As is the case for erosion of the bluff toe, vertical erosion of the platform through both fluid stresses and abrasion should increase withincreasingwave energy. This can be shown relatively easily in laboratory experiments (Zeman, 1986; Skafel and Bishop, 1994) and it has also been demonstrated for short-term field measurements (Davidson-Amort and Oller head, 1995; Davidson-Amort and Langham, 2000- see Figure 13.20).
The conceptual model of the controls on ver-tical erosion of the platform, like that for toe erosion, should also include the resisting forces - the strength of the material maldng up the cohesive substrate. As noted earlier, where this is overconsolidated till, it is highly resistant to fluid forces alone and we would expect the rate of abrasion to decrease with increasing strength. As is the case with subae-rial bluffs, weathering of the cohesive surface
may reduce its strength, and thus enhance the potential for erosion by both fluid and abra-sional processes. Observations showed the pres-ence of a thin layer of softened till on the till surface in places underwater (Figure 13.21a). Detailed measurements in the field, and in the laboratory, of till from the site at St Catharines showed that softening of the upper layer does occur in response to cyclic loading and unload-ing by waves (Davidson-Amort and Langham, 2000). This is manifested as an increase in the moisture content and decrease in shear strength of a layer up to a few em thick (Figure 13.22). They also documented swelling of the till surface during periods of low wave activity. Similar measurements at sites with dif-ferent clay mineral content suggest that the extent of this weathering will depend on the clay mineralogy. The degree of weathering depends on the time interval between storms and the measurements documented in Table 13.1 suggest that erosion of the weathered material occurs rapidly, but then slows down as the underlying harder, unweathered material is exposed. The extent of weathering also depends on the sheltering effect of surficial sand cover so that till remains hard under a
13.4 COHESIVE BLUFF COASTS
Weathering of till underwater: (A) till surface underwater showing removal of a thin layer by dragging a finger along the surface; (B) variations in shear strength of the till surface along the nearshore profile (Davidson-Arnett and Langham, 2000).
B. Surficial Sediment and Shear Strength
- -E ......... --Sediment co 0... en en a> c
0.4 --;;;- Strength ......... .c
.52 .c ...... ...... c a> E
"0 a> CJ)
0.3
0.2
0.1
...... 0) c
...... en I-CO a> .c
CJ)
0 50 1 00 150 200 250 300 350 Distance offshore (m)
thiclc layer and may even undergo reconsolida-tion (Davidson-Amort and Langham, 2000). The variability of shear strength of the till surface in the nearshore thus reflects the interaction of surficial sediment cover and water depth, as well as the frequency and magnitude of storms leading to erosion of the weathered material (Figure 13.21b).
The shape of the equilibrium profile gener-ally indicates that the erosion rate is high close to shore and decreases rapidly offshore. Erosion does continue in depths greater than 6 m, though it is very slow (Healy et al., 1987). It is
driven by abrasion under large waves produced by the occasional intense storm, perhaps aided by continued softening of the till surface. Evolution of the profile may be affected by the accumulation of surficial sediment that can act to reduce erosion or shut it down. On stony till the accumulation of cobbles and boulders over time may act to armour the surface and drasti-cally slow the rate of erosion (Figure 13.18b). A thick layer of sand and gravel will have the same effect. The result is that the profile is much flatter and, ultimately, there is a reduced rate of toe erosion (Davidson-Arnott et al., 1999).
42.

424 CLIFFED AND ROCKY COASTS
A. 80
ro-a.. 60 <£ ..c: c;,
40 1::
iil ffi 20
"' ..c: en
B.
25 c .!!l 1:: 0 2 u
::J iil 15 0 ::;;
10 10
c. ro-a.. <£ 6 = "' 1:: 4 iil ffi "' ..c: en
10
- Strength - Moisture
20 30 40
Oepth(cm)
070m +150m
20 30 40
Depth below surface (m)
o70m +150m
20 30 40
Depth below surface (m)
50
50
50
25 c .!!l 1::
20 8
15 0 ::;;
Variations in shear strength and moisture content with depth below the till surface in 5 em diameter cores taken at St Catharines, Lake Ontario: (A) shear strength and moisture content variation in a core at 220 m offshore; (B) variations in moisture content for cores taken at 70 m, ISO m and 220m offshore; (C) variations in shear strength for the same cores. The profile is shown in Figure 13.20b.
13.5 I Rock coasts
The processes leading to toe erosion of rock cliffs are the same as those eroding cohesive shore-lines and similarly their relative significance will vary with the height of the still water level relative to the cliff toe. Differences in the rate of toe erosion, the characteristics of subaerial mass wasting features and the form of the cliff and platform therefore can be attributed largely to strUctural and strength differences between cliffs in rock and those in cohesive materials. The 'hardness' or strength of the material form-ing arodc cliff is usually expressed in terms of the compressive strength and this has been
found to be highly correlated with other meas-ures of strength such as cohesive strength, shear strength and tensile strength (Sunamura, 1983 -see Box 13.1). However, the resistance of rock cliffs to erosion is influenced greatly by the pres-ence of planes of wealmess formed by bedding planes, joints and fractures as well as by the strength of bonding at the level of individual crystals or grains. Expansion of these joints by direct wave impact and by compression of air, as well as by weathering leads to direct quarrying of blocks of material that can then be disintegrated through abrasion and impact. Thus, it is neces-sary to produce a modified measure of rock strength that accounts for these wealmesses such as the Rock Mass Index of Budetta et al. (2000) or the rod< mass strength of Tsujimoto (1987).
Based on this modified strength factor, we can expect to see a decrease in rock cliff reces-sion rates, measured over periods of decades or longer, with increasing rod< strength. There are few studies that have done 'this, but the data plotted in Figure 13.23 give an indication of how these rates may vary (Sunamura, 2004). These data show that wealdy cemented sedimen-tary rocks such as sandstones and shales can have recession rates that are comparable to those of cohesive coasts, putting them into the category of soft coasts. Rapid cliff recession of uplifted sandstones and siltstones of Pleistocene and Tertiary age has been documented for large sections of the California coast (see reviews in Griggs and Trenhaile, 1994 and Griggs and Patsch, 2004) and this relatively rapid recession has resulted in loss of roads and buildings (Figure 13.24a). More strongly cemented sand-stone and shales have a recession rate between 10-1 and 10-2 m a- 1 and are therefore of inter-mediate strength. Cliffs in andesite, basalt and dolerite, which have a high compressive strength and relatively few planes ofwealmess, have recession rates that are too small to meas-ure over a few decades and we can expect similar response for cliffs formed in, e.g., massive lime-stone and crystalline rocks of shield areas (Figure 13.24b).
Studies of soft rock cliffs show that, lil<e cohe-sive bluffs, they respond rapidly to short-term
13.5 ROCK COASTS
10 R* = 0.2 (In 10 -In Sc*)
Relationship between long-term cliff recession rate and cliff-forming rock-mass strength of cliffs on open coasts of Japan. Rocks with recession rates that are too low to be measured are indicated by arrows (Sunamura, 2004, based on data from Tsujimoto, 1987).
Holocene deposits • Pleistocene deposits • Pliocene mudstone
• • Pliocene mudstone/sandstone Pliocene mudstone
Miocene shale • Miocene sandstone
Andesite, • pyroclastic rocks
Cretaceous sandstone • Miocene sandstone
Miocene volcanic breccia •
1 10 Rock-mass strength, Sc* (MPa)
increases in wave energy at the cliff. Such increases may result from large waves and storm surge associated with an intense storm or the effect of several storms during periods of elevated water levels, e.g., associated with El Niiio events {Sallenger et al., 2002). In these instances elevated water levels and erosion of the beach reduce the protection afforded by a wide, high beach. Similar reductions in beach width may result from interruption oflongshore transport by groynes and harbour breal<Waters; and by the extraction of sand and gravel, as has been documented for Cran Poulet on the on the northern Boulonainais coast of France (Pierre, 2006). Rapid subaerial cliff retreat may also be triggered by events on the land, particularly the effects of changing groundwater (Pierre and Lahousse, 2006).
As with cohesive bluffs, we can expect some correlation between wave energy levels and rates of bedrock cliff retreat over long. time spans. There are few studies of this, but results
102
from the early work of Sunamura (1983) and the more recent work of Mana and Suzuld {1999) provide some support for this association {Figure 13.25).
On soft rock cliffs, erosion is relatively rapid and the junction of the cliff toe with the shore platform is relatively straight producing a fairly smooth coastline {Moore and Griggs). 2002). However, it is lil<ely that rapid toe erosion of sandstone cliffs is promoted by the availability of sandy material at the cliff/platform junction which enhances abrasion. With increasing rock strength, the character of the cliff toe and of the complexity of the coastline is increasingly influ-enced by the response of the rock material to different forms of erosion and by the exploita-tion of zones of wealmess produced by varying lithology or fracture patterns. Undercutting of the cliff toe by abrasion produces a notch and visor form because the hard rock is able to main-tain an overhang {Figure 13.24c) and failure eventually results from the development of
42.
426 CLIFFED AND ROCKY COASTS
A.
Features of erosion of bedrock coastal cliffs: (A) erosion of sandstones and siltstones on the California coast producing a sheer cliff and relatively straight coastline. Note the threat to cliff top housing produced by the cliff retreat; (B) irregular coast in resistant basalt lava flow, St Kitts; (C) notch and visor in resistant sandstone, Scotland.
tension cracks (Kogure et al., 2006). Fractures and fissure may be exploited to produce indenta-tions, caves and blow holes. The result is a rocky coast with a highly irregular shoreline and rapid variations in character, reflecting
4,--------------------------------. -- q = 0.082 F/EL
F/EL(m a·')
Correlation between F/EL (where F is the wave energy flux at the breakpoint, E is Young's modulus and Lis cliff height) and the rate of cliff recession q for nine measurement points on the Fukashima coast, Japan (Mano and Suzuki, 1999).
varying response of differing lithologies (Moura et al., 2006). On a larger scale, joint patterns or alternating harder and softer rod<s may result in the isolation of parts of tlie cliff producing stacks. Trenhaile et a1. (1998) have documented the relationship of stacks at Hopewell Cape, Bay of Fundy, which are developed in arkosic sand-stones and poorly sorted conglomerates of Carboniferous age, to the joint pattern in this location and produced a simple evolutionary model that probably can be extended to stad<s in many other areas (Figure 13.26).
As with cohesive bluffs, toe erosion triggers mass movement failures on the cliff slope and these can take a wide range of forms. In some places massive failures occur through deep seated slides and the effect of this is to push the shoreline out for some distance. Such large-scale movements may lead to protection of the toe for years and even decades (Komar, 1998). However, most rock coasts are dominated by small fail-ures, ranging from the detachment of individual blocks to topples, slumps and slides, which may only extend for some portion of the total bluff height and extend alongshore for metres or a few tens of metres (Andriani and Walsh, 2007). It is not easy to predict when and where this type of failure will occur, but where detailed mapping has tal<en place it is possible to calculate the statistical properties of mass movement hazards
(Dong and Guzzetti, 2005; Teixeira, 2006). These data can then be used to predict the statistical probability of failure and thus aid in the develop-ment of management and setback schemes where it is difficult or too expensive to obtain the detailed measurements necessary for stable slope analysis. Mechanisms and controls on rock failure and cliff profile evolution over long time periods may be better explored with computer simulation models (Allison and Kimber, 1998).
On hard rock coasts, where recession rates are too small to measure adequately over a few tens of years, the presence of erosional features such as caves and shore platforms raises the question ofhow much of the coastal morphology is inherited from processes operating during pre-vious interglacial periods (Trenhaile, 2002). Over the Quaternary sea levels have fluctuated over a range of 100m or more and, while interglacial sea levels may have been similar to the modern period, the cumulative time at this level is rela-tively small compared to lower levels found dur-ing the much longer glacial periods. Some appreciation of the evolution of the whole coastal profile can be found in areas where uplift has raised the coast and nearshore allowing study of the erosional profile (Bradley and Griggs, 1976; A1varez-Marr6n et al., 2008). In the example of uplifted terraces in western Asturias, Spain, the minimum age for the terrace is estimated to be 1-2Ma. Thus, the nearshore slope has evolved over a large number of sea
13.6 SHORE PLATFORMS
level cycles, of varying duration and magnitude, all the while subjected to slow uplift (A1varez-Marr6n et al., 2008).
13.6 I Shore platforms
Despite the title of Trenhaile's (1980) review (Shore platforms: a neglected coastal feature), there is a rich literature on shore platforms and no shortage of recent research. There is also no shortage of confusion over definition of the term and some controversy over the perceived impor-tance of weathering versus marine processes in platform development (e.g., Stephenson, 2000). In this section we can mal<e use of insights from the study of cohesive coast evolution to throw some light on the mechanisms that may be at work on hard rock coasts and which control the evolution of the profile following recession of the cliff toe.
Conceptually we cqn begin by defining a shore platform as the erosional surface in bedrock or other resistant material that extends from the cliff toe offshore to the limit of wave erosion. The platform is considered to be formed by reces-sion of the coastal cliff toe and subsequently modified by wave action. However, a portion of it may lie seaward of the point at which cliff recession was initiated. The platform may have varying amounts of surficial sediments on it, but the thickness should not be great enough to
42
428 I CUFFED AND ROCKY COASTS
prevent exposure of the bedrock at least intermit-tently. In contrast to the steep face of the subae-rial cliff, the platform slope is relatively gentle and parts of it may be nearly horizontal - hence the term platform. Shore platforms are usually portrayed as consisting of two types on the basis of the profile normal to the shoreline (Figures 13.2b, c) and much of the attention has been focused on Type B platforms that are marked a scarp or low cliff near the low-tide line, with a nearly horizontal component above this and a sloping component seaward of it.
While diagrams depicting platform types are usually drawn to include at least a part of the nearshore zone, the reality is that very little of the research carried out on platform processes on rock coasts has extended below the low-tide limit. This is in contrast to the work on cohesive coasts, where there has been a clear linkage established between the subaqueous and the subaerial processes, and to the rich literature on measurement of nearshore processes on sandy coasts. One result of this has been a ten-dency to limit the definition of the seaward boundary of the platform to the low-tide line
· (e.g., Palmara et al., 2007) l-ather than viewing this as simply the portion of the platform which is intermittently exposed to subaerial processes in addition to wave action. This limited perspec-tive is carried to the study of recent platform development in lalce Waikaremoana, New Zealand (Allan et al., 2002).
As we noted in Section 13.2, Type A platforms reflect conditions where vertical lowering of the platform in the intertidal area is similar to that in the inner nearshore and keeps pace with horizon-tal retreat of the cliff toe. The cohesive profiles described in Section 13.4 fall into this category and the conceptual model that we made use of to explore the concept of a dynamic equilibrium between horizontal retreat of the cliff toe and vertical lowering of the platform should be appli-cable to Type A profiles in bedrodc. Where cliff retreat rates are comparatively rapid there has been sufficient time for an equilibrium to be established and we can expect platform profiles in areas such as the Bay of Fundy (e.g., Trenhaile et al., 1998) and the California coast (Griggs and Patsch, 2004) to fit this model.
Since the time available for vertical lowering of the platform increases away from the cliff toe, the presence of the nearly horizontal intertidal portion of the platform associated with Type B platforms must therefore reflect very slow rates of vertical erosion in that zone compared to sim-ilar portions of Type A platforms. Measurements of vertical lowering of the intertidal areas of Type B platforms generally range between 0.5-1.5 mm a- 1 (e.g., Table 1 in Stephenson, 2000). These are at least an order of magnitude less than those measured on cohesive coasts. The presence of the nearly horizontal platform and associated low rates of vertical erosion pose a number of research questions, including: (1) Why is the ver-tical erosion rate in this zone apparently much less than for similar zones on coasts with a Type A profile? Is it a function of the strength of the rock material (high FR), reduced effectiveness of the erosive forces (low FA) andfor low weathering rates? (2) Why is vertical erosion apparently much less effective than erosion of the cliff toe which produced cliff recession and widening of the platform? (3) How is the low tide scarp or the cliff formed? Is this a static feature or does it also recede, thus ultimately controlling the width of the horizontal component of the platform? (4) Are vertical erosion rates seaward of the low tide cliff similar to that of the intertidal, or are they higher and thus more comparable to Type A platforms?
As we noted in Sections 13.2 and 13.3, the mechanisms leading to vertical erosion have been identified as fluid forces associated with shoaling waves, brealcing waves and surf bores, and mechanical forces resulting from abrasion by particles rolling across the bedrodc surface. Quarrying may be important in some areas, espe-cially where sedimentary rodcs dip seaward (Trenhaile and Kanyaya, 2007). As is the case for cohesive profiles, weathering of the rock surface may reduce the surface strength so that wave action simply removes the weathered material. Stephenson and Kirk (2000a, b) have argued that wave action is relatively wealc on the shore plat-forms of the Kaikoura Peninsula, New Zealand and that the dominant process of platform lowering is through subaerial weathering. They have also documented swelling of the bedrock surface (Stephenson and Kirk; 2001) which is similar to
Photographs of the intertidal components of Type B shore platforms: (A) Sydney, New South Wales, Australia; (B) St Lucia, West Indies.
the swelling reported for the platform underwater by Davidson-Amort and Langham (2000). On the other hand, in a series of papers reporting on labo-ratory and computer simulations Trenhaile and others have argued that weathering only plays a secondary role and that wave action is the domi-nant process (Trenhaile, 2006, 2008; Kanyaya and Trenhaile, 2005; Trenhaile and Kanyaya, 2007; Trenhaile and Porter,2007). It seems lilcely that the effectiveness of the two processes may vary with location (exposure), bedrodc properties, the elevation of the intertidal platform and tidal range.
Whatever the relative effectiveness of wave action versus weathering, the problem still remains as to why the rates of erosion are so much lower in the intertidal zone than those asso-ciated with Type A platforms. Work on erosion of platforms on cohesive coasts detailed in Section 13.4 showed that abrasion was far more effective than fluid forces produced by waves
13.6 SHORE PLATFORMS I
alone. Thus, it is possible that the low rates of vertical erosion on Type B platforms reflect the scarcity of sand and gravel on the platform that would promote abrasion. This might arise because of limited rate of supply (e.g., very hard rocks and low recession rate, or rode types such as limestone or mudstone that do not supply much sand and gravel debris), and/or because the debris supplied is rapidly removed alongshore. Certainly, qualita-tive observations suggest that Type A platforms are associated with fairly abundant occurrence of sand and gravel over the bedrock surface while Type B platforms are mostly bare (Figure 13.27). The pioneering work of Robinson (1977a, 1977b) on the Northeast Yorkshire coast showed that areas where there was a substantial accumulation of sand and pebbles in front of the cliff had high rates of vertical erosion producing a ramp with a slope of 2.5°-15°. In contrast, areas where there was no surficial sediment over the shale bedrod< had relatively low rates of vertical erosion produc-ing a 'plane' with a slope of about 1 o. The effective-ness of abrasion where there is a supply of material to do the work is supported by the study of Blanco-Chao et al. (2007) on the Galician coast of Spain as well as that of Thornton and Stephenson (2006) who noted lower platform ele-vations on platforms on the Otway coast, Australia, which were backed by a sandy beach.
The detailed morphology of Type B platforms, such as the form of the profile, platform width and elevation, and the nature and height of the low tide cliff, is quite variable even over quite a short distance alongshore. Some of these differences may reflect variability in processes such as wave exposure and weathering. Others may be attribut-able to differences in the strength of the bedrodc and features such as lithology, the thickness of beds, angle of dip and the presence or absence of fractures and joints (Kennedy and Dickson, 2006).
Although the seaward cliff is a significant fea-ture of the Type B platform there· is very little information on its origin, its form, and erosional processes operating on it. Despite some tion as to the origin of the cliff, and whether It retreats (Tsujimoto, 1987; Stephenson, 2000), none of the recent studies of these platforms seem to extend to the nearshore. Until we get
42
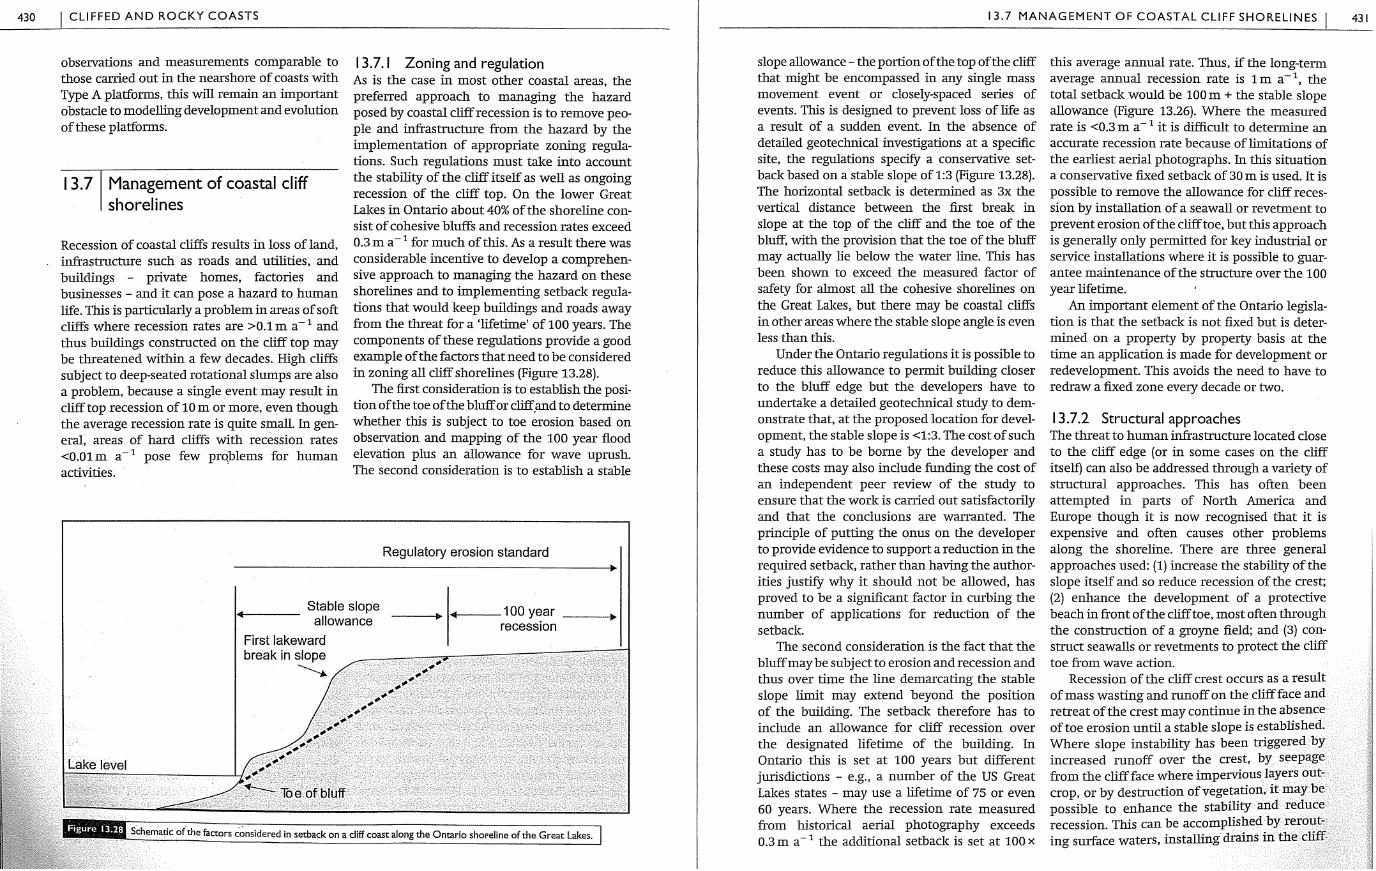
430 I CLIFFED AND ROCKY COASTS
observations and measurements comparable to those carried out in the nearshore of coasts with Type A platforms, this will remain an important obstacle to modelling development and evolution of these platforms.
13.7 Management of coastal cliff shorelines
Recession of coastal cliffs results in loss ofland, infrastructure such as roads and utilities, and buildings - private homes, factories and businesses - and it can pose a hazard to human life. This is particularly a problem in areas of soft cliffs where recession rates are >0.1 m a - 1 and thus buildings constructed on the cliff top may be threatened within a few decades. High cliffs subject to deep-seated rotational slumps are also a problem, because a single event may result in clifftop recession of 10m or more, even though the average recession rate is quite small. In gen-eral, areas of hard cliffs with recession rates <0.01m a- 1 pose few pro,blems for human activities.
13.7.1 Zoning and regulation As is the case in most other coastal areas, the preferred approach to managing the hazard posed by coastal cliff recession is to remove peo-ple and infrastructure from the hazard by the implementation of appropriate zoning regula-tions. Such regulations must take into account the stability of the cliff itself as well as ongoing recession of the cliff top. On the lower Great Lal<es in Ontario about 40% of the shoreline con-sist of cohesive bluffs and recession rates exceed 0.3 m a - 1 for much of this. As a result there was considerable incentive to develop a comprehen-sive approach to managing the hazard on these shorelines and to implementing setback regula-tions that would keep buildings and roads away from the threat for a 'lifetime' of 100 years. The components of these regulations provide a good example of the factors that need to be considered in zoning all cliff shorelines (Figure 13.28).
The :first consideration is to establish the posi-tion of the toe of the bluff or cli:ff,and to determine whether this is subject to toe erosion based on observation and mapping of the 100 year flood elevation plus an allowance for wave uprush. The second consideration is to establish a stable
Regulatory erosion standard
, ____ Stable slope allowance ----+ 1+---1 00 year __ _...
recession First lakeward break in slope
13.7 MANAGEMENT OF COASTAL CLIFF SHORELINES I
slope allowance- the portion of the top of the cliff that might be encompassed in any single mass movement event or closely-spaced series of events. This is designed to prevent loss of life as a result of a sudden event. In the absence of detailed geotechnical investigations at a specific site, the regulations specifY a conservative set-back based on a stable slope of1:3 (Figure 13.28). The horizontal setback is determined as 3x the vertical distance between the :first breal< in slope at the top of the cliff and the toe of the bluff, with the provision that the toe of the bluff may actually lie below the water line. This has been shown to exceed the measured factor of safety for almost all the cohesive shorelines on the Great Lal<es, but there may be coastal cliffs in other areas where the stable slope angle is even less than this.
Under the Ontario regulations it is possible to reduce this allowance to permit building closer to the bluff edge but the developers have to undertal<e a detailed geotechnical study to dem-onstrate that, at the proposed location for devel-opment, the stable slope is <1:3. The cost of such a study has to be borne by the developer and these costs may also include funding the cost of an independent peer review of the study to ensure that the work is carried out satisfactorily and that the conclusions are warranted. The principle of putting the onus on the developer to provide evidence to support a reduction in the required setback, rather than having the author-ities justifY why it should not be allowed, has proved to be a significant factor in curbing the number of applications for reduction of the setback.
The second consideration is the fact that the bluff may be subject to erosion and recession and thus over time the line demarcating the stable slope limit may extend beyond the position of the building. The setback therefore has to include an allowance for cliff recession over the designated lifetime of the building. In Ontario this is set at 100 years but different jurisdictions - e.g., a number of the US Great Lakes states - may use a lifetime of 75 or even 60 years. Where the recession rate measured from historical aerial photography exceeds 0.3 m a- 1 the additional setback is set at 100 x
this average annual rate. Thus, if the long-term average annual recession rate is 1 m a-\ the total setback would be 100m + the stable slope allowance (Figure 13.26). Where the measured rate is <0.3 m a - 1 it is difficult to determine an accurate recession rate because of limitations of the earliest aerial photographs. In this situation a conservative fixed setback of 30m is used. It is possible to remove the allowance for cliff reces-sion by installation of a seawall or revetment to prevent erosion of the cliff toe, but this approach is generally only permitted for key industrial or service installations where it is possible to guar-antee maintenance of the structure over the 100 year lifetime.
An important element of the Ontario legisla-tion is that the setback is not fixed but is deter-mined on a property by property basis at the time an application is made for development or redevelopment. This avoids the need to have to redraw a fixed zone every decade or two.
13.7.2 Structural approaches The threat to human infrastructure located close to the cliff edge (or in some cases on the cliff itself) can also be addressed through a variety of structural approaches. This has often been attempted in parts of North America and Europe though it is now recognised that it is expensive and often causes other problems along the shoreline. There are three general approaches used: (1) increase the stability of the slope itself and so reduce recession of the crest; (2) enhance the development of a protective beach in front of the cliff toe, most often through the construction of a groyne field; and (3) con-struct seawalls or revetments to protect the cliff toe from wave action.
Recession of the cliff crest occurs as a result of mass wasting and runoff on the cliff face and retreat of the crest may continue in the absence of toe erosion until a stable slope is established. Where slope instability has been triggered by increased runoff over the crest, by. seepage from the cliff face where impervious layers out-crop, or by destruction of vegetation, it may be possible to enhance the stability and reduce recession. This can be accomplished by rerout-ing surface waters, installing drains in the cliff·
431
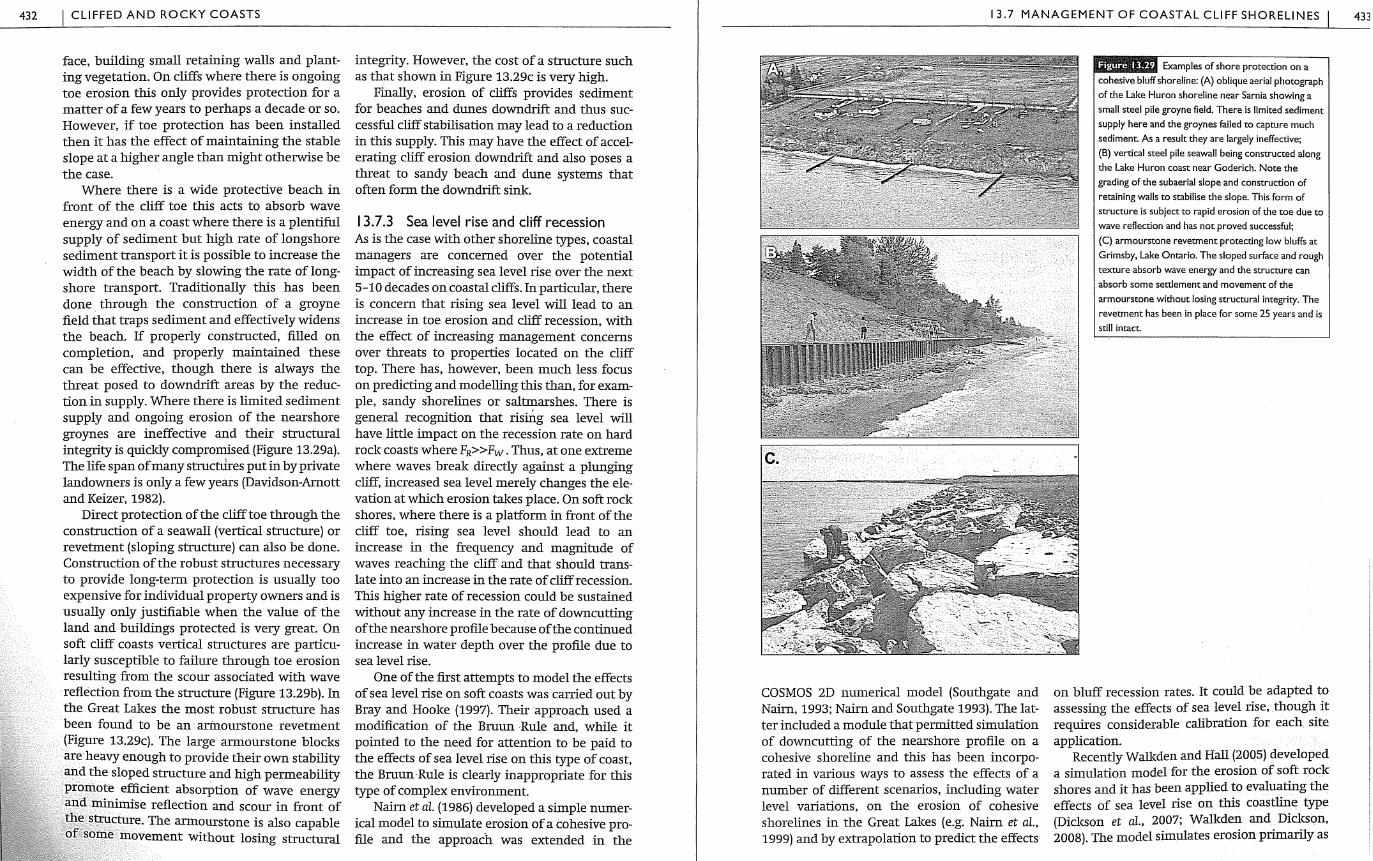
432 I CLIFFED AND ROCKY COASTS
face, building small retaining walls and plant-ing vegetation. On cliffs where there is ongoing toe erosion this only provides protection for a matter of a few years to perhaps a decade or so. However, if toe protection has been installed then it has the effect of maintaining the stable slope at a higher angle than might otherwise be the case.
Where there is a wide protective beach in front of the cliff toe this acts to absorb wave energy and on a coast where there is a plentiful supply of sediment but high rate of longshore sediment transport it is possible to increase the width of the beach by slowing the rate of long-shore transport. Traditionally this has been done through the construction of a groyne field that traps sediment and effectively widens the beach. lf properly constructed, filled on completion, and properly maintained these can be effective, though there is always the threat posed to downdrift areas by the reduc-tion in supply. Where there is limited sediment supply and ongoing erosion of the nearshore groynes are ineffective and their structural integrity is quiddy compromised (Figure 13.29a). The life span of many structUres put in by private landowners is only a few years (Davidson-Arnott and Keizer, 1982).
Direct protection of the cliff toe through the construction of a seawall (vertical structure) or revetment (sloping structure) can also be done. Construction of the robust structures necessary to provide long-term protection is usually too expensive for individual property owners and is usually only justifiable when the value of the land and buildings protected is very great. On soft cliff coasts vertical structures are particu-larly susceptible to failure through toe erosion resulting from the scour associated with wave reflection from the structure (Figure 13.29b). In the Great Lakes the most robust structure has been found to be an arinourstone revetment (Figure 13.29c). The large armourstone blocks are heavy enough to provide their own stability and the sloped structure and high permeability promote efficient absorption of wave energy and minimise reflection and scour in front of ,the structure. The armourstone is also capable of some movement without losing structural
integrity. However, the cost of a structure such as that shown in Figure 13.29c is very high.
Finally, erosion of cliffs provides sediment for beaches and dunes downdrift and thus suc-cessful cliff stabilisation may lead to a reduction in this supply. This may have the effect of accel-erating cliff erosion downdrift and also poses a threat to sandy beach and dune systems that often form the downdrift sinlc
13.7.3 Sea level rise and cliff recession As is the case with other shoreline types, coastal managers are concerned over the potential impact of increasing sea level rise over the next 5-10 decades on coastal cliffs. In particular, there is concern that rising sea level will lead to an increase in toe erosion and cliff recession, with the effect of increasing management concerns over threats to properties located on the cliff top. There has, however, been much less focus on predicting and modelling this than, for exam-ple, sandy shorelines or saltmarshes. There is general recognition that risillg sea level will have little impact on the recession rate on hard rock coasts where FR>>Fw. Thus, at one extreme where waves breal< directly against a plunging cliff, increased sea level merely changes the ele-vation at which erosion tal<es place. On soft rock shores, where there is a platform in front of the cliff toe, rising sea level should lead to an increase in the frequency and magnitude of waves reaching the cliff and that should trans-late into an increase in the rate of cliff recession. This higher rate of recession could be sustained without any increase in the rate of downcutting of the nearshore profile because of the continued increase in water depth over the profile due to sea level rise.
One of the first attempts to model the effects of sea level rise on soft coasts was carried out by Bray and Hooke (1997). Their approach used a modification of the Bruun Rule and, while it pointed to the need for attention to be paid to the effects of sea level rise on this type of coast, the Bruun Rule is clearly inappropriate for this type of complex environment.
Nairn et al. (1986) developed a simple numer-ical model to simulate erosion of a cohesive pro-file and the approach was extended in the
13.7 MANAGEMENT OF COASTAL CLIFF SHORELINES
COSMOS 2D numerical model (Southgate and Nairn, 1993; Nairn and Southgate 1993). The lat-ter included a module that permitted simulation of downcutting of the nearshore profile on a cohesive shoreline and this has been incorpo-rated in various ways to assess the effects of a number of different scenarios, including water level variations, on the erosion of cohesive shorelines in the Great Lakes (e.g. Nairn et al., 1999) and by extrapolation to predict the effects
Examples of shore protection on a cohesive bluff shoreline: (A) oblique aerial photograph of the Lake Huron shoreline near Sarnia showing a small steel pile groyne field. There is limited sediment supply here and the groynes failed to capture much sediment. As a result they are largely ineffective; (B) vertical steel pile seawall being constructed along the Lake Huron coast near Goderich, Note the grading of the subaerial slope and construction of retaining walls to stabilise the slope, This form of structure is subject to rapid erosion of the toe due to wave reflection and has not proved successful; (C) armourstone revetment protecting low bluffs at Grimsby, Lake Ontario. The sloped surface and rough texture absorb wave energy and the structure can absorb some settlement and movement of the armourstone without losing structural integrity. The revetment has been in place for some 25 years and is still intact.
on bluff recession rates. It could be adapted to assessing the effects of sea level rise, though it requires considerable calibration for each site application.
Recently Wall<den and Hall (2005) developed a simulation model for the erosion of soft rock shores and it has been applied to evaluating the effects of sea level rise on this coastline type (Dicl<son et al., 2007; Wall<den and Dickson, 2008). The model simulates erosion primarily as
433
434 CLIFFED AND ROCKY COASTS
a function of the relationship between brealdng wave characteristics and rock resistance based on an equation from Kamphuis (1987):
(13.3)
where R is a function of the rock resistance and other factors that require calibration.
The inclusion of the slope angle is a bit prob-lematic (as Walkden and Hall discuss in their paper). There does not seem to be any obvious physical rationale for erosion rate to depend on slope angle, especially for the small slope angles found in the intertidal zone. Rather, it reflects an empirical association between high recession rates and a steeper inner nearshore slope ( concav-ity) on profiles in the Great Lakes. Wall<den and Hall's model is also a bit restricted since it does not simulate erosion of the profile seaward of the breal<er zone. Nevertheless, the modelling efforts provide some useful insights into the complexity of factors controlling recession of soft rock coasts and therefore the difficulty of isolating the effects of sea level rise from other controls.
Trenhaile (2009) describes a simulation model that mal<es use of a version of the excess stress approach (13.2) to predict erosion by waves across the nearshore and intertidal zone and also accounts for the presence of cohesion-less beach material. It explicitly recognises the link between nearshore profile erosion and hor-izontal bluff recession and seems to offer the potential to explore a number of scenarios related to varying lithology, thickness of beach sediments and sea level rise.
Further reading
Brew, D. 2004. Understanding and Predicting Beach Morphological Change processes Assodated with the Erosion of Cohesive Foreshores Scoping Report. Technical Report FD1915, Defra{EnvironmentAgency, London, 73 pp. This provides a comprehensive review of our under-
standing of erosional processes on cohesive shorelines.
Hampton, M.A and Griggs, G.B. (eds.), 2004. Formation, Evolution and Stability of coastal Giif.;-Status and Trends. United States Geological Survey, Professional Paper 1693; 123 pp.
This contains a good review of cliff processes as well as regional reports from the US west coast and Great Lal<es. It is available online as a PDF.
Sunamura, T. 1992. Geomorphology of Rocky Coasts. Wiley, Chichester, 302 pp.
Trenhaile, AS., 1987. The Geomorphology of Rock Coasts. Oxford University Press, 384 pp. Although getting a bit old now, these two
books provide a wealth of material and somewhat contrasting approaches to the study of rock (or rocky) coasts.
References
Adams, P. N., Storlazzi, C. D. and Anderson, .R. S. 2005. Nearshore wave-induced cyclical flexing of sea cliffs. Journal of Geophysical Research, 110, F02002, 1-19.
Allan, J. C., Stephenson, W. J., Kirk, R. M. and Taylor, A 2002. Lacustrine shore platforms at Lal<e Wail<aremoana, North Island, New Zealand. Earth Swface Processes and Landforms, 27, 207-220.
Allison, R.J. and Kimber, 0. G. 1998. Modelling failure mechanisms to explain rock slope change along the Isle of Pur bed< Coast, UK. Earth Suiface Processes and Landforms, 23, 731-750.
Alvarez-Marr6n, J., Hetzel, R., Niedermann, S., Menendez, R. and Marquinez, J. 2008. Origin, struc-ture and exposure history of a wave-cut platform more than 1 Ma in age at the coast of northern Spain: A mUltiple cosmogenic nuclide approach. Geomorphology, 93, 316-334.
Amin, S.M. N., 1991. Bluff Toe Erosion: Magnitude, Processes and Factors Along a Section of Lake Erie South Shore. Ph.D. Thesis, Kent State University, 235 pp.
Amin, S.M. N., and Davidson-Arnott, R. G. D. 1995. Toe erosion of glacial till bluffs, Lal<e Erie south shore. Canadian Journal of Earth Sdences, 32, 829-837.
Amin, S.M.N., and Davidson-Arnott, R.G.D. 1997. A statistical analysis of the controls on shoreline ero-sion rates, Lal<e Ontario. Journal of Coastal Research, 13, 1093-1101.
Amos, C. L., Mosher, D. C. 1985. Erosion and deposition of fine grained sediments from the Bay of Fundy. Sedimentology, 32, 815-832.
Andriani, G. F. and Walsh, N. 2007. Rocky coast geo-morphology and erosional processes: A case study along the Murgia coastline south ofBari, Apulia- SE Italy. Geomorphology, 87, 224-238.
Askin, R. W. and Davidson-Arnott, R. G. D. 1981. Micro-erosion meter modified for use underwater. Marine Geology, 40, M45-M48.
Aydin, A. and Basu, A 2005. The Schmidt hammer in rock material characterization, Engineering Geology, 81, 1-14.
Bernatchez, P. and Dubois, J-M. 2008. Seasonal quanti-fication of coastal processes and cliff erosion on fine sediment shorelines in a cold temperate climate, north shore of the St. Lawrence Maritime Estuary, Quebec. Journal of Coastal Research, 24, 169-180.
Blanco-Chao, R., Perez-Alberti, A, Trenhaile, A. S., Costa-Casais, M. and Valcarcel-Diaz, M. 2007. Shore p1atform abrasion in a para-periglacial environ-ment, Galicia, Northwestern Spain. Geomorphology, 83, 136-151.
Bradley, W.C. and Griggs, G.B. 1976. Form, genesis and deformation of central California wave-cut plat-forms. Geological Sodety of America Bulletin, 87, 43-449.
Bray, M. J. and Hooke, J. M. 1997. Prediction of soft -cliff retreat with accelerating sea-level rise. Journal of Coastal Research, 13, 453-467.
Brew, D. 2004. Understanding and Predicting Beach Morphological Change processes Assodated with the Erosion of Cohesive Foreshores Scoping Report. Technical Report FD1915, Defra{Environment Agency, London, 73 pp.
Bryan, R. B. and Price, A. G. 1980. Recession of the Scarborough Bluffs, Ontario, Canada. Zeitschrift fur Geomorphologie, S.B. 34, 48-64.
Budder, W.R. and Winters, H.A 1983. Lal<e Michigan bluff recession. Annals of the Assodation of American Geographers, 73, 89-110.
Budetta, P., Galieta, G. and Santo, A. 2000. A method-ology for the study of the relation between coastal cliff erosion and the mechanical strength of soils and rock masses. Engineering Geology, 56, 243-256.
Carter, C. H. and Guy, D. E. Jr. 1988. Coastal erosion: processes, timing and magnitudes at the bluff toe. Marine Geology, 84, 1-17.
Carter, C. H., Monroe, C. B. and Guy, E. G.Jr. 1986. Lal<e Erie shore erosion: the effect of beach width and shore erosion structures. Journal of Coastal Research, 2, 17-23
Collins, B. D. and Sitar, N. 2008. Processes of coastal bluff erosion in wealdy lithified sands, Pacifica, California, USA. Geomorphology, 97,483-501.
Davidson-Arnott, R. G. D. 1986a. Rates of erosion of till in the nearshore zone. Earth Suiface Processes and Landforms, 11, 53-58.
Davidson-Arnott, R. G. D. 1986b. Erosion of the near-shore profile in till: rates, controls and implications for shoreline protection Proceedings Symposium on
REFERENCES
Cohesive Shores, National Research Council of Canada, Ottawa, Canada, pp, 137-149.
Davidson-Arnott, R. G. D. 1990. The effects of water level fluctuations on coastal erosion in the Great Lakes. Ontario Geographer, 10, 12-25.
Davidson-Arnott, R. G. D.. and Askin, R. W. 1980. Factors controlling erosion of the nearshore profile in overconsolidated till, Grimsby, Lal<e Ontario Proceedings Canadian Coastal Conference, National Research Council of Canada, Ottawa, Canada, pp. 185-199.
Davidson-Arnott, R. G. D. and Keizer, H. I. 1982. Shore protection in the town of Stoney Creek, Southwest Lal<e Ontario, 1934-1979: Historical changes and durability of structures. Journal of Great Lakes Research, 8, 635-647.
Davidson-Arnott, R. G. D. and Amin, S.M. N. 1985. An approach to the problem of coastal erosion in Quaternary sediments. Applied Geography, 5, 99-116.
Davidson-Arnott, R. G. D. and Ollerhead, J. 1995. Nearshore erosion on a cohesive shoreline. Marine Geology, 122, 349-365.
Davidson-Arnott, R.G.D. and Langham, D.R.J. 2000. The effects of softening on nearshore erosion on a cohesive shoreline. Mmine Geology, 166, 145-162.
Davidson-Arnott, R. G. D., van Proosdij, D., Ollerhead, J. and Langham, D. 1999. Rates of erosion of till in the nearshore zone on Lal<es Huron and Ontario. Proceedings Canadian Coastal Conference, CCSEA, 627-636.
De Vries,]. W.1992. Field measurements of the erosion of cohesive sediments. Journal of Coastal Research, 8, 312-318.
Dickson, M.E., Wall<den, M.J.A., and Hall, J. W. 2007. Systemic impacts of climate change on an eroding coastal region over the twenty-first century. Gimatic Change, 84, 141-166.
Dong, P. and Guzzetti, F. 2005. Frequency-size statis-tics of soft-cliff erosion. Journal of Waterway, Port, Coastal and Ocean Engineering, 131, 37-42.
Edil, T. B., and Vallejo, L. E. 1980. Mechanics of coastal landslides and the influence of slope parameters. Marine Geology, 16, 83-96.
Gelinas, P.J., and Quigley, R. M. 1973. The influence of geology on erosion rates along the north shore of Lake Erie. Proceedings of the 16th Conference on Great Lakes Research, 421-430.
Greenwood, R. 0. and Orford, J.D. 2008. Temporal pat-terns and processes of retreat of drumlin coastal cliffs - Strangford Lough, Northern Ireland. Geomorphology, 94, 153-169.
435

436 I CUFFED AND ROCKY COASTS
Griggs, G. B. and Trenhaile, AS. 1994. Coastal cliffs and platforms. Chapter 11 in Carter, R. W. G. and Woodroffe, C.D. (eds.), Coastal Evolution: Late Quaternary Shoreline Morphodynamics. Cambridge University Press, Cambridge, 425-450.
Griggs, G. B. and Patsch, K. B. 2004. California's coastal cliffs and bluffs. In Hampton, M.A. and Griggs, G. B. (eds.), Formation, Evolution and Stability of coastal Cliffi-Status and Trends. United States Geological Survey, Professional Paper 1693, 53-64.
Gulyaev, S. A. and Buckeridge, J. S. 2004. Terrestrial methods for monitoring cliff erosion in an urban environment. journal of Coastal Research, 20, 871-878.
. Hall, A.M., Hansom, J.D., Williams, D. M. and Jarvis, J. 2006. Distribution, geomorphology and lithofacies of cliff-top storm deposits: examples from high energy coasts of Scotland and Ireland. Marine Geology, 232, 131-155.
Hampton, M.A. and Griggs, G. B. (eds.), 2004. Formation, Evolution and Stability of coastal Cliffi-Status and Trends. United States Geological Survey, Professional Paper 1693, 123 pp.
Healy, T. R. and Wefer, G. 1980. The efficacy of sub-marine erosion versus cliff retreat as a supplier of marine sediment in the Kieler Bucht, Western Baltic. Meyniana, 32, 89-96.
Healy, T.R., Sneyd, AD. and, Werner, F. 1987. First approximation sea-level dependent mathe-matical model for volume eroded and submarine profile development in a semi-enclosed sea: Kiel Bay, Western Baltic. Mathematical Geology, 19, 41-50
Hequette, A. and Barnes, P. W. 1990. Coastal retreat and shoreface profile variations in the Canadian Beaufort Sea. Marine Geology, 91, 113-132.
High, C.J. and Hanna, F.K. 1970. A method for direct measurement of erosion on rod< surfaces. British Geomorphology Research· Group, Technical Bulletin 5, 1-25.
Hutchinson, J. N. 1973. The response of London Clay cliffs to differing rates of toe erosion. Geologia Applicata e Idrogeo1ogia, 8, 221-239.
Hutchinson, J. N. 1986. Cliffs and shores in cohesive materials: geotechnical and engineering aspects. Proceedings Symposium on Cohesive Shores, National Research Council of Canada, Ottawa, Canada, 1-44.
Jibson, R. W., Odum, J. K. and Staude, J-M. 1994. Rates and processes of bluff recession alorig the Lalce Michigan Shoreline in Illinois, journal of Great Lakes Research, 20, 135-152.
D. G. and Williams, AT. 1991. Statistical analy-sis of factors influencing cliff erosion along a section
of the west Wales coast, UK. Earth Suiface Processes and Landforms, 16, 95-111.
Kamphuis, J. W. 1987. Recession rate of glacial till bluffs. Journal of Waterway, Port, Coastal and Ocean Engineering, 113, 60-73.
Kamphuis, J. W. 1990. Influence of sand or gravel on the erosion of cohesive sediment Journal of Hydraulic Research, 28, 43-53.
Kamphuis J. W. and Hall, K. R. 1983. Cohesive material erosion by unidirectional current. Journal Hydraulics Division, ASCE, 109, 49-61.
Kanyaya, J. I. and Trenhaile, A. S. 2005. Tidal wetting and drying on shore platforms: An experimental assessment. Geomorphology, 70, 129-146.
Kennedy, D. M. and Did<son, M. E. 2006. Lithological control on the elevation of shore platforms in a microtidal setting. Earth Suiface Processes and Landforms, 31, 1575-1584.
Kirk, R. M. 1977.Rates and forms of erosion on interti-dal platforms at Kailcoura Peninsula, South Island, New Zealand. New Zealand Journal of Geology and Geophysics, 20, 571-613.
Kogure, T., Aoki, H., Maekado, A., Hirose, T. and Matsul<ura, Y. 2006. Effect of notthes and tension cradcs on instability oflimestone coastal cliffs in the Ryulcyus, Japan. Geomorphology, 80, 236-244.
Komar, P. D. 1998. Wave erosion of a massive artificial coastal landslide. Earth Suiface Processes and Landforms,23,415-428
Lantuit, H. and Pollard, W. H. 2008. Fifty years of coastal erosion and retrogressive thaw slump activ-ity on Herschel Island, southern Beaufort Sea, Yukon Territory, Canada. Geomorphology, 95,84-102.
Lawrence, P. L. and Davidson-Arnott, R. G. D. 1997. Alongshore wave energy and sediment transport on southeastern Lake Huron. Journal of Coastal Research, 13, 1004-1015.
Lee, E. M. 2008. Coastal cliff behaviour: Observations on the relationship between beach levels and reces-sion rates. Geomorphology, 101, 558-571.
Mano, A and Suzuki, S. 1999. Erosion characteristics of sea cliff on the Fulrushima coast. Coastal Engineering journal, 41, 43-63.
Manson, G. K. 2002. Semi-annual erosion and retreat of cohesive till bluffs, McNab's Island, Nova Scotia. Journal of Coastal Research, 18,421-432.
McGreal, W. S. 1979. Marine erosion of glacial sedi-ments from a low-energy cli:ffline environment near KiJkeel, Northern Ireland. Marine Geology, 32, 89-103.
Moore, L.J. and Griggs, G.B. 2002. Long-term cliff retreat and erosion hotspots along the central
shores of the Monterey Bay National Marine Sanctuary. Marine Geology, 181, 265-283.
Moura, D., Albardeiro, L., Veiga-Pires, C., Boski, T. and Tigano, E. 2006. Morphological features and pro-cesses in the central Algarve rod<y coast (South Portugal). Geomorphology, 81, 345-360.
Nairn, R. B. 1986. Physical modelling of erosion on cohesive profiles. Proceedings Symposium on Cohesive Shores. National Research Council of Canada, Ottawa, Canada, 210-225.
Nafrn, R. B. and Southgate, H. N. 1993. Deterministic profile modelling of nearshore processes. Part 2. Sediment transport and beach profile development. Coastal Engineering, 19, 57-96 .
Nairn, R.B., Davis, J.E. and Thieme, S.J. 1999. A CIS-linked flood and erosion prediction system for Lake Michigan. Proceedings Coastal Sediments '99, ASCE, pp. 1978-1993.
Pachure, T.M., and Mehta, A.J. 1985. Erosion of soft cohesive sediment deposits. Journal of Hydraulic Engineering, 110, 1308-1326.
Parthenaides, E. 1965. Erosion and deposition of cohe-sive soils. Journal of the Hydraulics Division, ASCE, 91, 105-139.
Philpott, K. L. 1986. Coastal engineering aspects of the Port Burwell shore erosion damage litigation. Proceedings Symposium on Cohesive Shores, National Research Council of Canada, Ottawa, Canada, 309-338.
Pierre, G. 2006. Processes and rate of retreat of the day and sandstone sea cliffs of the northern Boulonnais (France), Geomorphology, 73, 64-77.
Pierre, G. and Lahousse, P. 2006. The role of ground-water in cliff instability: An example at Cape Blane-Nez; Pas-de-Calais, France. Earth Suiface Processes and Landforms, 31, 31-45.
Prior, D. B. 1977. Coastal mudslide morphology and process, Eocene Clay, Denmark. Geografisk Tidschrift, 76,19-33.
Quigley, R. M., Gelinas, P. J., Bou, W. T. and Packer, R. W. 1977. Cyclic erosion-instability rela-tionships: Lake Erie north shore bluffs. Canadian Geotechnical journal, 14, 301-323.
Robinson, L. A 1976. The micro-erosion meter technique in a littoral environment Marine Geology, 22, M51-M58.
Robinson, L.A. 1977a. Marine erosive processes at the cliff foot. Marine Geology, 23, 257-271.
Robinson, L.A. 1977b. Erosive processes on the shore platform of northeast Yorlcshire, England. Mmine Geology, 23, 339-361.
Sallenger, A. H. Jr., Krabill, W., Brode, J., Swift, R., Manizade, S. and Stodcdon, H. 2002. Sea-cliff erosion
REFERENCES
as a function of beach changes and extreme wave runup during the 199-1998 El Niiio. Marine Geology, 187, 279-297.
Skafel, M.G. 1995. Laboratory measurements of near-shore velocities and erosion of cohesive sediment (till) shorelines. Coastal Engineering, 24, 343-349.
Skafel, M.G., Bishop, C. T. 1994. Flume experiments on the erosion of till shores by waves. Coastal Engineering, 23, 329-348.
Southgate, H. N. and Nairn, R. B. 1993. Deterministic profile modelling of nearshore processes. Part 1. Waves and currents. Coastal Engineeting, 19, 27-56.
Stephenson, W.J. 2000. Shore Platforms: a neglected coastal feature? Progress in Physical Geography, 24, 311-327.
Stephenson, W.J. and Kirk, R.M. 1996. Measuring ero-sion rates using the micro-erosion meter: 20 years of data from shore platforms, Kailcoura Peninsula, South Island New Zealand. Mmine Geology, 131, 209-218.
Stephenson, W. J. and Kirk, R. M. 2000a. Development of shore platforms on Kaikoura Peninsula, South Island, New Zealand: part 1, the role of waves. Geomorphology, 32, 21-41.
Stephenson, W. J. and Kirk, R. M. 2000b. Development of shore platforms on Kailcoura Peninsula, South Island, New Zealand: part 2, the role of subaerial weathering. Geomorphology, 32, 43-56.
Stephenson, W.J. and Kirk, R.M. 2001. Surface swel-ling of coastal bedrock on intertidal shore plat-forms, Kailcoura Peninsula, South Island, New Zealand. Geomorphology, 41, 5-21.
Sunamura, T. 1983. Processes of sea cliff and platform erosion. In Komar, P. D. (eel.), HandbookofCoastalProcesses and Erosion. CRC Press, Boca Raton, FL, 233-265.
Sunamura, T. 1992. Geomorphology of Rocky Coasts. Wiley, Chichester, 302 pp.
Sunamura, T. 2004. Cliffs, lithology versus erosion rates. In Schwartz, M. (ed.), Encyclopedia of Coastal Sdences. Kluwer, Dordrecht, pp. 241-243.
Texeira, S. B., 2006. Slope mass movements on rod<y sea cliffs: A power-law distributed natural hazard on the Barlavento Coast, Algarve, Portugal. Continental ShelfResearch, 26, 1077-1091
Thornton, L. E. and Stephenson, W.J. 2006. Rock strength: a control of shore platform elevation. Journal of Coastal Research, 22, 224-231.
Trenhaile, A. S., 1980. Shore platforms: a neglected coastal feature. Progress in Physical Geography, 4, 1-23.
Trenhaile, A. S. 2002. Rod< coasts, with particular emphasis on shore platforms, Geomorphology, 48, 7-22.
437

438 CLIFFED AND ROCKY COASTS
Trenhaile, A S. 2006. Tidal wetting and drying on shore platforms: An experimental study of surface expan-sion and contraction, Geomorphology, 76, 316-331.
Trenhaile, A S. 2008. Modeling the role of weathering in shore platform development Geomorphology, 94, 24-39.
Trenhaile, AS. 2009. Modeling the erosion of cohesive day coasts. Coastal Engineering, 56, 59-72.
Trenhaile, AS. and Porter, N.J. 2007. Can shore plat-forms be produced solely by weathering processes? Marine Geology, 241, 79-92.
Trenhaile, AS. and Kanyaya, J. I. 2007. The role of wave erosion on sloping and horizontal shore platforms in macro- and meso-tidal environments. journal of Coastal Research, 23, 298-309.
Trenhaile, AS., Pepper, D. A, Trenhaile, R. W. and Dalimonte, M. 1998. Stad<s and notches at Hopewell Rocks, New Brunswid<, Canada. Earth Swface Processes and Landforms, 23, 975-986.
Tsujimoto, H. 1987. Dynamic Conditions for Shore Platform Initiation. Sdence Report, Institute of Geoscience, UniversityofTskuba, Section A, 8, 45-93.
Wall<den, M.J.A and Hall, J. W. 2005. A predictive mesoscale model of the erosion and profile develop-ment of soft rock shores. Coastal Engineering, 52, 535-563.
Wall<den, M. and Dickson, M. 2008. Equilibrium ero-sion of soft rod< shores with a shallow or absent beach under increased sea level rise. Marine Geology, 251,75-84.
Wilcod<, P.R., Miller, D. S., Shea, R. H. and Kerkin, R. T. 1998. Frequency of effective wave activity and the recession of coastal bluffs: Calvert Cliffs, Maryland. journal of Coastal Research, 14, 256-258
Young, AP. and Ashford, S.A 2006. Application of airborne LiDAR for seacliff volumetric change and beach-sediment budget contributions. journal of Coastal Research, 22, 307-316.
Zeman, AJ. 1986. Erodibility of Lake Erie tills. Proceedings Symposium on Cohesive Shores, National Research Council of Canada, Ottawa, Canada, 150-169.
Zenkovitch, V. P., 1967. Processes of Coastal Development, Oliver and Boyd, Edinburgh, 738 pp.
Index
aeolian processes, 235 creep, 240 deposition, 256 effects of vegetation, 256, 257, 258 equilibrium sediment
' transport, 251 fetch effect, 252, 253, 255 fluid threshold, 242 impact threshold, 242 instantaneous sediment
transport, 247 intermittent transport, 243 lag effects, 252 modes of sand transport, 240 modes of transport 241 saltation, 240, 241 saltation cascade, 243 sediment transport rate, 247, 250 supply-limited transport, 251 surface moisture, 245
measurement,248 surface water modelling, 245 thresholds, 252
of movement, 242 turbulence, 237 velocity profile, 236,237,238
andtopography,239 wind gusts, 242
amphidrome, 36 amphidrornic point, 36, 37
backshore, see beach backshore barrier dynamics, 314
ebb tidal delta, 299, 300 flood tidal delta, 301 overwash,287,288,289,295
controls, 288 fans, 288 healing,290,293,295 regimes, 287
sea level rise, 316, 317 sediment budget, 314 tidal inlets, 293
formation, 301 morphology, 296 stability, 303
tidal prism, 294, 295 measurement,303
barriermorphodynamics307
barrier systems, 285 lagoons, 305, 306
barriers barrier island formation, 312,
313,314 barrier islands, 284, 312 baymouth barriers, 282 classfication, 281 cuspate forelands, 282 definition,280 dune recurves, 309 management,317,318,319 morphology, 301 spits, 282
evolution, 309, 311 morphodynamics,307 platform, 307, 309
tombolos, 282 beach, 13, 183, 185
barred, 145 berm,217,219,219 cobble beach, 191 cusps,219,220,222 drift aligned, 199 giant cusps, 219 headland-bay, 199 log spiral, 200 plan view, 199, 202 planar, 145 profile, 184
measurement, 185, 188 slope, 190
sediments, 189, 190 swash aligned, 199 water table, 217, 219 beach morphodynamics, 215, 216 bar welding, 219 fairweather profile, 217 storm profile, 217
beach planform, 199 beach sediment budget, see littoral
sediment budget bedforms, 142,144
facies, 145, 146 flow regime, 142 lunate megaripples, 143, 145, 148 plane bed, 148 ripples, 143, 148 surface roughness, 148
berm, see beach berm blowouts, see coastal dunes blowouts bluff, see cliffed coast boundary layer, 140, 141
aeolian,236 unidirectional flow, 140 wave, 141
cliff toe, 398
diffed coast 399 classification, 398 cohesive bluff, see cohesive bluff
coast erosion, 400, 401, 403 erosion model, 402, 405, 407 erosion processes, 401, 402, 403 evolution of hard rock cliffs, 427 mechanical strength, 405
measurement, 406 modelling 403 morphology,396,397,398 recession rate, 406, 408 rock strength, 424 soft rock, 424 soft rock erosion processes, 426 vertical lowering, 408
diffed coast management, 430 modelling sea level rise, 433, 434 response to sea level rise, 432 setbacks, 430, 431 shore protection, 431, 432 slope stability, 431
coastal classification, 10, 13, 14, 15 coastal systems, 11 coastal dune management, 268
ecological approach, 270, 271 engineered approach, 272, 273 setbacks, 271, 272
coastal dunes, 229, 232 beach/dune interaction, 258, 259,
260,263,265 blowouts, 265, 266 classification, 229 climate change, 269 cosine effect 253 dunefields, 230, 268 embryo dune, 229 foredune, 229, 234