Embed Size (px)
Citation preview
ClientSide Debugging Tools
FiddlerFirebugInternet Explorer 8Visual Studio 2008Web Developer ToolbarOther Browsers
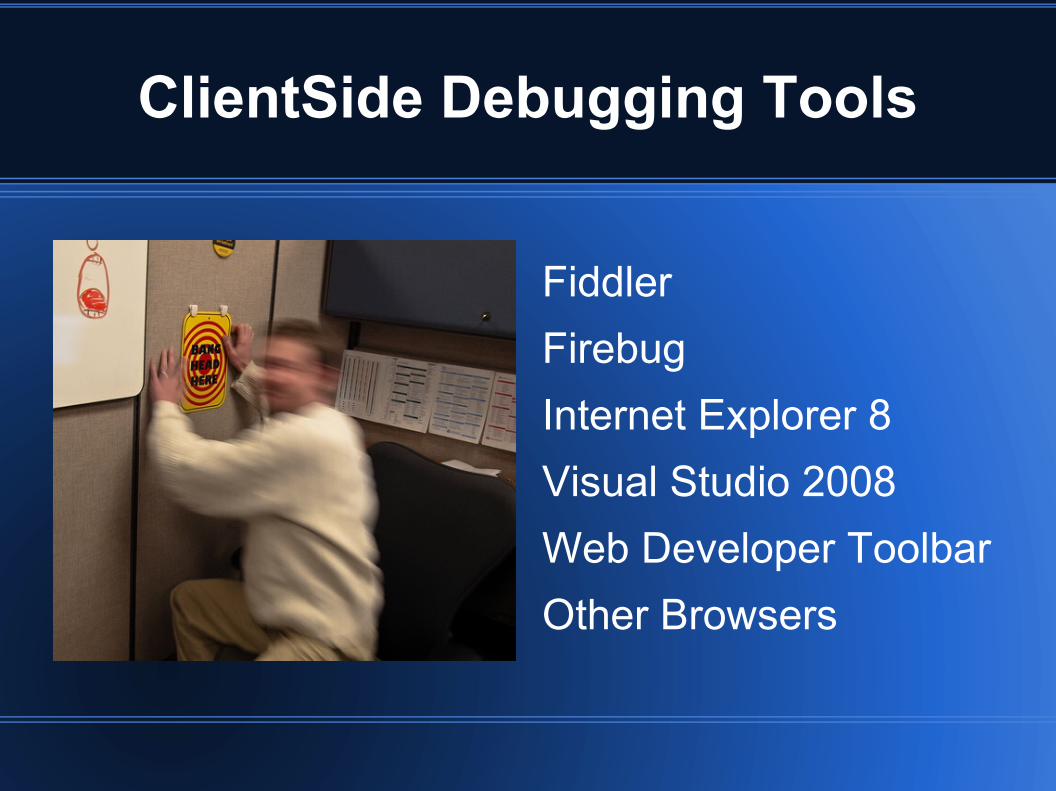
Browser Wars19911992199319941995
1996
19971998199920002001200220032004
2005
2006
200720082009
WorldWideWebViolaWWW, Erwise, MidasWWW, MacWWWMosaic, Cello, Lynx 2.0, Arena, AMosaic 1.0IBM Web Explorer, Netscape Navigator, SlipKnot 1.0, MacWeb, IBrowse, Argo, MinuetInternet Explorer, Netscape Navigator 2.0, OmniWeb, WebRouser[2], Internet Explorer 2, GrailArachne 1.0, Internet Explorer 3.0, Netscape Navigator 3.0, Opera 2.0,PowerBrowser 1.5[3], Cyberdog, Amaya 0.9[4], AWeb, VoyagerInternet Explorer 4.0, Netscape Navigator 4.0, Netscape Communicator 4.0, Opera 3.0[5], Amaya 1.0[4]Internet Explorer 5.0 Beta 1, iCab, MozillaAmaya 2.0[4], Mozilla M3, Internet Explorer 5.0Konqueror, Netscape 6, Opera 4[6], Opera 5[7], K-Meleon 0.2, Amaya 3.0[4], Amaya 4.0[4]Internet Explorer 6, Galeon 1.0, Opera 6[8], Amaya 5.0[4]Netscape 7, Mozilla 1.0, Phoenix 0.1, Links 2.0, Amaya 6.0[4], Amaya 7.0[4]Opera 7[9], Safari 1.0, Epiphany 1.0, Amaya 8.0[4]Firefox 1.0, Netscape Browser, OmniWeb 5.0Safari 2.0, Netscape Browser 8.0, Opera 8.[10], Epiphany1.8, Amaya 9.0[4], AOL Explorer1.0, Maxthon 1.0, Shiira 1.0SeaMonkey 1.0, K-Meleon 1.0, Galeon 2.0, Camino 1.0, Firefox 2.0, Avant 11, iCab 3, Opera 9[11], Internet Explorer 7, SputnikMaxthon 2.0, Netscape Navigator 9, NetSurf 1.0, Flock 1.0, Safari 3.0, ConkerorKonqueror 4, Safari 3.1, Opera 9.5[12], Firefox 3, Amaya 10.0[4], Flock 2, Google Chrome 1, Amaya 11.0[4]Internet Explorer 8, Chrome 2, Safari 4, Opera 10, Flock 2.5, Google Chrome 3, SeaMonkey 2
http://en.wikipedia.org/wiki/List_of_web_browsers

Debugging ClientSide Issues Can Be Frightening
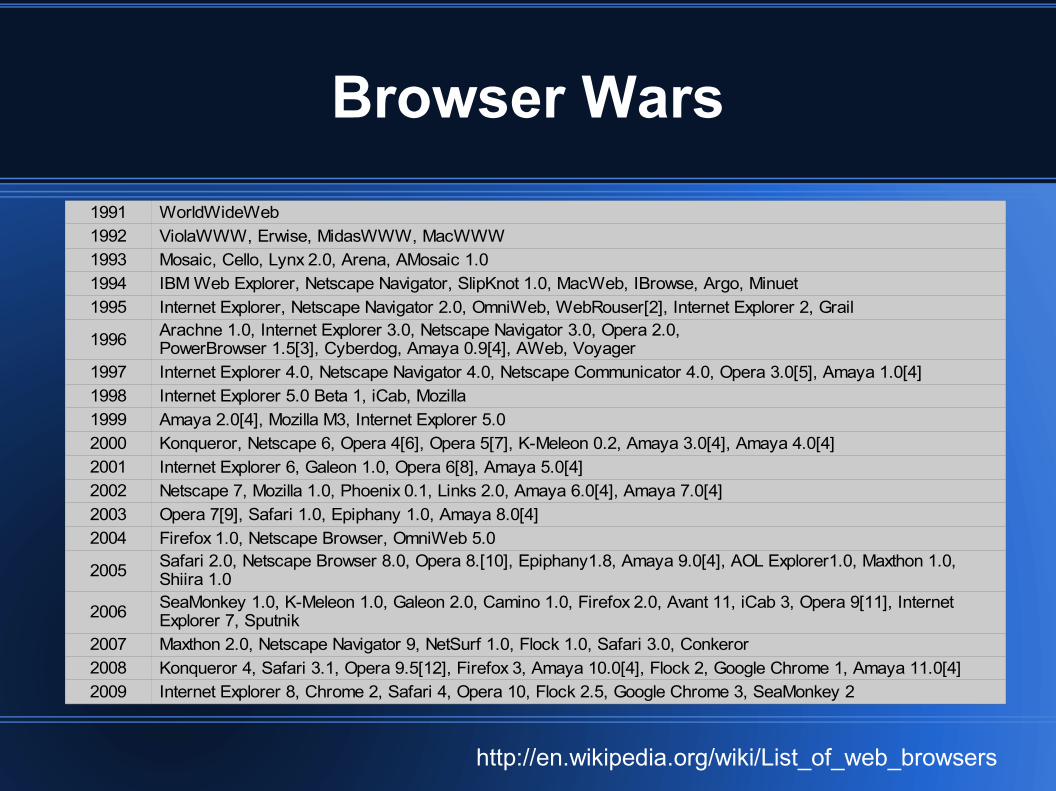
Main Browsers
● IE 6, 7, 8● Firefox 2+ ● Opera 9+● Safari 2+● Chrome● Mobile Browsers

ClientSide Debugging Tools
FiddlerFirebugInternet Explorer 8Visual Studio 2008Web Developer ToolbarOther Browsers

Web Developer Toolbar
● Used with IE6 & 7*● Limited HTML and CSS Debugging● No JavaScript Debugging● Download from MS: http://tinyurl.com/eric-wdt
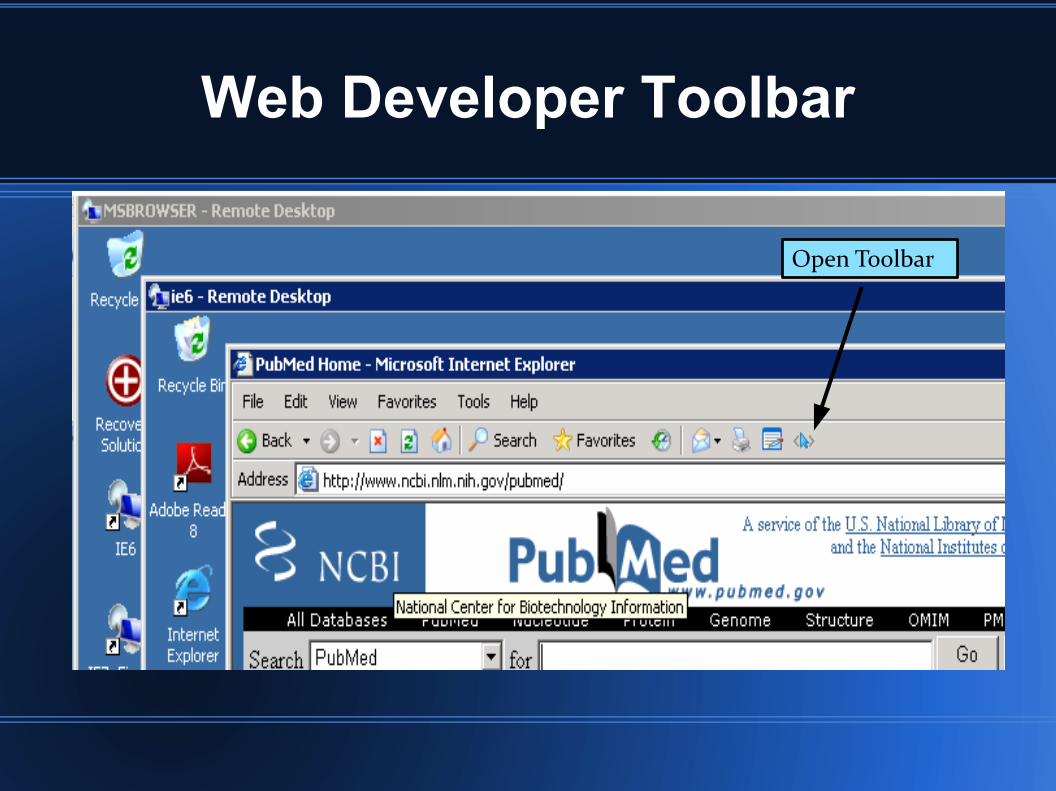
Web Developer Toolbar
Open Toolbar
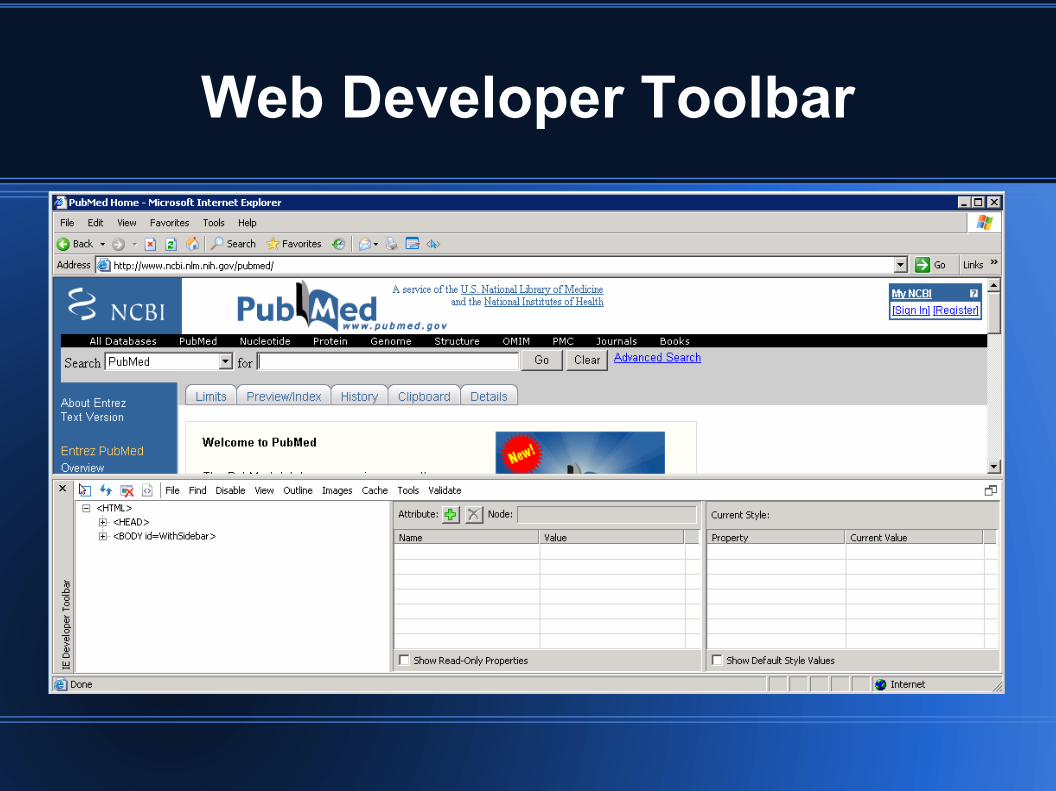
Web Developer Toolbar
Web Developer Toolbar
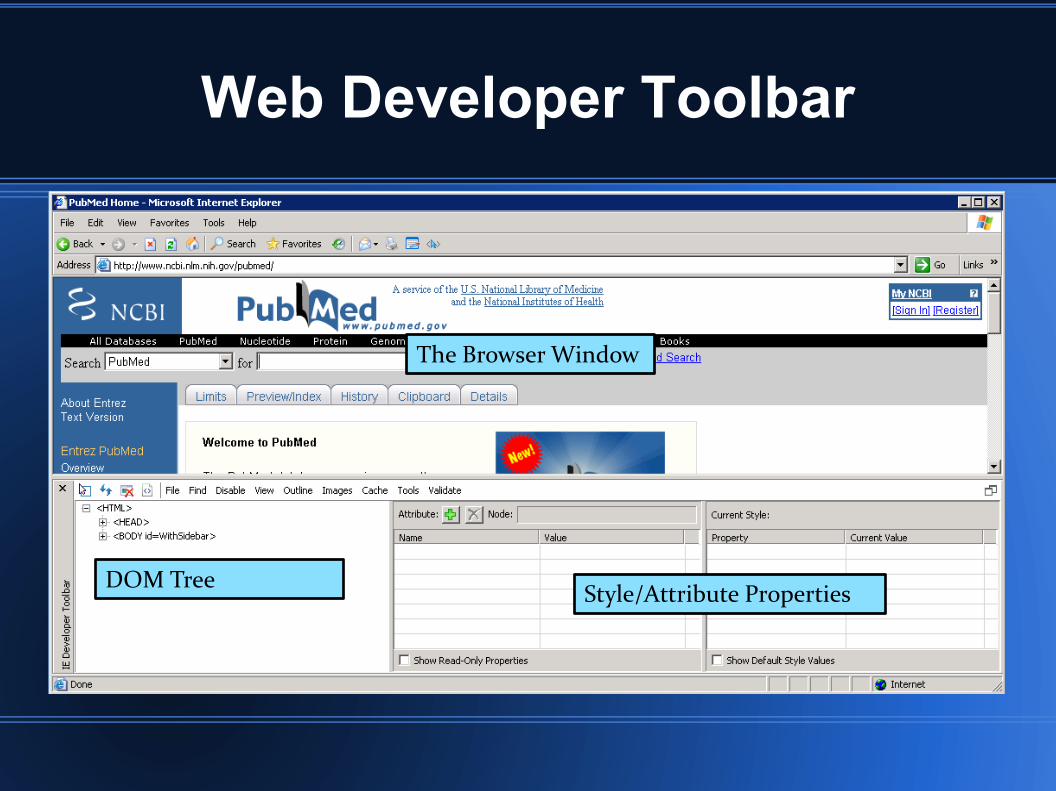
The Browser Window
DOM Tree Style/Attribute Properties
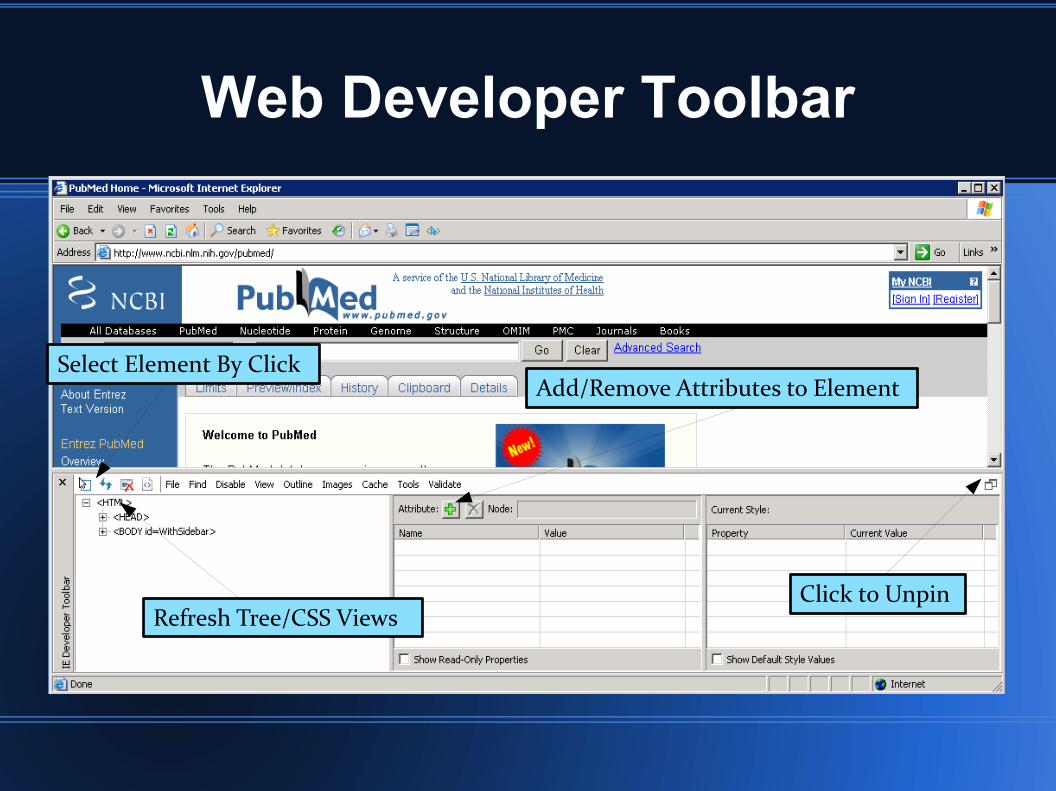
Web Developer Toolbar
Select Element By ClickAdd/Remove Attributes to Element
Click to UnpinRefresh Tree/CSS Views

Enough with the slides!
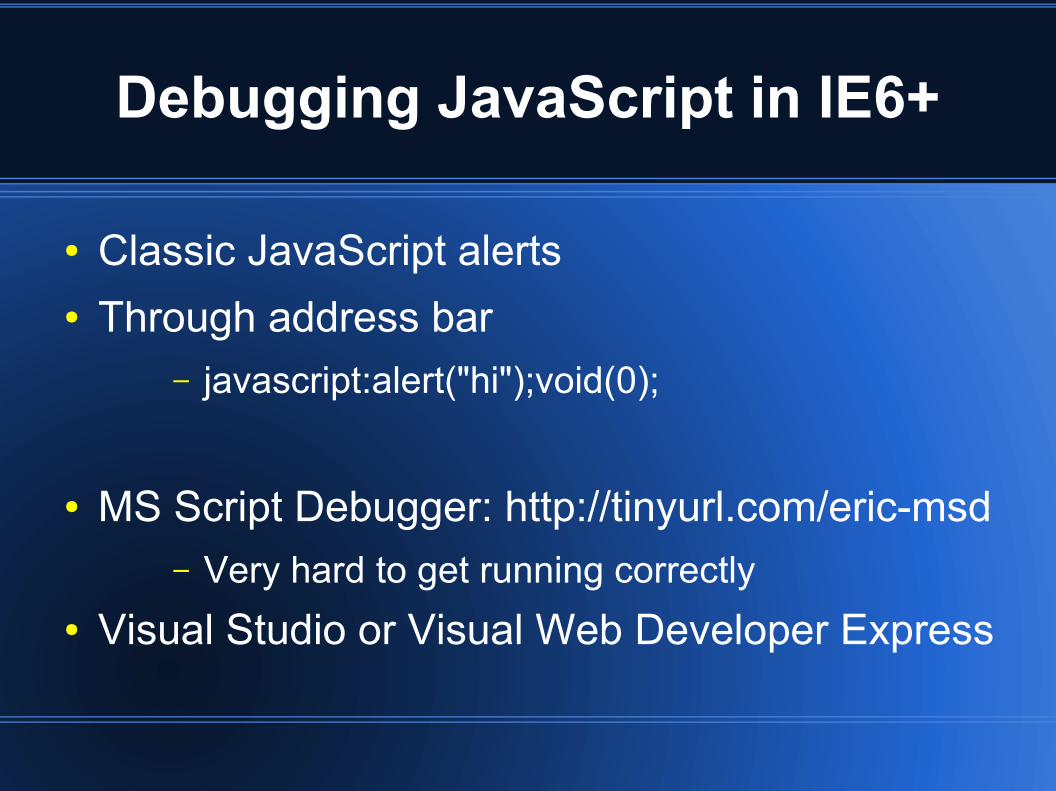
Debugging JavaScript in IE6+
● Classic JavaScript alerts● Through address bar
– javascript:alert("hi");void(0);
● MS Script Debugger: http://tinyurl.com/eric-msd– Very hard to get running correctly
● Visual Studio or Visual Web Developer Express
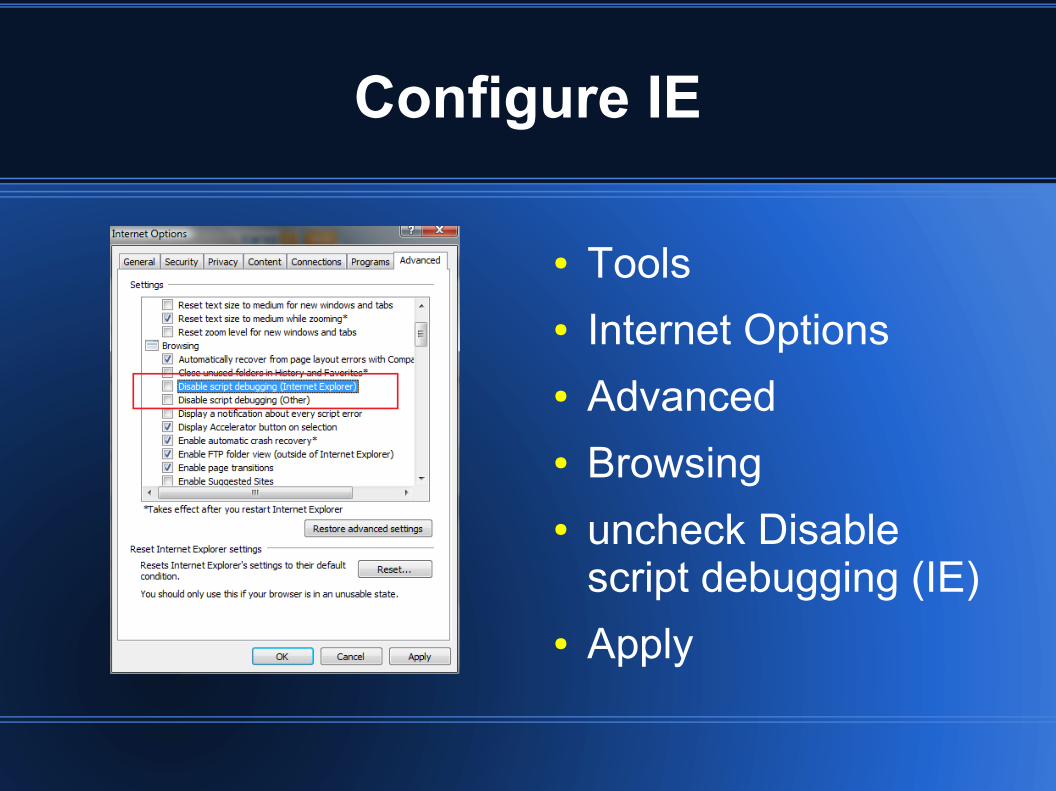
Configure IE
● Tools● Internet Options● Advanced● Browsing● uncheck Disable
script debugging (IE)● Apply
Force debugging
● Add debugger; into the script file where you want it to break
● You can have multiple debugger statements in the file

What can we do in VS?
● Stepping through your code● Watching variables● Inspecting variables

Enough with the slides!

Magic of F12 in IE8!
The Wonderful World of IE8
● IE8 Gives us the ability to debug HTML, JavaScript, and CSS without a plug-in!
● Developer Toolbar is built in!● Allows us to run as IE7, means one browser
install = 2 browsers...or does it?
The Wonderful World of IE8
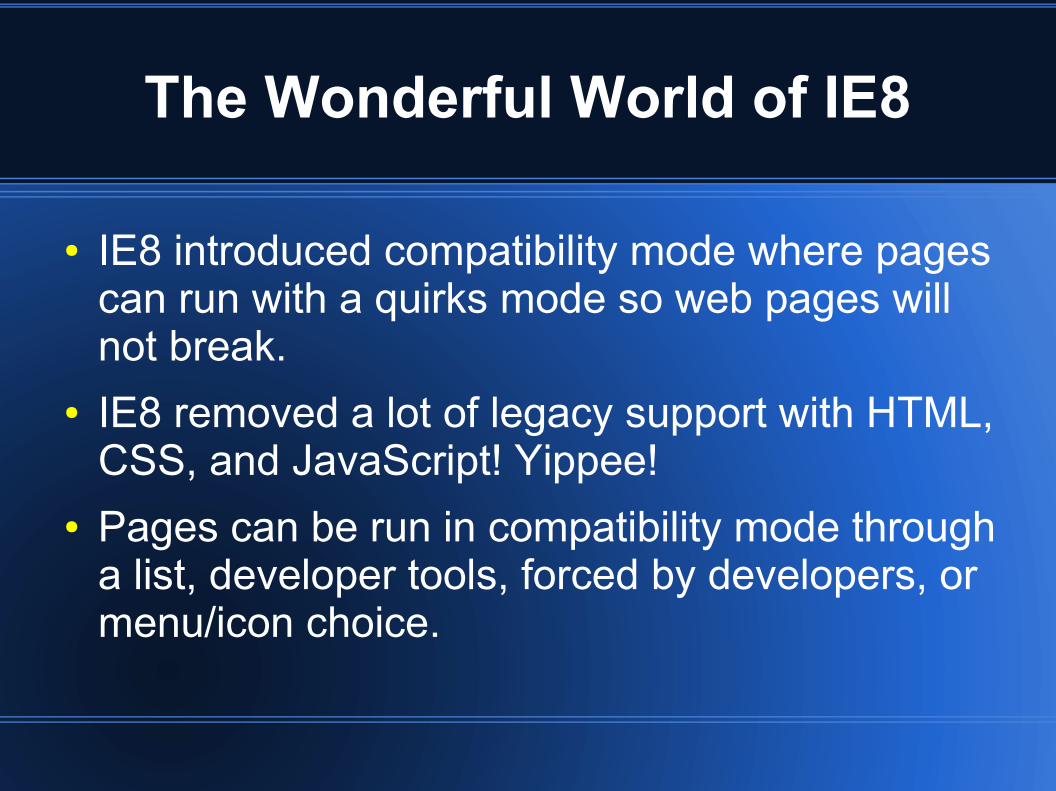
● IE8 introduced compatibility mode where pages can run with a quirks mode so web pages will not break.
● IE8 removed a lot of legacy support with HTML, CSS, and JavaScript! Yippee!
● Pages can be run in compatibility mode through a list, developer tools, forced by developers, or menu/icon choice.
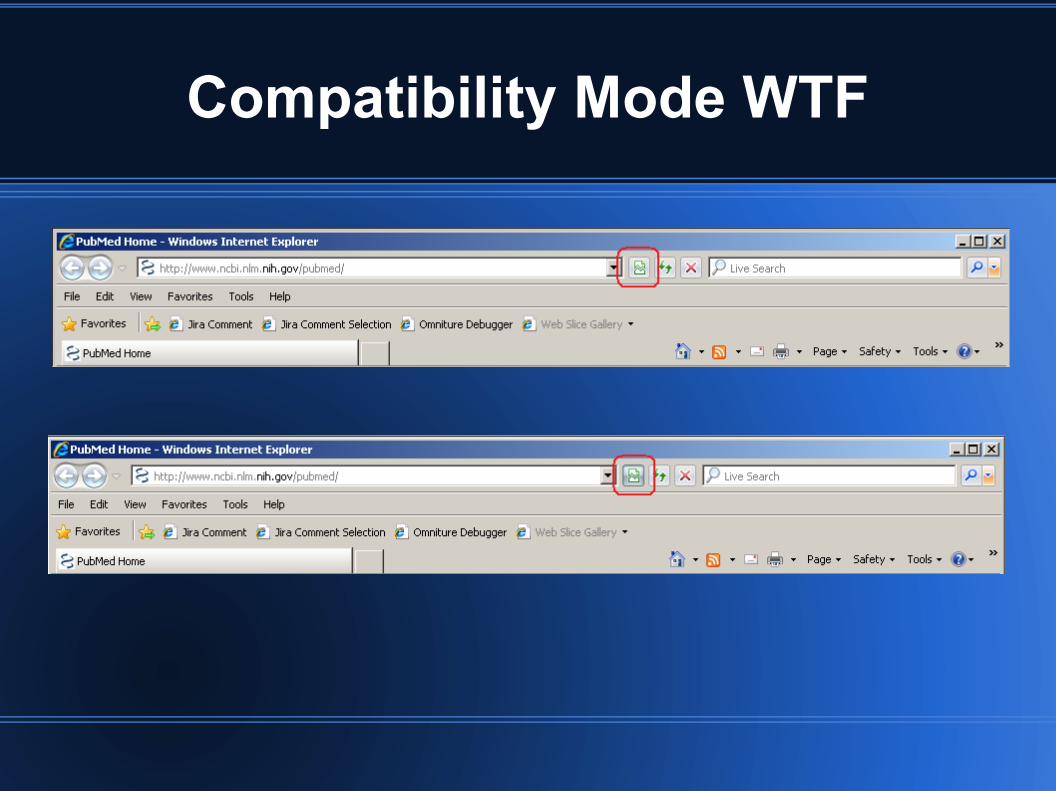
Compatibility Mode WTF
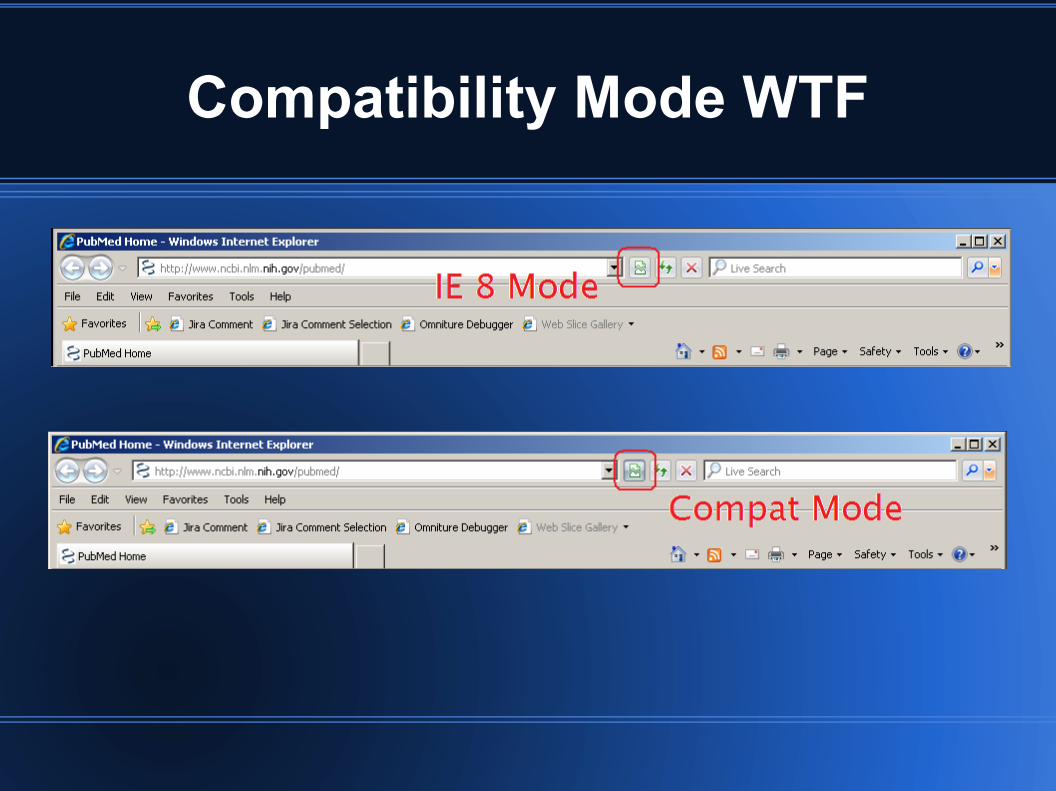
Compatibility Mode WTF
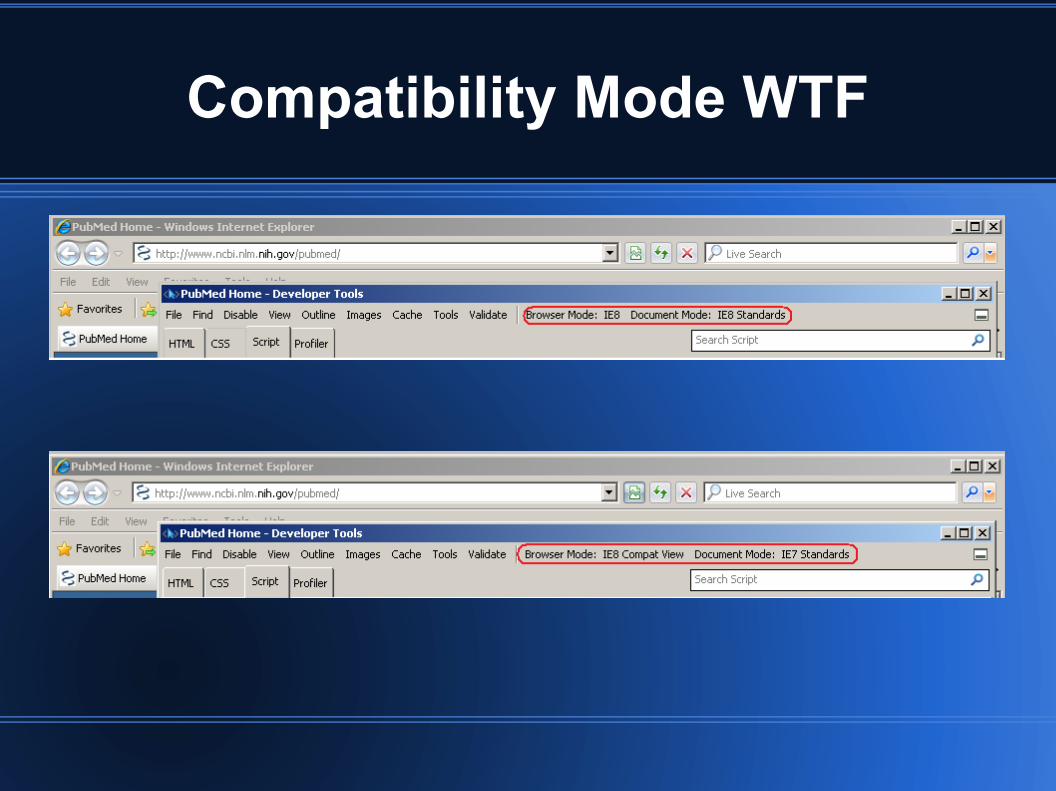
Compatibility Mode WTF
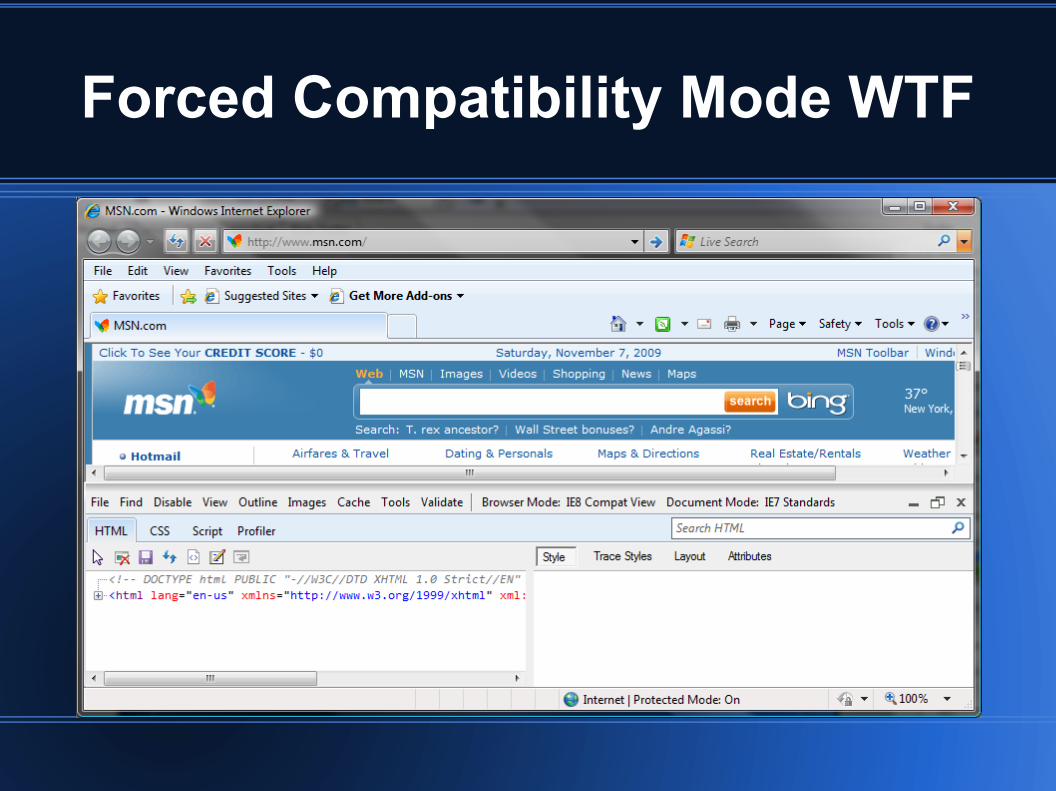
Forced Compatibility Mode WTF
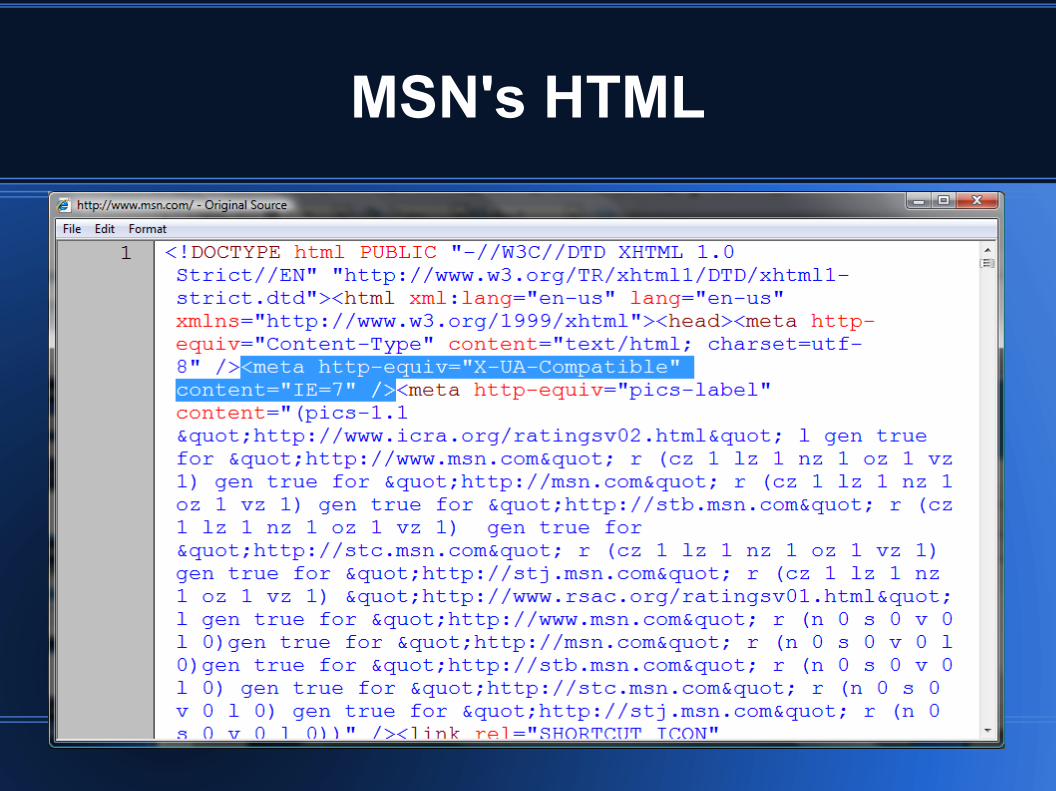
MSN's HTML
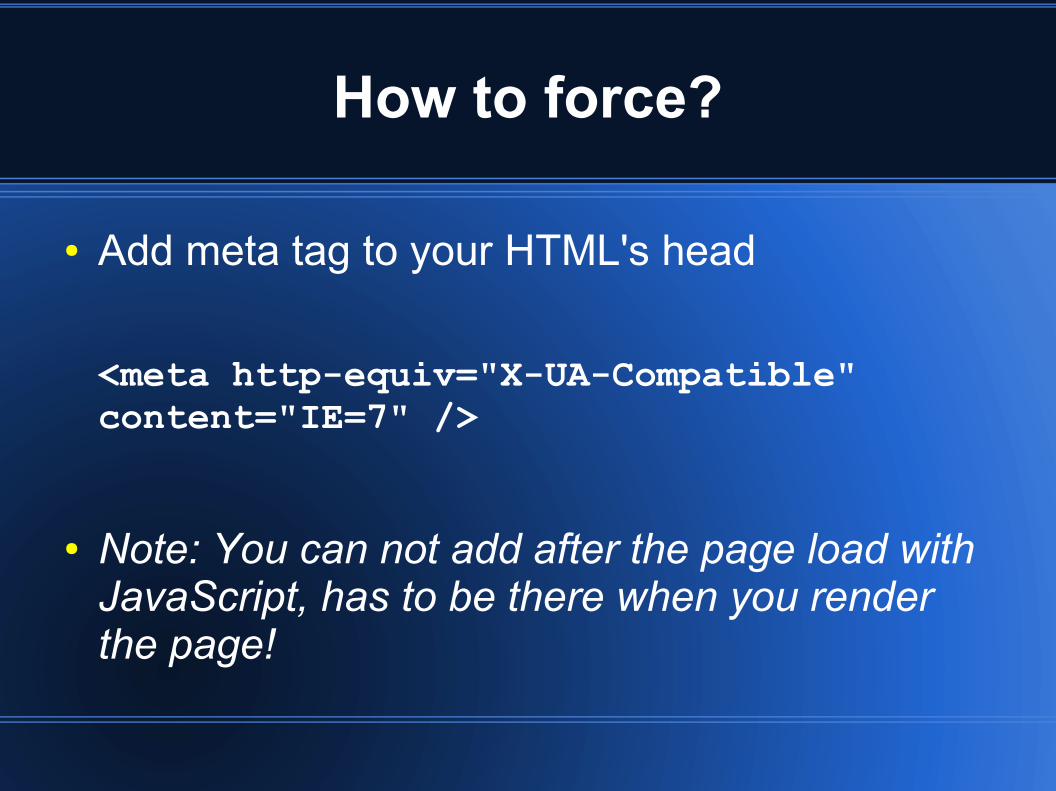
How to force?
● Add meta tag to your HTML's head
<meta http-equiv="X-UA-Compatible" content="IE=7" />
● Note: You can not add after the page load with JavaScript, has to be there when you render the page!
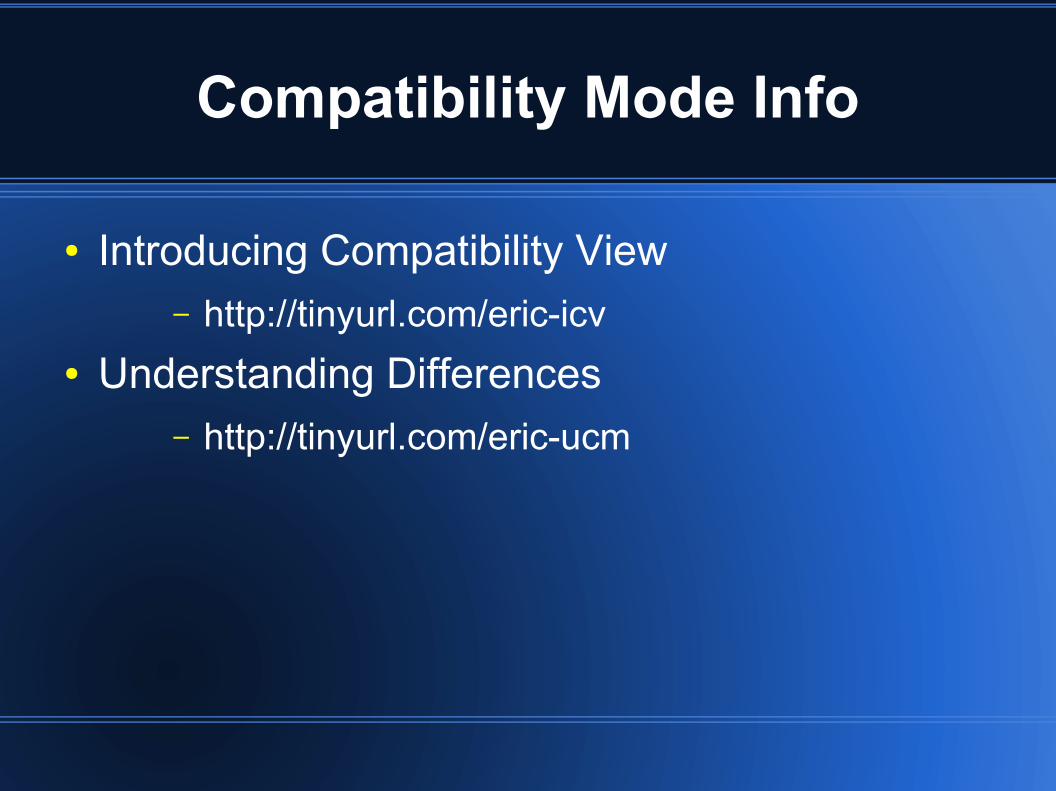
Compatibility Mode Info
● Introducing Compatibility View– http://tinyurl.com/eric-icv
● Understanding Differences– http://tinyurl.com/eric-ucm
Enough with the slides!
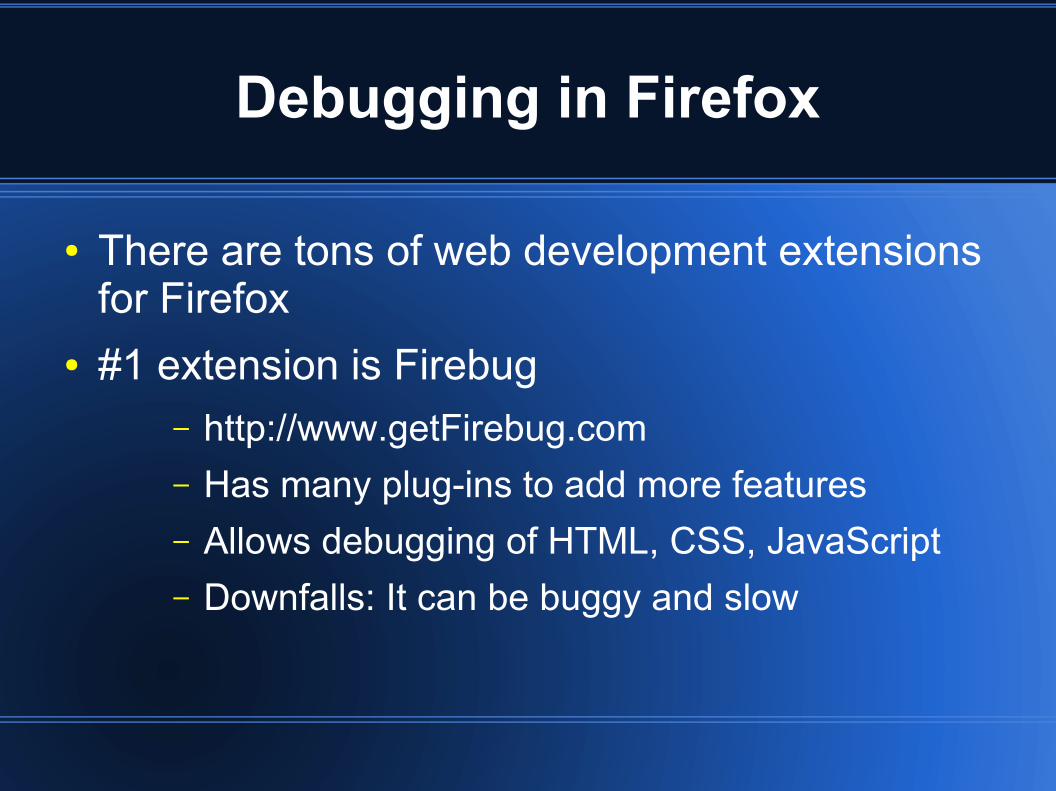
Debugging in Firefox
● There are tons of web development extensions for Firefox
● #1 extension is Firebug– http://www.getFirebug.com– Has many plug-ins to add more features– Allows debugging of HTML, CSS, JavaScript– Downfalls: It can be buggy and slow

Enough with the slides!
What about debugging Production Code?
Fiddler
● Fiddler is a Web Debugging Proxy which logs all HTTP(S) traffic between your computer and the Internet. Fiddler allows you to inspect all HTTP(S) traffic, set breakpoints, and "fiddle" with incoming or outgoing data. Fiddler includes a powerful event-based scripting subsystem, and can be extended using any .NET language.
● Fiddler is freeware and can debug traffic from virtually any application, including Internet Explorer, Mozilla Firefox, Opera, and thousands more.
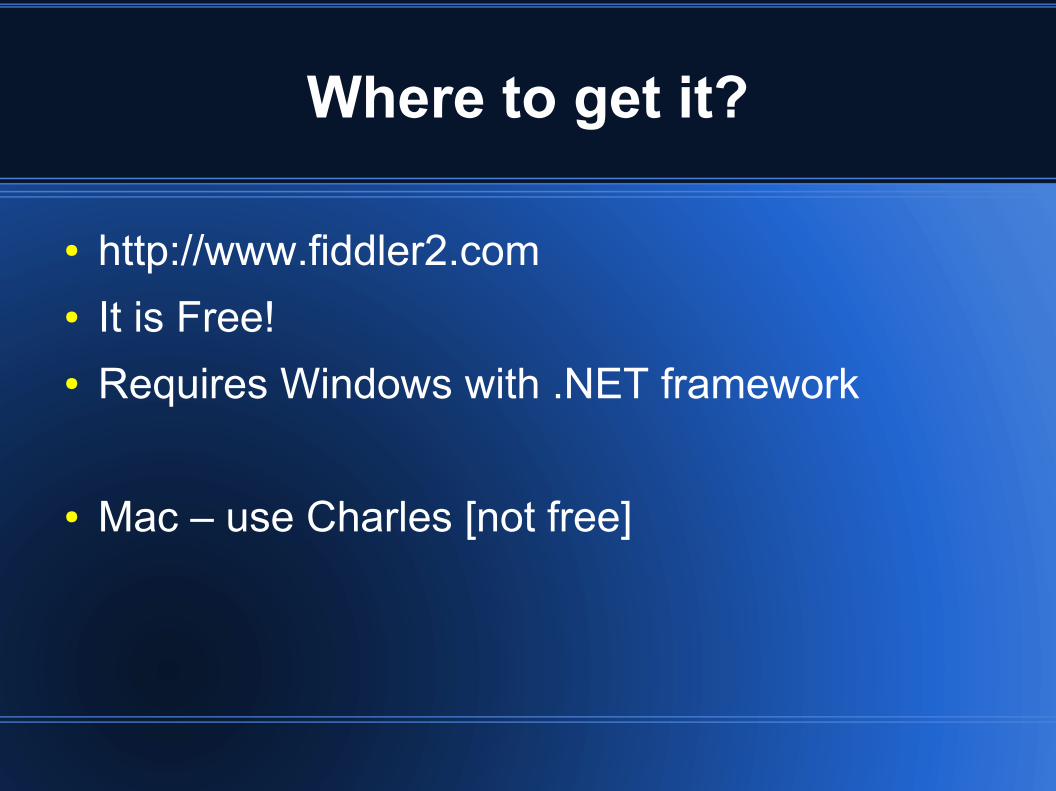
Where to get it?
● http://www.fiddler2.com● It is Free!● Requires Windows with .NET framework
● Mac – use Charles [not free]
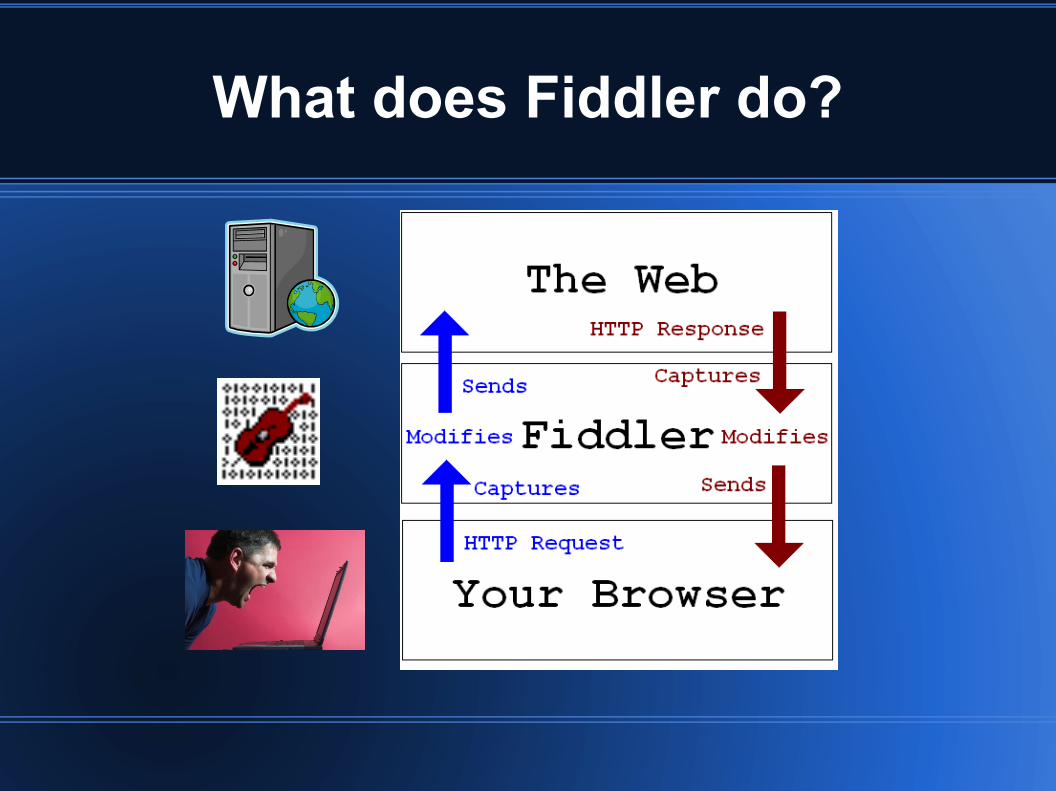
What does Fiddler do?
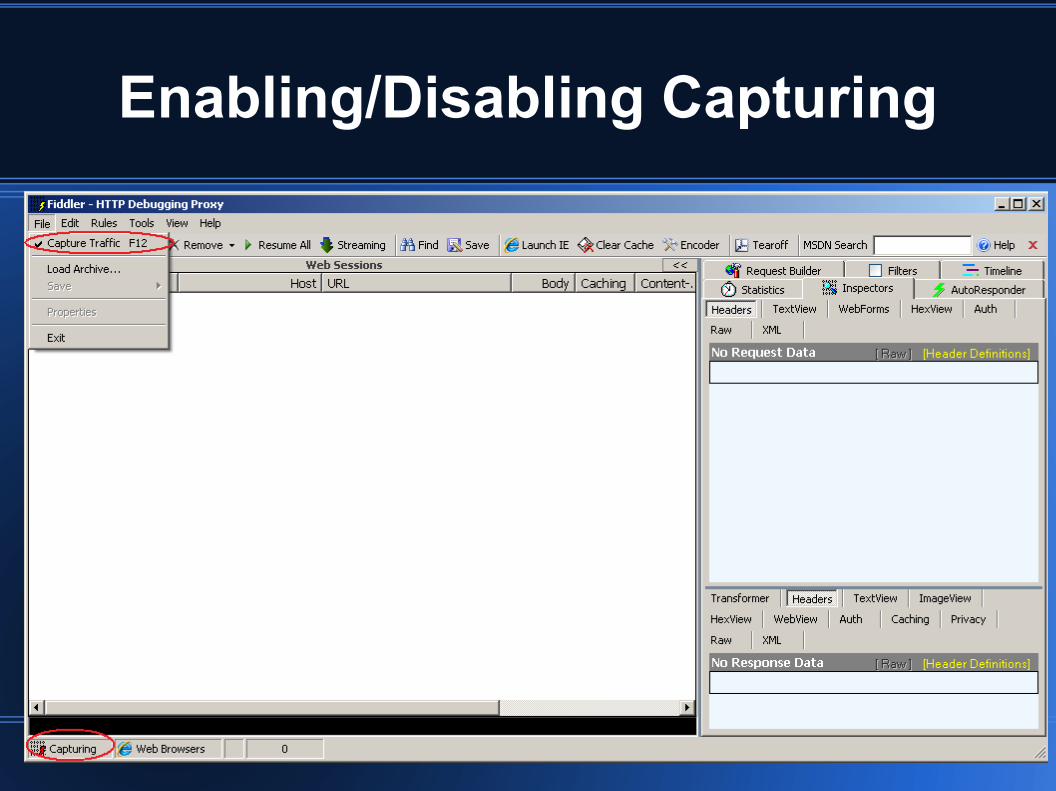
Enabling/Disabling Capturing
Setting up Internet Explorer
● There is nothing you need to do if IE is set up to automatically detect proxies
● [Chrome same way]
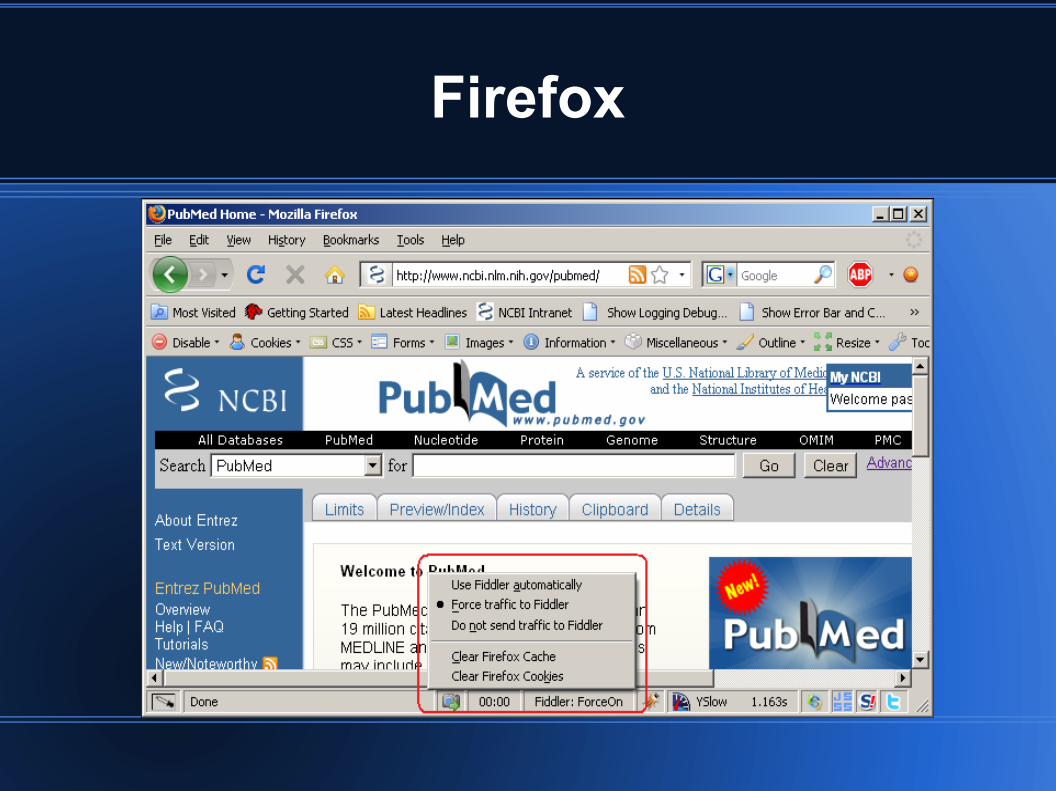
Firefox

Enough with the slides!
We see the calls, now what?

Auto Responders
● Auto Responders intercept HTTP calls● They can server up a different file ● Possible to block files

What does Fiddler do?
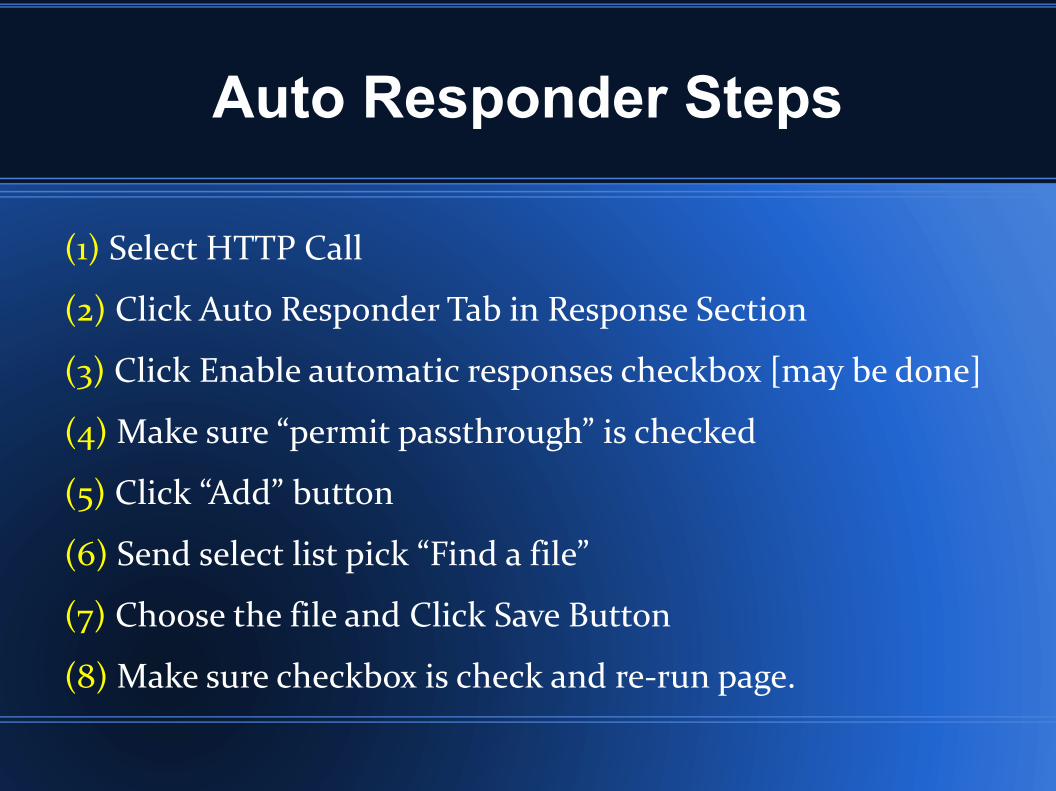
Auto Responder Steps
(1) Select HTTP Call
(2) Click Auto Responder Tab in Response Section
(3) Click Enable automatic responses checkbox [may be done]
(4) Make sure “permit passthrough” is checked
(5) Click “Add” button
(6) Send select list pick “Find a file”
(7) Choose the file and Click Save Button
(8) Make sure checkbox is check and re-run page.

Enough with the slides!
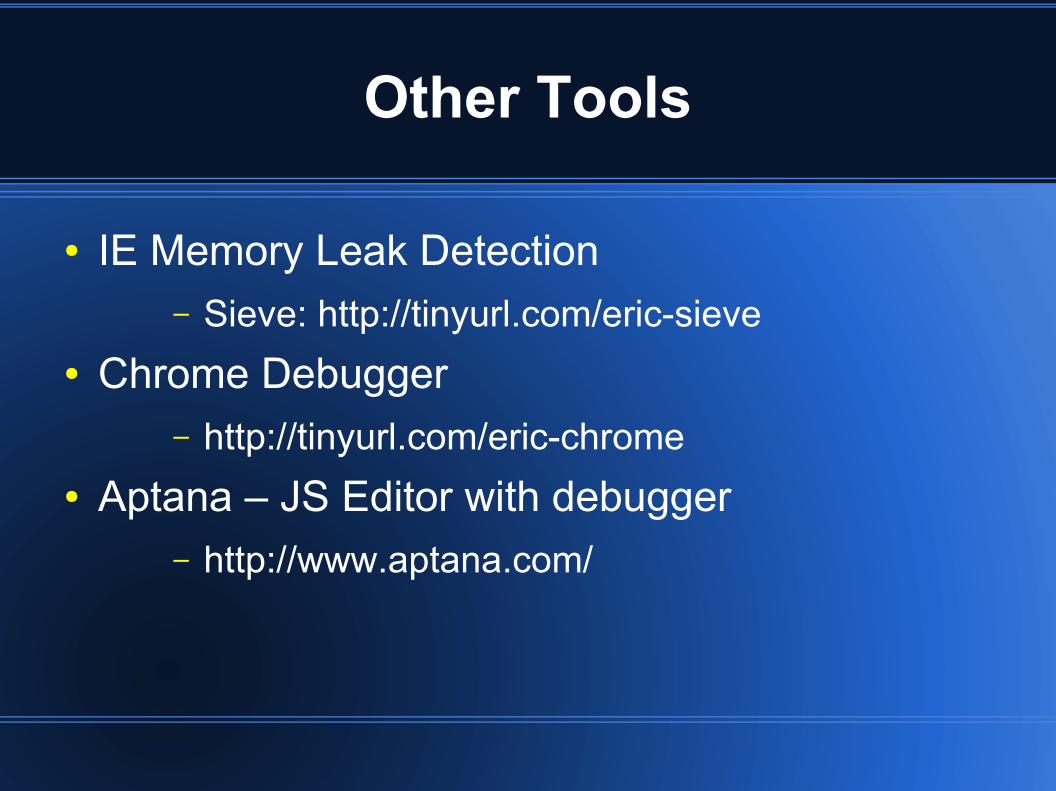
Other Tools
● IE Memory Leak Detection– Sieve: http://tinyurl.com/eric-sieve
● Chrome Debugger– http://tinyurl.com/eric-chrome
● Aptana – JS Editor with debugger– http://www.aptana.com/
Questions?
Thanks to my personal photographer Eddie “Monkey” Welker


![ClientSide Debugging Tools - Eric · PDF fileBrowser Wars 1991 1992 1993 1994 1995 1996 1997 1998 1999 ... Netscape Browser 8.0, Opera 8.[10], ... ClientSide Debugging Tools Fiddler](https://img.pdfslide.us/doc/110x75/5a8147337f8b9ada388cf232/clientside-debugging-tools-eric-browser-wars-1991-1992-1993-1994-1995-1996-1997.jpg)