Embed Size (px)
DESCRIPTION
book
Citation preview
The Visuals: PI ProcessBook, PI DataLink, and RtWebParts
Version 5.0
The Visuals: PI ProcessBook, PI DataLink, and RtWebParts
All rights reserved. No part of this publication may be reproduced, stored in a retrieval
system, or transmitted, in any form or by any means, mechanical, photocopying, recording, or otherwise, without the prior written permission of OSIsoft, Inc.
© Copyright 1995-2009 OSIsoft, LLC, 777 Davis St., Suite 250, San Leandro, CA 94577
Page ii
How to contact us:
OSIsoft, Inc.
777 Davis St., Suite 250
San Leandro, CA 94577 USA
(01) 510-297-5800 (main phone)
(01) 510-357-8136 (fax)
(01) 510-297-5828 (support phone)
http://techsupport.osisoft.com
Houston, TX
Johnson City, TN
Longview, TX
Mayfield Heights, OH
Philadelphia, PA
Phoenix, AZ
Savannah, GA
Seattle, WA
Yardley, PA
OSIsoft Australia
Perth, Australia
Auckland, New Zealand
OSI Software GmbH
Altenstadt, Germany
OSI Software Asia Pte Ltd.
Singapore
OSIsoft Canada ULC
Montreal, Canada
Calgary, Canada
OSIsoft, Inc. Representative Office
Shanghai, People‟s Republic of China
OSIsoft Japan KK
Tokyo, Japan
OSIsoft Mexico S. De R.L. De C.V.
Mexico City, Mexico
OSIsoft do Brasil Sistemas Ltda.
Sao Paulo, Brazil
Sales Outlets/Distributors
Middle East/North Africa
Republic of South Africa
Russia/Central Asia
South America/Caribbean
Southeast Asia
South Korea Taiwan
www.osisoft.com OSIsoft, Inc. is the owner of the following trademarks and registered trademarks: PI System, PI
ProcessBook, Sequencia, Sigmafine, gRecipe, sRecipe, and RLINK. All terms mentioned in this book
that are known to be trademarks or service marks have been appropriately capitalized. Any trademark that
appears in this book that is not owned by OSIsoft, Inc. is the property of its owner and use herein in no
way indicates an endorsement, recommendation, or warranty of such party's products or any affiliation
with such party of any kind.
RESTRICTED RIGHTS LEGEND
Use, duplication, or disclosure by the Government is subject to restrictions as set forth in subparagraph
(c)(1)(ii) of the Rights in Technical Data and Computer Software clause at DFARS 252.227-7013
1994-2009 OSIsoft, LLC. All rights reserved
The Visuals: PI ProcessBook, PI DataLink, and RtWebParts
All rights reserved. No part of this publication may be reproduced, stored in a retrieval
system, or transmitted, in any form or by any means, mechanical, photocopying, recording, or otherwise, without the prior written permission of OSIsoft, Inc.
© Copyright 1995-2009 OSIsoft, LLC, 777 Davis St., Suite 250, San Leandro, CA 94577
Page iii
Conventions
The following conventions are used throughout this book.
Bulleted List
Item 1
Item 2
Item 3
This represents different ideas on a topic.
Numbered lists
1. Item1
2. Item 2
3. Item 3
This represents a list of steps with a specific order to respect.
A bold font is to emphasize user interface element names, including names of buttons, dialog boxes, and
menu items; it also highlights processes, utilities, system components and modules.
A Consolas font is used for code or computer input by the user or output to the display, also for
filenames and path names and formulas.
A Consolas font with a border like the figure below represents a block of code.
' Variables / Objects.
Dim myvar as string
Myvar = …
A Consolas font with a border like the figure below represents a block of SQL query.
SELECT … FROM TABLE WHERE …
An italic font is used as placeholders for variables or information unknown that will be determined by
you, the reader.
An underlined blue font is used to report URL.
The content you will retrieve in this rectangle is important and requires your attention.
This image represents:
A group recap question to verify understanding of the
material;
A directed exercise (green);
A self-paced exercise (blue).
The Visuals: PI ProcessBook, PI DataLink, and RtWebParts
All rights reserved. No part of this publication may be reproduced, stored in a retrieval
system, or transmitted, in any form or by any means, mechanical, photocopying, recording, or otherwise, without the prior written permission of OSIsoft, Inc.
© Copyright 1995-2009 OSIsoft, LLC, 777 Davis St., Suite 250, San Leandro, CA 94577
Page iv
Table of Contents
1. Introduction to the PI System ................................................................................. 1
1.1 PI Tags ............................................................................................................ 2
1.1.1 What Types of Data Can PI Store? (Point Types) ........................... 2
1.1.2 Common Tag Attributes .................................................................... 3
1.2 About PI Interface Nodes .............................................................................. 3
1.3 Why Does My Data Appear to Have “Holes”? ............................................. 3
1.4 Data Flow ....................................................................................................... 4
1.4.1 Exception Reporting .......................................................................... 4
1.4.2 Directed Exercise – Exception Testing ........................................... 6
1.4.3 Compression Testing ........................................................................ 7
1.4.4 Default Values for Exception and Compression ............................ 9
1.5 About the PI Server ........................................................................................ 9
1.6 Time and PI ................................................................................................... 11
1.6.1 Directed Exercise – PI Times .......................................................... 13
1.6.2 Group Recap Question.................................................................... 13
2. Common PI Dialog Windows and Concepts ....................................................... 15
2.1 PI Connection Manager ............................................................................... 15
2.1.1 Directed Exercise – Connect to a PI Server .................................. 16
2.2 Basic Tag Search ......................................................................................... 16
2.2.1 Directed Exercise – Tag Search ..................................................... 18
2.3 Advanced Search ......................................................................................... 18
2.4 Alias Search .................................................................................................. 19
2.5 Point Attributes and Point Values .............................................................. 20
2.5.1 Group Recap Question.................................................................... 21
2.6 Performance Equation Syntax .................................................................... 21
2.6.1 Conversion Factor and Totalizations ............................................ 22
3. PI ProcessBook Basics ......................................................................................... 24
3.1 PI ProcessBook Display .............................................................................. 24
3.1.1 Navigating within a ProcessBook Display .................................... 25
3.1.2 Navigating within a ProcessBook Trend ....................................... 28
3.1.3 Exercise – PI ProcessBook Basics ................................................ 29
3.2 Building a PI ProcessBook Independent Display with Static Elements. 36
3.2.1 Group Recap Questions.................................................................. 36
3.2.2 Exercise – Inserting Static Elements into Displays ..................... 37
4. PI DataLink Basics................................................................................................. 41
The Visuals: PI ProcessBook, PI DataLink, and RtWebParts
All rights reserved. No part of this publication may be reproduced, stored in a retrieval
system, or transmitted, in any form or by any means, mechanical, photocopying, recording, or otherwise, without the prior written permission of OSIsoft, Inc.
© Copyright 1995-2009 OSIsoft, LLC, 777 Davis St., Suite 250, San Leandro, CA 94577
Page v
4.1 DataLink Navigation .................................................................................... 41
4.1.1 Directed Exercise – PI and Excel Times ........................................ 44
4.2 Simple DataLink Queries ............................................................................. 45
4.2.1 Current Value ................................................................................... 45
4.2.2 Archive Value ................................................................................... 45
4.2.3 Retrieval Mode ................................................................................. 46
4.2.4 Tag Attributes .................................................................................. 47
4.2.5 Exercise – Activity Report .............................................................. 47
4.3 Multiple Value DataLink Queries ................................................................ 51
4.3.1 Compressed Data ............................................................................ 52
4.3.2 Sampled Data ................................................................................... 54
4.3.3 Timed Data ....................................................................................... 54
4.4 Arrays in PI DataLink ................................................................................... 54
4.4.1 Group Recap Questions.................................................................. 55
4.4.2 Exercise – Operational Start Up ..................................................... 55
5. RtWebParts Basics ................................................................................................ 58
5.1 Introduction to RtWebParts ........................................................................ 58
5.2 Web Part Pages ............................................................................................ 58
5.2.1 Directed Exercise – Create a New Team Site ................................ 58
5.2.2 Document Library ............................................................................ 59
5.2.3 Web Part Pages ................................................................................ 59
5.2.4 Exercise – Basic SharePoint .......................................................... 60
5.3 Using and Configuring RtWebParts ........................................................... 65
5.3.1 RtGauge ............................................................................................ 65
5.3.2 Exercise – Configure the RtGauge ................................................ 65
5.3.3 RtValues ........................................................................................... 69
5.3.4 Exercise – Configure RtValues WebPart ....................................... 70
5.3.5 RtTimeSeries .................................................................................... 73
5.3.6 Group Recap Questions.................................................................. 73
5.3.7 Exercise – Configure RtTimeSeries WebPart ............................... 73
6. More PI ProcessBook ............................................................................................ 76
6.1 Dynamic Elements ....................................................................................... 76
6.1.1 Trends ............................................................................................... 76
6.1.2 XY Plots ............................................................................................ 78
6.1.3 Exercise – Building Trends in ProcessBook ................................ 79
6.1.4 Bars, Values, Multi-State Objects and Buttons ............................ 82
6.1.5 Exercise – Inserting Dynamic Elements into Displays ................ 84
The Visuals: PI ProcessBook, PI DataLink, and RtWebParts
All rights reserved. No part of this publication may be reproduced, stored in a retrieval
system, or transmitted, in any form or by any means, mechanical, photocopying, recording, or otherwise, without the prior written permission of OSIsoft, Inc.
© Copyright 1995-2009 OSIsoft, LLC, 777 Davis St., Suite 250, San Leandro, CA 94577
Page vi
6.2 Organizing Displays .................................................................................... 88
6.2.1 Viewing ProcessBook Workbooks ................................................ 89
6.3 Creating a New ProcessBook ..................................................................... 90
6.3.1 How to Create a Text Entry ............................................................. 90
6.3.2 How to Create a Display Entry ....................................................... 91
6.3.3 How to Link an Existing ProcessBook Element ........................... 91
6.3.4 How to Launch External Files, Applications, and Websites ....... 91
6.3.5 Group Recap Questions.................................................................. 92
6.3.6 Exercise – Organize Your Displays ............................................... 92
7. More PI DataLink .................................................................................................... 97
7.1 Inserting a Trend .......................................................................................... 97
7.1.1 Exercise – Tank Level ..................................................................... 98
7.2 Calculated Data .......................................................................................... 100
7.2.1 Exercise – Daily Production ......................................................... 101
7.3 Filtered Data ............................................................................................... 104
7.3.1 Filtered Compressed Data ............................................................ 104
7.3.2 Filtered Sampled Data ................................................................... 104
7.4 Excel Conditional Formatting ................................................................... 105
7.4.1 Exercise – Production Level Report ............................................ 105
7.5 Expression Data ......................................................................................... 110
7.5.1 Exercise – Expression Calculation .............................................. 111
7.5.2 Exercise – Quality Control Report (Optional) ............................. 113
8. More RtWebParts ................................................................................................. 119
8.1 RtTrend ....................................................................................................... 119
8.2 RtTimeRange .............................................................................................. 119
8.2.1 Exercise – Configure and Export RtTrend .................................. 120
8.3 RtGraphic .................................................................................................... 122
8.3.1 SVG ................................................................................................. 122
8.3.2 RtGraphic uses PI ProcessBook SVG files ................................. 122
8.3.3 Exercise – Configure the RtGraphic WebPart ............................ 123
8.4 PI DataLink for Excel Services ................................................................. 125
8.4.1 Introduction to Excel Services ..................................................... 125
8.4.2 Publishing Reports in Excel Services ......................................... 126
8.4.3 Exercise – Configure DataLink for Excel Services .................... 126
9. PI Module Database ............................................................................................. 129
9.1 PI Module Database and PI ProcessBook ............................................... 130
9.1.1 Exercise – Module Relative ProcessBook Displays .................. 131
The Visuals: PI ProcessBook, PI DataLink, and RtWebParts
All rights reserved. No part of this publication may be reproduced, stored in a retrieval
system, or transmitted, in any form or by any means, mechanical, photocopying, recording, or otherwise, without the prior written permission of OSIsoft, Inc.
© Copyright 1995-2009 OSIsoft, LLC, 777 Davis St., Suite 250, San Leandro, CA 94577
Page vii
9.2 PI Module Database and PI DataLink ....................................................... 135
9.2.1 Excel Tricks for Module Relative Reports ................................... 135
9.2.2 Exercise – Module Relative PI DataLink Reports ....................... 136
9.3 PI Module Database and RtWebParts ...................................................... 143
9.3.1 RtTreeView ..................................................................................... 143
9.3.2 Web Part Connections .................................................................. 144
9.3.3 Exercise – Making Connections ................................................... 145
9.3.4 Exercise – Configure the RtTreeView WebPart .......................... 148
10. Advanced PI ProcessBook ................................................................................. 152
10.1 PI Calculations in PI ProcessBook........................................................... 152
10.1.1 Exercise – PI Calculation Data Sets ............................................. 153
11. Advanced Calculations in PI DataLink .............................................................. 159
11.1 Advanced Calculated Data ........................................................................ 159
11.1.1 Directed Exercise – Event and Time Weighted Averages ......... 161
11.2 Time Filtered Data ...................................................................................... 161
11.2.1 Exercise – Operating Time with Time Filtered Data ................... 162
11.3 Other DataLink Functions ......................................................................... 165
11.3.1 Exercise – Advanced Calculated Data (Optional) ...................... 166
12. Advanced RtWebParts ........................................................................................ 169
12.1 RtActiveView .............................................................................................. 169
12.2 Other RtWebParts ...................................................................................... 170
13. Conclusion ........................................................................................................... 171
13.1 Training ....................................................................................................... 171
13.2 vCampus ..................................................................................................... 171
13.3 Tech Support .............................................................................................. 171
13.4 Further Questions ...................................................................................... 172
14. Exercise – Global Recap Question .................................................................... 173

The Visuals: PI ProcessBook, PI DataLink, and RtWebParts
All rights reserved. No part of this publication may be reproduced, stored in a retrieval
system, or transmitted, in any form or by any means, mechanical, photocopying, recording, or otherwise, without the prior written permission of OSIsoft, Inc.
© Copyright 1995-2009 OSIsoft, LLC, 777 Davis St., Suite 250, San Leandro, CA 94577
Page 1
1. Introduction to the PI System
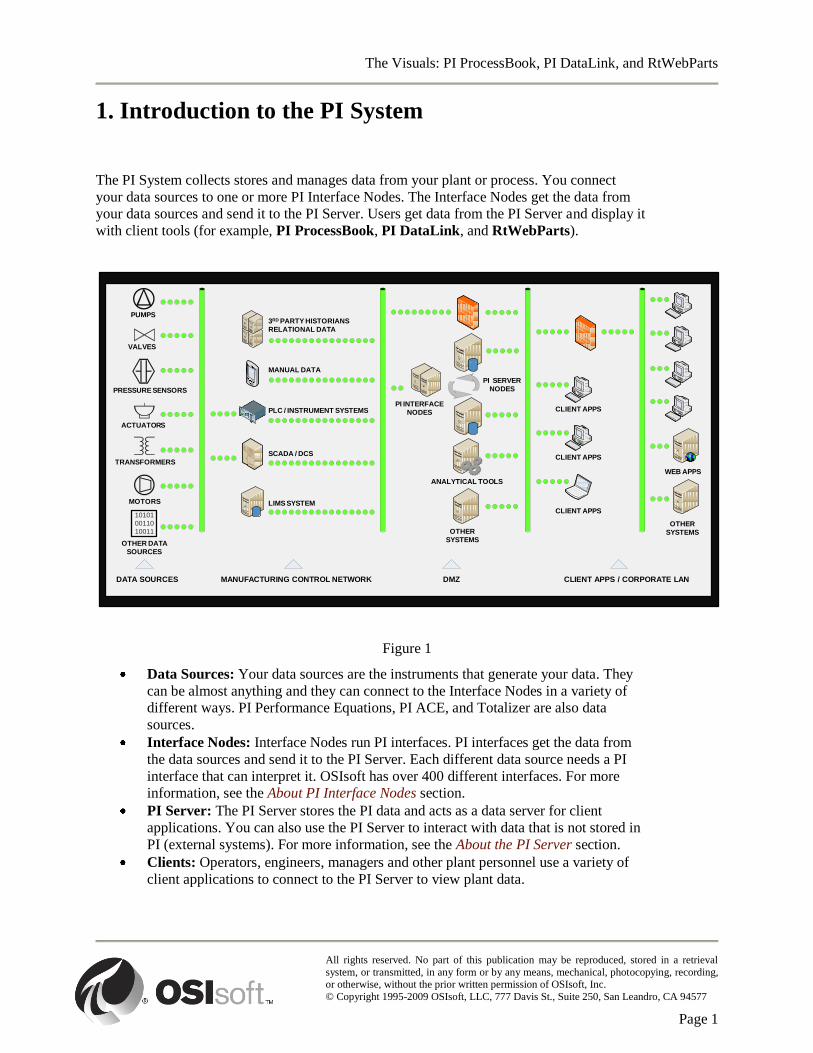
The PI System collects stores and manages data from your plant or process. You connect
your data sources to one or more PI Interface Nodes. The Interface Nodes get the data from
your data sources and send it to the PI Server. Users get data from the PI Server and display it
with client tools (for example, PI ProcessBook, PI DataLink, and RtWebParts).
Figure 1
Data Sources: Your data sources are the instruments that generate your data. They
can be almost anything and they can connect to the Interface Nodes in a variety of
different ways. PI Performance Equations, PI ACE, and Totalizer are also data
sources.
Interface Nodes: Interface Nodes run PI interfaces. PI interfaces get the data from
the data sources and send it to the PI Server. Each different data source needs a PI
interface that can interpret it. OSIsoft has over 400 different interfaces. For more
information, see the About PI Interface Nodes section.
PI Server: The PI Server stores the PI data and acts as a data server for client
applications. You can also use the PI Server to interact with data that is not stored in
PI (external systems). For more information, see the About the PI Server section.
Clients: Operators, engineers, managers and other plant personnel use a variety of
client applications to connect to the PI Server to view plant data.
10101
00110
10011
DATA SOURCES MANUFACTURING CONTROL NETWORK DMZ CLIENT APPS / CORPORATE LAN
OTHER DATA
SOURCES
ANALYTICAL TOOLS
CLIENT APPS
PI INTERFACE
NODES
3RD PARTY HISTORIANS
RELATIONAL DATA
MANUAL DATA
PLC / INSTRUMENT SYSTEMS
SCADA / DCS
LIMS SYSTEM
PUMPS
VALVES
PRESSURE SENSORS
ACTUATORS
MOTORS
TRANSFORMERS
PI SERVER
NODES
WEB APPS
CLIENT APPS
CLIENT APPS
OTHER
SYSTEMSOTHER
SYSTEMS
The Visuals: PI ProcessBook, PI DataLink, and RtWebParts
All rights reserved. No part of this publication may be reproduced, stored in a retrieval
system, or transmitted, in any form or by any means, mechanical, photocopying, recording, or otherwise, without the prior written permission of OSIsoft, Inc.
© Copyright 1995-2009 OSIsoft, LLC, 777 Davis St., Suite 250, San Leandro, CA 94577
Page 2
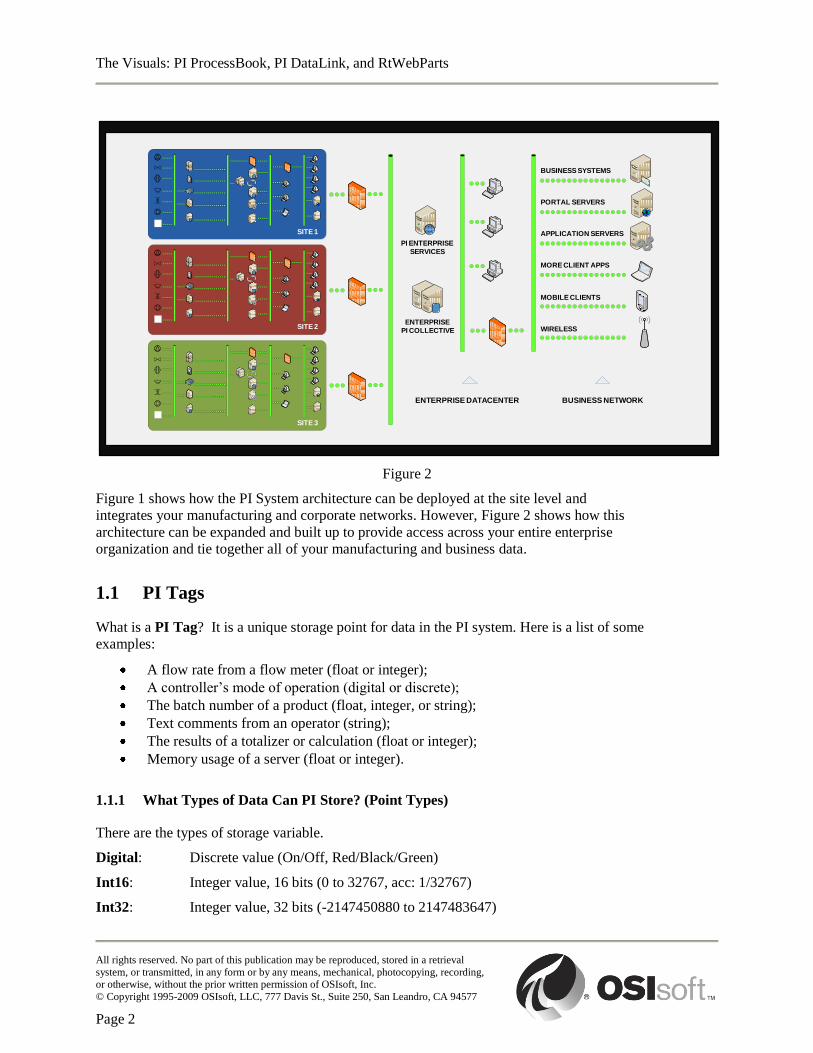
Figure 2
Figure 1 shows how the PI System architecture can be deployed at the site level and
integrates your manufacturing and corporate networks. However, Figure 2 shows how this
architecture can be expanded and built up to provide access across your entire enterprise
organization and tie together all of your manufacturing and business data.
1.1 PI Tags
What is a PI Tag? It is a unique storage point for data in the PI system. Here is a list of some
examples:
A flow rate from a flow meter (float or integer);
A controller‟s mode of operation (digital or discrete);
The batch number of a product (float, integer, or string);
Text comments from an operator (string);
The results of a totalizer or calculation (float or integer);
Memory usage of a server (float or integer).
1.1.1 What Types of Data Can PI Store? (Point Types)
There are the types of storage variable.
Digital: Discrete value (On/Off, Red/Black/Green)
Int16: Integer value, 16 bits (0 to 32767, acc: 1/32767)
Int32: Integer value, 32 bits (-2147450880 to 2147483647)
WIRELESS
MOBILE CLIENTS
MORE CLIENT APPS
APPLICATION SERVERS
PORTAL SERVERS
BUSINESS SYSTEMS
PI ENTERPRISE
SERVICES
ENTERPRISE
PI COLLECTIVE
SITE 1
SITE 2
SITE 3
ENTERPRISE DATACENTER BUSINESS NETWORK
The Visuals: PI ProcessBook, PI DataLink, and RtWebParts
All rights reserved. No part of this publication may be reproduced, stored in a retrieval
system, or transmitted, in any form or by any means, mechanical, photocopying, recording, or otherwise, without the prior written permission of OSIsoft, Inc.
© Copyright 1995-2009 OSIsoft, LLC, 777 Davis St., Suite 250, San Leandro, CA 94577
Page 3
Float16: Scaled Floating Point number, 16 bits (acc: 1/32767 times range)
Float32: Floating Point number, 32 bits (single precision)
Float64: Floating Point number, 64 bits (double precision)
String: Text value up to 976 characters
Blob: Binary large object up to 976 bytes
Timestamps: Any Time/Date in the range 1-Jan-1970 to 1-Jan-2038
1.1.2 Common Tag Attributes
There are some common tag attributes that are often used in client tools. Most of these
attributes are used for display or informational purposes.
Attributes Description
Tag name Unique name of the PI point used to search for tags
Descriptor PI tag description, often used as a search criteria in place of the tag name (when the tag
name is not intuitive)
EngUnits Engineering units
PointType Type of variable stored, sometimes used to help in searching (for example when
looking for a string tag)
Zero and Span These define the minimum and maximum values and are used in a number of places.
Most obvious are the upper and lower boundaries of object like the trend, bar graph, or
multistate symbol.
Point source Allows grouping of PI tags by data interface (DCS, PLC, or other sources) and is
occasionally used in tag searching.
1.2 About PI Interface Nodes
OSIsoft provides specialized interface programs (interfaces) for each data source. These
interfaces typically run on a dedicated system, called an Interface Node, which connects
both the data sources and the PI Server. For historical reasons, Interface Nodes may also
sometimes be referred to as API Nodes or Data Source Nodes, Data Collection Nodes, or
PINet Nodes (VMS).
Interface Nodes can run multiple interfaces to multiple PI Servers. The interface node might
be a machine that is a part of the foreign data system, or a standalone dedicated interface
machine, or even a PI Server itself (PI to PI).
1.3 Why Does My Data Appear to Have “Holes”?
Often you will experience a situation where one of the following conditions will be true:
The Visuals: PI ProcessBook, PI DataLink, and RtWebParts
All rights reserved. No part of this publication may be reproduced, stored in a retrieval
system, or transmitted, in any form or by any means, mechanical, photocopying, recording, or otherwise, without the prior written permission of OSIsoft, Inc.
© Copyright 1995-2009 OSIsoft, LLC, 777 Davis St., Suite 250, San Leandro, CA 94577
Page 4
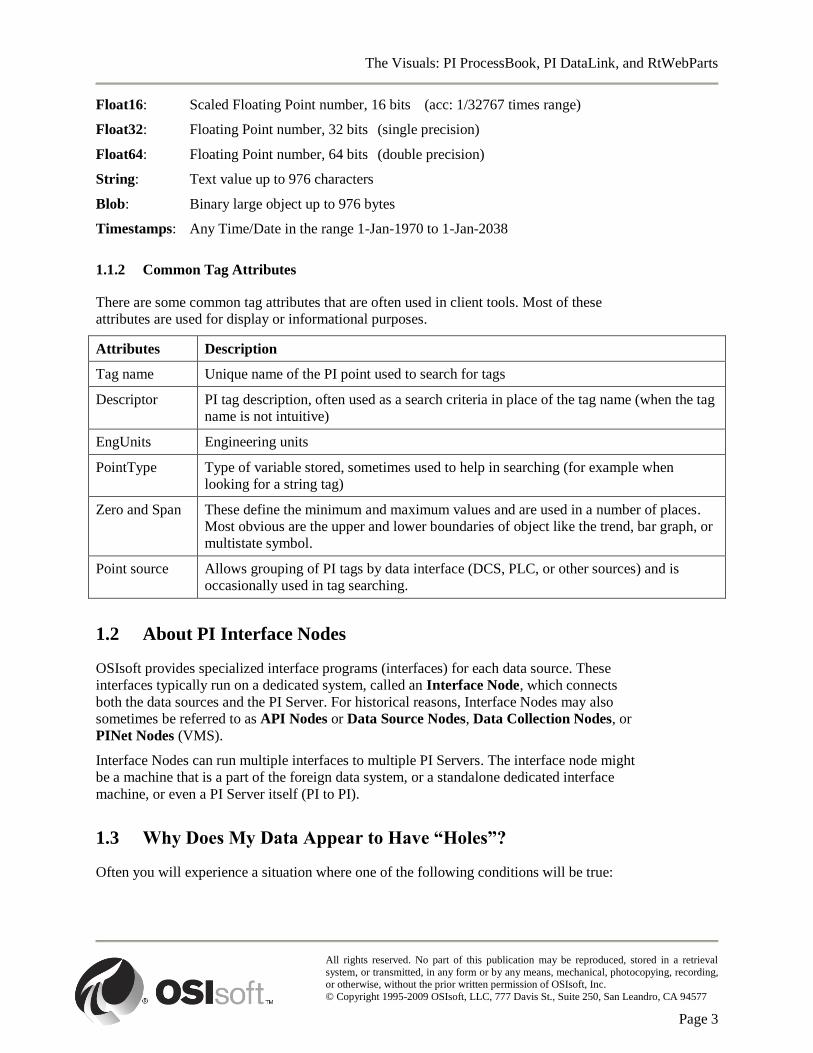
You are watching a trend and you can see many values, but when the trend is
refreshed most of them disappear.
Figure 3– Before and After Compression
You query for historical data in Microsoft Excel. You are sure the device is being
scanned every ten seconds, yet you see an uneven recording of data (what appear to
be gaps in timestamps).
This is completely normal behavior. It is a result of two filters that are applied.
At the Interface level, a process called the Exception Test is applied. The Exception Test
filters all values that are considered noise. This means that insignificant changes, as defined
as those below the instrument‟s accuracy threshold, as set by the person creating PI Points,
and identical values, such as a valve that is reading OPEN over and over again, are not sent to
the PI Server.
Once data gets to the PI Server, it is displayed through the PI Snapshot Subsystem as Current
Value. As new values arrive, older values are passed to the historical archives. Before they
arrive in the PI Archive, the Compression Test is applied. The Compression Test further
reduces the impact on system resources by filtering values that are unnecessary to reproduce
the data in the future. For example, all of the points along a consistent slope would be
considered unnecessary, with the exception of the first and last points along the line. See the
example trends shown in Figure 3.Figure 3
1.4 Data Flow
The PI Server stores data in the form of events. Each event has a value and a timestamp that
indicates what time the value was collected. The interfaces collect data from the data sources
and typically use exception reporting, meaning that they pass significant events on to the PI
Server and discard the rest. If the buffering service is configured on the interface node, then
the events go through the buffering service. If the Interface Node cannot connect to the PI
Server, the buffering service holds the data until the PI Server connection is restored.
1.4.1 Exception Reporting
The object of exception reporting is for the interface to send you the data you are interested
in, rather than taxing the network connection by sending a lot of data that is not meaningful.
Exception reporting uses a simple deadband algorithm to determine whether to send events to
the PI Server. For each point, you can set exception reporting specifications that create the
deadband. The interface ignores values that fall inside the deadband.
The Visuals: PI ProcessBook, PI DataLink, and RtWebParts
All rights reserved. No part of this publication may be reproduced, stored in a retrieval
system, or transmitted, in any form or by any means, mechanical, photocopying, recording, or otherwise, without the prior written permission of OSIsoft, Inc.
© Copyright 1995-2009 OSIsoft, LLC, 777 Davis St., Suite 250, San Leandro, CA 94577
Page 5
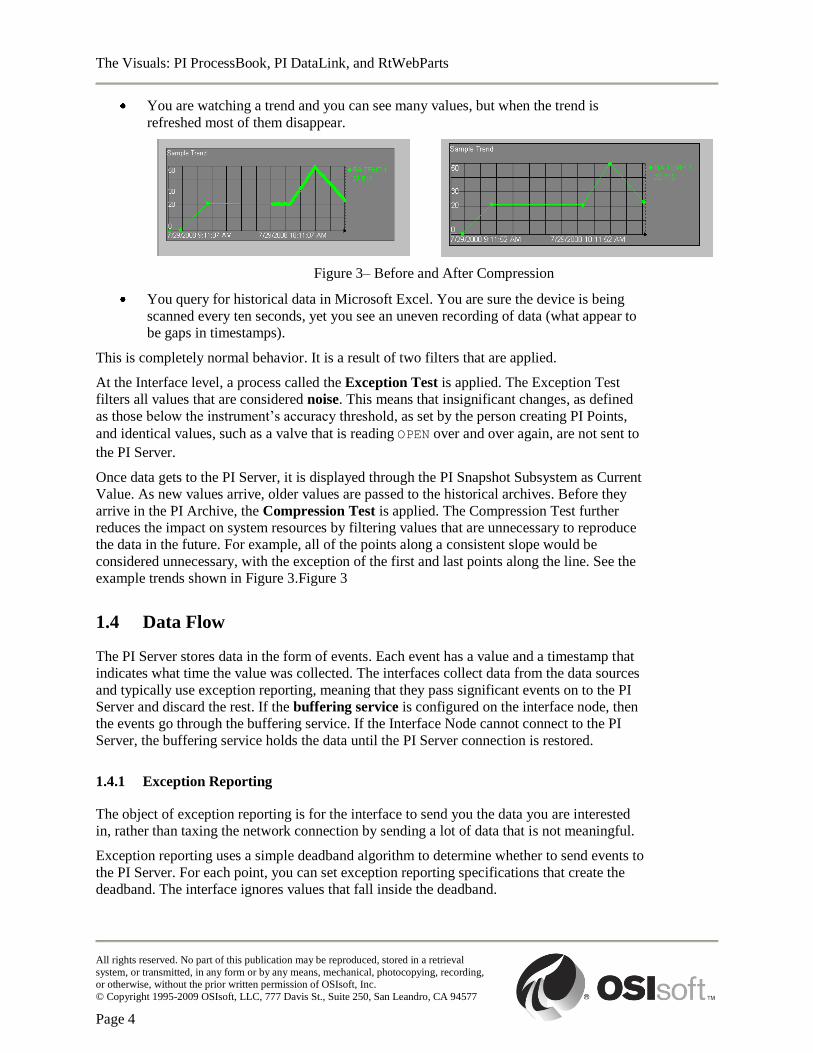
Figure 4
In the preceding illustration (Figure 4), values A, C, and D are reported to the PI Server.
Value A is the last reported value, values B and C fall within the exception deadband, but
value D falls outside the deadband, so the interface reports value D and the previous value, in
this case, value C.
The interface uses the point's ExcDev, ExcMin, and ExcMax attributes to decide whether to
report the new value to PI:
The ExcDev (or ExcDevPercent) attributes determine how much a point's value
needs to change before the interface sends it to the Server. For example, a 12 bit A/D
converter can never be more precise than 1 part in 4096, so if the instrument range is
0-1000 degrees, the ExcDev should be no smaller than 0.24 degrees.
The ExcMax attribute sets a limit on how long the interface can go without reporting
a value to PI. After the ExcMax time period, the interface sends the next new value
to PI, regardless of whether the new value is different from the last reported value.
The ExcMin attribute sets a limit on how frequently the interface can report values.
For example, if you want the interface to ignore all new values for ten minutes
before reporting a new value that passes the Exception Test to the PI Server, then
you would set the ExcMin attribute to ten minutes.
Note 1: Some interfaces do not support exception reporting. See the documentation for your interface to
determine whether it supports this capability.
The Visuals: PI ProcessBook, PI DataLink, and RtWebParts
All rights reserved. No part of this publication may be reproduced, stored in a retrieval
system, or transmitted, in any form or by any means, mechanical, photocopying, recording, or otherwise, without the prior written permission of OSIsoft, Inc.
© Copyright 1995-2009 OSIsoft, LLC, 777 Davis St., Suite 250, San Leandro, CA 94577
Page 6
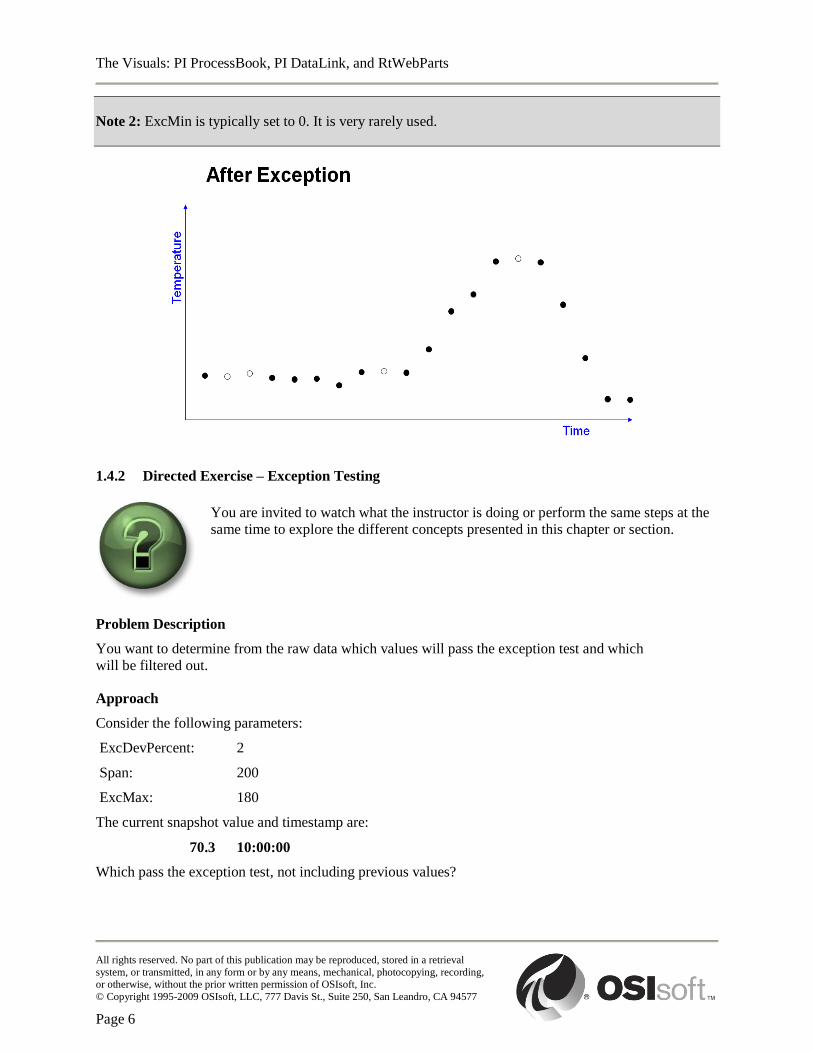
Note 2: ExcMin is typically set to 0. It is very rarely used.
1.4.2 Directed Exercise – Exception Testing
You are invited to watch what the instructor is doing or perform the same steps at the
same time to explore the different concepts presented in this chapter or section.
Problem Description
You want to determine from the raw data which values will pass the exception test and which
will be filtered out.
Approach
Consider the following parameters:
ExcDevPercent: 2
Span: 200
ExcMax: 180
The current snapshot value and timestamp are:
70.3 10:00:00
Which pass the exception test, not including previous values?
The Visuals: PI ProcessBook, PI DataLink, and RtWebParts
All rights reserved. No part of this publication may be reproduced, stored in a retrieval
system, or transmitted, in any form or by any means, mechanical, photocopying, recording, or otherwise, without the prior written permission of OSIsoft, Inc.
© Copyright 1995-2009 OSIsoft, LLC, 777 Davis St., Suite 250, San Leandro, CA 94577
Page 7
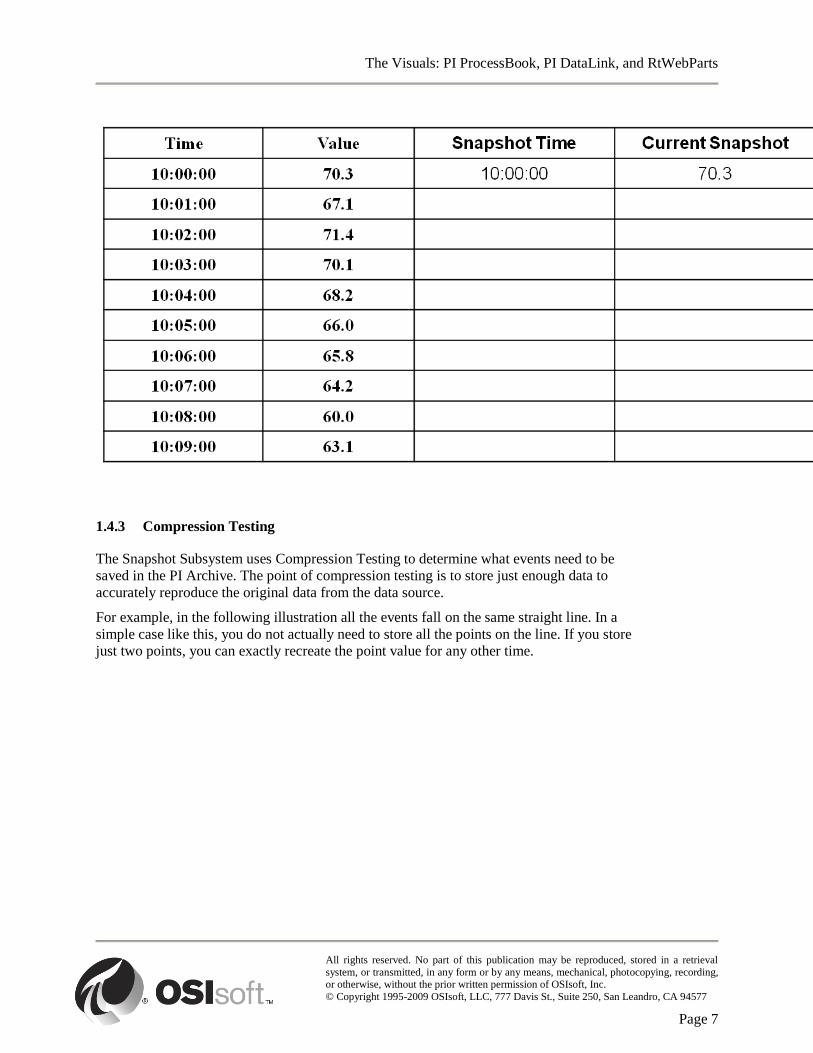
1.4.3 Compression Testing
The Snapshot Subsystem uses Compression Testing to determine what events need to be
saved in the PI Archive. The point of compression testing is to store just enough data to
accurately reproduce the original data from the data source.
For example, in the following illustration all the events fall on the same straight line. In a
simple case like this, you do not actually need to store all the points on the line. If you store
just two points, you can exactly recreate the point value for any other time.
The Visuals: PI ProcessBook, PI DataLink, and RtWebParts
All rights reserved. No part of this publication may be reproduced, stored in a retrieval
system, or transmitted, in any form or by any means, mechanical, photocopying, recording, or otherwise, without the prior written permission of OSIsoft, Inc.
© Copyright 1995-2009 OSIsoft, LLC, 777 Davis St., Suite 250, San Leandro, CA 94577
Page 8
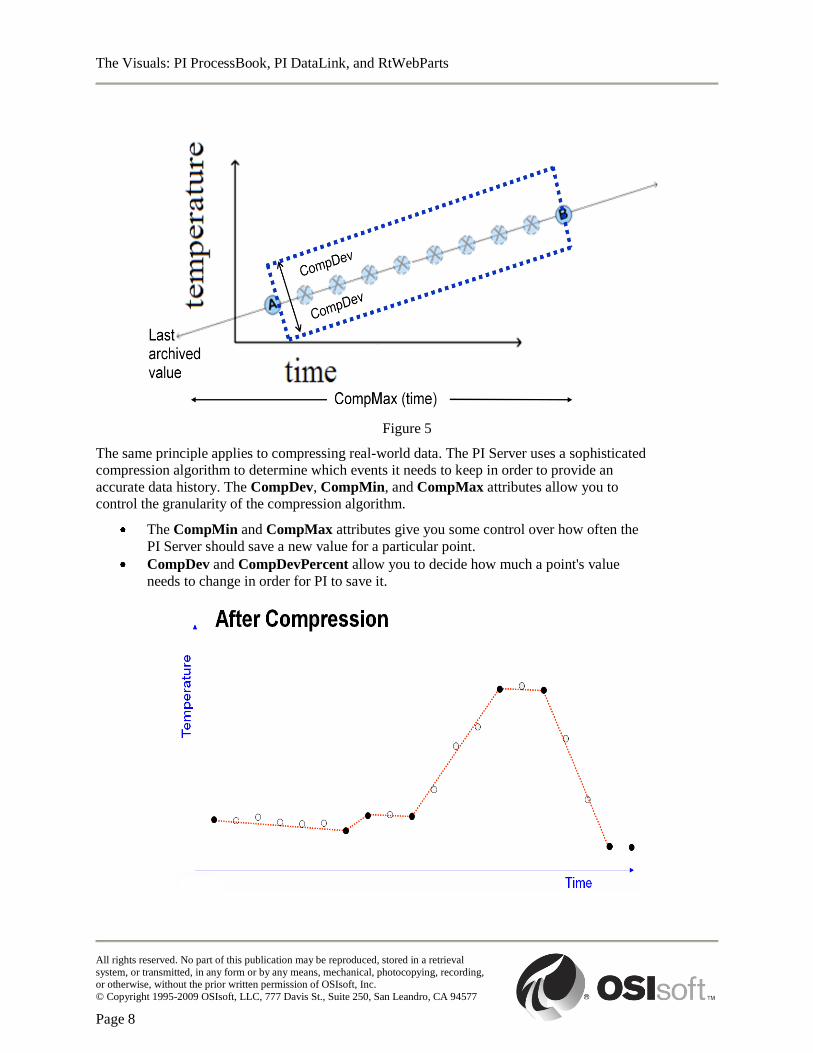
Figure 5
The same principle applies to compressing real-world data. The PI Server uses a sophisticated
compression algorithm to determine which events it needs to keep in order to provide an
accurate data history. The CompDev, CompMin, and CompMax attributes allow you to
control the granularity of the compression algorithm.
The CompMin and CompMax attributes give you some control over how often the
PI Server should save a new value for a particular point.
CompDev and CompDevPercent allow you to decide how much a point's value
needs to change in order for PI to save it.
The Visuals: PI ProcessBook, PI DataLink, and RtWebParts
All rights reserved. No part of this publication may be reproduced, stored in a retrieval
system, or transmitted, in any form or by any means, mechanical, photocopying, recording, or otherwise, without the prior written permission of OSIsoft, Inc.
© Copyright 1995-2009 OSIsoft, LLC, 777 Davis St., Suite 250, San Leandro, CA 94577
Page 9
1.4.4 Default Values for Exception and Compression
The default values for exception and compression are as follows:
ExcDevPercent = 1 (% of span);
ExcMax = 600 (10 minutes);
CompDevPercent = 2 (% of span);
CompMax = 28800 (8 hours);
Zero = 0;
Span = 100.
If you create a tag in the PI Server and do not specify values for exception and compression
specifications, the default values will be used. This should be avoided because the exception
and compression values for each tag should correctly reflect the desired tag values. This
could include:
Accuracy of the instrument;
Desired granularity;
Performance of the client applications.
As a starting point recommendation for these settings, we recommend setting the
Compression Deviation to the minimum change measurable by the instrument. The Exception
Deviation should be set to half of the Compression Deviation. It is important to note that
these are only starting point recommendations and you should be sure to inspect your data for
the desired resolution. In some cases, it is advisable to turn off exception and compression
entirely. This should not be done without careful consideration. To do this, set the Exception
Deviation and the Exception Maximum to 0. You can turn off Compression directly, although
it is recommend to leave compression on, and set the Compression Deviation to 0. If set
properly, the PI Server will archive values that reflect an accurate change in the device,
without wasting space on duplicating values or losing meaningful values.
It is rarely advisable to leave the tag defaults. If left to the defaults, and if the tag normally
moves through a very small range of values, it is possible to miss significant changes due to
the Exception Test removing these points. An example might be a temperature sensor, where
a change of 0.2 would be missed because it does not meet the default threshold of 1
engineering unit (or 1 percent of a span set to 100). An exception value of 0.1 might be more
appropriate (or an adjustment to the span).
It is just as bad to turn exception and compression off, as you will adversely affect the
performance of the system by archiving many values that are unnecessary. An example of
this would be a valve scanned every few seconds. With no exception or compression we
would record the value of OPEN to disk thousands and thousands of times unnecessarily.
While hard disk space is become cheaper, the more limiting factor is the speed of retrieval.
The latency due to spinning of the hard disk and network bandwidth limitations can severely
impede performance.
1.5 About the PI Server
The PI Server is the heart of your PI System. It gets the data and routes it in real time
throughout the PI System and your entire information infrastructure, making it possible for
The Visuals: PI ProcessBook, PI DataLink, and RtWebParts
All rights reserved. No part of this publication may be reproduced, stored in a retrieval
system, or transmitted, in any form or by any means, mechanical, photocopying, recording, or otherwise, without the prior written permission of OSIsoft, Inc.
© Copyright 1995-2009 OSIsoft, LLC, 777 Davis St., Suite 250, San Leandro, CA 94577
Page 10
everyone to work from a common set of real data. Operators, engineers, managers, and other
plant personnel can connect to the PI Server and view manufacturing data from PI Data
Storage or from external data storage systems.
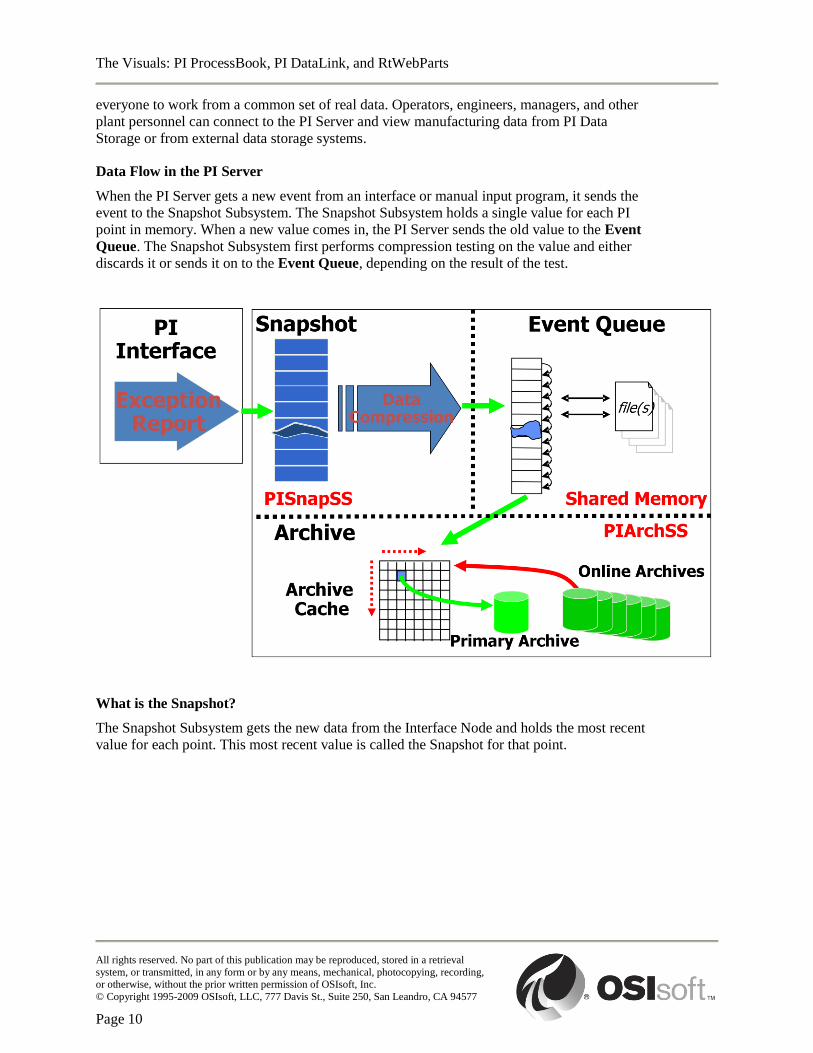
Data Flow in the PI Server
When the PI Server gets a new event from an interface or manual input program, it sends the
event to the Snapshot Subsystem. The Snapshot Subsystem holds a single value for each PI
point in memory. When a new value comes in, the PI Server sends the old value to the Event
Queue. The Snapshot Subsystem first performs compression testing on the value and either
discards it or sends it on to the Event Queue, depending on the result of the test.
What is the Snapshot?
The Snapshot Subsystem gets the new data from the Interface Node and holds the most recent
value for each point. This most recent value is called the Snapshot for that point.
The Visuals: PI ProcessBook, PI DataLink, and RtWebParts
All rights reserved. No part of this publication may be reproduced, stored in a retrieval
system, or transmitted, in any form or by any means, mechanical, photocopying, recording, or otherwise, without the prior written permission of OSIsoft, Inc.
© Copyright 1995-2009 OSIsoft, LLC, 777 Davis St., Suite 250, San Leandro, CA 94577
Page 11
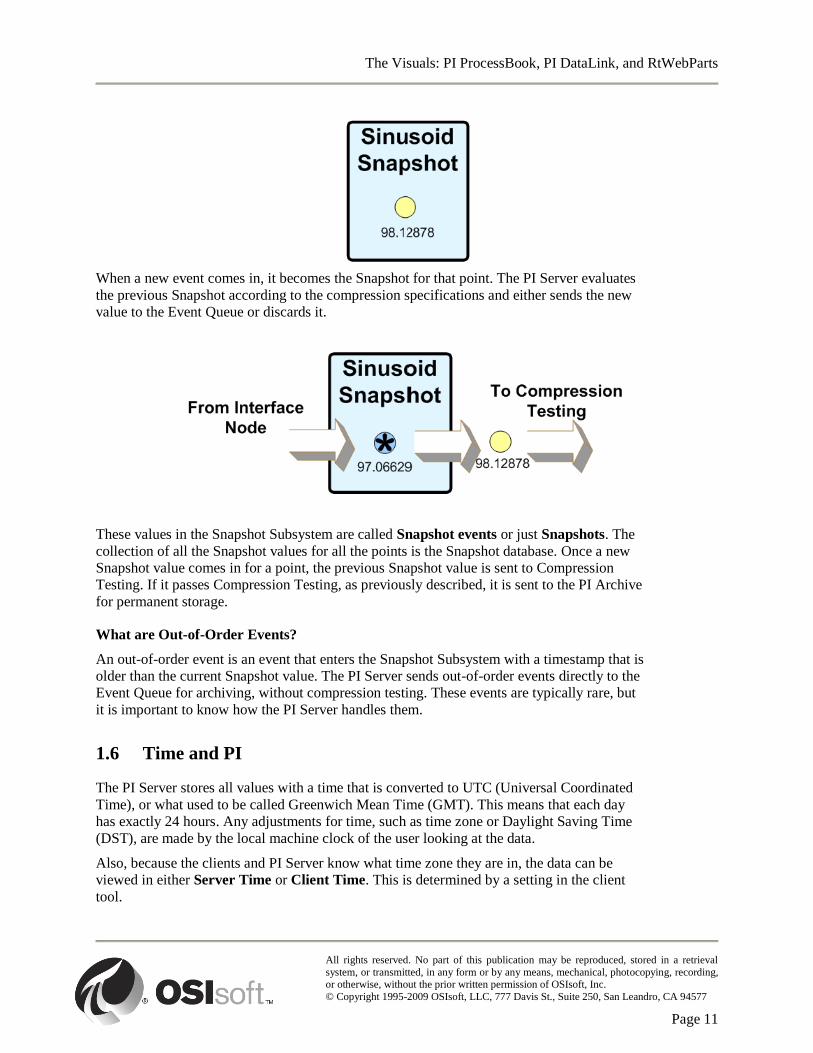
When a new event comes in, it becomes the Snapshot for that point. The PI Server evaluates
the previous Snapshot according to the compression specifications and either sends the new
value to the Event Queue or discards it.
These values in the Snapshot Subsystem are called Snapshot events or just Snapshots. The
collection of all the Snapshot values for all the points is the Snapshot database. Once a new
Snapshot value comes in for a point, the previous Snapshot value is sent to Compression
Testing. If it passes Compression Testing, as previously described, it is sent to the PI Archive
for permanent storage.
What are Out-of-Order Events?
An out-of-order event is an event that enters the Snapshot Subsystem with a timestamp that is
older than the current Snapshot value. The PI Server sends out-of-order events directly to the
Event Queue for archiving, without compression testing. These events are typically rare, but
it is important to know how the PI Server handles them.
1.6 Time and PI
The PI Server stores all values with a time that is converted to UTC (Universal Coordinated
Time), or what used to be called Greenwich Mean Time (GMT). This means that each day
has exactly 24 hours. Any adjustments for time, such as time zone or Daylight Saving Time
(DST), are made by the local machine clock of the user looking at the data.
Also, because the clients and PI Server know what time zone they are in, the data can be
viewed in either Server Time or Client Time. This is determined by a setting in the client
tool.
The Visuals: PI ProcessBook, PI DataLink, and RtWebParts
All rights reserved. No part of this publication may be reproduced, stored in a retrieval
system, or transmitted, in any form or by any means, mechanical, photocopying, recording, or otherwise, without the prior written permission of OSIsoft, Inc.
© Copyright 1995-2009 OSIsoft, LLC, 777 Davis St., Suite 250, San Leandro, CA 94577
Page 12
It is important that all of the computers involved collecting data (PI Server, Interface Nodes,
etc.) have their operating system clocks set correctly. For most current interfaces using the
extended PI API, events are sent to the server with UTC timestamps. As a result, DST and
time zone differences are properly considered when storing data on the PI Server. If the PI
Interface is more than ten minutes ahead of the PI Server, the PI Server cannot handle the
time difference and discards the data because it is considered a future event.
Automatic DST changes will not cause a problem when all computers observe the same rules.
That is, all computers either change their clocks twice a year at the same time or they do not.
Note: Situations where some computers change their clocks when others do not can cause data loss.
Absolute Time (a specific point in time)
* : (NOW)
t : 00:00:00 on the current day (TODAY)
18-feb-05 16:00:00
This can be a either the Windows time format (configured in the Regional Setting dialog of
Microsoft Windows) or the PI Time format (dd-mmm-yy HH:mm:ss.00000)
Relative Time (time is offset from another time)
+ 8h : + 8 hours
Combined Time (using Absolute and Relative Times together)
t + 8h : today + 8 hours
If no date is specified the system will assume today. If no time is specified then the system
will assume midnight.
Common Abbreviations:
* = NOW
T = today at midnight
Y = yesterday at midnight
Monday or Mon = Monday at midnight (or another specified day or its first three letters)
Relative Time Units of Measure:
Hours (h)
Minutes (m)
Seconds (s)
Weeks (w)
Days (d)
Years (y)
Months (mo)
The Visuals: PI ProcessBook, PI DataLink, and RtWebParts
All rights reserved. No part of this publication may be reproduced, stored in a retrieval
system, or transmitted, in any form or by any means, mechanical, photocopying, recording, or otherwise, without the prior written permission of OSIsoft, Inc.
© Copyright 1995-2009 OSIsoft, LLC, 777 Davis St., Suite 250, San Leandro, CA 94577
Page 13
There is no default time unit. Hour, Minute and Second intervals can use fractions (for
example +2.5h or -0.5m).
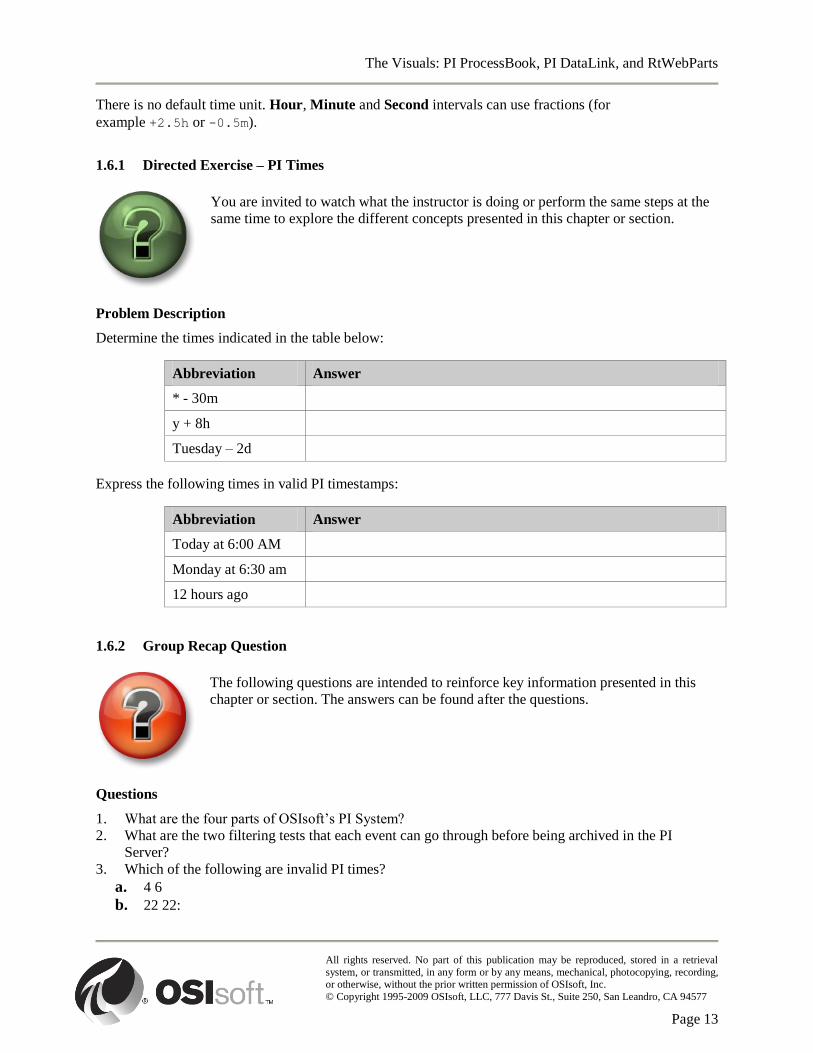
1.6.1 Directed Exercise – PI Times
You are invited to watch what the instructor is doing or perform the same steps at the
same time to explore the different concepts presented in this chapter or section.
Problem Description
Determine the times indicated in the table below:
Abbreviation Answer
* - 30m
y + 8h
Tuesday – 2d
Express the following times in valid PI timestamps:
Abbreviation Answer
Today at 6:00 AM
Monday at 6:30 am
12 hours ago
1.6.2 Group Recap Question
The following questions are intended to reinforce key information presented in this
chapter or section. The answers can be found after the questions.
Questions
1. What are the four parts of OSIsoft‟s PI System?
2. What are the two filtering tests that each event can go through before being archived in the PI
Server?
3. Which of the following are invalid PI times?
a. 4 6
b. 22 22:

The Visuals: PI ProcessBook, PI DataLink, and RtWebParts
All rights reserved. No part of this publication may be reproduced, stored in a retrieval
system, or transmitted, in any form or by any means, mechanical, photocopying, recording, or otherwise, without the prior written permission of OSIsoft, Inc.
© Copyright 1995-2009 OSIsoft, LLC, 777 Davis St., Suite 250, San Leandro, CA 94577
Page 14
c. t-1.5d
d. y-1y
e. *-Monday
f. 09-Jun-06 22:45:35.0943
Answers
1. The Interfaces, the Server, the Analytics, and the Visuals
2. Exception and Compression
3. c. Half days are not allowed in PI Times.
e. Combined times do not allow the use of two absolute times.
The Visuals: PI ProcessBook, PI DataLink, and RtWebParts
All rights reserved. No part of this publication may be reproduced, stored in a retrieval
system, or transmitted, in any form or by any means, mechanical, photocopying, recording, or otherwise, without the prior written permission of OSIsoft, Inc.
© Copyright 1995-2009 OSIsoft, LLC, 777 Davis St., Suite 250, San Leandro, CA 94577
Page 15
2. Common PI Dialog Windows and Concepts
There are three dialog boxes that are used in one way or another in every PI application that
you will use. They are common because they address functions that are used regardless of the
specific application. They involve:
Connecting to a PI Server or Collective;
Searching for Tags;
Query for Tag Attributes / Values.
Some applications will use different formats, but they all accomplish the same functions. For
example, the Tag Search function on PI WebParts (formerly RtWebParts) is based on
different web architecture and thus looks slightly different.
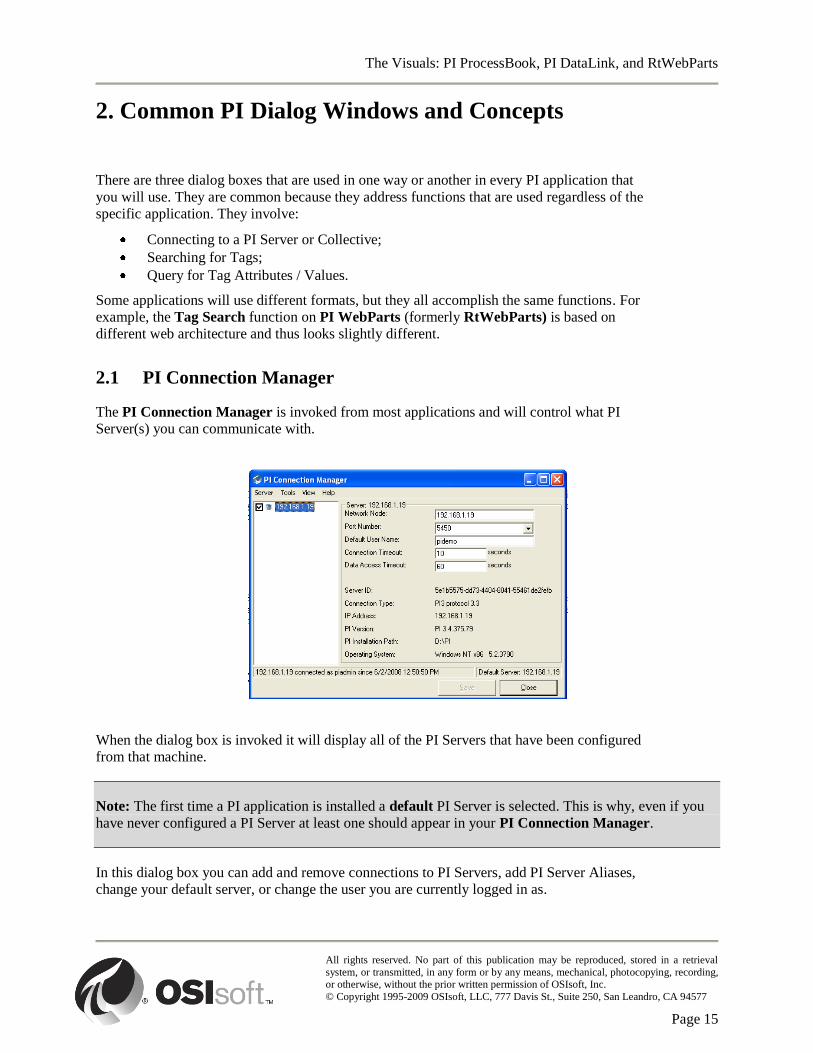
2.1 PI Connection Manager
The PI Connection Manager is invoked from most applications and will control what PI
Server(s) you can communicate with.
When the dialog box is invoked it will display all of the PI Servers that have been configured
from that machine.
Note: The first time a PI application is installed a default PI Server is selected. This is why, even if you
have never configured a PI Server at least one should appear in your PI Connection Manager.
In this dialog box you can add and remove connections to PI Servers, add PI Server Aliases,
change your default server, or change the user you are currently logged in as.
The Visuals: PI ProcessBook, PI DataLink, and RtWebParts
All rights reserved. No part of this publication may be reproduced, stored in a retrieval
system, or transmitted, in any form or by any means, mechanical, photocopying, recording, or otherwise, without the prior written permission of OSIsoft, Inc.
© Copyright 1995-2009 OSIsoft, LLC, 777 Davis St., Suite 250, San Leandro, CA 94577
Page 16
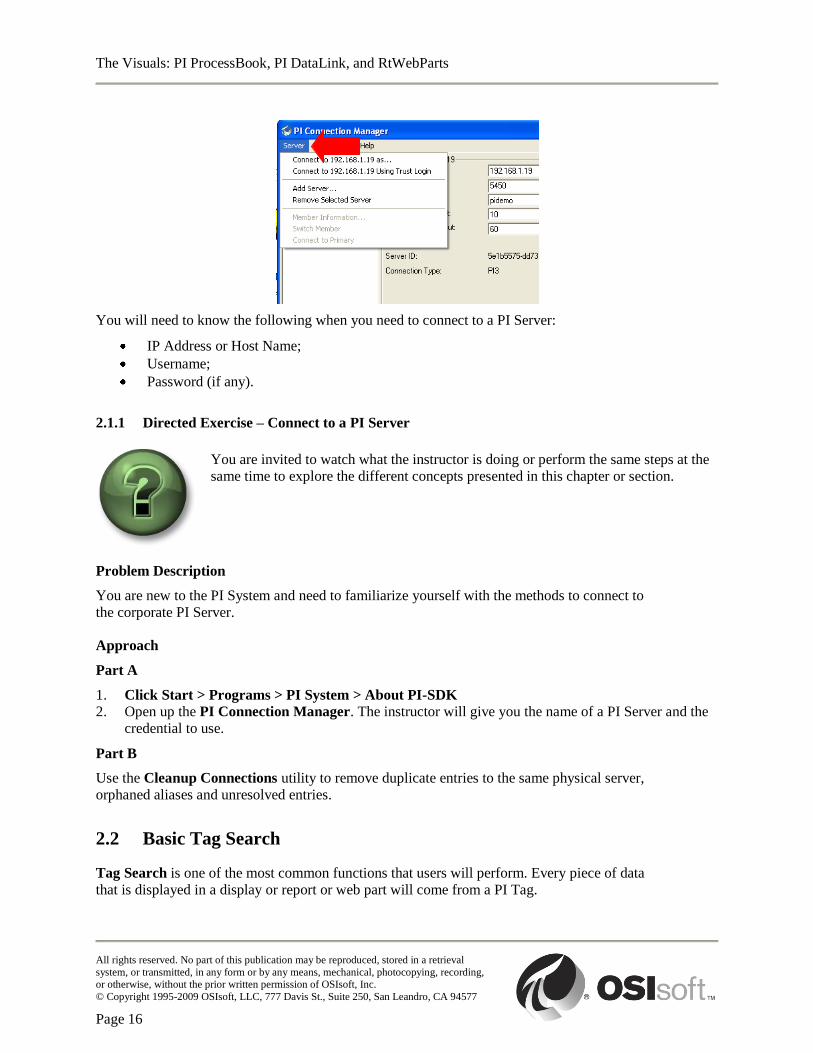
You will need to know the following when you need to connect to a PI Server:
IP Address or Host Name;
Username;
Password (if any).
2.1.1 Directed Exercise – Connect to a PI Server
You are invited to watch what the instructor is doing or perform the same steps at the
same time to explore the different concepts presented in this chapter or section.
Problem Description
You are new to the PI System and need to familiarize yourself with the methods to connect to
the corporate PI Server.
Approach
Part A
1. Click Start > Programs > PI System > About PI-SDK
2. Open up the PI Connection Manager. The instructor will give you the name of a PI Server and the
credential to use.
Part B
Use the Cleanup Connections utility to remove duplicate entries to the same physical server,
orphaned aliases and unresolved entries.
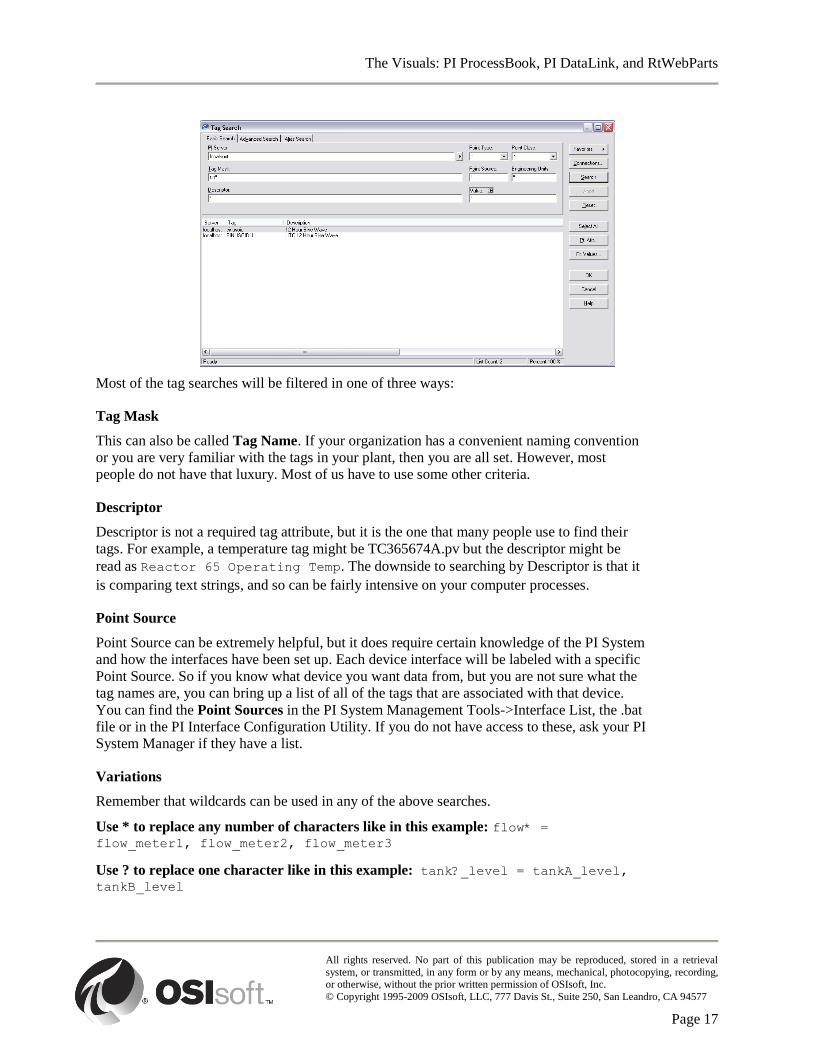
2.2 Basic Tag Search
Tag Search is one of the most common functions that users will perform. Every piece of data
that is displayed in a display or report or web part will come from a PI Tag.
The Visuals: PI ProcessBook, PI DataLink, and RtWebParts
All rights reserved. No part of this publication may be reproduced, stored in a retrieval
system, or transmitted, in any form or by any means, mechanical, photocopying, recording, or otherwise, without the prior written permission of OSIsoft, Inc.
© Copyright 1995-2009 OSIsoft, LLC, 777 Davis St., Suite 250, San Leandro, CA 94577
Page 17
Most of the tag searches will be filtered in one of three ways:
Tag Mask
This can also be called Tag Name. If your organization has a convenient naming convention
or you are very familiar with the tags in your plant, then you are all set. However, most
people do not have that luxury. Most of us have to use some other criteria.
Descriptor
Descriptor is not a required tag attribute, but it is the one that many people use to find their
tags. For example, a temperature tag might be TC365674A.pv but the descriptor might be
read as Reactor 65 Operating Temp. The downside to searching by Descriptor is that it
is comparing text strings, and so can be fairly intensive on your computer processes.
Point Source
Point Source can be extremely helpful, but it does require certain knowledge of the PI System
and how the interfaces have been set up. Each device interface will be labeled with a specific
Point Source. So if you know what device you want data from, but you are not sure what the
tag names are, you can bring up a list of all of the tags that are associated with that device.
You can find the Point Sources in the PI System Management Tools->Interface List, the .bat
file or in the PI Interface Configuration Utility. If you do not have access to these, ask your PI
System Manager if they have a list.
Variations
Remember that wildcards can be used in any of the above searches.
Use * to replace any number of characters like in this example: flow* = flow_meter1, flow_meter2, flow_meter3
Use ? to replace one character like in this example: tank?_level = tankA_level, tankB_level
The Visuals: PI ProcessBook, PI DataLink, and RtWebParts
All rights reserved. No part of this publication may be reproduced, stored in a retrieval
system, or transmitted, in any form or by any means, mechanical, photocopying, recording, or otherwise, without the prior written permission of OSIsoft, Inc.
© Copyright 1995-2009 OSIsoft, LLC, 777 Davis St., Suite 250, San Leandro, CA 94577
Page 18
Note 1: Search criteria are not case sensitive, but are case preservative.
Note 2: Search criteria can be combined like in this example where we look for Tag Mask: = flow* and Point Source = o
2.2.1 Directed Exercise – Tag Search
You are invited to watch what the instructor is doing or perform the same steps at the
same time to explore the different concepts presented in this chapter or section.
Problem Description
You need to familiarize yourself with the principles of tag searching.
Approach
Try some tag searches using different criteria (e.g., all tags that begin with BA, all tags with
an S, etc.).
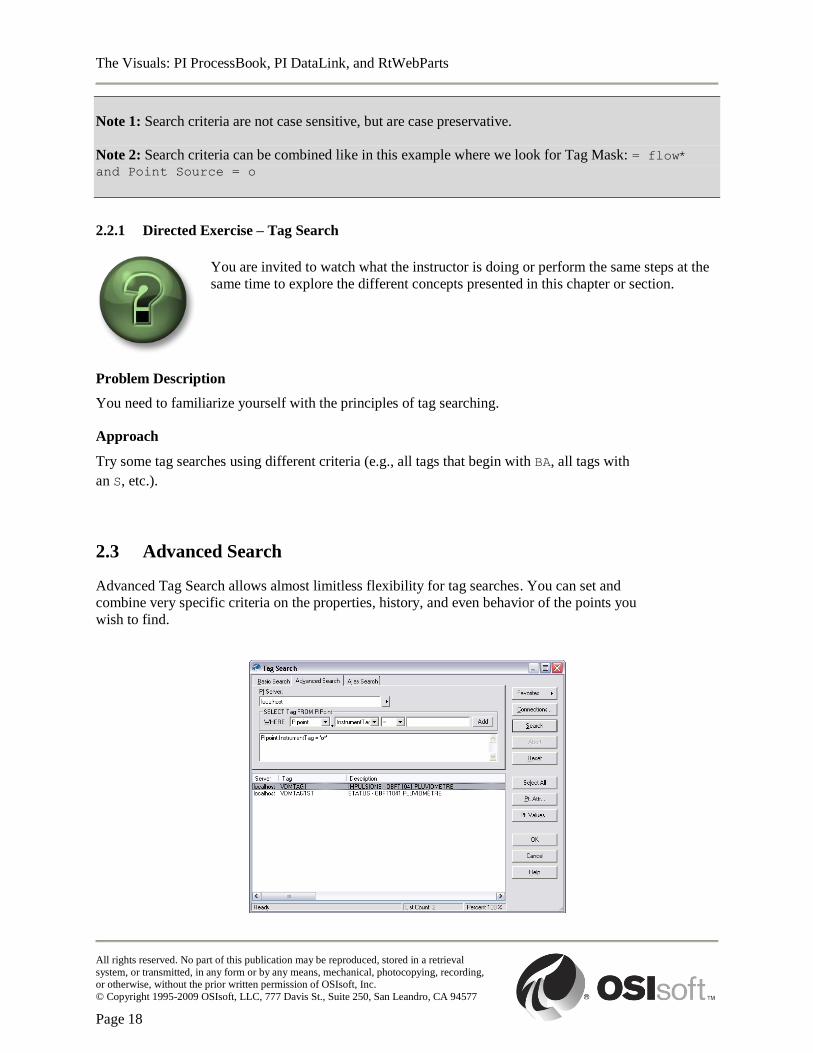
2.3 Advanced Search
Advanced Tag Search allows almost limitless flexibility for tag searches. You can set and
combine very specific criteria on the properties, history, and even behavior of the points you
wish to find.
The Visuals: PI ProcessBook, PI DataLink, and RtWebParts
All rights reserved. No part of this publication may be reproduced, stored in a retrieval
system, or transmitted, in any form or by any means, mechanical, photocopying, recording, or otherwise, without the prior written permission of OSIsoft, Inc.
© Copyright 1995-2009 OSIsoft, LLC, 777 Davis St., Suite 250, San Leandro, CA 94577
Page 19
For the advanced search, the user constructs his or her SQL query. There is no guarantee that
the query will be syntactically correct. However, the search criteria are much more flexible
than with the Basic Search. Any point attribute from Point Class Classic can be used to
restrict the search and there are various methods to search by value. Example SQL queries are
shipped with the Tag Search Dialog. These queries can be viewed by clicking on the
Favorites button and browsing to the desired example under the Examples folder.
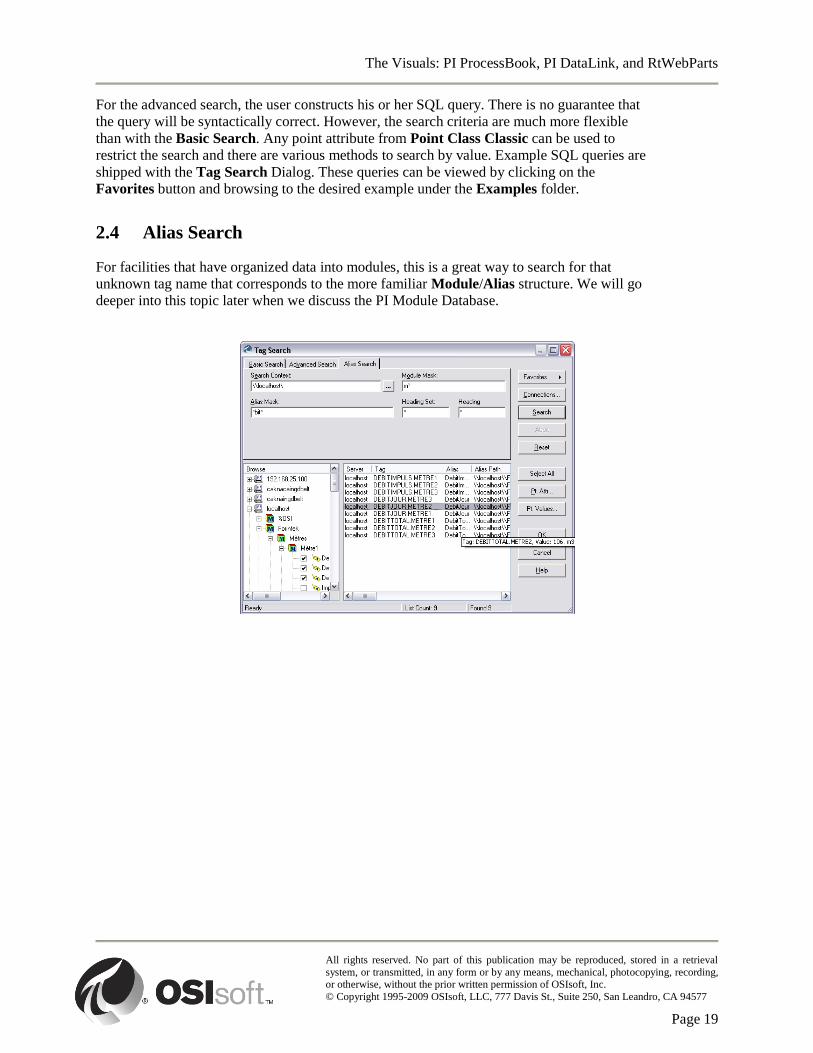
2.4 Alias Search
For facilities that have organized data into modules, this is a great way to search for that
unknown tag name that corresponds to the more familiar Module/Alias structure. We will go
deeper into this topic later when we discuss the PI Module Database.
The Visuals: PI ProcessBook, PI DataLink, and RtWebParts
All rights reserved. No part of this publication may be reproduced, stored in a retrieval
system, or transmitted, in any form or by any means, mechanical, photocopying, recording, or otherwise, without the prior written permission of OSIsoft, Inc.
© Copyright 1995-2009 OSIsoft, LLC, 777 Davis St., Suite 250, San Leandro, CA 94577
Page 20
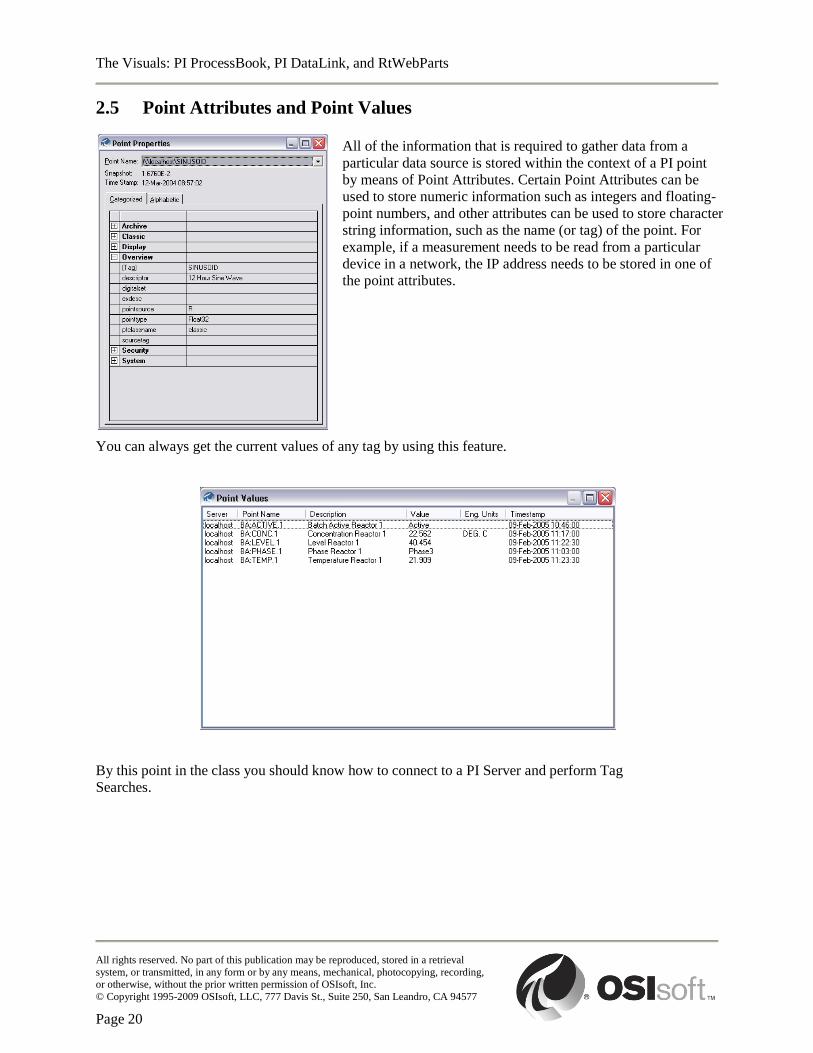
2.5 Point Attributes and Point Values
All of the information that is required to gather data from a
particular data source is stored within the context of a PI point
by means of Point Attributes. Certain Point Attributes can be
used to store numeric information such as integers and floating-
point numbers, and other attributes can be used to store character
string information, such as the name (or tag) of the point. For
example, if a measurement needs to be read from a particular
device in a network, the IP address needs to be stored in one of
the point attributes.
You can always get the current values of any tag by using this feature.
By this point in the class you should know how to connect to a PI Server and perform Tag
Searches.
The Visuals: PI ProcessBook, PI DataLink, and RtWebParts
All rights reserved. No part of this publication may be reproduced, stored in a retrieval
system, or transmitted, in any form or by any means, mechanical, photocopying, recording, or otherwise, without the prior written permission of OSIsoft, Inc.
© Copyright 1995-2009 OSIsoft, LLC, 777 Davis St., Suite 250, San Leandro, CA 94577
Page 21
2.5.1 Group Recap Question
The following questions are intended to reinforce key information presented in this
chapter or section. The answers can be found after the questions.
Questions
1. What information needs to be specified when creating a new connection to a PI Server?
2. What are the two wildcard characters available in a Tag Search?
3. Which of the following PI Tag Attributes are not default filtering search criteria in a Basic Tag
Search?
a. Point Type
b. Tag Name
c. Zero
d. Point Class
e. Point Source
f. Typical Value
Answers
1. The PI Server name, the connection type, the default user, and the port number.
2. The * for any number of characters and the ? for a single character.
3. c. and f.
2.6 Performance Equation Syntax
Performance Equations are special tags in the PI Server that perform calculations using PI
Tags as the data source and store that information in another tag. These Performance
Equation tags require a specific syntax, known as the Performance Equation Syntax. This
syntax is important because, while it originated with the Performance Equation tags, it is now
used in multiple places. These include ProcessBook Calculation Datasets, DataLink
Expressions, and RtWebParts PI Calculation Datasets. They are also used in filter
expressions, found throughout these client tools.
The three rules of Performance Equation Syntax are:
Numbers and mathematical operators are written as is: 10, 0.125, 34.56, +, -, *, /, ^
Tag names and timestamps, whether absolute or combined time format, are written
in single quotes: 'cdt158', 'temp_tank_1', 'FIC5821.PV', „*‟, „T+6h‟, ‟13-Jun-2009‟
Strings are written in double quotes: "This is a string"
There is also a rich library of mathematical functions available. These are the typical
mathematical functions like sin(), cos(), log(), exp(), abs(), etc. Aside from the mathematical
functions, there are also many PI functions that apply specifically to PI data. These include
things like:
The Visuals: PI ProcessBook, PI DataLink, and RtWebParts
All rights reserved. No part of this publication may be reproduced, stored in a retrieval
system, or transmitted, in any form or by any means, mechanical, photocopying, recording, or otherwise, without the prior written permission of OSIsoft, Inc.
© Copyright 1995-2009 OSIsoft, LLC, 777 Davis St., Suite 250, San Leandro, CA 94577
Page 22
PctGood() Percent of time tag has good values.
Range() Range of min to max.
StDev() Time-weighted standard deviation.
TagAvg() Time-weighted average.
TagMean() Event-weighted average.
TagMax() Maximum value in period.
TagMin () Minimum value in period.
TagTot() Time integral over a period.
An expression can use If-Then-Else, relational and logical operators.
Syntax: IF expr0 THEN expr1 ELSE expr2
Example: IF 'Tag1' >= 50 AND 'Tag2' < 125 THEN “under limit” ELSE “good”
Notes: You must include the IF, THEN and ELSE keywords. The NoOutput() PE function can be used in
the THEN or ELSE clause. It is possible to nest if-then-else expressions.
For a complete list of built-in functions that can be used, consult the PEReference.chm
document. It is available at http://techsupport.osisoft.com. Search for "performance
equations" in the search box at the upper right of the screen. See the file "PI 3 Performance
Equations Help File" in the search results. You will also find it in
\\pipc\help\pereference.chm.
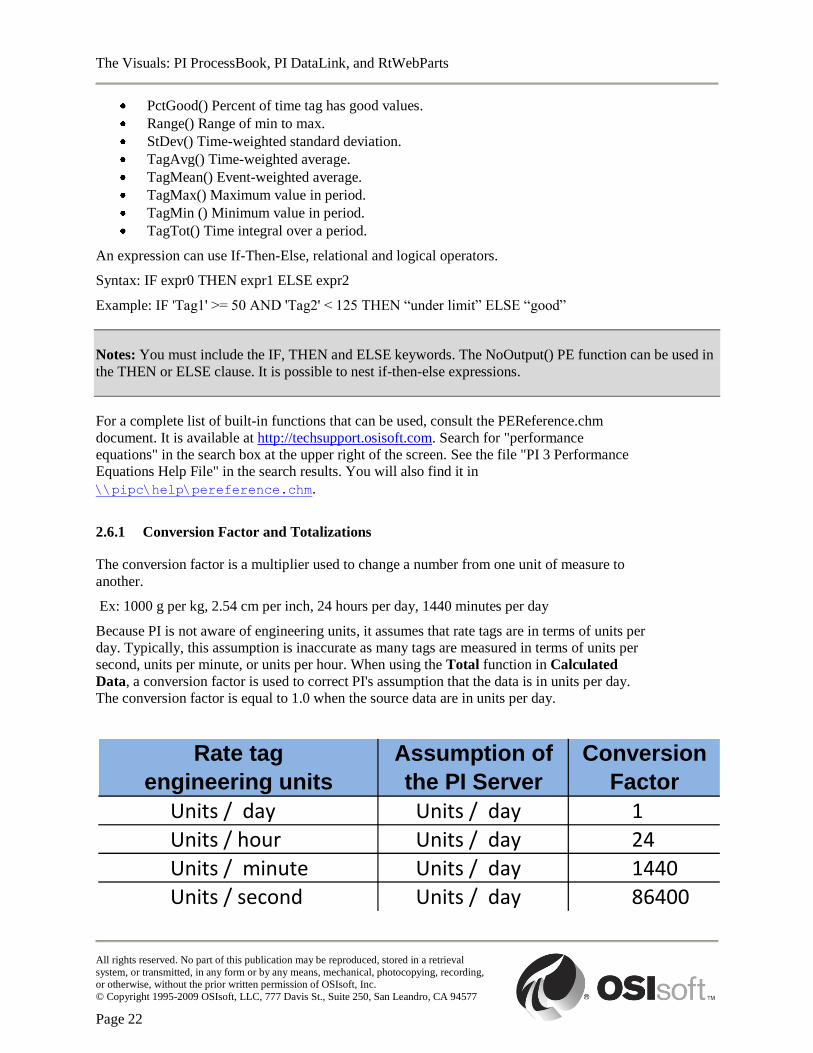
2.6.1 Conversion Factor and Totalizations
The conversion factor is a multiplier used to change a number from one unit of measure to
another.
Ex: 1000 g per kg, 2.54 cm per inch, 24 hours per day, 1440 minutes per day
Because PI is not aware of engineering units, it assumes that rate tags are in terms of units per
day. Typically, this assumption is inaccurate as many tags are measured in terms of units per
second, units per minute, or units per hour. When using the Total function in Calculated
Data, a conversion factor is used to correct PI's assumption that the data is in units per day.
The conversion factor is equal to 1.0 when the source data are in units per day.
Rate tag Assumption of Conversion
engineering units the PI Server Factor
Units / day Units / day 1
Units / hour Units / day 24
Units / minute Units / day 1440
Units / second Units / day 86400
The Visuals: PI ProcessBook, PI DataLink, and RtWebParts
All rights reserved. No part of this publication may be reproduced, stored in a retrieval
system, or transmitted, in any form or by any means, mechanical, photocopying, recording, or otherwise, without the prior written permission of OSIsoft, Inc.
© Copyright 1995-2009 OSIsoft, LLC, 777 Davis St., Suite 250, San Leandro, CA 94577
Page 23
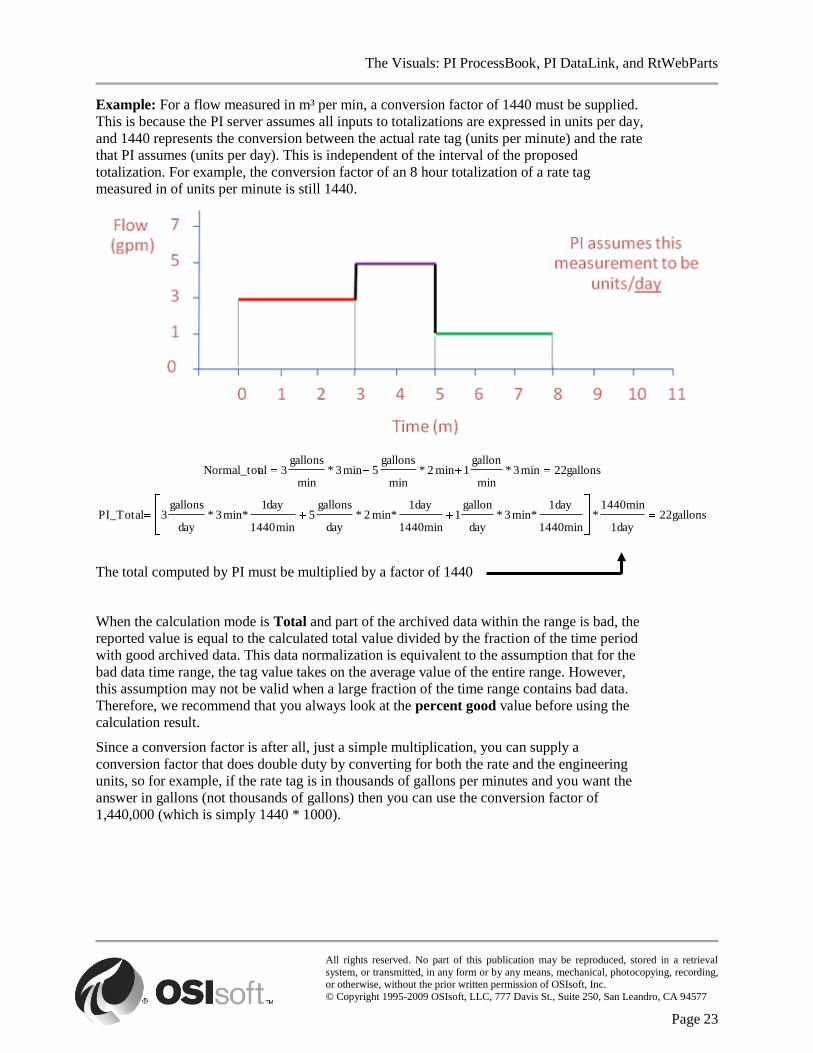
Example: For a flow measured in m³ per min, a conversion factor of 1440 must be supplied.
This is because the PI server assumes all inputs to totalizations are expressed in units per day,
and 1440 represents the conversion between the actual rate tag (units per minute) and the rate
that PI assumes (units per day). This is independent of the interval of the proposed
totalization. For example, the conversion factor of an 8 hour totalization of a rate tag
measured in of units per minute is still 1440.
22gallons1day
1440min*
1440min
1daymin*3*
day
gallon1
1440min
1daymin*2*
day
gallons5
min1440
day1min*3*
day
gallons3PI_Total
gallons22min3*min
gallon1min2*
min
gallons5min3*
min
gallons3alNormal_tot
The total computed by PI must be multiplied by a factor of 1440
When the calculation mode is Total and part of the archived data within the range is bad, the
reported value is equal to the calculated total value divided by the fraction of the time period
with good archived data. This data normalization is equivalent to the assumption that for the
bad data time range, the tag value takes on the average value of the entire range. However,
this assumption may not be valid when a large fraction of the time range contains bad data.
Therefore, we recommend that you always look at the percent good value before using the
calculation result.
Since a conversion factor is after all, just a simple multiplication, you can supply a
conversion factor that does double duty by converting for both the rate and the engineering
units, so for example, if the rate tag is in thousands of gallons per minutes and you want the
answer in gallons (not thousands of gallons) then you can use the conversion factor of
1,440,000 (which is simply 1440 * 1000).
The Visuals: PI ProcessBook, PI DataLink, and RtWebParts
All rights reserved. No part of this publication may be reproduced, stored in a retrieval
system, or transmitted, in any form or by any means, mechanical, photocopying, recording, or otherwise, without the prior written permission of OSIsoft, Inc.
© Copyright 1995-2009 OSIsoft, LLC, 777 Davis St., Suite 250, San Leandro, CA 94577
Page 24
3. PI ProcessBook Basics
PI ProcessBook is a rich environment that allows the creation of dynamic, graphical displays.
Displays can contain a wide range of information including real-time data, historical data, PI
data, and relational or other non-PI data. ProcessBook is also a development environment for
Visual Basic for Applications (VBA). These features allow a wide variety of options to be
configured and customization to be performed.
PI ProcessBook uses the standard Windows type environment that makes functions accessible
from menus and toolbars. There are two modes of operation within ProcessBook, Run Mode
and Build Mode.
Run Mode allows you to:
Default;
Allows you to browse PI ProcessBook (Workbook) elements;
Visualize previously created displays;
Change to Build Mode at any time by selecting Tools > Build or by clicking on the
Build icon in the Drawing toolbar.
Build Mode allows you to:
Build or edit PI ProcessBook (Workbook) elements;
Add or modify elements within an existing display;
Change mode by selecting Tools > Run or by clicking on the Run icon in the
Drawing toolbar.
3.1 PI ProcessBook Display
A PI ProcessBook Display is the main unit for the presentation of data, both PI and non-PI
data. A display can contain a variety of individual items representing your operating
environment. These include static elements for pictorial representations, dynamic elements to
display real-time data, buttons to house VBA coding or other applications, and OLE objects.
ProcessBook Displays may be an independent file (extension .PDI or.SVG) or housed within
a ProcessBook Workbook (extension .PIW), to be covered later. Here is an example of what a
ProcessBook Display can look like:
The Visuals: PI ProcessBook, PI DataLink, and RtWebParts
All rights reserved. No part of this publication may be reproduced, stored in a retrieval
system, or transmitted, in any form or by any means, mechanical, photocopying, recording, or otherwise, without the prior written permission of OSIsoft, Inc.
© Copyright 1995-2009 OSIsoft, LLC, 777 Davis St., Suite 250, San Leandro, CA 94577
Page 25
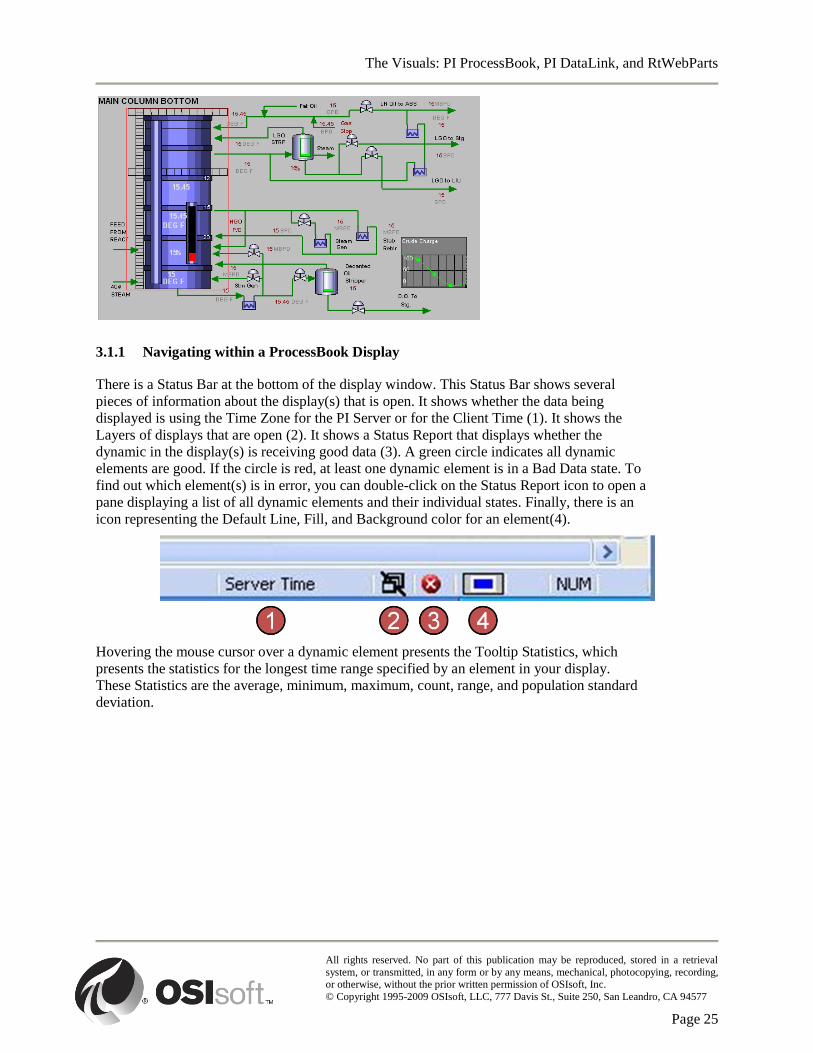
3.1.1 Navigating within a ProcessBook Display
There is a Status Bar at the bottom of the display window. This Status Bar shows several
pieces of information about the display(s) that is open. It shows whether the data being
displayed is using the Time Zone for the PI Server or for the Client Time (1). It shows the
Layers of displays that are open (2). It shows a Status Report that displays whether the
dynamic in the display(s) is receiving good data (3). A green circle indicates all dynamic
elements are good. If the circle is red, at least one dynamic element is in a Bad Data state. To
find out which element(s) is in error, you can double-click on the Status Report icon to open a
pane displaying a list of all dynamic elements and their individual states. Finally, there is an
icon representing the Default Line, Fill, and Background color for an element(4).
Hovering the mouse cursor over a dynamic element presents the Tooltip Statistics, which
presents the statistics for the longest time range specified by an element in your display.
These Statistics are the average, minimum, maximum, count, range, and population standard
deviation.
The Visuals: PI ProcessBook, PI DataLink, and RtWebParts
All rights reserved. No part of this publication may be reproduced, stored in a retrieval
system, or transmitted, in any form or by any means, mechanical, photocopying, recording, or otherwise, without the prior written permission of OSIsoft, Inc.
© Copyright 1995-2009 OSIsoft, LLC, 777 Davis St., Suite 250, San Leandro, CA 94577
Page 26
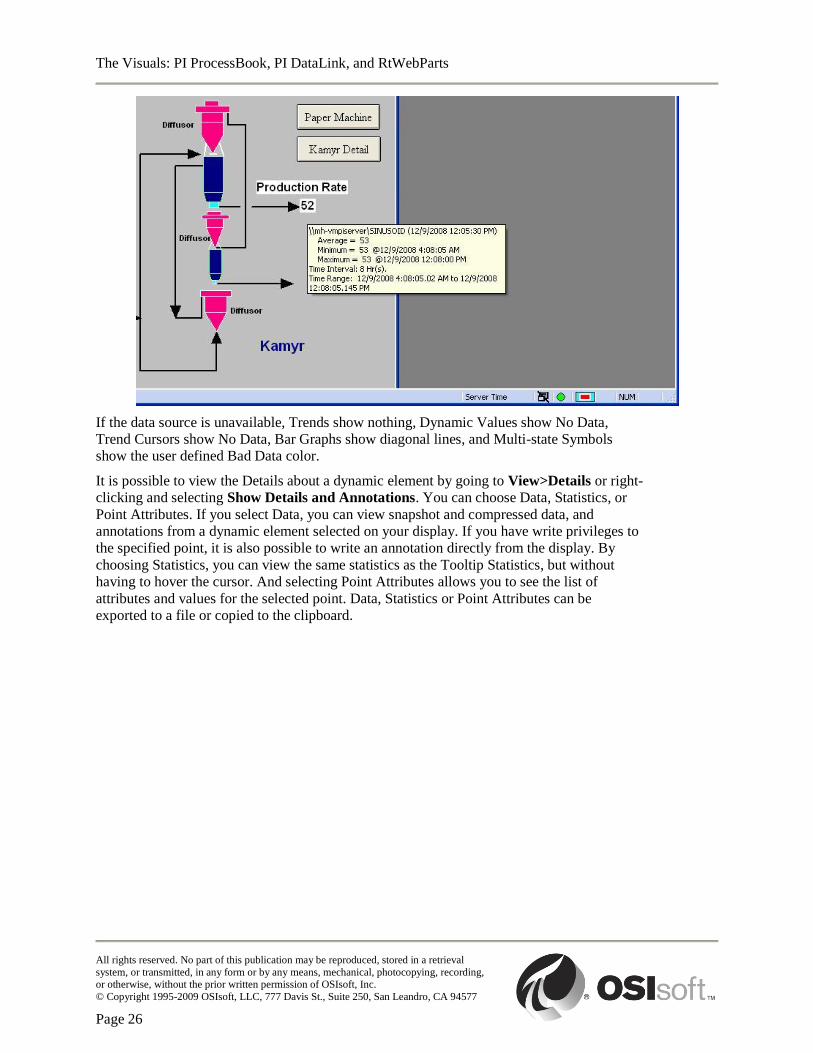
If the data source is unavailable, Trends show nothing, Dynamic Values show No Data,
Trend Cursors show No Data, Bar Graphs show diagonal lines, and Multi-state Symbols
show the user defined Bad Data color.
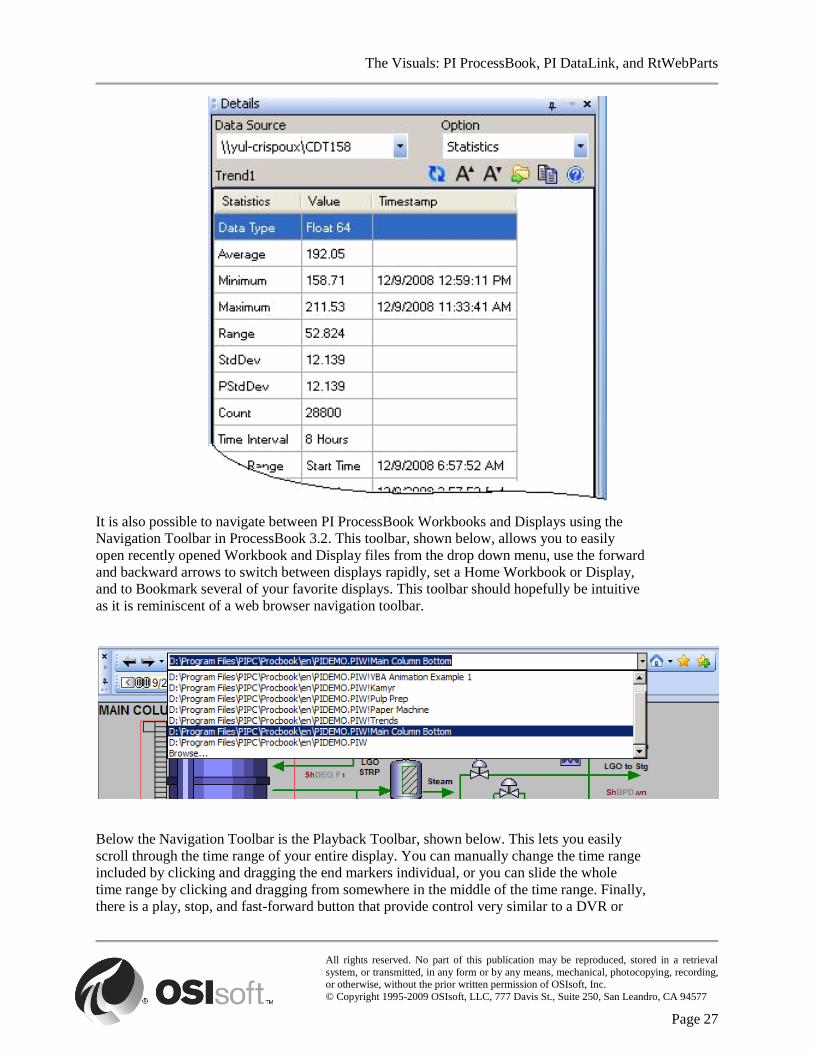
It is possible to view the Details about a dynamic element by going to View>Details or right-
clicking and selecting Show Details and Annotations. You can choose Data, Statistics, or
Point Attributes. If you select Data, you can view snapshot and compressed data, and
annotations from a dynamic element selected on your display. If you have write privileges to
the specified point, it is also possible to write an annotation directly from the display. By
choosing Statistics, you can view the same statistics as the Tooltip Statistics, but without
having to hover the cursor. And selecting Point Attributes allows you to see the list of
attributes and values for the selected point. Data, Statistics or Point Attributes can be
exported to a file or copied to the clipboard.
The Visuals: PI ProcessBook, PI DataLink, and RtWebParts
All rights reserved. No part of this publication may be reproduced, stored in a retrieval
system, or transmitted, in any form or by any means, mechanical, photocopying, recording, or otherwise, without the prior written permission of OSIsoft, Inc.
© Copyright 1995-2009 OSIsoft, LLC, 777 Davis St., Suite 250, San Leandro, CA 94577
Page 27
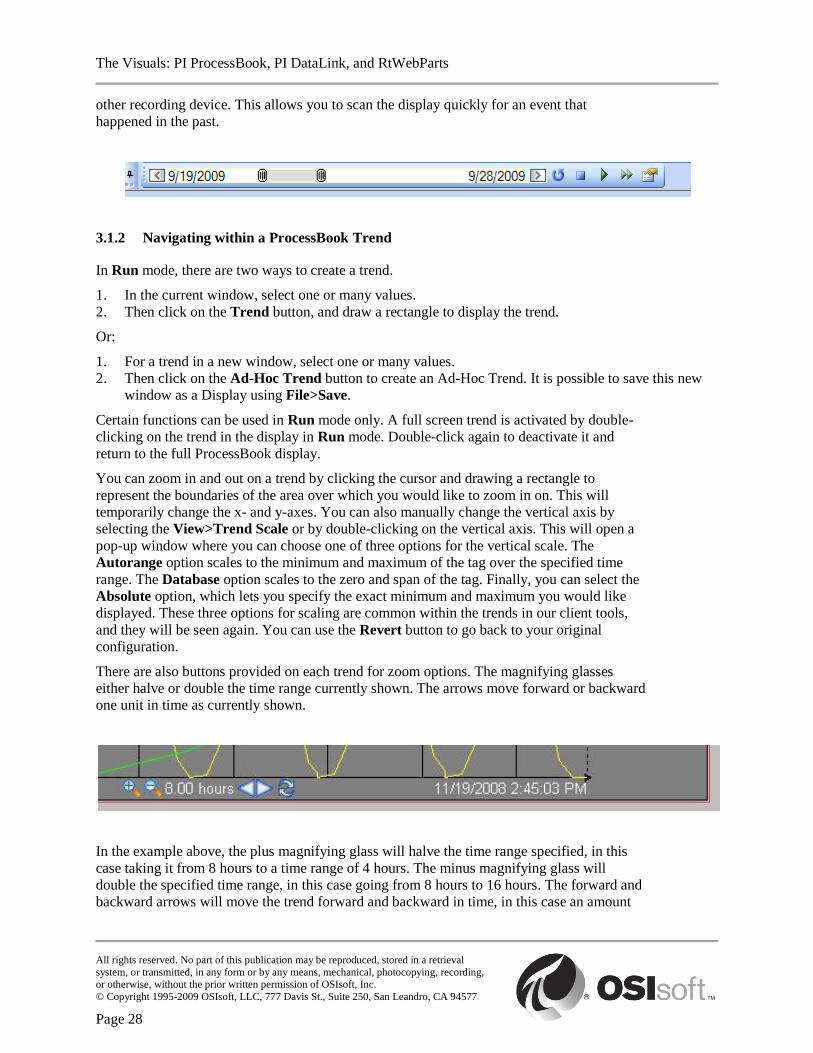
It is also possible to navigate between PI ProcessBook Workbooks and Displays using the
Navigation Toolbar in ProcessBook 3.2. This toolbar, shown below, allows you to easily
open recently opened Workbook and Display files from the drop down menu, use the forward
and backward arrows to switch between displays rapidly, set a Home Workbook or Display,
and to Bookmark several of your favorite displays. This toolbar should hopefully be intuitive
as it is reminiscent of a web browser navigation toolbar.
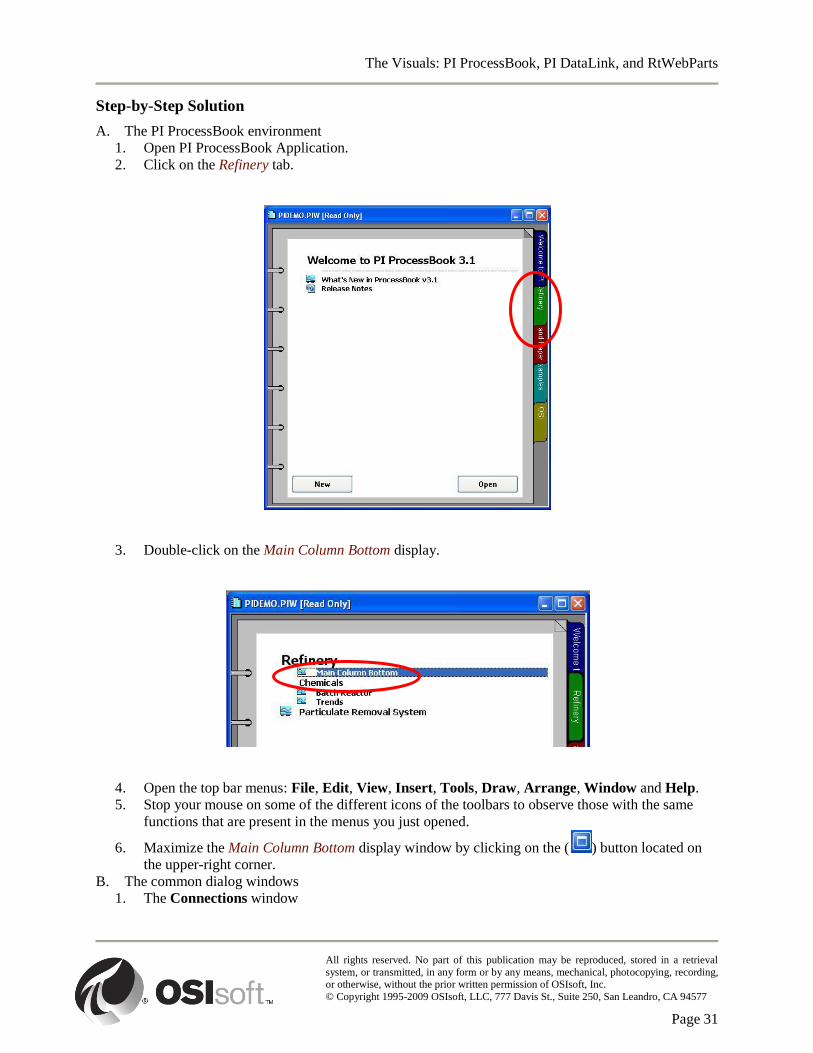
Below the Navigation Toolbar is the Playback Toolbar, shown below. This lets you easily
scroll through the time range of your entire display. You can manually change the time range
included by clicking and dragging the end markers individual, or you can slide the whole
time range by clicking and dragging from somewhere in the middle of the time range. Finally,
there is a play, stop, and fast-forward button that provide control very similar to a DVR or
The Visuals: PI ProcessBook, PI DataLink, and RtWebParts
All rights reserved. No part of this publication may be reproduced, stored in a retrieval
system, or transmitted, in any form or by any means, mechanical, photocopying, recording, or otherwise, without the prior written permission of OSIsoft, Inc.
© Copyright 1995-2009 OSIsoft, LLC, 777 Davis St., Suite 250, San Leandro, CA 94577
Page 28
other recording device. This allows you to scan the display quickly for an event that
happened in the past.
3.1.2 Navigating within a ProcessBook Trend
In Run mode, there are two ways to create a trend.
1. In the current window, select one or many values.
2. Then click on the Trend button, and draw a rectangle to display the trend.
Or:
1. For a trend in a new window, select one or many values.
2. Then click on the Ad-Hoc Trend button to create an Ad-Hoc Trend. It is possible to save this new
window as a Display using File>Save.
Certain functions can be used in Run mode only. A full screen trend is activated by double-
clicking on the trend in the display in Run mode. Double-click again to deactivate it and
return to the full ProcessBook display.
You can zoom in and out on a trend by clicking the cursor and drawing a rectangle to
represent the boundaries of the area over which you would like to zoom in on. This will
temporarily change the x- and y-axes. You can also manually change the vertical axis by
selecting the View>Trend Scale or by double-clicking on the vertical axis. This will open a
pop-up window where you can choose one of three options for the vertical scale. The
Autorange option scales to the minimum and maximum of the tag over the specified time
range. The Database option scales to the zero and span of the tag. Finally, you can select the
Absolute option, which lets you specify the exact minimum and maximum you would like
displayed. These three options for scaling are common within the trends in our client tools,
and they will be seen again. You can use the Revert button to go back to your original
configuration.
There are also buttons provided on each trend for zoom options. The magnifying glasses
either halve or double the time range currently shown. The arrows move forward or backward
one unit in time as currently shown.
In the example above, the plus magnifying glass will halve the time range specified, in this
case taking it from 8 hours to a time range of 4 hours. The minus magnifying glass will
double the specified time range, in this case going from 8 hours to 16 hours. The forward and
backward arrows will move the trend forward and backward in time, in this case an amount

The Visuals: PI ProcessBook, PI DataLink, and RtWebParts
All rights reserved. No part of this publication may be reproduced, stored in a retrieval
system, or transmitted, in any form or by any means, mechanical, photocopying, recording, or otherwise, without the prior written permission of OSIsoft, Inc.
© Copyright 1995-2009 OSIsoft, LLC, 777 Davis St., Suite 250, San Leandro, CA 94577
Page 29
of 8 hours. Finally, there is also a Revert button provided to return the trend to its original
configuration.
Finally, you can use the menu or toolbar to change the time range of the trend. To change it
from the toolbar, use the Change Time Range icon. To change the time range from the
menu, you must select View> Time Range. Either of these will open a pop-up window that
allows you to specify the start time (the From parameter) and end time (the To parameter) in
either PI Absolute or Combined time. It is important to note that for your trend to receive
automatic updates that the end time must be now (*) and that the time range must be 24 hours
or less. In the toolbar, there is a scroll bar that lets you scroll forward and backward in time.
This is especially useful if you are looking for a significant event, but are unsure at what time
the event occurred. This way you can just scroll until you find it.
Trend cursors are static indicators that display the timestamp and value(s). You can have
multiple trend cursors per trend, and they can display values for multiple traces (tags). To
activate a cursor, just click on the edge of the trend and drag to the point of interest on the
trend. You can also set them manually from the toolbar by clicking on the Trend Cursor
icon.
Traces can be shown or hidden by clicking on the tag name in the legend or by right-clicking
on Trend > Trend Traces. Traces can be shown or hidden individually or all at once.
Changes made in View mode are temporary. To make any changes permanent, you must be
in Build mode and save the display.
3.1.3 Exercise – PI ProcessBook Basics
The following exercise is intended to reinforce key information presented in this
chapter or section. The answer can be found at the end of the exercise.
Objectives
Familiarize yourself with the Common Dialog Windows;
Familiarize yourself with the PI ProcessBook environment;
Learn how to manipulate a trend display using an existing ProcessBook file;
Find data, statistics and annotations related to tags.
Problem Description
Open the PI ProcessBook application and establish a connection to a PI server given to you
by your instructor.
PI Server
Username
The default workbook PIDEMO.PIW opens. Open the Main Column Bottom display and
familiarize yourself with the different windows, options and functions. Within the four

The Visuals: PI ProcessBook, PI DataLink, and RtWebParts
All rights reserved. No part of this publication may be reproduced, stored in a retrieval
system, or transmitted, in any form or by any means, mechanical, photocopying, recording, or otherwise, without the prior written permission of OSIsoft, Inc.
© Copyright 1995-2009 OSIsoft, LLC, 777 Davis St., Suite 250, San Leandro, CA 94577
Page 30
different sections below, you will explore all those essential items and will be able to fulfill
the objectives.
A. The PI ProcessBook Environment:
1. Open the different top bar menus to have a taste of the different functions available;
2. Observe the different toolbars that contain the same functions you just saw in the menus;
3. Maximize the Main Column Bottom display.
B. The common dialog windows:
1. Open the Connections window and connect to your PI server (hint: Use the File menu);
2. Open the Tag Search window and find all tags that begin with the letter b, all tags that contain
the word reactor in their descriptor and all tags that have a value of zero (hint: Use the Tools
menu).
C. The Trend display:
1. Maximize the Crude Charge trend;
2. Zoom in and out of the trend;
3. Change the time scale to 1 day;
4. Go backward and forward in time by one or by several time periods;
5. Find when the maximum value was attained for the current time range (Hint: Use the Trend
Cursor);
6. Revert back to the original time scale;
7. Highlight the trace of the trend;
8. Hide the trace of the trend and then make it appear again.
D. The details and annotations:
1. Point the mouse directly on the trend trace and wait until you can observe the ToolTip yellow
window;
2. Point other symbols from the display and wait until you can observe the ToolTip yellow window;
3. Right-click on the trend and click Show Details and Annotations;
4. Observe the Data, Statistics and Point Attributes for the trend;
5. Validate the timestamp you just found for the maximum value;
6. Refresh the Data displayed;
7. Save the Statistics to a file;
8. Copy the Point Attributes and paste them in a Microsoft Excel spreadsheet;
9. Add an annotation to the latest value to indicate an out of range value.
Try to do this exercise on your own before proceeding to the step-by-step solution.
The Visuals: PI ProcessBook, PI DataLink, and RtWebParts
All rights reserved. No part of this publication may be reproduced, stored in a retrieval
system, or transmitted, in any form or by any means, mechanical, photocopying, recording, or otherwise, without the prior written permission of OSIsoft, Inc.
© Copyright 1995-2009 OSIsoft, LLC, 777 Davis St., Suite 250, San Leandro, CA 94577
Page 31
Step-by-Step Solution
A. The PI ProcessBook environment
1. Open PI ProcessBook Application.
2. Click on the Refinery tab.
3. Double-click on the Main Column Bottom display.
4. Open the top bar menus: File, Edit, View, Insert, Tools, Draw, Arrange, Window and Help.
5. Stop your mouse on some of the different icons of the toolbars to observe those with the same
functions that are present in the menus you just opened.
6. Maximize the Main Column Bottom display window by clicking on the ( ) button located on
the upper-right corner.
B. The common dialog windows
1. The Connections window
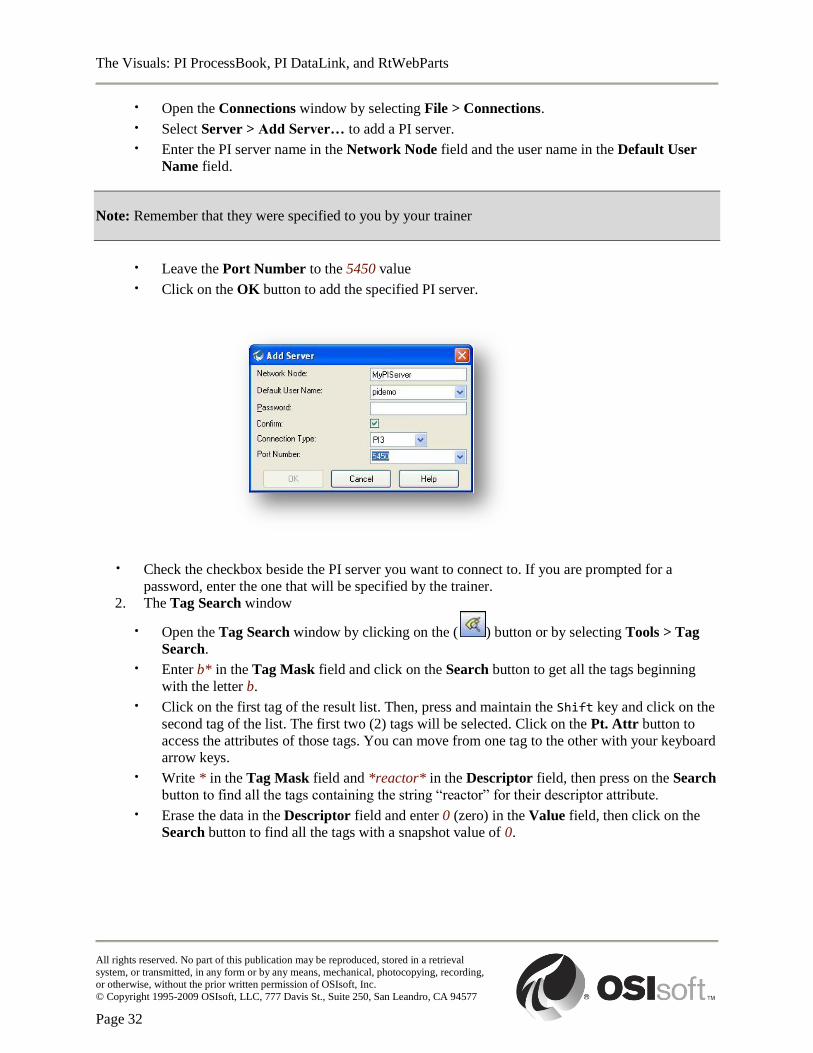
The Visuals: PI ProcessBook, PI DataLink, and RtWebParts
All rights reserved. No part of this publication may be reproduced, stored in a retrieval
system, or transmitted, in any form or by any means, mechanical, photocopying, recording, or otherwise, without the prior written permission of OSIsoft, Inc.
© Copyright 1995-2009 OSIsoft, LLC, 777 Davis St., Suite 250, San Leandro, CA 94577
Page 32
· Open the Connections window by selecting File > Connections.
· Select Server > Add Server… to add a PI server.
· Enter the PI server name in the Network Node field and the user name in the Default User
Name field.
Note: Remember that they were specified to you by your trainer
· Leave the Port Number to the 5450 value
· Click on the OK button to add the specified PI server.
· Check the checkbox beside the PI server you want to connect to. If you are prompted for a
password, enter the one that will be specified by the trainer.
2. The Tag Search window
· Open the Tag Search window by clicking on the ( ) button or by selecting Tools > Tag
Search.
· Enter b* in the Tag Mask field and click on the Search button to get all the tags beginning
with the letter b.
· Click on the first tag of the result list. Then, press and maintain the Shift key and click on the
second tag of the list. The first two (2) tags will be selected. Click on the Pt. Attr button to
access the attributes of those tags. You can move from one tag to the other with your keyboard
arrow keys.
· Write * in the Tag Mask field and *reactor* in the Descriptor field, then press on the Search
button to find all the tags containing the string “reactor” for their descriptor attribute.
· Erase the data in the Descriptor field and enter 0 (zero) in the Value field, then click on the
Search button to find all the tags with a snapshot value of 0.
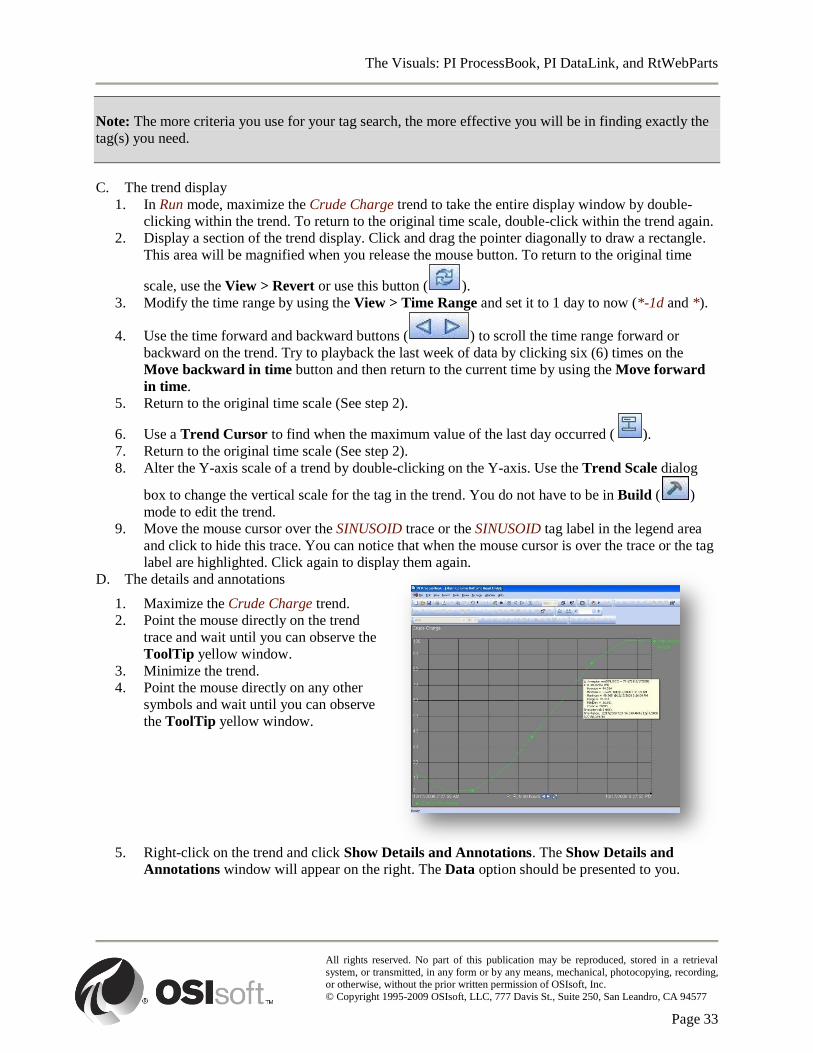
The Visuals: PI ProcessBook, PI DataLink, and RtWebParts
All rights reserved. No part of this publication may be reproduced, stored in a retrieval
system, or transmitted, in any form or by any means, mechanical, photocopying, recording, or otherwise, without the prior written permission of OSIsoft, Inc.
© Copyright 1995-2009 OSIsoft, LLC, 777 Davis St., Suite 250, San Leandro, CA 94577
Page 33
Note: The more criteria you use for your tag search, the more effective you will be in finding exactly the
tag(s) you need.
C. The trend display
1. In Run mode, maximize the Crude Charge trend to take the entire display window by double-
clicking within the trend. To return to the original time scale, double-click within the trend again.
2. Display a section of the trend display. Click and drag the pointer diagonally to draw a rectangle.
This area will be magnified when you release the mouse button. To return to the original time
scale, use the View > Revert or use this button ( ).
3. Modify the time range by using the View > Time Range and set it to 1 day to now (*-1d and *).
4. Use the time forward and backward buttons ( ) to scroll the time range forward or
backward on the trend. Try to playback the last week of data by clicking six (6) times on the
Move backward in time button and then return to the current time by using the Move forward
in time.
5. Return to the original time scale (See step 2).
6. Use a Trend Cursor to find when the maximum value of the last day occurred ( ).
7. Return to the original time scale (See step 2).
8. Alter the Y-axis scale of a trend by double-clicking on the Y-axis. Use the Trend Scale dialog
box to change the vertical scale for the tag in the trend. You do not have to be in Build ( )
mode to edit the trend.
9. Move the mouse cursor over the SINUSOID trace or the SINUSOID tag label in the legend area
and click to hide this trace. You can notice that when the mouse cursor is over the trace or the tag
label are highlighted. Click again to display them again.
D. The details and annotations
1. Maximize the Crude Charge trend.
2. Point the mouse directly on the trend
trace and wait until you can observe the
ToolTip yellow window.
3. Minimize the trend.
4. Point the mouse directly on any other
symbols and wait until you can observe
the ToolTip yellow window.
5. Right-click on the trend and click Show Details and Annotations. The Show Details and
Annotations window will appear on the right. The Data option should be presented to you.
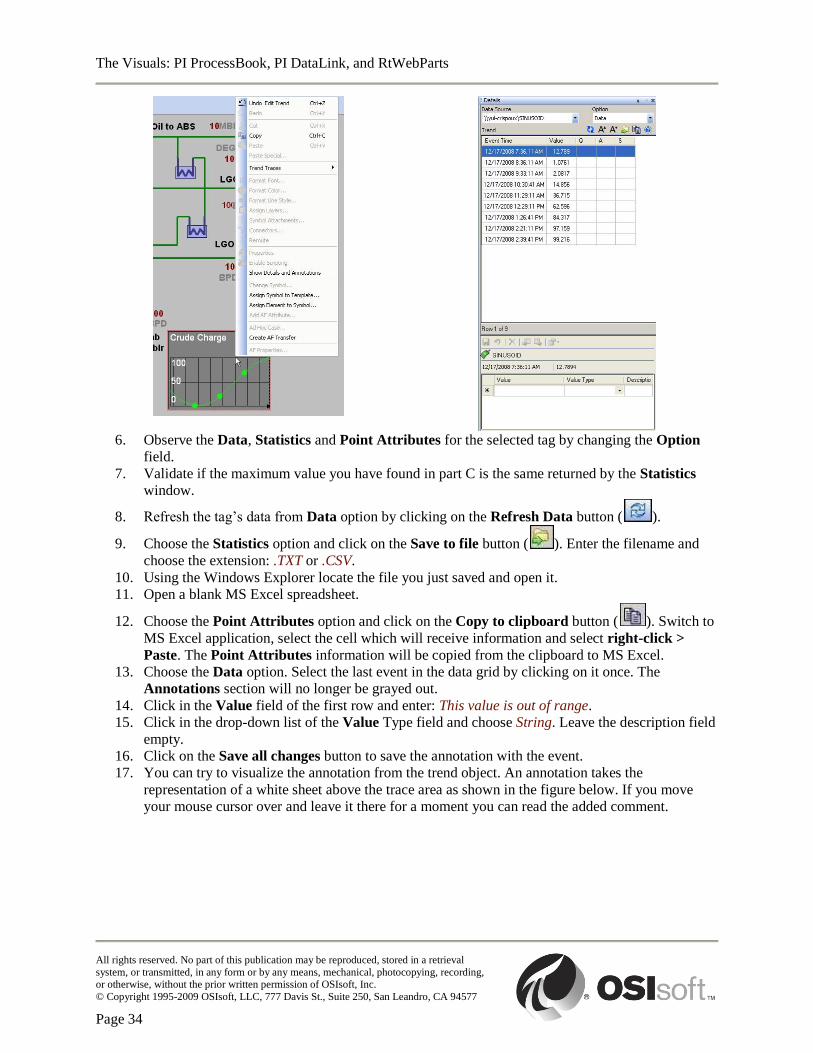
The Visuals: PI ProcessBook, PI DataLink, and RtWebParts
All rights reserved. No part of this publication may be reproduced, stored in a retrieval
system, or transmitted, in any form or by any means, mechanical, photocopying, recording, or otherwise, without the prior written permission of OSIsoft, Inc.
© Copyright 1995-2009 OSIsoft, LLC, 777 Davis St., Suite 250, San Leandro, CA 94577
Page 34
6. Observe the Data, Statistics and Point Attributes for the selected tag by changing the Option
field.
7. Validate if the maximum value you have found in part C is the same returned by the Statistics
window.
8. Refresh the tag‟s data from Data option by clicking on the Refresh Data button ( ).
9. Choose the Statistics option and click on the Save to file button ( ). Enter the filename and
choose the extension: .TXT or .CSV.
10. Using the Windows Explorer locate the file you just saved and open it.
11. Open a blank MS Excel spreadsheet.
12. Choose the Point Attributes option and click on the Copy to clipboard button ( ). Switch to
MS Excel application, select the cell which will receive information and select right-click >
Paste. The Point Attributes information will be copied from the clipboard to MS Excel.
13. Choose the Data option. Select the last event in the data grid by clicking on it once. The
Annotations section will no longer be grayed out.
14. Click in the Value field of the first row and enter: This value is out of range.
15. Click in the drop-down list of the Value Type field and choose String. Leave the description field
empty.
16. Click on the Save all changes button to save the annotation with the event.
17. You can try to visualize the annotation from the trend object. An annotation takes the
representation of a white sheet above the trace area as shown in the figure below. If you move
your mouse cursor over and leave it there for a moment you can read the added comment.
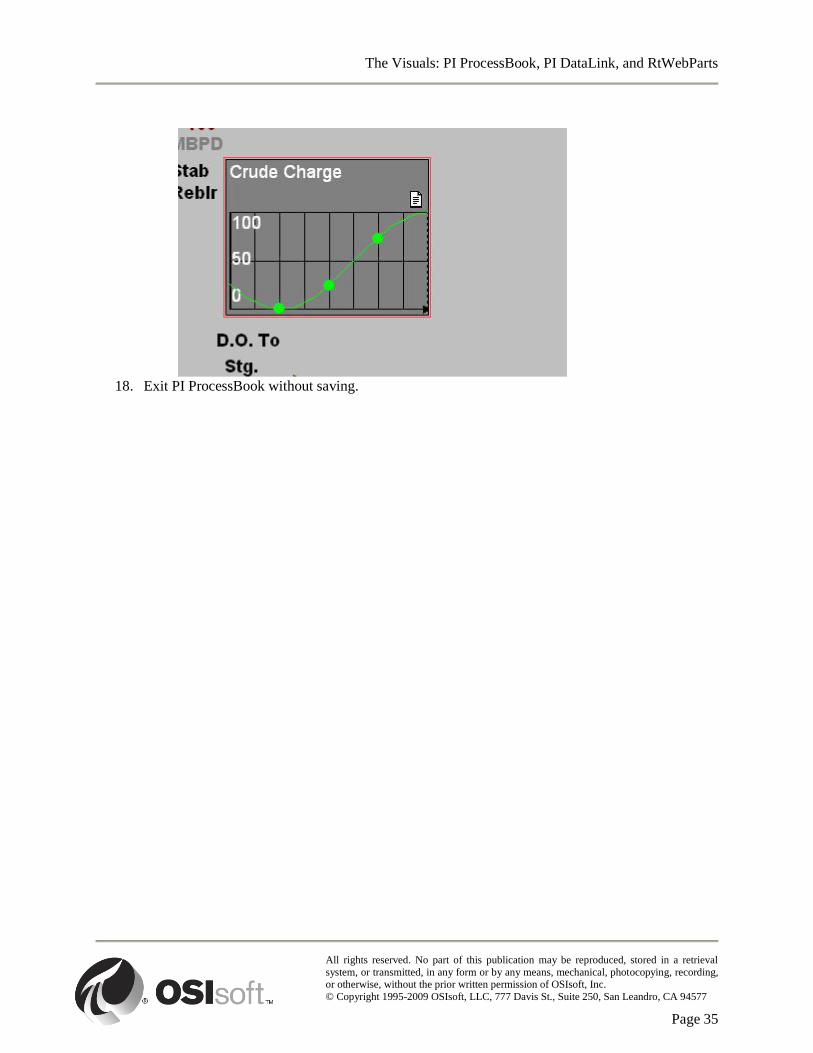
The Visuals: PI ProcessBook, PI DataLink, and RtWebParts
All rights reserved. No part of this publication may be reproduced, stored in a retrieval
system, or transmitted, in any form or by any means, mechanical, photocopying, recording, or otherwise, without the prior written permission of OSIsoft, Inc.
© Copyright 1995-2009 OSIsoft, LLC, 777 Davis St., Suite 250, San Leandro, CA 94577
Page 35
18. Exit PI ProcessBook without saving.

The Visuals: PI ProcessBook, PI DataLink, and RtWebParts
All rights reserved. No part of this publication may be reproduced, stored in a retrieval
system, or transmitted, in any form or by any means, mechanical, photocopying, recording, or otherwise, without the prior written permission of OSIsoft, Inc.
© Copyright 1995-2009 OSIsoft, LLC, 777 Davis St., Suite 250, San Leandro, CA 94577
Page 36
3.2 Building a PI ProcessBook Independent Display with Static Elements
To create a new ProcessBook file use File > New or the New icon. From here, you can create
new ProcessBook Displays, ProcessBook Workbooks, or ProcessBook Entries. For now, we
will focus on Independent Displays and return to Workbooks and Entries later. The easiest
ways to conceive of ProcessBook Displays are that they are individual sheets, similar to
memos. Workbooks are entire books that are composed of many of these sheets, but to put
these sheets in the book, we need to create individual Entries. Again, more will be covered on
Workbooks and Entries later.
A display can contain a wide variety of elements, both static and dynamic. To add any of
these elements to a display, you must be in Build mode, and then select the desired element.
Draw it on the display and define its configuration when prompted. For now, we will focus
on the static elements.
The static objects available include shapes, lines, and text boxes. ProcessBook does come
with its own Symbol Library that includes many familiar process symbols. These include
things like tanks, values, and heat exchangers. If this Symbol Library is insufficient, you can
also import graphics from files. This provides you greater options for customization. The
majority of the static elements have options similar or identical to many Paint programs.
Things like grouping, alignment, stacking, rotation, and attachments. Just like these Paint
programs, you can do multiple object selection by clicking and dragging, using the Control
key, or using the Shift key.
The symbol library button allows access to a rich library of symbols. To access the symbol
library, use the Symbol Library icon from the toolbar or Draw> Symbol Library from the
menu. Similarly, to import an image file into a display, use the Graphic button in the toolbar
or select Draw > Graphic from the menu.
3.2.1 Group Recap Questions
The following questions are intended to reinforce key information presented in this
chapter or section. The answers can be found after the questions.
Questions
1. What two user interface elements allow you to change the start time and end time of a Trend or XY
Plot in Run mode?
2. Which one of these statements is false:
· In Run mode, both the vertical scale and the time scale of a trend element can be changed.
· After changing the display in Run mode, the modifications will be saved if we do not use the
Revert function before saving the file.
· The status report will indicate all tags used in the display that are in error and their associated
ProcessBook elements.
3. What type of information can be stored within an annotation?
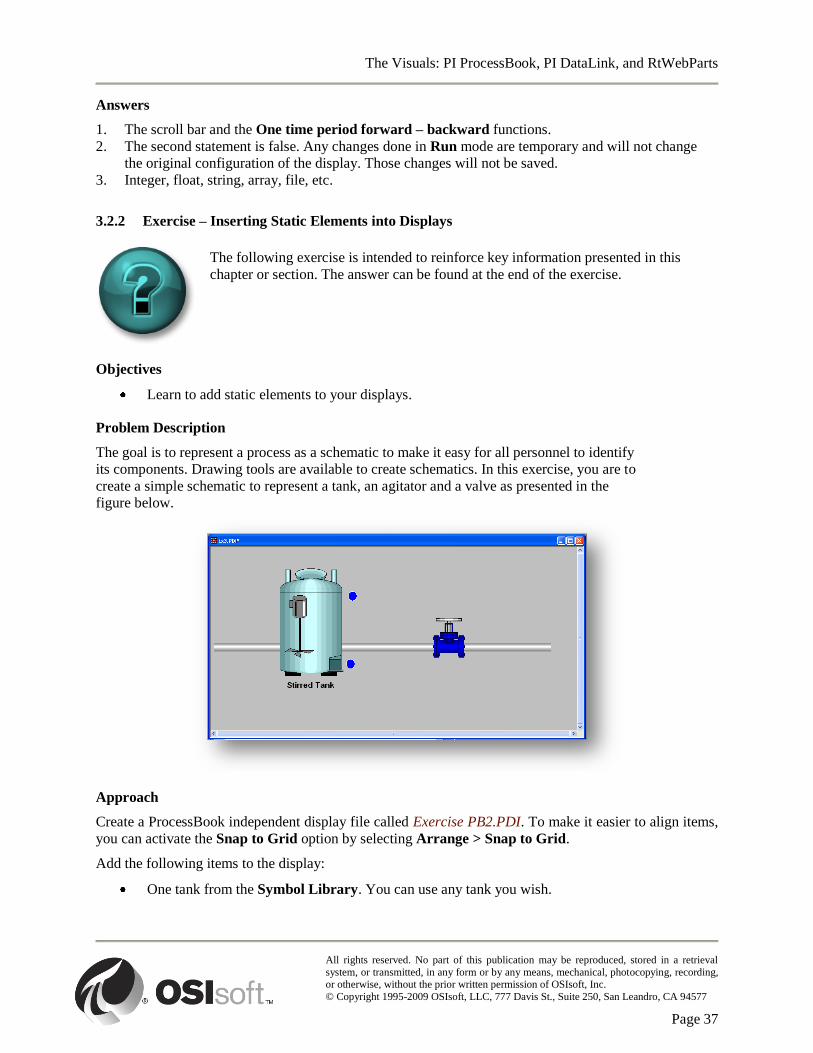
The Visuals: PI ProcessBook, PI DataLink, and RtWebParts
All rights reserved. No part of this publication may be reproduced, stored in a retrieval
system, or transmitted, in any form or by any means, mechanical, photocopying, recording, or otherwise, without the prior written permission of OSIsoft, Inc.
© Copyright 1995-2009 OSIsoft, LLC, 777 Davis St., Suite 250, San Leandro, CA 94577
Page 37
Answers
1. The scroll bar and the One time period forward – backward functions.
2. The second statement is false. Any changes done in Run mode are temporary and will not change
the original configuration of the display. Those changes will not be saved.
3. Integer, float, string, array, file, etc.
3.2.2 Exercise – Inserting Static Elements into Displays
The following exercise is intended to reinforce key information presented in this
chapter or section. The answer can be found at the end of the exercise.
Objectives
Learn to add static elements to your displays.
Problem Description
The goal is to represent a process as a schematic to make it easy for all personnel to identify
its components. Drawing tools are available to create schematics. In this exercise, you are to
create a simple schematic to represent a tank, an agitator and a valve as presented in the
figure below.
Approach
Create a ProcessBook independent display file called Exercise PB2.PDI. To make it easier to align items,
you can activate the Snap to Grid option by selecting Arrange > Snap to Grid.
Add the following items to the display:
One tank from the Symbol Library. You can use any tank you wish.

The Visuals: PI ProcessBook, PI DataLink, and RtWebParts
All rights reserved. No part of this publication may be reproduced, stored in a retrieval
system, or transmitted, in any form or by any means, mechanical, photocopying, recording, or otherwise, without the prior written permission of OSIsoft, Inc.
© Copyright 1995-2009 OSIsoft, LLC, 777 Davis St., Suite 250, San Leandro, CA 94577
Page 38
One horizontal pipe from the Symbol Library going into the tank and one pipe
going out. If you wish you can draw one long pipe and set the tank over it, so it
appears to pass behind it.
One text box labeling the tank Stirred Tank. Place this near the tank. You may wish
to alter the color and size of the text for visibility.
One mixer from the Symbol Library. Place this over the tank.
One valve from the Symbol Library. Place this over the pipe, so it appears that the
valve is in line with the pipe flow.
There are many possible solutions – yours does not have to look exactly like this. Feel free to improvise
and be creative with your display.
Try to do this exercise on your own before proceeding to the step-by-step solution.
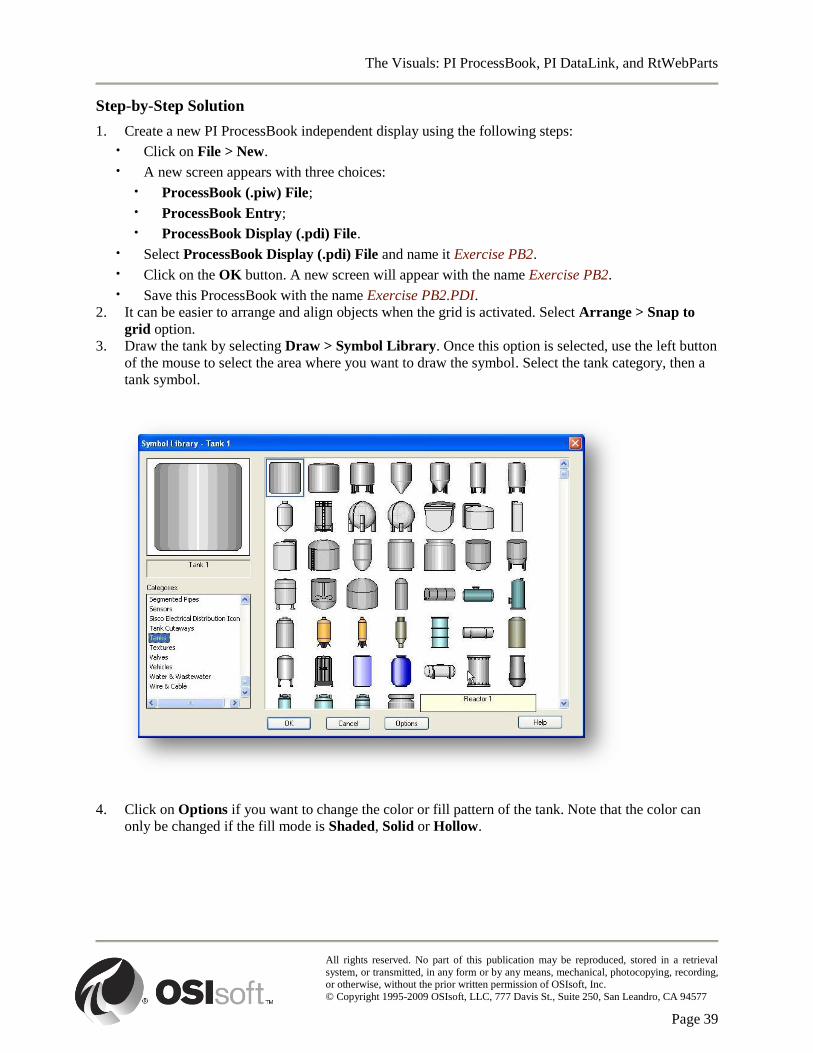
The Visuals: PI ProcessBook, PI DataLink, and RtWebParts
All rights reserved. No part of this publication may be reproduced, stored in a retrieval
system, or transmitted, in any form or by any means, mechanical, photocopying, recording, or otherwise, without the prior written permission of OSIsoft, Inc.
© Copyright 1995-2009 OSIsoft, LLC, 777 Davis St., Suite 250, San Leandro, CA 94577
Page 39
Step-by-Step Solution
1. Create a new PI ProcessBook independent display using the following steps:
· Click on File > New.
· A new screen appears with three choices:
· ProcessBook (.piw) File;
· ProcessBook Entry;
· ProcessBook Display (.pdi) File.
· Select ProcessBook Display (.pdi) File and name it Exercise PB2.
· Click on the OK button. A new screen will appear with the name Exercise PB2.
· Save this ProcessBook with the name Exercise PB2.PDI.
2. It can be easier to arrange and align objects when the grid is activated. Select Arrange > Snap to
grid option.
3. Draw the tank by selecting Draw > Symbol Library. Once this option is selected, use the left button
of the mouse to select the area where you want to draw the symbol. Select the tank category, then a
tank symbol.
4. Click on Options if you want to change the color or fill pattern of the tank. Note that the color can
only be changed if the fill mode is Shaded, Solid or Hollow.
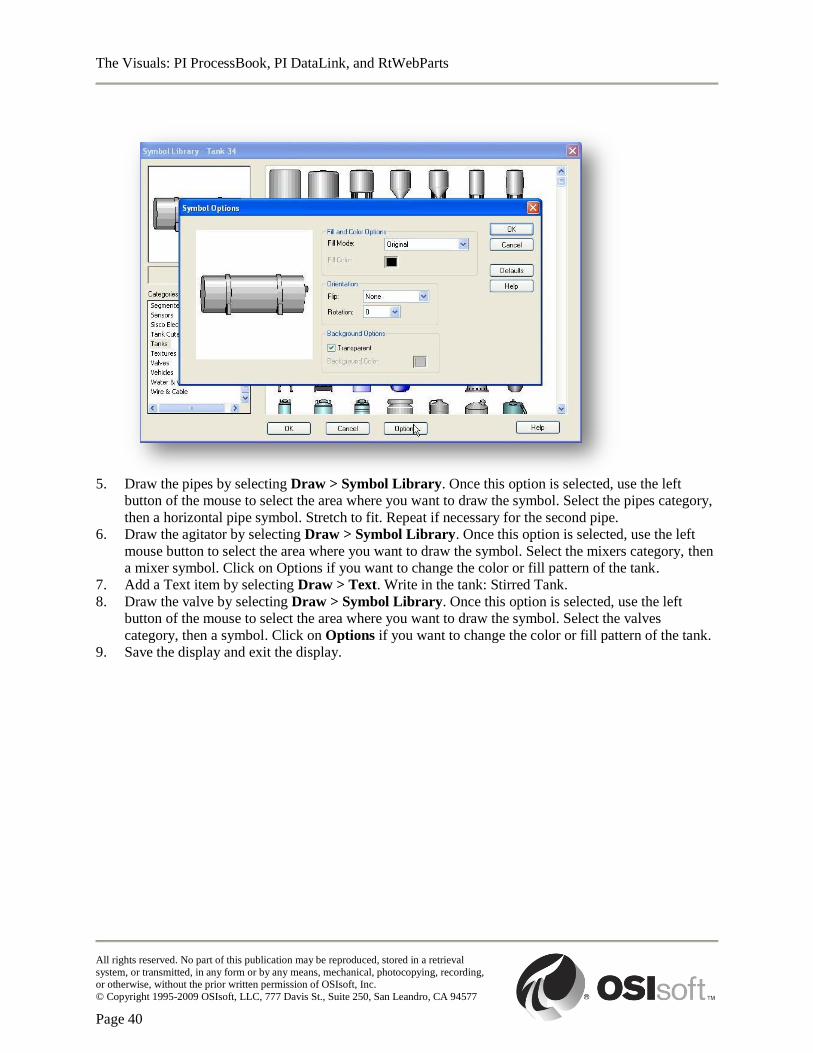
The Visuals: PI ProcessBook, PI DataLink, and RtWebParts
All rights reserved. No part of this publication may be reproduced, stored in a retrieval
system, or transmitted, in any form or by any means, mechanical, photocopying, recording, or otherwise, without the prior written permission of OSIsoft, Inc.
© Copyright 1995-2009 OSIsoft, LLC, 777 Davis St., Suite 250, San Leandro, CA 94577
Page 40
5. Draw the pipes by selecting Draw > Symbol Library. Once this option is selected, use the left
button of the mouse to select the area where you want to draw the symbol. Select the pipes category,
then a horizontal pipe symbol. Stretch to fit. Repeat if necessary for the second pipe.
6. Draw the agitator by selecting Draw > Symbol Library. Once this option is selected, use the left
mouse button to select the area where you want to draw the symbol. Select the mixers category, then
a mixer symbol. Click on Options if you want to change the color or fill pattern of the tank.
7. Add a Text item by selecting Draw > Text. Write in the tank: Stirred Tank.
8. Draw the valve by selecting Draw > Symbol Library. Once this option is selected, use the left
button of the mouse to select the area where you want to draw the symbol. Select the valves
category, then a symbol. Click on Options if you want to change the color or fill pattern of the tank.
9. Save the display and exit the display.
The Visuals: PI ProcessBook, PI DataLink, and RtWebParts
All rights reserved. No part of this publication may be reproduced, stored in a retrieval
system, or transmitted, in any form or by any means, mechanical, photocopying, recording, or otherwise, without the prior written permission of OSIsoft, Inc.
© Copyright 1995-2009 OSIsoft, LLC, 777 Davis St., Suite 250, San Leandro, CA 94577
Page 41
4. PI DataLink Basics
PI DataLink is an OSIsoft add-in for Microsoft Excel (and Lotus 1-2-3). This add-in lets you
import data from the PI System into a spreadsheet for further analysis. As the name implies, it
provides a link between the PI Server and spreadsheet programs running on Microsoft
Windows platforms. With PI DataLink, a user running Microsoft Excel or Lotus 1-2-3 can
exchange information directly with the PI System databases. This feature, combined with the
functionality of the spreadsheet programs themselves, make PI DataLink a powerful and
easy-to-use tool for gathering, analyzing, and reporting PI data. DataLink does this by
providing functions to query the PI Server for current and historical values, as well as
calculated data. You can also use DataLink to create trends involving PI and non-PI data.
And like PI ProcessBook, PI DataLink can tie into the PI Module Database for an alternate
way to find tags, which will be covered later.
It is important to note that DataLink 4.X and later is fully compatible with Excel 2007 and
uses the new Ribbon functionality, introducing a new Ribbon called PI. Older versions of
DataLink and version DataLink 4.X are still compatible with older versions of Excel, but the
functions will be presented in a menu format instead. The visuals provided are all for Excel
2007 and DataLink 4.X.
It is also important to note that PI DataLink is an add-in for Excel. For versions of DataLink
3.X and less, this means that even after installing the PI DataLink software, you must still
locate the add-in and manually add it in to Excel. The add-in is located in \\PIPC\Excel.
By default, the PIPC directory is in Program Files, but this is customizable, so you will need
to know where it is on each machine. For versions 4.X and later, the add-in is automatically
installed during the installation process.
4.1 DataLink Navigation
You can change all of the settings for DataLink by going to the Settings icon in the Resources
section of the PI ribbon.
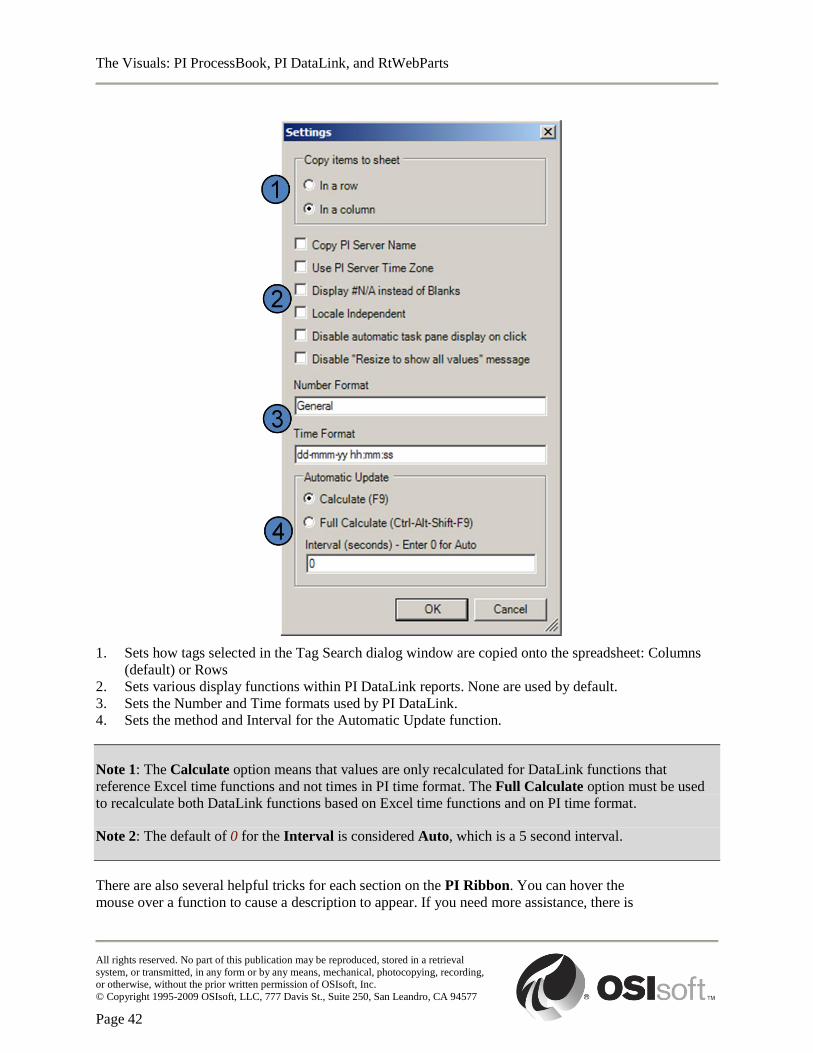
The Visuals: PI ProcessBook, PI DataLink, and RtWebParts
All rights reserved. No part of this publication may be reproduced, stored in a retrieval
system, or transmitted, in any form or by any means, mechanical, photocopying, recording, or otherwise, without the prior written permission of OSIsoft, Inc.
© Copyright 1995-2009 OSIsoft, LLC, 777 Davis St., Suite 250, San Leandro, CA 94577
Page 42
1. Sets how tags selected in the Tag Search dialog window are copied onto the spreadsheet: Columns
(default) or Rows
2. Sets various display functions within PI DataLink reports. None are used by default.
3. Sets the Number and Time formats used by PI DataLink.
4. Sets the method and Interval for the Automatic Update function.
Note 1: The Calculate option means that values are only recalculated for DataLink functions that
reference Excel time functions and not times in PI time format. The Full Calculate option must be used
to recalculate both DataLink functions based on Excel time functions and on PI time format.
Note 2: The default of 0 for the Interval is considered Auto, which is a 5 second interval.
There are also several helpful tricks for each section on the PI Ribbon. You can hover the
mouse over a function to cause a description to appear. If you need more assistance, there is
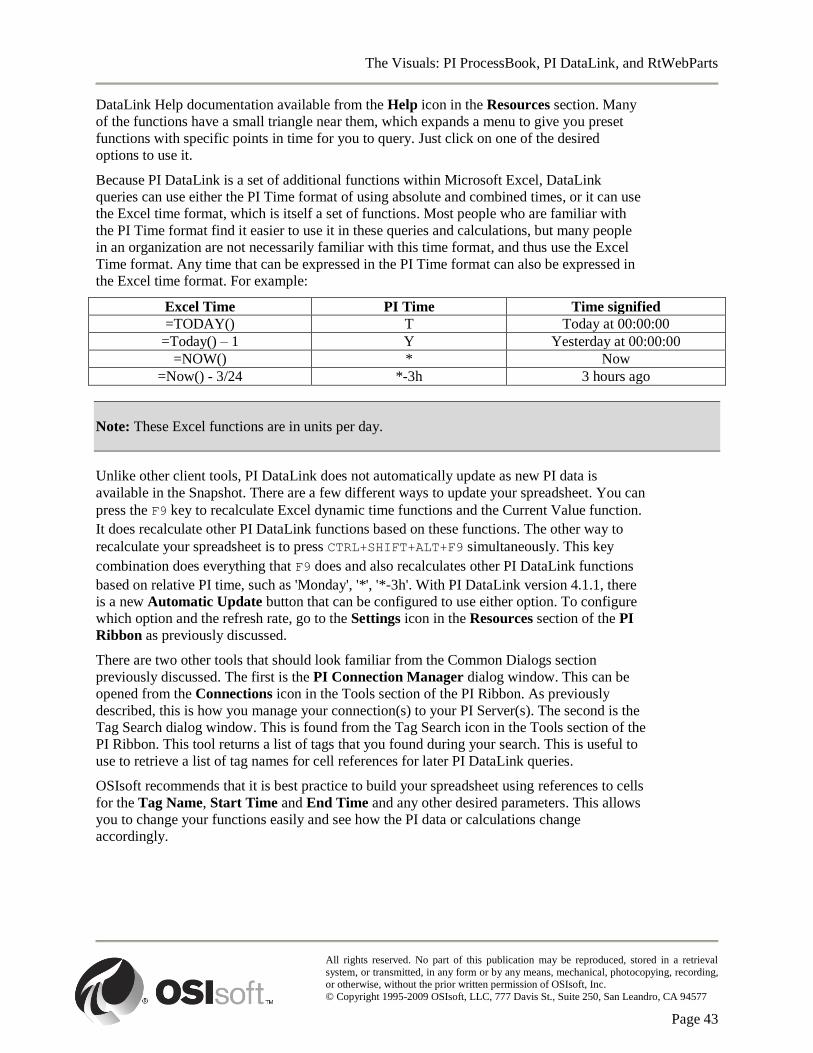
The Visuals: PI ProcessBook, PI DataLink, and RtWebParts
All rights reserved. No part of this publication may be reproduced, stored in a retrieval
system, or transmitted, in any form or by any means, mechanical, photocopying, recording, or otherwise, without the prior written permission of OSIsoft, Inc.
© Copyright 1995-2009 OSIsoft, LLC, 777 Davis St., Suite 250, San Leandro, CA 94577
Page 43
DataLink Help documentation available from the Help icon in the Resources section. Many
of the functions have a small triangle near them, which expands a menu to give you preset
functions with specific points in time for you to query. Just click on one of the desired
options to use it.
Because PI DataLink is a set of additional functions within Microsoft Excel, DataLink
queries can use either the PI Time format of using absolute and combined times, or it can use
the Excel time format, which is itself a set of functions. Most people who are familiar with
the PI Time format find it easier to use it in these queries and calculations, but many people
in an organization are not necessarily familiar with this time format, and thus use the Excel
Time format. Any time that can be expressed in the PI Time format can also be expressed in
the Excel time format. For example:
Excel Time PI Time Time signified
=TODAY() T Today at 00:00:00
=Today() – 1 Y Yesterday at 00:00:00
=NOW() * Now
=Now() - 3/24 *-3h 3 hours ago
Note: These Excel functions are in units per day.
Unlike other client tools, PI DataLink does not automatically update as new PI data is
available in the Snapshot. There are a few different ways to update your spreadsheet. You can
press the F9 key to recalculate Excel dynamic time functions and the Current Value function.
It does recalculate other PI DataLink functions based on these functions. The other way to
recalculate your spreadsheet is to press CTRL+SHIFT+ALT+F9 simultaneously. This key
combination does everything that F9 does and also recalculates other PI DataLink functions
based on relative PI time, such as 'Monday', '*', '*-3h'. With PI DataLink version 4.1.1, there
is a new Automatic Update button that can be configured to use either option. To configure
which option and the refresh rate, go to the Settings icon in the Resources section of the PI
Ribbon as previously discussed.
There are two other tools that should look familiar from the Common Dialogs section
previously discussed. The first is the PI Connection Manager dialog window. This can be
opened from the Connections icon in the Tools section of the PI Ribbon. As previously
described, this is how you manage your connection(s) to your PI Server(s). The second is the
Tag Search dialog window. This is found from the Tag Search icon in the Tools section of the
PI Ribbon. This tool returns a list of tags that you found during your search. This is useful to
use to retrieve a list of tag names for cell references for later PI DataLink queries.
OSIsoft recommends that it is best practice to build your spreadsheet using references to cells
for the Tag Name, Start Time and End Time and any other desired parameters. This allows
you to change your functions easily and see how the PI data or calculations change
accordingly.
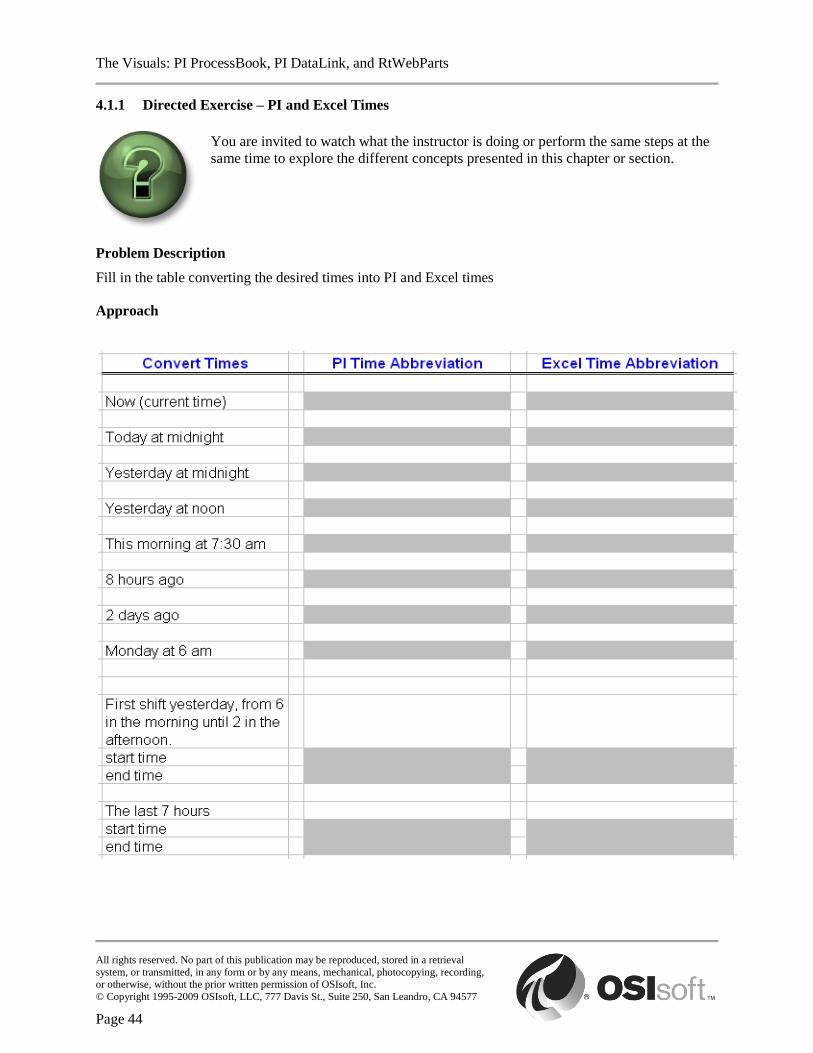
The Visuals: PI ProcessBook, PI DataLink, and RtWebParts
All rights reserved. No part of this publication may be reproduced, stored in a retrieval
system, or transmitted, in any form or by any means, mechanical, photocopying, recording, or otherwise, without the prior written permission of OSIsoft, Inc.
© Copyright 1995-2009 OSIsoft, LLC, 777 Davis St., Suite 250, San Leandro, CA 94577
Page 44
4.1.1 Directed Exercise – PI and Excel Times
You are invited to watch what the instructor is doing or perform the same steps at the
same time to explore the different concepts presented in this chapter or section.
Problem Description
Fill in the table converting the desired times into PI and Excel times
Approach
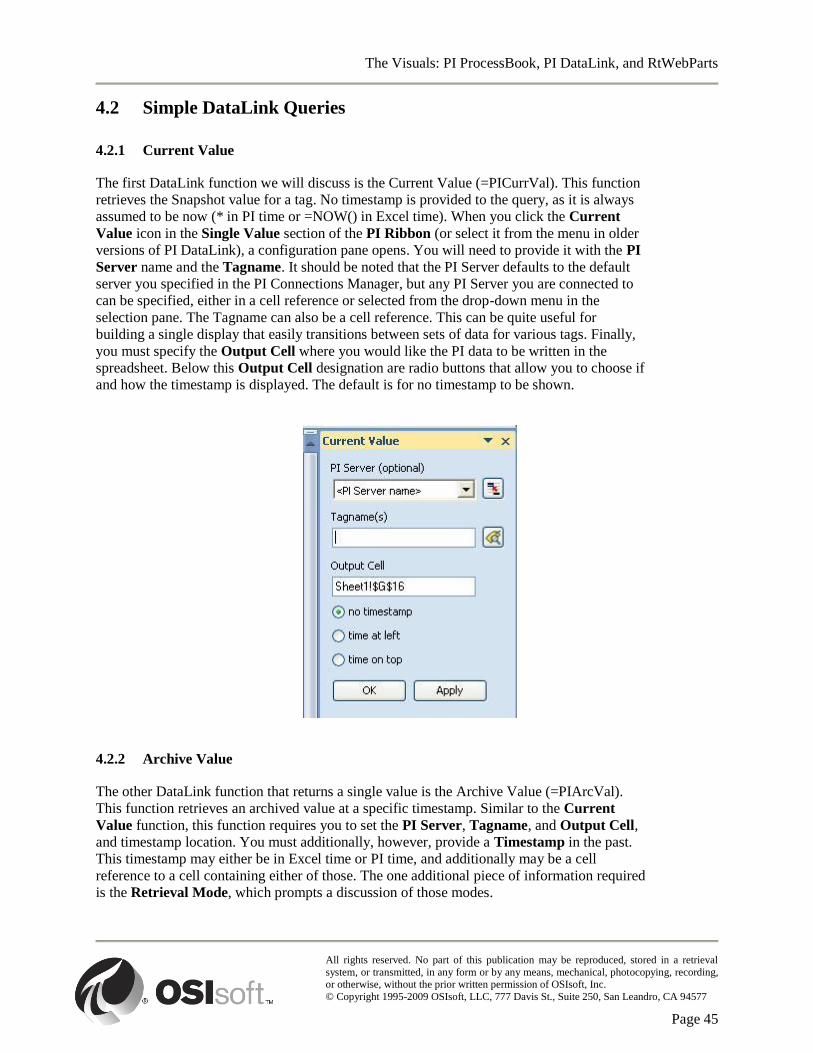
The Visuals: PI ProcessBook, PI DataLink, and RtWebParts
All rights reserved. No part of this publication may be reproduced, stored in a retrieval
system, or transmitted, in any form or by any means, mechanical, photocopying, recording, or otherwise, without the prior written permission of OSIsoft, Inc.
© Copyright 1995-2009 OSIsoft, LLC, 777 Davis St., Suite 250, San Leandro, CA 94577
Page 45
4.2 Simple DataLink Queries
4.2.1 Current Value
The first DataLink function we will discuss is the Current Value (=PICurrVal). This function
retrieves the Snapshot value for a tag. No timestamp is provided to the query, as it is always
assumed to be now (* in PI time or =NOW() in Excel time). When you click the Current
Value icon in the Single Value section of the PI Ribbon (or select it from the menu in older
versions of PI DataLink), a configuration pane opens. You will need to provide it with the PI
Server name and the Tagname. It should be noted that the PI Server defaults to the default
server you specified in the PI Connections Manager, but any PI Server you are connected to
can be specified, either in a cell reference or selected from the drop-down menu in the
selection pane. The Tagname can also be a cell reference. This can be quite useful for
building a single display that easily transitions between sets of data for various tags. Finally,
you must specify the Output Cell where you would like the PI data to be written in the
spreadsheet. Below this Output Cell designation are radio buttons that allow you to choose if
and how the timestamp is displayed. The default is for no timestamp to be shown.
4.2.2 Archive Value
The other DataLink function that returns a single value is the Archive Value (=PIArcVal).
This function retrieves an archived value at a specific timestamp. Similar to the Current
Value function, this function requires you to set the PI Server, Tagname, and Output Cell,
and timestamp location. You must additionally, however, provide a Timestamp in the past.
This timestamp may either be in Excel time or PI time, and additionally may be a cell
reference to a cell containing either of those. The one additional piece of information required
is the Retrieval Mode, which prompts a discussion of those modes.
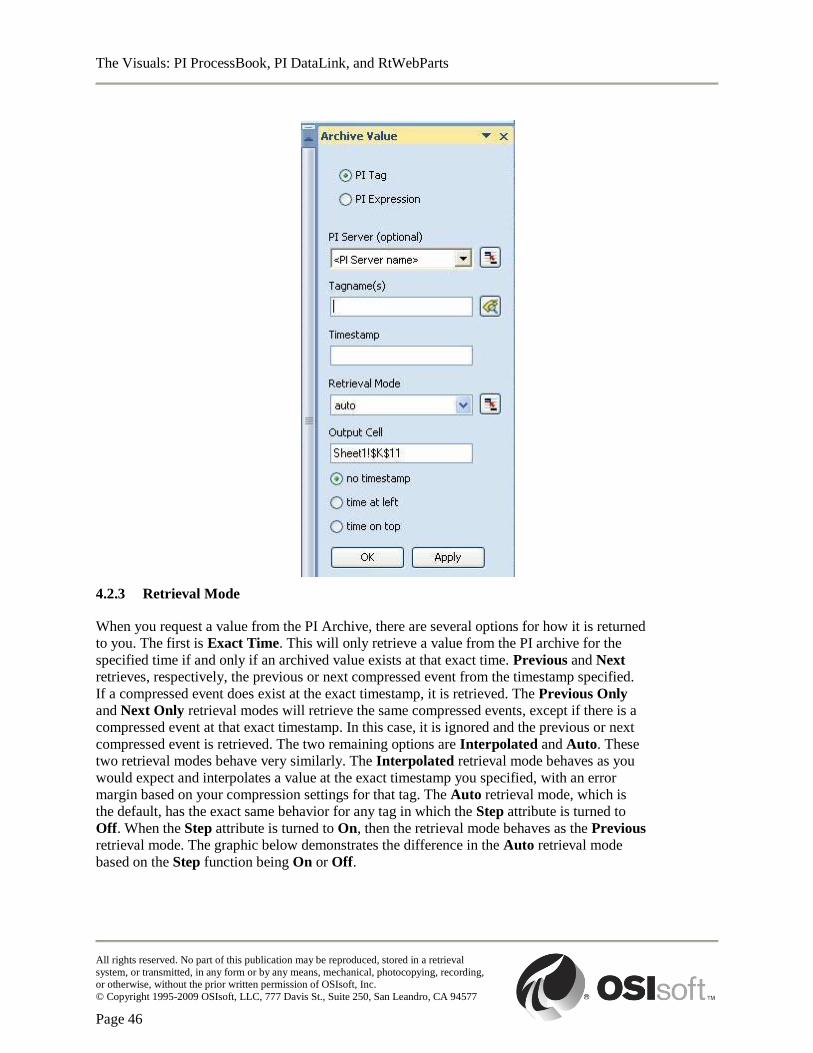
The Visuals: PI ProcessBook, PI DataLink, and RtWebParts
All rights reserved. No part of this publication may be reproduced, stored in a retrieval
system, or transmitted, in any form or by any means, mechanical, photocopying, recording, or otherwise, without the prior written permission of OSIsoft, Inc.
© Copyright 1995-2009 OSIsoft, LLC, 777 Davis St., Suite 250, San Leandro, CA 94577
Page 46
4.2.3 Retrieval Mode
When you request a value from the PI Archive, there are several options for how it is returned
to you. The first is Exact Time. This will only retrieve a value from the PI archive for the
specified time if and only if an archived value exists at that exact time. Previous and Next
retrieves, respectively, the previous or next compressed event from the timestamp specified.
If a compressed event does exist at the exact timestamp, it is retrieved. The Previous Only
and Next Only retrieval modes will retrieve the same compressed events, except if there is a
compressed event at that exact timestamp. In this case, it is ignored and the previous or next
compressed event is retrieved. The two remaining options are Interpolated and Auto. These
two retrieval modes behave very similarly. The Interpolated retrieval mode behaves as you
would expect and interpolates a value at the exact timestamp you specified, with an error
margin based on your compression settings for that tag. The Auto retrieval mode, which is
the default, has the exact same behavior for any tag in which the Step attribute is turned to
Off. When the Step attribute is turned to On, then the retrieval mode behaves as the Previous
retrieval mode. The graphic below demonstrates the difference in the Auto retrieval mode
based on the Step function being On or Off.
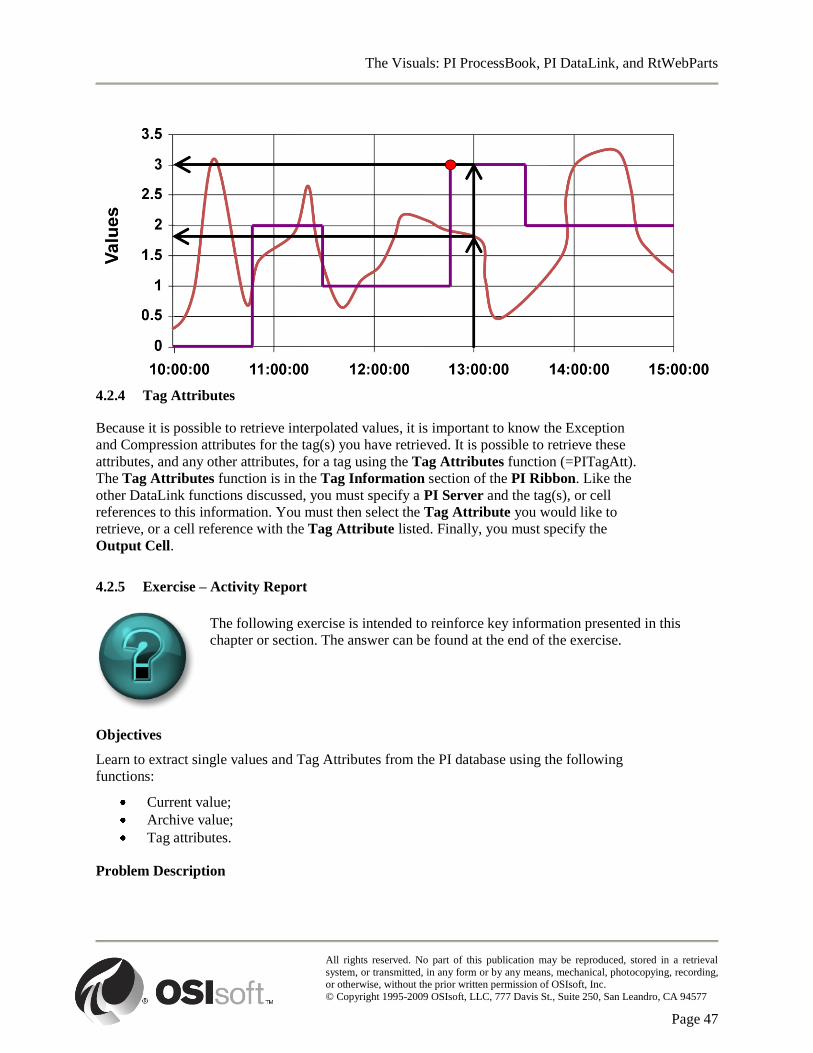
The Visuals: PI ProcessBook, PI DataLink, and RtWebParts
All rights reserved. No part of this publication may be reproduced, stored in a retrieval
system, or transmitted, in any form or by any means, mechanical, photocopying, recording, or otherwise, without the prior written permission of OSIsoft, Inc.
© Copyright 1995-2009 OSIsoft, LLC, 777 Davis St., Suite 250, San Leandro, CA 94577
Page 47
4.2.4 Tag Attributes
Because it is possible to retrieve interpolated values, it is important to know the Exception
and Compression attributes for the tag(s) you have retrieved. It is possible to retrieve these
attributes, and any other attributes, for a tag using the Tag Attributes function (=PITagAtt).
The Tag Attributes function is in the Tag Information section of the PI Ribbon. Like the
other DataLink functions discussed, you must specify a PI Server and the tag(s), or cell
references to this information. You must then select the Tag Attribute you would like to
retrieve, or a cell reference with the Tag Attribute listed. Finally, you must specify the
Output Cell.
4.2.5 Exercise – Activity Report
The following exercise is intended to reinforce key information presented in this
chapter or section. The answer can be found at the end of the exercise.
Objectives
Learn to extract single values and Tag Attributes from the PI database using the following
functions:
Current value;
Archive value;
Tag attributes.
Problem Description

The Visuals: PI ProcessBook, PI DataLink, and RtWebParts
All rights reserved. No part of this publication may be reproduced, stored in a retrieval
system, or transmitted, in any form or by any means, mechanical, photocopying, recording, or otherwise, without the prior written permission of OSIsoft, Inc.
© Copyright 1995-2009 OSIsoft, LLC, 777 Davis St., Suite 250, San Leandro, CA 94577
Page 48
You need to build a basic activity report using data collected in your PI Server. You want this type of
report to show values from the production plant floor before morning meeting. This report will show
current values and ones from a specified time every morning.
Approach
We will use the Current Value, Archive Value and Tag Attributes features to fill in a template of an
activity report. Remember that we should base our PI DataLink queries on cell references whenever
possible. Open the file Exercise_DL1_Template.xls and fill in data into all of the fields. Note all of the
tags used in this example have engineering units.
Try to do this exercise on your own before proceeding to the step-by-step solution.
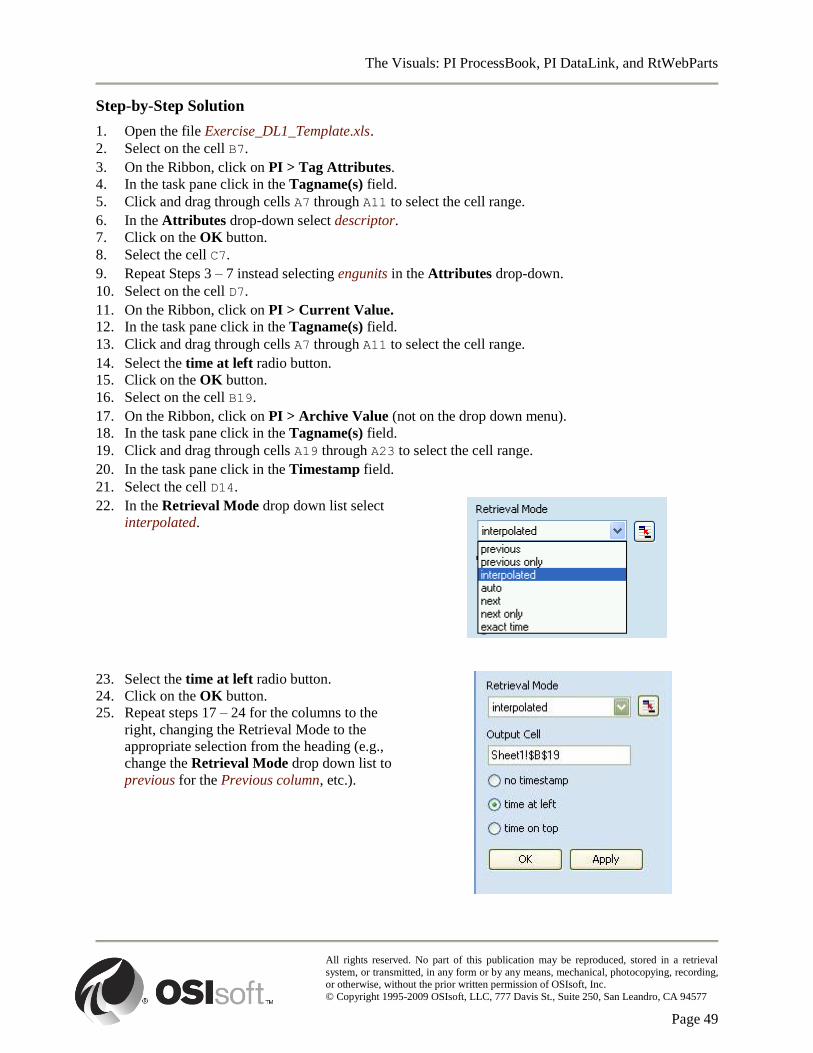
The Visuals: PI ProcessBook, PI DataLink, and RtWebParts
All rights reserved. No part of this publication may be reproduced, stored in a retrieval
system, or transmitted, in any form or by any means, mechanical, photocopying, recording, or otherwise, without the prior written permission of OSIsoft, Inc.
© Copyright 1995-2009 OSIsoft, LLC, 777 Davis St., Suite 250, San Leandro, CA 94577
Page 49
Step-by-Step Solution
1. Open the file Exercise_DL1_Template.xls.
2. Select on the cell B7.
3. On the Ribbon, click on PI > Tag Attributes.
4. In the task pane click in the Tagname(s) field.
5. Click and drag through cells A7 through A11 to select the cell range.
6. In the Attributes drop-down select descriptor.
7. Click on the OK button.
8. Select the cell C7.
9. Repeat Steps 3 – 7 instead selecting engunits in the Attributes drop-down.
10. Select on the cell D7.
11. On the Ribbon, click on PI > Current Value.
12. In the task pane click in the Tagname(s) field.
13. Click and drag through cells A7 through A11 to select the cell range.
14. Select the time at left radio button.
15. Click on the OK button.
16. Select on the cell B19.
17. On the Ribbon, click on PI > Archive Value (not on the drop down menu).
18. In the task pane click in the Tagname(s) field.
19. Click and drag through cells A19 through A23 to select the cell range.
20. In the task pane click in the Timestamp field.
21. Select the cell D14.
22. In the Retrieval Mode drop down list select
interpolated.
23. Select the time at left radio button.
24. Click on the OK button.
25. Repeat steps 17 – 24 for the columns to the
right, changing the Retrieval Mode to the
appropriate selection from the heading (e.g.,
change the Retrieval Mode drop down list to
previous for the Previous column, etc.).
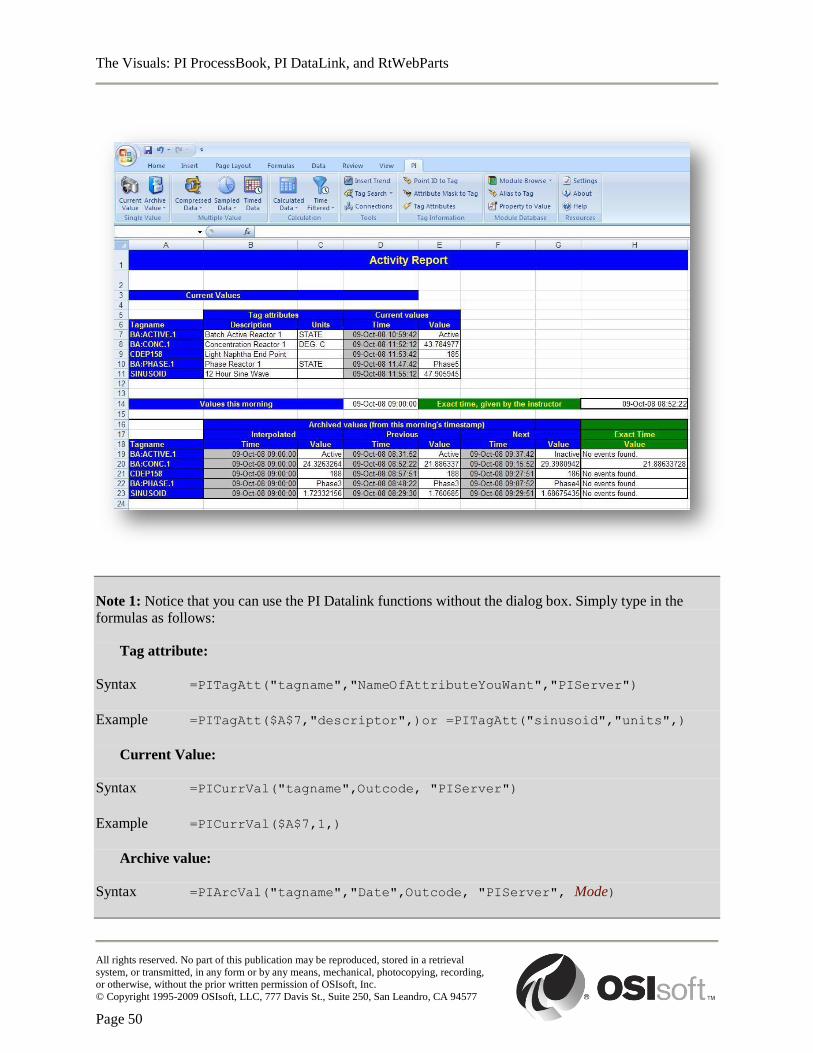
The Visuals: PI ProcessBook, PI DataLink, and RtWebParts
All rights reserved. No part of this publication may be reproduced, stored in a retrieval
system, or transmitted, in any form or by any means, mechanical, photocopying, recording, or otherwise, without the prior written permission of OSIsoft, Inc.
© Copyright 1995-2009 OSIsoft, LLC, 777 Davis St., Suite 250, San Leandro, CA 94577
Page 50
Note 1: Notice that you can use the PI Datalink functions without the dialog box. Simply type in the
formulas as follows:
Tag attribute:
Syntax =PITagAtt("tagname","NameOfAttributeYouWant","PIServer")
Example =PITagAtt($A$7,"descriptor",)or =PITagAtt("sinusoid","units",)
Current Value:
Syntax =PICurrVal("tagname",Outcode, "PIServer")
Example =PICurrVal($A$7,1,)
Archive value:
Syntax =PIArcVal("tagname","Date",Outcode, "PIServer", Mode)
The Visuals: PI ProcessBook, PI DataLink, and RtWebParts
All rights reserved. No part of this publication may be reproduced, stored in a retrieval
system, or transmitted, in any form or by any means, mechanical, photocopying, recording, or otherwise, without the prior written permission of OSIsoft, Inc.
© Copyright 1995-2009 OSIsoft, LLC, 777 Davis St., Suite 250, San Leandro, CA 94577
Page 51
Where Mode = "interpolated" or "previous" or "next"
Example =PIArcVal($A$7,$D$13,1,, "Interpolated")
Exact Time Value:
Syntax =PIExTimeVal("tagname","Date","PIServer")
Example =PIExTimeVal($A$7,$H$25,)
Note 2: We have seen that it is possible to enter a formula by entering one tag at a time. However, it is
possible to save time by selecting a range of cells instead of a single cell or using the copy/paste function
of MS Excel. You must edit the formula and remove any unnecessary $ characters (absolute cell
references) before using MS Excel copy/paste function.
Note 3: Note the impact of the point type and step attributes when you use archive value. For digital tags,
the interpolated and previous values are equal and have the same timestamp because no interpolation is
possible between states.
4.3 Multiple Value DataLink Queries
There are three types of queries you can perform to return multiple values. They are
Compressed Data, Sampled Data, and Timed Data. Compressed Data returns all of the
values that were actually archived during the specified time range. This means that you will
only retrieve the events that passed Exception and Compression Testing. If an event was
filtered out due to these tests, you will not see them. Sampled Data retrieves values evenly
spaced in time. These values are interpolated from the archived values. As such, you may
miss maxima and minima in your overall trends, but each data point is a valid interpolation
(or exact match) of your actual trend at that timestamp. See the graphic below for a clearer
picture. Finally, there is Timed Data, which retrieves interpolated (or exact match) events
that match a series of timestamps. This is most often used when comparing the Compressed
Data of one tag with the Timed Data values of another tag to determine correlation between
variables.
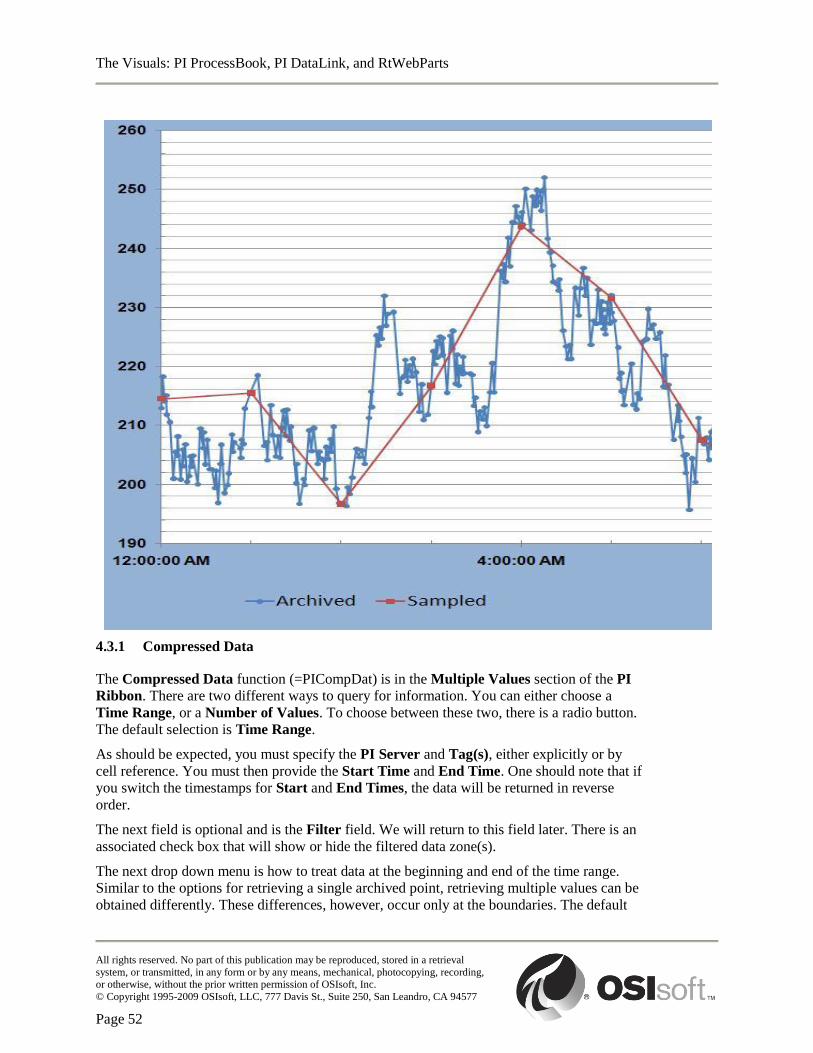
The Visuals: PI ProcessBook, PI DataLink, and RtWebParts
All rights reserved. No part of this publication may be reproduced, stored in a retrieval
system, or transmitted, in any form or by any means, mechanical, photocopying, recording, or otherwise, without the prior written permission of OSIsoft, Inc.
© Copyright 1995-2009 OSIsoft, LLC, 777 Davis St., Suite 250, San Leandro, CA 94577
Page 52
4.3.1 Compressed Data
The Compressed Data function (=PICompDat) is in the Multiple Values section of the PI
Ribbon. There are two different ways to query for information. You can either choose a
Time Range, or a Number of Values. To choose between these two, there is a radio button.
The default selection is Time Range.
As should be expected, you must specify the PI Server and Tag(s), either explicitly or by
cell reference. You must then provide the Start Time and End Time. One should note that if
you switch the timestamps for Start and End Times, the data will be returned in reverse
order.
The next field is optional and is the Filter field. We will return to this field later. There is an
associated check box that will show or hide the filtered data zone(s).
The next drop down menu is how to treat data at the beginning and end of the time range.
Similar to the options for retrieving a single archived point, retrieving multiple values can be
obtained differently. These differences, however, occur only at the boundaries. The default
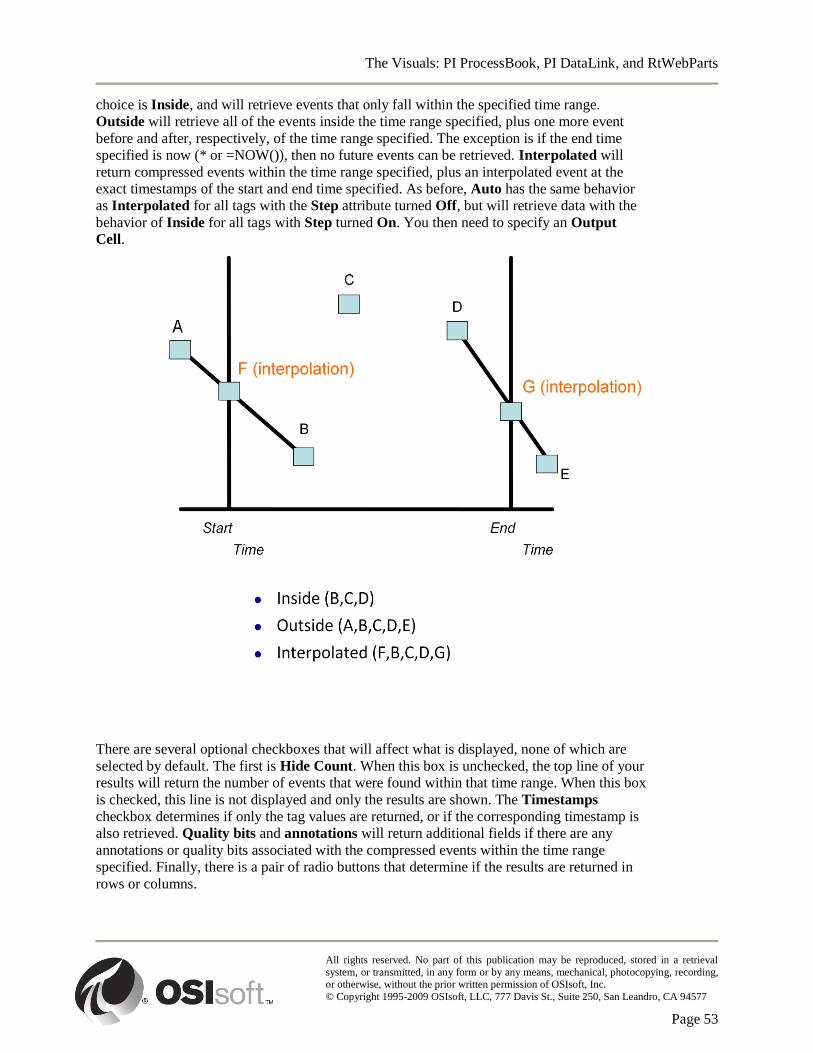
The Visuals: PI ProcessBook, PI DataLink, and RtWebParts
All rights reserved. No part of this publication may be reproduced, stored in a retrieval
system, or transmitted, in any form or by any means, mechanical, photocopying, recording, or otherwise, without the prior written permission of OSIsoft, Inc.
© Copyright 1995-2009 OSIsoft, LLC, 777 Davis St., Suite 250, San Leandro, CA 94577
Page 53
choice is Inside, and will retrieve events that only fall within the specified time range.
Outside will retrieve all of the events inside the time range specified, plus one more event
before and after, respectively, of the time range specified. The exception is if the end time
specified is now (* or =NOW()), then no future events can be retrieved. Interpolated will
return compressed events within the time range specified, plus an interpolated event at the
exact timestamps of the start and end time specified. As before, Auto has the same behavior
as Interpolated for all tags with the Step attribute turned Off, but will retrieve data with the
behavior of Inside for all tags with Step turned On. You then need to specify an Output
Cell.
There are several optional checkboxes that will affect what is displayed, none of which are
selected by default. The first is Hide Count. When this box is unchecked, the top line of your
results will return the number of events that were found within that time range. When this box
is checked, this line is not displayed and only the results are shown. The Timestamps
checkbox determines if only the tag values are returned, or if the corresponding timestamp is
also retrieved. Quality bits and annotations will return additional fields if there are any
annotations or quality bits associated with the compressed events within the time range
specified. Finally, there is a pair of radio buttons that determine if the results are returned in
rows or columns.
The Visuals: PI ProcessBook, PI DataLink, and RtWebParts
All rights reserved. No part of this publication may be reproduced, stored in a retrieval
system, or transmitted, in any form or by any means, mechanical, photocopying, recording, or otherwise, without the prior written permission of OSIsoft, Inc.
© Copyright 1995-2009 OSIsoft, LLC, 777 Davis St., Suite 250, San Leandro, CA 94577
Page 54
The Number of Values option for this query behaves similarly, but rather than a specific
time range, you will specify a Start Time and the Number of Values that you would like to
retrieve. You can also check the box to have this go backwards, rather than forwards in time.
4.3.2 Sampled Data
Sampled Data (=PISampDat) is also found in the Multiple Values section of the PI Ribbon.
As stated before, this function retrieves evenly spaced interpolated values from the archive.
Much like the Compressed Data query, you must specify PI Server, Tag(s), Start Time,
End Time, and Output Cell. You have the optional parameters of a Filter Expression (to be
covered later) and timestamp display. The main difference is the Time Interval field. This
field requires a PI Time that will be used to divide the time range you specified into discreet
timestamps at which data events will be interpolated.
4.3.3 Timed Data
The final Multiple Value query is the Timed Data function (=PITimeDat), which is also in
the Multiple Values section of the PI Ribbon. This function retrieves sampled data
synchronized with an array of time values. Again the PI Server, Tag name, Data retrieval
mode, and Output Cell must be specified. In this case, the times used to retrieve events must
be a range of cells, rather than a hardcoded time. This is typically done by querying one tag
for events, and then using those timestamps to find the values for other, related tags.
4.4 Arrays in PI DataLink
The Multiple Value functions just discussed actually return an array of values and
timestamps. These values can change in size based on the tag used, the time range specified,
and exception and compression settings. Therefore, it can be necessary to resize the array.
There are two signs that you should resize the array. First, if you have too few values in the
array and you have the “Display #N/A instead of Blanks” option checked in your Settings,
then you will see the appropriate rows and columns displaying the #N/A message. If you
have too many values, you will receive the message “Resize to show all values” at the
bottom of the array. If you need to resize the array, there are three options available. First,
you can manually resize the array by selecting the new cell range for the array and pressing
F2. Then pressing CTRL+SHIFT+ENTER simultaneously. Another method to resize the array
is via the dialog window. You should right-click on a cell in the array, select the name of the
function in the contextual menu, do the modifications in the dialog window, and then click on
OK. Finally, you can right-click on a cell in the array and select the Recalculate (Resize)
PIDL Formula option.
The Visuals: PI ProcessBook, PI DataLink, and RtWebParts
All rights reserved. No part of this publication may be reproduced, stored in a retrieval
system, or transmitted, in any form or by any means, mechanical, photocopying, recording, or otherwise, without the prior written permission of OSIsoft, Inc.
© Copyright 1995-2009 OSIsoft, LLC, 777 Davis St., Suite 250, San Leandro, CA 94577
Page 55
4.4.1 Group Recap Questions
The following questions are intended to reinforce key information presented in this
chapter or section. The answers can be found after the questions.
Questions
1. What is the advantage of having PI DataLink reports using cell references containing Excel
dynamic time functions instead of PI time?
2. What are the three ways to resize an Excel array generated with a PI DataLink function?
3. Using one of the Compressed Data functions, what additional information will be provided if the
Show Value Attributes and Show Annotations options are checked?
Answers
1. The PI DataLink functions will be refreshed when the Excel spreadsheet is Calculated. To refresh PI
Time functions, a Full Recalculate must be performed.
2. Manually (select new array, press F9, press CTRL-SHIFT-ENTER), selecting the Recalculate
(Resize) PIDL formula option from the right click menu, or going back into the PI DataLink
function dialog and clicking the OK button.
3. For each one of the retrieved archived values, the questionnable, substituded and annotated flags
will be retrieved if the Show Value Attributes option is checked. If the Show Annotation option is
checked and there is an annotation to the value, it will also be retrieved.
4.4.2 Exercise – Operational Start Up
The following exercise is intended to reinforce key information presented in this
chapter or section. The answer can be found at the end of the exercise.
Objectives
Learn to retrieve process data using the Compressed Data function.
Problem Description
You need to compare the values stored in the PI Server that relate to the startup of a piece of equipment in
your facility. You want to determine if there is any deviation between startup operations by examining
today and comparing it to the same time period from the day before. The tag you want to use as a metric
is CDT158. Your shift begins at 6:30 am in the morning and you want to gather the first 30 values
beginning at that time for today and yesterday, and do some quick math to determine the deviation. A ten
percent deviation in a positive or negative direction will be considered over / under range. All other
outcomes will be considered nominal.

The Visuals: PI ProcessBook, PI DataLink, and RtWebParts
All rights reserved. No part of this publication may be reproduced, stored in a retrieval
system, or transmitted, in any form or by any means, mechanical, photocopying, recording, or otherwise, without the prior written permission of OSIsoft, Inc.
© Copyright 1995-2009 OSIsoft, LLC, 777 Davis St., Suite 250, San Leandro, CA 94577
Page 56
Approach
We need to create a spreadsheet that will show the first 30 values today using the tag
CDT158. We want to compare these values to the previous day‟s starting 30 values. Open the
file Exercise_DL2_Template.xls and fill in data into all of the fields. Both queries are using
the Compressed Data (Start Time / Number) query. Use cell references for all of the dialog
box fields. The formulas used to compare the two queries are found in the upper right portion
of the spreadsheet. They both have a single quote inserted before the equal sign so MS Excel
will treat them as strings and not formulas. You can copy and paste the contents and then
remove the leading single quotes.
Try to do this exercise on your own before proceeding to the step-by-step solution.
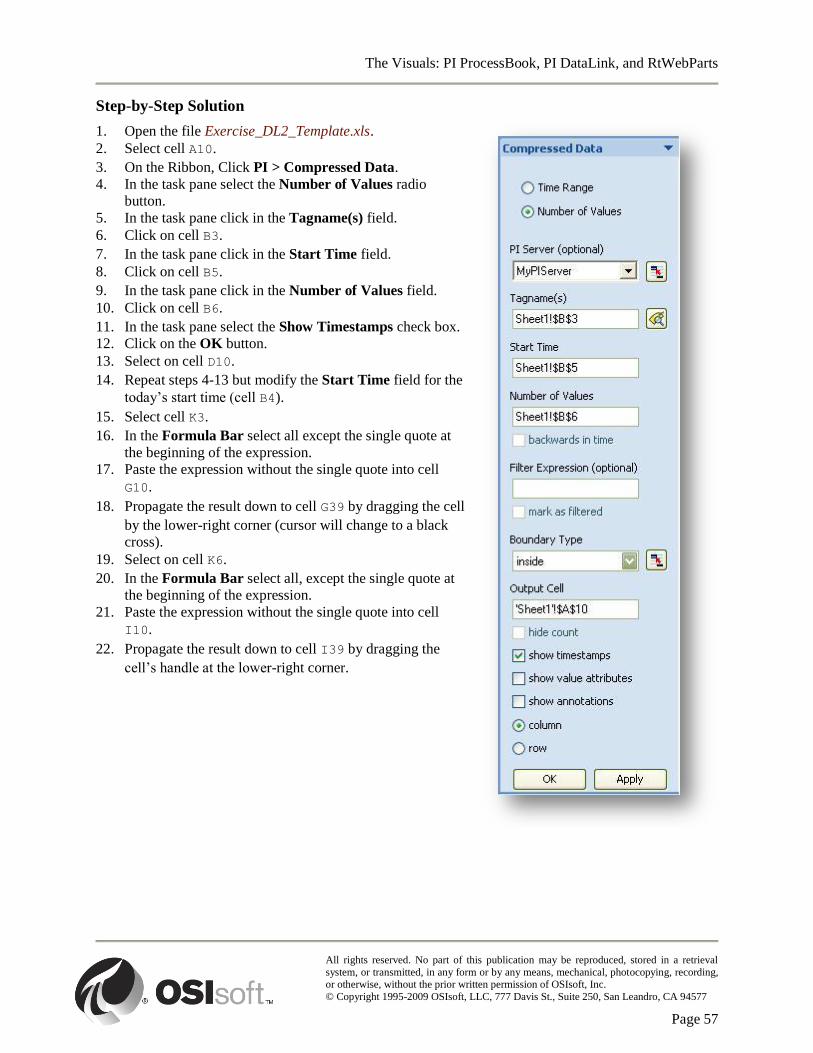
The Visuals: PI ProcessBook, PI DataLink, and RtWebParts
All rights reserved. No part of this publication may be reproduced, stored in a retrieval
system, or transmitted, in any form or by any means, mechanical, photocopying, recording, or otherwise, without the prior written permission of OSIsoft, Inc.
© Copyright 1995-2009 OSIsoft, LLC, 777 Davis St., Suite 250, San Leandro, CA 94577
Page 57
Step-by-Step Solution
1. Open the file Exercise_DL2_Template.xls.
2. Select cell A10.
3. On the Ribbon, Click PI > Compressed Data.
4. In the task pane select the Number of Values radio
button.
5. In the task pane click in the Tagname(s) field.
6. Click on cell B3.
7. In the task pane click in the Start Time field.
8. Click on cell B5.
9. In the task pane click in the Number of Values field.
10. Click on cell B6.
11. In the task pane select the Show Timestamps check box.
12. Click on the OK button.
13. Select on cell D10.
14. Repeat steps 4-13 but modify the Start Time field for the
today‟s start time (cell B4).
15. Select cell K3.
16. In the Formula Bar select all except the single quote at
the beginning of the expression.
17. Paste the expression without the single quote into cell
G10.
18. Propagate the result down to cell G39 by dragging the cell
by the lower-right corner (cursor will change to a black
cross).
19. Select on cell K6.
20. In the Formula Bar select all, except the single quote at
the beginning of the expression.
21. Paste the expression without the single quote into cell
I10.
22. Propagate the result down to cell I39 by dragging the
cell‟s handle at the lower-right corner.
The Visuals: PI ProcessBook, PI DataLink, and RtWebParts
All rights reserved. No part of this publication may be reproduced, stored in a retrieval
system, or transmitted, in any form or by any means, mechanical, photocopying, recording, or otherwise, without the prior written permission of OSIsoft, Inc.
© Copyright 1995-2009 OSIsoft, LLC, 777 Davis St., Suite 250, San Leandro, CA 94577
Page 58
5. RtWebParts Basics
5.1 Introduction to RtWebParts
RtWebParts is a set of OSIsoft‟s third party web parts for Microsoft‟s SharePoint server.
RtWebParts pages have these features:
No local installation is required;
No direct connection to the PI Server is required;
Requests and renders data from several data sources (not limited to only PI data);
Repository for files and documents;
Accessible from any computer with internet access and the SVG viewer plug-in.
Because of these features, RtWebParts is considered a thin client. This makes it much more
accessible to members of your organization and means that fewer people need a working
knowledge of PI, while maintaining the visibility of your PI data. You can view your data
from anywhere at any time. The advantages of RtWebParts pages are that you can share files
and documents in online Document Libraries, making it so there is only one version of the
truth because everyone views same data. It also increases team collaboration and
productivity.
5.2 Web Part Pages
A web part page is a special type of Windows SharePoint Services page that contains web
parts. A web part page contains WSS zones. A single web part or multiple web parts are
located within a zone. These web parts can be WSS web parts, RtWebParts, or other third
party web parts. Each zone is configured independently. These zones can be configured to
pass parameters between them to create interactive web part pages. Overall, the display
environment offered by SharePoint and RtWebParts is highly configurable and can be
tailored to your specific needs.
5.2.1 Directed Exercise – Create a New Team Site
You are invited to watch what the instructor is doing or perform the same steps at the
same time to explore the different concepts presented in this chapter or section.
Problem Description
You need a new Team Site for the Web Part Pages that you will be building during the
remainder of the course.
Approach
The Visuals: PI ProcessBook, PI DataLink, and RtWebParts
All rights reserved. No part of this publication may be reproduced, stored in a retrieval
system, or transmitted, in any form or by any means, mechanical, photocopying, recording, or otherwise, without the prior written permission of OSIsoft, Inc.
© Copyright 1995-2009 OSIsoft, LLC, 777 Davis St., Suite 250, San Leandro, CA 94577
Page 59
Create a new Team Site with the same permissions as the parent.
5.2.2 Document Library
A Document Library is an online storage location for Web Part pages and shared documents
and files. The documents stored here can be used as a central point for users needing to view
and edit this material. It can also be used to link these documents to specific web parts for
display purposes. We will cover this in more detail later.
To create a new Document Library, click on the Site Actions drop-down menu in the upper
right corner and select the Create link. This will open a new web page with several choices
for the page you are going to create. Click on the Document Library link in the left column
of the Create page and name the library. It should be noted that SharePoint and RtWebParts
both support multiple document libraries. There is no default document library, so when
selecting a library, they are presented in alphabetical order. Finally, click on the Create button
to create your library.
You can open a document library by clicking View All Site Content on the Top Bar menu
and then clicking the document library name in the Document Libraries section. If you
chose to add the document library to the Quick Launch bar, you can also click the document
library name there to open it.
5.2.3 Web Part Pages
Web Part Pages are where you will add and configure various web parts. It is similar to
ProcessBook, where the Team Site in Web Parts is analogous to a ProcessBook Workbook
and the Web Part Pages are analogous to the ProcessBook Entries. To create a new Web Part
Page, click on the Site Actions drop-down menu in the upper right corner and select the
Create link. This will open a new web page with several choices for the page you are going
to create. Click on the Web Part Page link in the right column of the Create page and name
the page. You can change which layout you use for this Web Part Page. While this is
configurable, for the demonstrations and exercises, we will be using the default Web Part
Page layout. Select which Document Library you would like to store this Web Part Page.
Finally, click on the Create button to create your library.
Once a web part page has been created, you can start adding web parts to the zones. Adding
web parts is a lot more intuitive in SharePoint 2007. To add, modify, change layout, or delete
web parts you must be in Design mode. You enter Design mode, click Site Actions> Edit
Page. An Add a Web Part button will be available for each web part zone to which you can
add web parts. In Edit mode, click the Add a Web Parts button for the zone you want to
insert the web part into. You can then select one or many Web Parts. Click OK.
Now that you have a web part page with web parts added to zones, you must configure the
web parts. To configure a web part, go to the upper right corner of the specific web part (title
bar) and click the downward triangle (Web Part menu). Select the Modify Web Part
command. The configuration pane is displayed on the right side of the page. From here, the
configuration of each web part varies. We will go into the RtWebParts configuration shortly.
The Visuals: PI ProcessBook, PI DataLink, and RtWebParts
All rights reserved. No part of this publication may be reproduced, stored in a retrieval
system, or transmitted, in any form or by any means, mechanical, photocopying, recording, or otherwise, without the prior written permission of OSIsoft, Inc.
© Copyright 1995-2009 OSIsoft, LLC, 777 Davis St., Suite 250, San Leandro, CA 94577
Page 60
5.2.4 Exercise – Basic SharePoint
The following exercise is intended to reinforce key information presented in this
chapter or section. The answer can be found at the end of the exercise.
Objectives
Navigate a SharePoint site;
Create a web part page;
Insert and modify web parts in a web part page.
Problem Description
You are new to SharePoint. You have your own team site, but you need to be familiar with how to get
around.
Approach
Close your browser if it is open to your Team Site. Open a browser and login in to the SharePoint server
using the credentials given by the instructor earlier. Navigate to your Team Site using one of the methods
used in class. Use the Create function to add a new Document Library. Call this Document Library:
ProcessBook Files. Add links to the default Links web part to the following URLs:
www.osisoft.com;
www.cnn.com;
www.microsoft.com;
One of your classmate‟s team sites (you will have to navigate to one of their sites
and copy the URL from the Address Bar in the browser).
Extra Credit
Replace the image in the upper right of your home page with another icon or image. You will have to:
Copy an image to your desktop (make sure before you upload it that it is a correct
size - double-click to open it and resize if necessary);
Upload it to your Shared Documents Library;
Copy the URL;
Edit the web part and add the URL.
Try to do this exercise on your own before proceeding to the step-by-step solution.
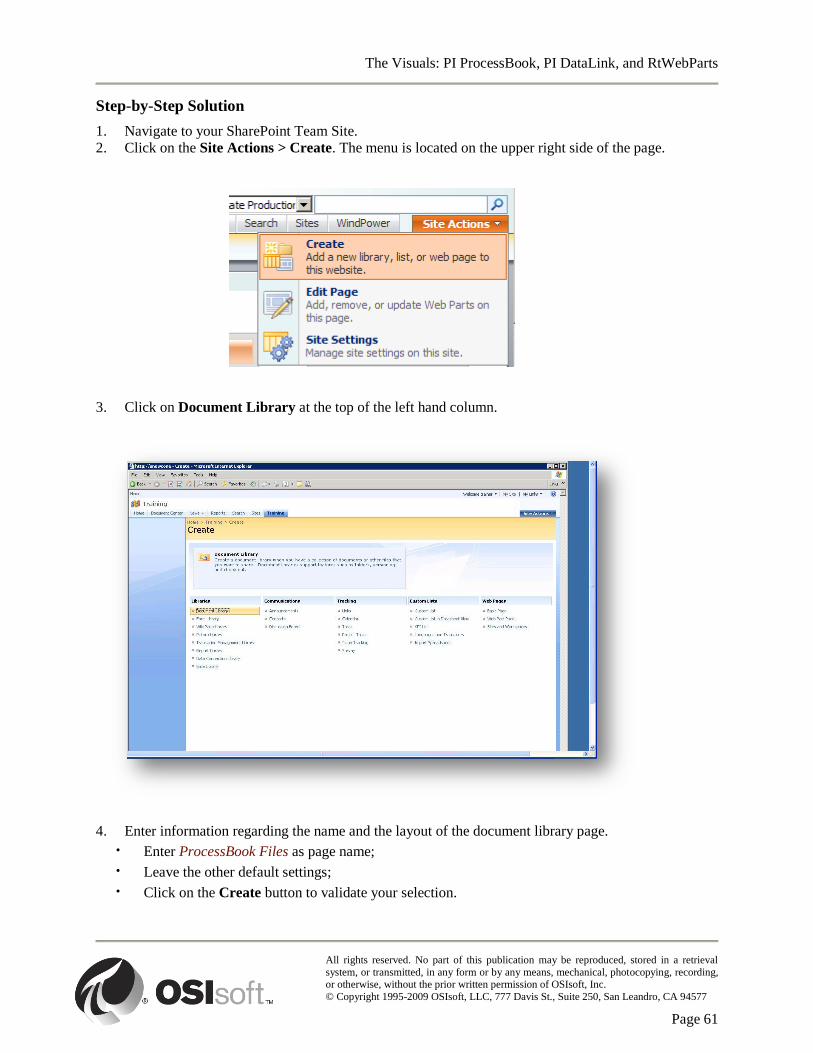
The Visuals: PI ProcessBook, PI DataLink, and RtWebParts
All rights reserved. No part of this publication may be reproduced, stored in a retrieval
system, or transmitted, in any form or by any means, mechanical, photocopying, recording, or otherwise, without the prior written permission of OSIsoft, Inc.
© Copyright 1995-2009 OSIsoft, LLC, 777 Davis St., Suite 250, San Leandro, CA 94577
Page 61
Step-by-Step Solution
1. Navigate to your SharePoint Team Site.
2. Click on the Site Actions > Create. The menu is located on the upper right side of the page.
3. Click on Document Library at the top of the left hand column.
4. Enter information regarding the name and the layout of the document library page.
· Enter ProcessBook Files as page name;
· Leave the other default settings;
· Click on the Create button to validate your selection.
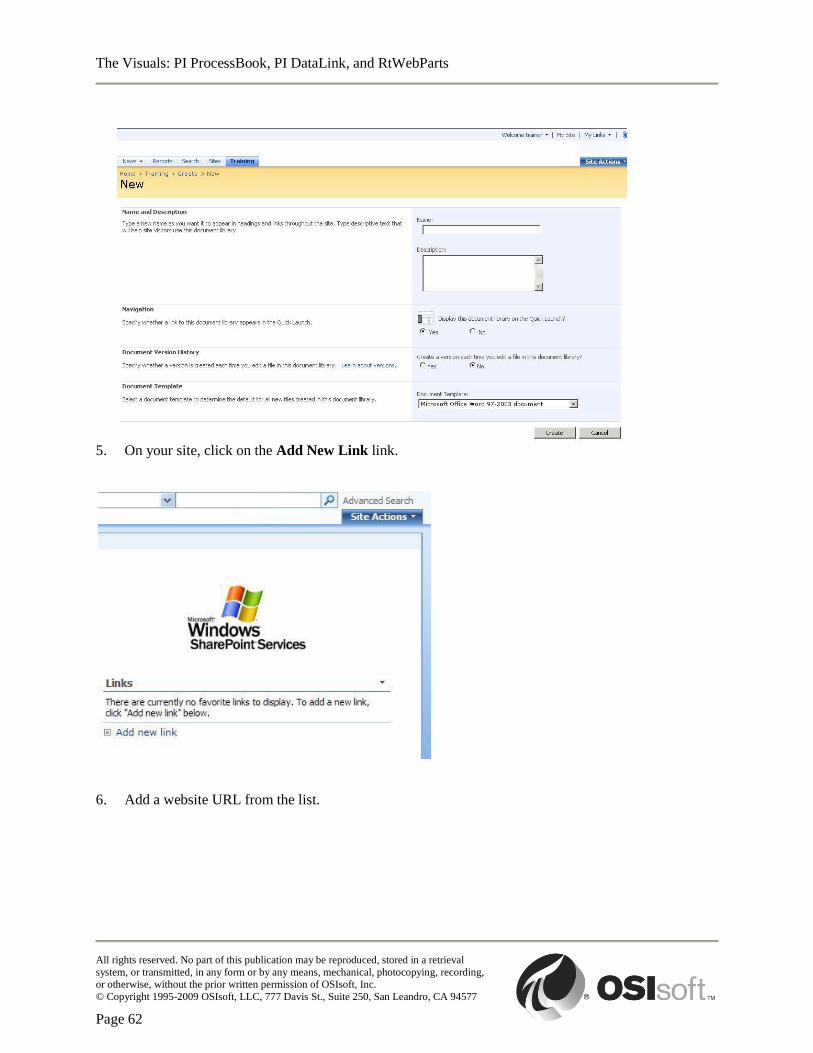
The Visuals: PI ProcessBook, PI DataLink, and RtWebParts
All rights reserved. No part of this publication may be reproduced, stored in a retrieval
system, or transmitted, in any form or by any means, mechanical, photocopying, recording, or otherwise, without the prior written permission of OSIsoft, Inc.
© Copyright 1995-2009 OSIsoft, LLC, 777 Davis St., Suite 250, San Leandro, CA 94577
Page 62
5. On your site, click on the Add New Link link.
6. Add a website URL from the list.
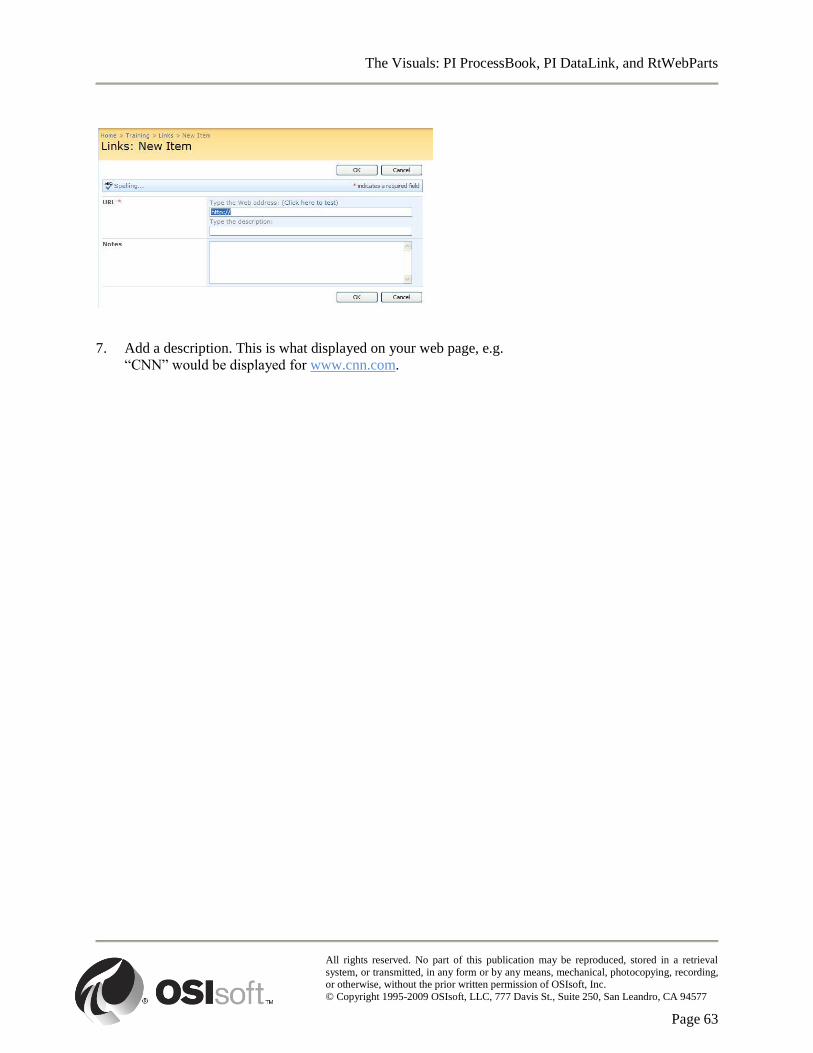
The Visuals: PI ProcessBook, PI DataLink, and RtWebParts
All rights reserved. No part of this publication may be reproduced, stored in a retrieval
system, or transmitted, in any form or by any means, mechanical, photocopying, recording, or otherwise, without the prior written permission of OSIsoft, Inc.
© Copyright 1995-2009 OSIsoft, LLC, 777 Davis St., Suite 250, San Leandro, CA 94577
Page 63
7. Add a description. This is what displayed on your web page, e.g.
“CNN” would be displayed for www.cnn.com.
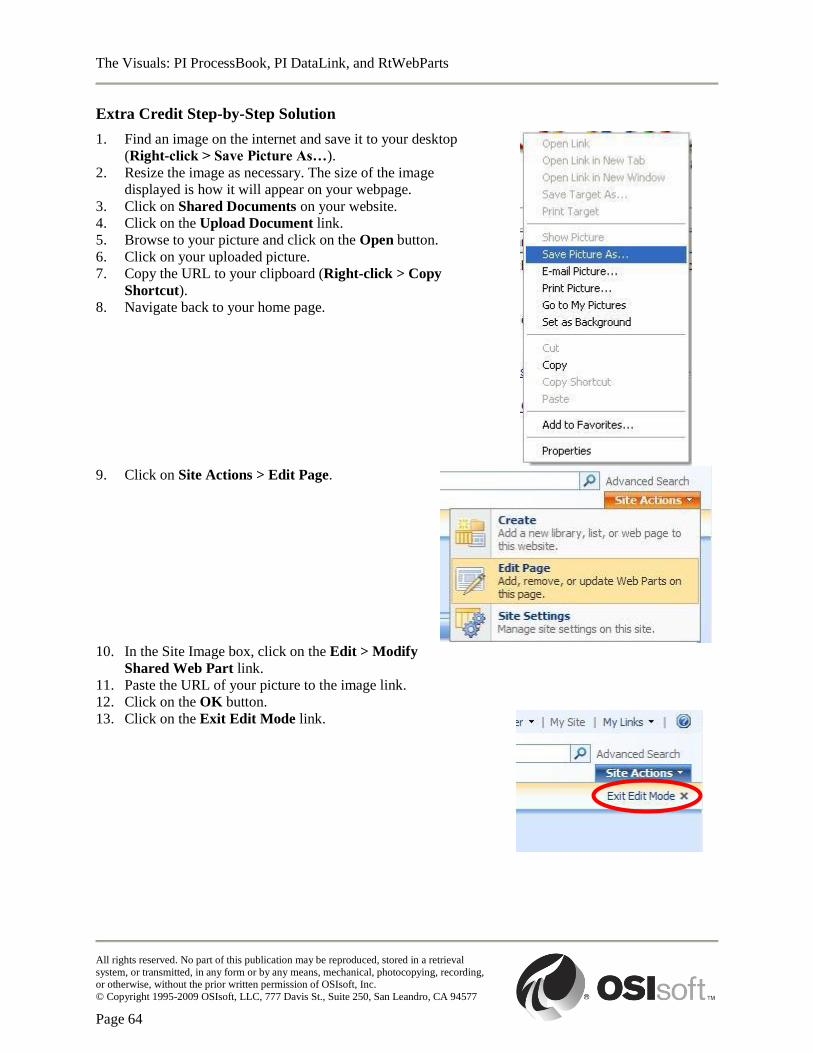
The Visuals: PI ProcessBook, PI DataLink, and RtWebParts
All rights reserved. No part of this publication may be reproduced, stored in a retrieval
system, or transmitted, in any form or by any means, mechanical, photocopying, recording, or otherwise, without the prior written permission of OSIsoft, Inc.
© Copyright 1995-2009 OSIsoft, LLC, 777 Davis St., Suite 250, San Leandro, CA 94577
Page 64
Extra Credit Step-by-Step Solution
1. Find an image on the internet and save it to your desktop
(Right-click > Save Picture As…).
2. Resize the image as necessary. The size of the image
displayed is how it will appear on your webpage.
3. Click on Shared Documents on your website.
4. Click on the Upload Document link.
5. Browse to your picture and click on the Open button.
6. Click on your uploaded picture.
7. Copy the URL to your clipboard (Right-click > Copy
Shortcut).
8. Navigate back to your home page.
9. Click on Site Actions > Edit Page.
10. In the Site Image box, click on the Edit > Modify
Shared Web Part link.
11. Paste the URL of your picture to the image link.
12. Click on the OK button.
13. Click on the Exit Edit Mode link.
The Visuals: PI ProcessBook, PI DataLink, and RtWebParts
All rights reserved. No part of this publication may be reproduced, stored in a retrieval
system, or transmitted, in any form or by any means, mechanical, photocopying, recording, or otherwise, without the prior written permission of OSIsoft, Inc.
© Copyright 1995-2009 OSIsoft, LLC, 777 Davis St., Suite 250, San Leandro, CA 94577
Page 65
5.3 Using and Configuring RtWebParts
RtWebParts are third party web parts that can be used to display processes, documents and
information for effective team collaboration based on Microsoft SharePoint technology. The
special features of the web parts included in RtWebParts are that they can request and render
data from RtBaseline (PI, relational, and web service data sources) and that they
update/refresh automatically.
The following configuration section applies to all RtWebParts:
Time Range
Selected Data
Appearance
Layout
Advanced
The RtWebParts Tag Search is similar to PI smart clients tag search. Advanced and default
search modes can be toggled by hitting the More/Less link in the upper right corner.
5.3.1 RtGauge
The simplest RtWebPart is the RtGauge. The RtGauge web part displays an analog style
gauge with a pointer that indicates the real-time value of the configured data point with
respect to the scale around the perimeter. Hovering over the gauge causes a tooltip to appear
indicating the displayed real-time value. Only one data point can be represented per gauge.
Many gauges can be added to the web part in horizontal or vertical format. The following
configuration section applies specifically to the RtGauge part:
Format
Legend
Zone and Scale
You can open an Ad hoc Trend of the tag over the time range specified in the RtGauge
configuration by selecting the Ad hoc Trend option from the RtGauge web part menu.
5.3.2 Exercise – Configure the RtGauge
The following exercise is intended to reinforce key information presented in this
chapter or section. The answer can be found at the end of the exercise.
Objectives
Familiarize yourself with configuring a web part.
Problem Description
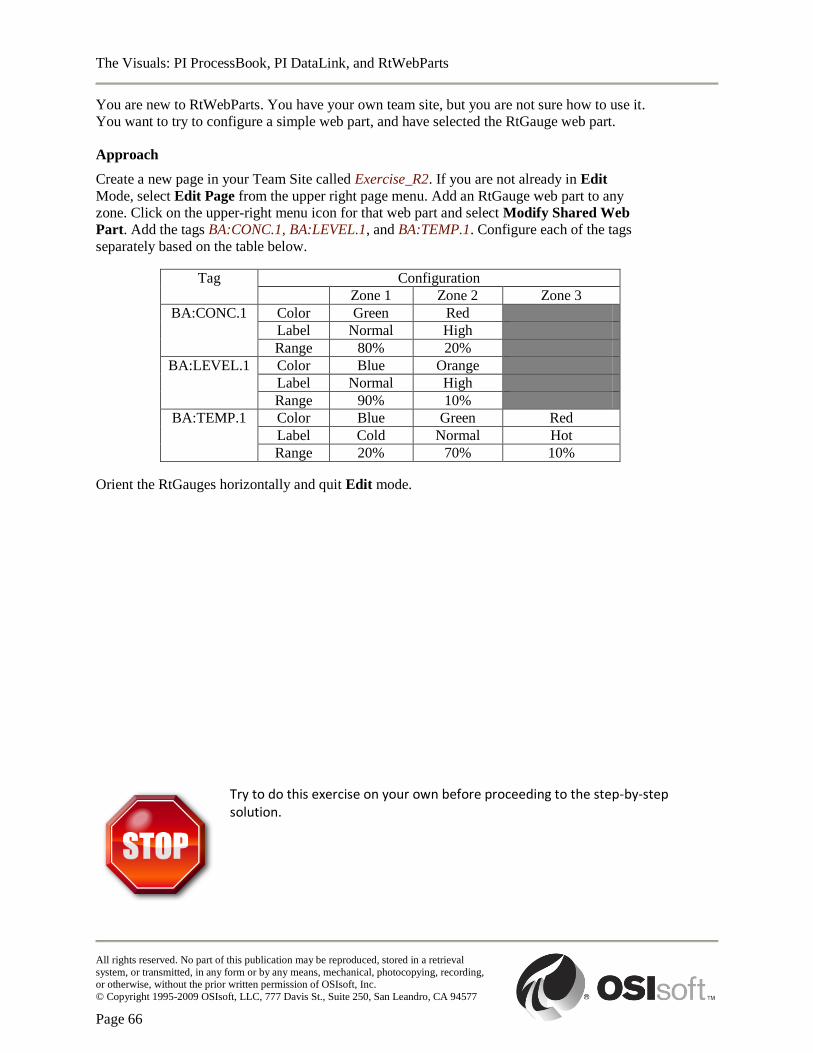
The Visuals: PI ProcessBook, PI DataLink, and RtWebParts
All rights reserved. No part of this publication may be reproduced, stored in a retrieval
system, or transmitted, in any form or by any means, mechanical, photocopying, recording, or otherwise, without the prior written permission of OSIsoft, Inc.
© Copyright 1995-2009 OSIsoft, LLC, 777 Davis St., Suite 250, San Leandro, CA 94577
Page 66
You are new to RtWebParts. You have your own team site, but you are not sure how to use it.
You want to try to configure a simple web part, and have selected the RtGauge web part.
Approach
Create a new page in your Team Site called Exercise_R2. If you are not already in Edit
Mode, select Edit Page from the upper right page menu. Add an RtGauge web part to any
zone. Click on the upper-right menu icon for that web part and select Modify Shared Web
Part. Add the tags BA:CONC.1, BA:LEVEL.1, and BA:TEMP.1. Configure each of the tags
separately based on the table below.
Tag Configuration
Zone 1 Zone 2 Zone 3
BA:CONC.1 Color Green Red
Label Normal High
Range 80% 20%
BA:LEVEL.1 Color Blue Orange
Label Normal High
Range 90% 10%
BA:TEMP.1 Color Blue Green Red
Label Cold Normal Hot
Range 20% 70% 10%
Orient the RtGauges horizontally and quit Edit mode.
Try to do this exercise on your own before proceeding to the step-by-step solution.
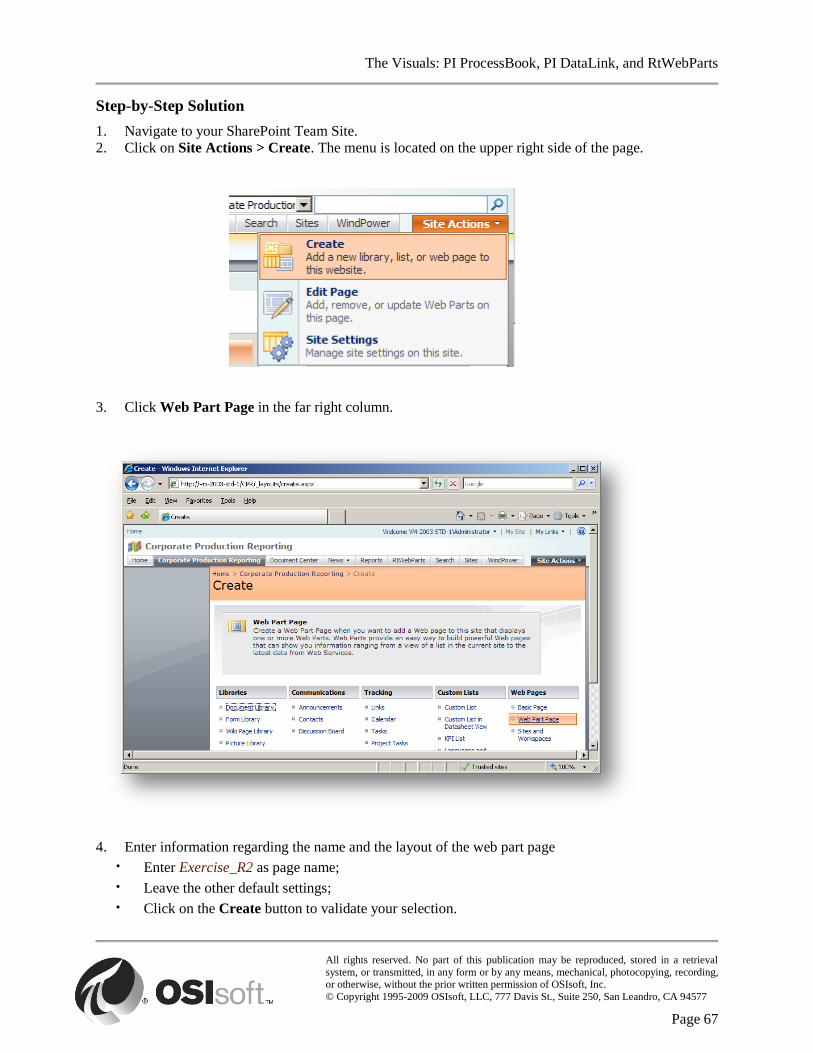
The Visuals: PI ProcessBook, PI DataLink, and RtWebParts
All rights reserved. No part of this publication may be reproduced, stored in a retrieval
system, or transmitted, in any form or by any means, mechanical, photocopying, recording, or otherwise, without the prior written permission of OSIsoft, Inc.
© Copyright 1995-2009 OSIsoft, LLC, 777 Davis St., Suite 250, San Leandro, CA 94577
Page 67
Step-by-Step Solution
1. Navigate to your SharePoint Team Site.
2. Click on Site Actions > Create. The menu is located on the upper right side of the page.
3. Click Web Part Page in the far right column.
4. Enter information regarding the name and the layout of the web part page
· Enter Exercise_R2 as page name;
· Leave the other default settings;
· Click on the Create button to validate your selection.
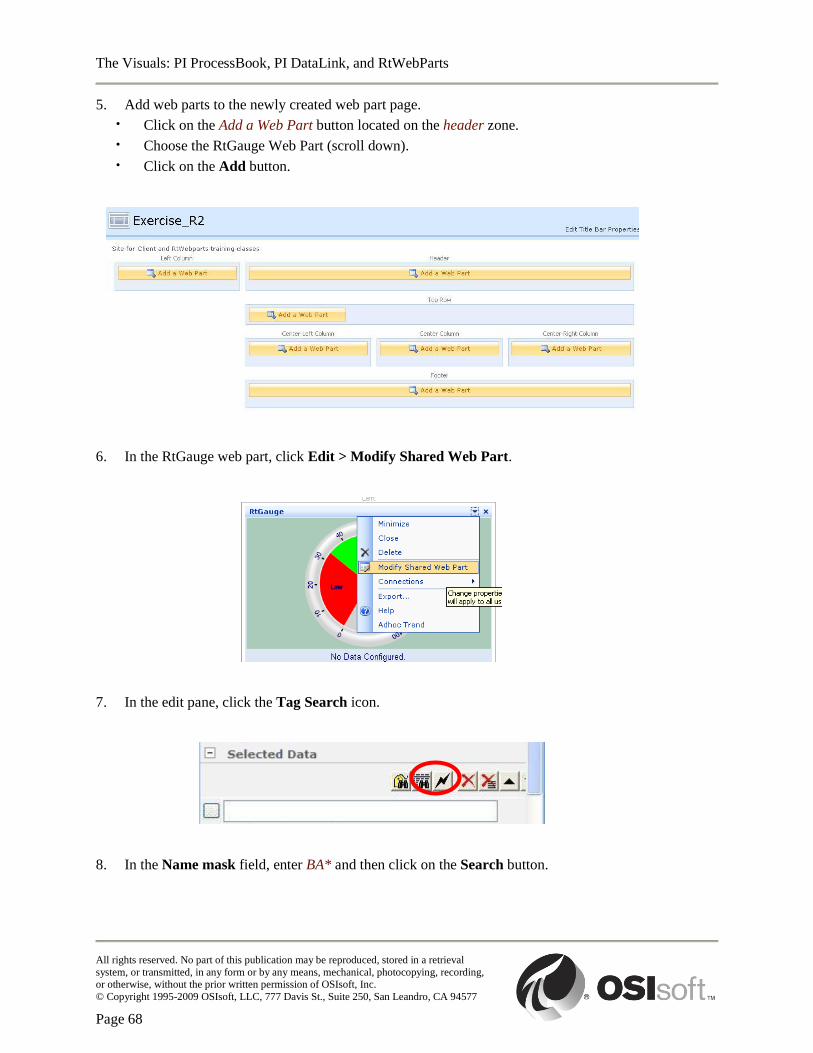
The Visuals: PI ProcessBook, PI DataLink, and RtWebParts
All rights reserved. No part of this publication may be reproduced, stored in a retrieval
system, or transmitted, in any form or by any means, mechanical, photocopying, recording, or otherwise, without the prior written permission of OSIsoft, Inc.
© Copyright 1995-2009 OSIsoft, LLC, 777 Davis St., Suite 250, San Leandro, CA 94577
Page 68
5. Add web parts to the newly created web part page.
· Click on the Add a Web Part button located on the header zone.
· Choose the RtGauge Web Part (scroll down).
· Click on the Add button.
6. In the RtGauge web part, click Edit > Modify Shared Web Part.
7. In the edit pane, click the Tag Search icon.
8. In the Name mask field, enter BA* and then click on the Search button.
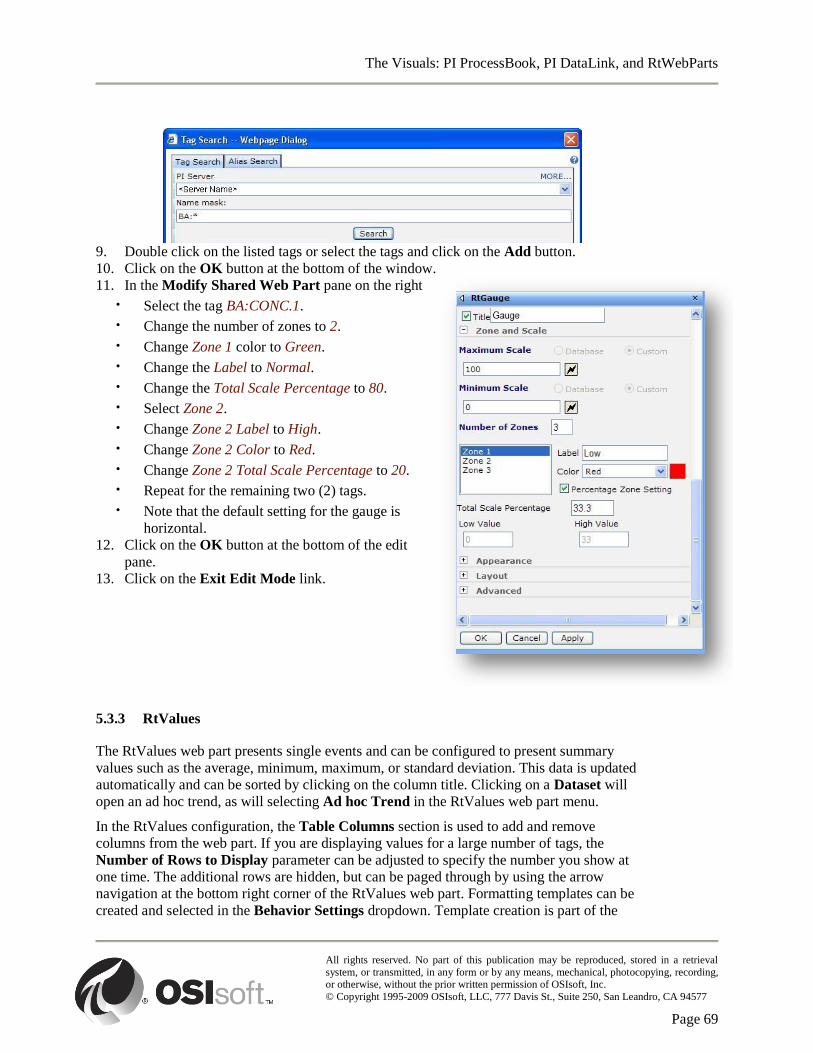
The Visuals: PI ProcessBook, PI DataLink, and RtWebParts
All rights reserved. No part of this publication may be reproduced, stored in a retrieval
system, or transmitted, in any form or by any means, mechanical, photocopying, recording, or otherwise, without the prior written permission of OSIsoft, Inc.
© Copyright 1995-2009 OSIsoft, LLC, 777 Davis St., Suite 250, San Leandro, CA 94577
Page 69
9. Double click on the listed tags or select the tags and click on the Add button.
10. Click on the OK button at the bottom of the window.
11. In the Modify Shared Web Part pane on the right
· Select the tag BA:CONC.1.
· Change the number of zones to 2.
· Change Zone 1 color to Green.
· Change the Label to Normal.
· Change the Total Scale Percentage to 80.
· Select Zone 2.
· Change Zone 2 Label to High.
· Change Zone 2 Color to Red.
· Change Zone 2 Total Scale Percentage to 20.
· Repeat for the remaining two (2) tags.
· Note that the default setting for the gauge is
horizontal.
12. Click on the OK button at the bottom of the edit
pane.
13. Click on the Exit Edit Mode link.
5.3.3 RtValues
The RtValues web part presents single events and can be configured to present summary
values such as the average, minimum, maximum, or standard deviation. This data is updated
automatically and can be sorted by clicking on the column title. Clicking on a Dataset will
open an ad hoc trend, as will selecting Ad hoc Trend in the RtValues web part menu.
In the RtValues configuration, the Table Columns section is used to add and remove
columns from the web part. If you are displaying values for a large number of tags, the
Number of Rows to Display parameter can be adjusted to specify the number you show at
one time. The additional rows are hidden, but can be paged through by using the arrow
navigation at the bottom right corner of the RtValues web part. Formatting templates can be
created and selected in the Behavior Settings dropdown. Template creation is part of the
The Visuals: PI ProcessBook, PI DataLink, and RtWebParts
All rights reserved. No part of this publication may be reproduced, stored in a retrieval
system, or transmitted, in any form or by any means, mechanical, photocopying, recording, or otherwise, without the prior written permission of OSIsoft, Inc.
© Copyright 1995-2009 OSIsoft, LLC, 777 Davis St., Suite 250, San Leandro, CA 94577
Page 70
RtWebParts User and Administration class and is beyond the scope of this course. For now,
we will leave this with the default. The Summary Parameters section is used to configure
the Calculation Interval, Interval Type, Sync Time and Conversion factor (which is only
applicable to Totalizations). You can also choose to use the web part time range and to
display the summary settings.
There are three types of Intervals that can be chosen. The first is type Fixed. If you have an
average that is being calculated over an hour and it is scheduled on the hour, then the Fixed
Interval will only display the last fully run hour and will not update during the hour. The
second Interval type is Running. Using the same calculation as before, this Interval type will
begin the average calculation at the top of the hour and continuously update the average over
the course of the hour as new data becomes available. The final Interval type is Moving.
Again using the concept of an hour average, this Interval type will calculate the average over
the last hour, or, expressed in PI Time, *-1h to *.
5.3.4 Exercise – Configure RtValues WebPart
The following exercise is intended to reinforce key information presented in this
chapter or section. The answer can be found at the end of the exercise.
Objectives
Configure the RtValues web part.
Problem Description
You understand how to configure a basic web part. You want to try the RtValues web part.
Approach
Create a new page in your Team Site called Exercise_R3. Add one RtValues web part to any zone. Add
all of the tags that begin with BA: to the data area. In the selected columns choose DataSet, Time, Value,
Interval Minimum, and Interval Maximum. The Calculation Interval should be set to 24h and the sync
time to 00:00:00 (this will give yesterday‟s statistics). You want to display the Summary Settings in the
web part. Click on the OK button and on the Exit Edit Mode link.
Try to do this exercise on your own before proceeding to the step-by-step solution.
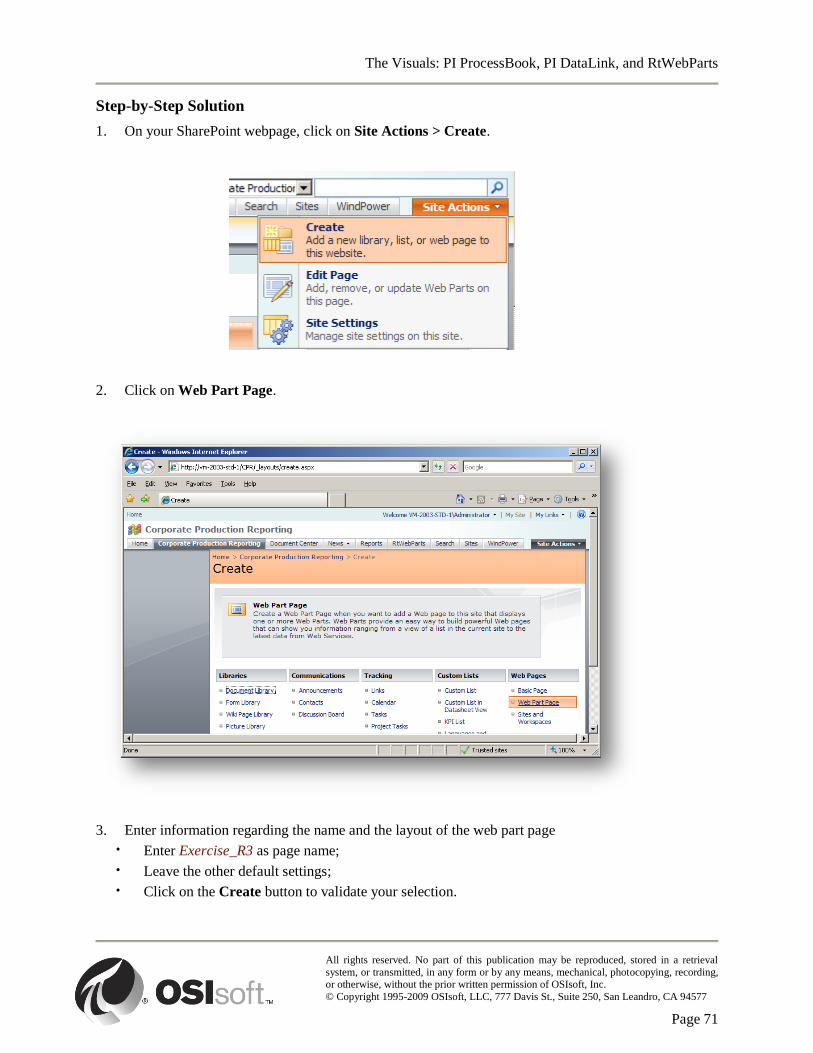
The Visuals: PI ProcessBook, PI DataLink, and RtWebParts
All rights reserved. No part of this publication may be reproduced, stored in a retrieval
system, or transmitted, in any form or by any means, mechanical, photocopying, recording, or otherwise, without the prior written permission of OSIsoft, Inc.
© Copyright 1995-2009 OSIsoft, LLC, 777 Davis St., Suite 250, San Leandro, CA 94577
Page 71
Step-by-Step Solution
1. On your SharePoint webpage, click on Site Actions > Create.
2. Click on Web Part Page.
3. Enter information regarding the name and the layout of the web part page
· Enter Exercise_R3 as page name;
· Leave the other default settings;
· Click on the Create button to validate your selection.
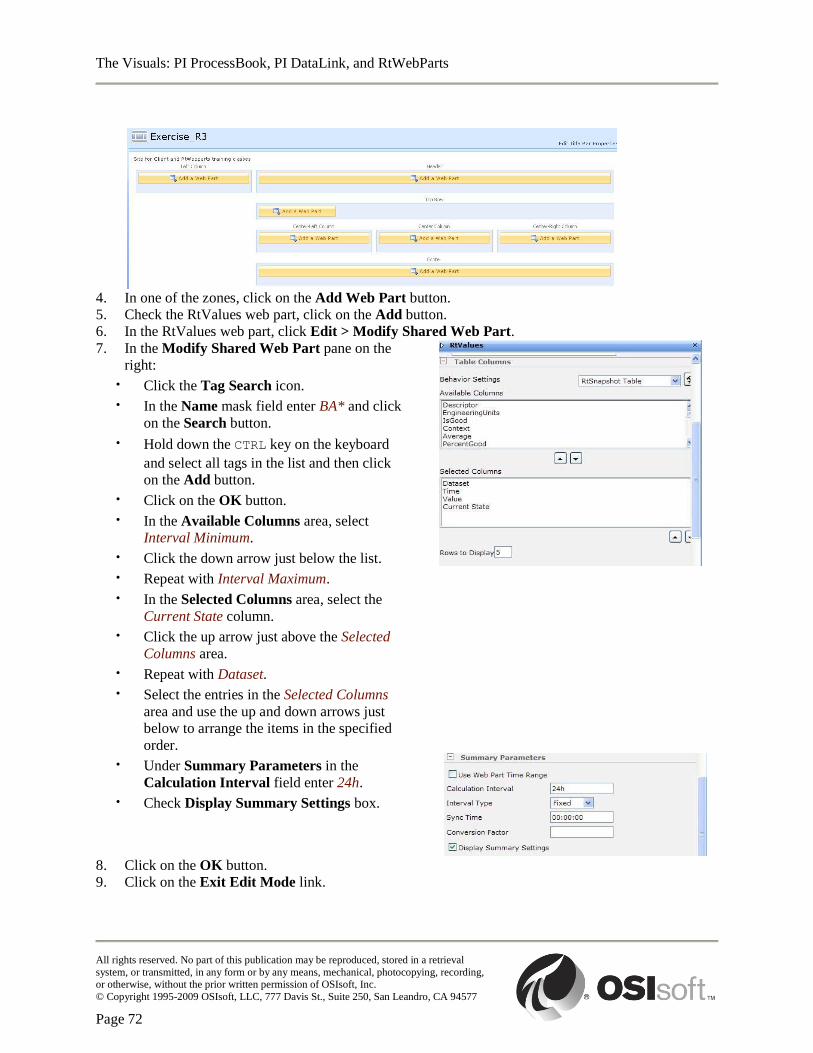
The Visuals: PI ProcessBook, PI DataLink, and RtWebParts
All rights reserved. No part of this publication may be reproduced, stored in a retrieval
system, or transmitted, in any form or by any means, mechanical, photocopying, recording, or otherwise, without the prior written permission of OSIsoft, Inc.
© Copyright 1995-2009 OSIsoft, LLC, 777 Davis St., Suite 250, San Leandro, CA 94577
Page 72
4. In one of the zones, click on the Add Web Part button.
5. Check the RtValues web part, click on the Add button.
6. In the RtValues web part, click Edit > Modify Shared Web Part.
7. In the Modify Shared Web Part pane on the
right:
· Click the Tag Search icon.
· In the Name mask field enter BA* and click
on the Search button.
· Hold down the CTRL key on the keyboard
and select all tags in the list and then click
on the Add button.
· Click on the OK button.
· In the Available Columns area, select
Interval Minimum.
· Click the down arrow just below the list.
· Repeat with Interval Maximum.
· In the Selected Columns area, select the
Current State column.
· Click the up arrow just above the Selected
Columns area.
· Repeat with Dataset.
· Select the entries in the Selected Columns
area and use the up and down arrows just
below to arrange the items in the specified
order.
· Under Summary Parameters in the
Calculation Interval field enter 24h.
· Check Display Summary Settings box.
8. Click on the OK button.
9. Click on the Exit Edit Mode link.
The Visuals: PI ProcessBook, PI DataLink, and RtWebParts
All rights reserved. No part of this publication may be reproduced, stored in a retrieval
system, or transmitted, in any form or by any means, mechanical, photocopying, recording, or otherwise, without the prior written permission of OSIsoft, Inc.
© Copyright 1995-2009 OSIsoft, LLC, 777 Davis St., Suite 250, San Leandro, CA 94577
Page 73
5.3.5 RtTimeSeries
The RtTimeSeries web part presents columns and rows of time series (archived) data. The
configuration of this web part is nearly identical to that of the RtValues previously presented.
The biggest difference is that this web part uses the time range specified as the bounds of the
data that it retrieves.
It should be noted that data contained in the RtTimeseries and RtValues tables can also be
exported to Excel by selecting the Export to Excel>Open option from the web part menu.
Note: It is a known issue that the Export to Excel>Save function does not work. The work around is to
use the Export to Excel>Open and then save the opened Excel spreadsheet.
5.3.6 Group Recap Questions
The following questions are intended to reinforce key information presented in this
chapter or section. The answers can be found at the end of this document.
Questions
1. True or False: To obtain their values, the RtWebParts are connecting directly to a PI server.
2. True or False: If you need to display four gauges on your page, you need to insert and configure four
RtGauge web parts.
Answers
1. False, the RtWebParts connect to RtBaseline. It is RtBaseline that maintains a connection to the PI
server(s) and also to the external data sources.
2. False, a single RtGauge web part can be configured to display multiple gauges.
5.3.7 Exercise – Configure RtTimeSeries WebPart
The following exercise is intended to reinforce key information presented in this
chapter or section. The answer can be found at the end of the exercise.
Objectives
Familiarize yourself with configuring an RtTimeSeries web part.
Problem Description

The Visuals: PI ProcessBook, PI DataLink, and RtWebParts
All rights reserved. No part of this publication may be reproduced, stored in a retrieval
system, or transmitted, in any form or by any means, mechanical, photocopying, recording, or otherwise, without the prior written permission of OSIsoft, Inc.
© Copyright 1995-2009 OSIsoft, LLC, 777 Davis St., Suite 250, San Leandro, CA 94577
Page 74
You want to see historical data for a tag.
Approach
Create a new page in your Team Site called Exercise_R4. Add one RtTimeSeries web part. Configure it to
show the last 4 hours of data for the tag CDT158.
Try to do this exercise on your own before proceeding to the step-by-step solution.
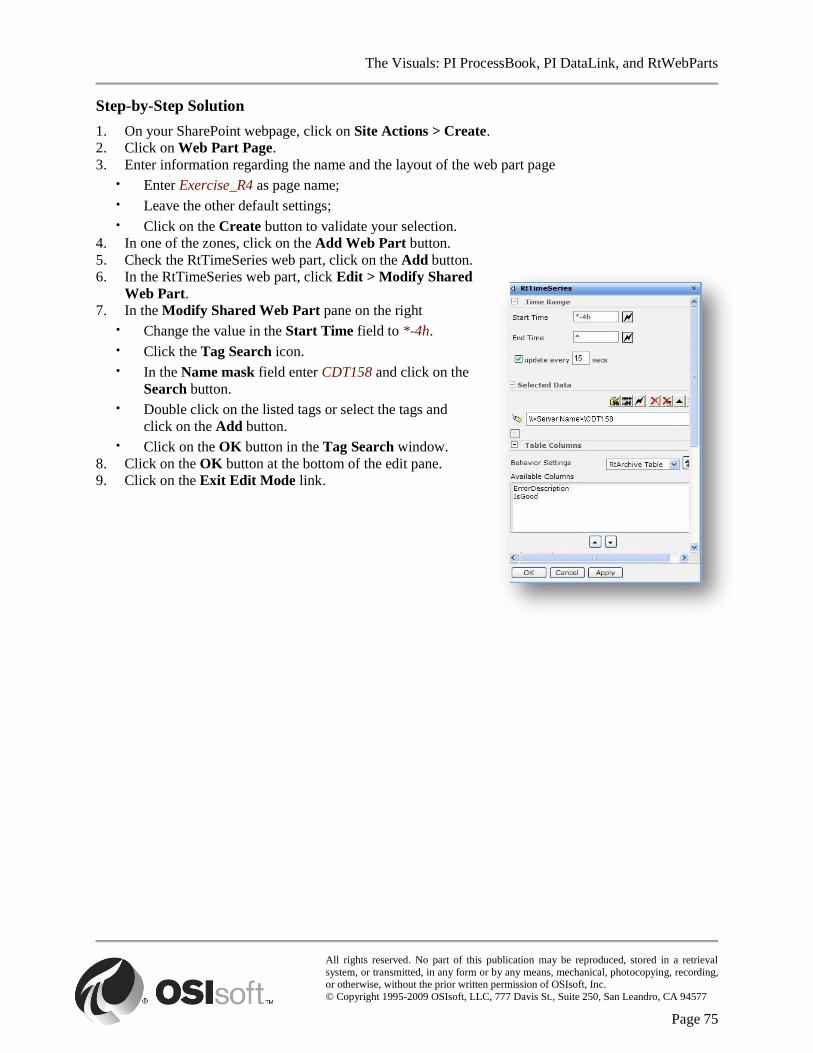
The Visuals: PI ProcessBook, PI DataLink, and RtWebParts
All rights reserved. No part of this publication may be reproduced, stored in a retrieval
system, or transmitted, in any form or by any means, mechanical, photocopying, recording, or otherwise, without the prior written permission of OSIsoft, Inc.
© Copyright 1995-2009 OSIsoft, LLC, 777 Davis St., Suite 250, San Leandro, CA 94577
Page 75
Step-by-Step Solution
1. On your SharePoint webpage, click on Site Actions > Create.
2. Click on Web Part Page.
3. Enter information regarding the name and the layout of the web part page
· Enter Exercise_R4 as page name;
· Leave the other default settings;
· Click on the Create button to validate your selection.
4. In one of the zones, click on the Add Web Part button.
5. Check the RtTimeSeries web part, click on the Add button.
6. In the RtTimeSeries web part, click Edit > Modify Shared
Web Part.
7. In the Modify Shared Web Part pane on the right
· Change the value in the Start Time field to *-4h.
· Click the Tag Search icon.
· In the Name mask field enter CDT158 and click on the
Search button.
· Double click on the listed tags or select the tags and
click on the Add button.
· Click on the OK button in the Tag Search window.
8. Click on the OK button at the bottom of the edit pane.
9. Click on the Exit Edit Mode link.
The Visuals: PI ProcessBook, PI DataLink, and RtWebParts
All rights reserved. No part of this publication may be reproduced, stored in a retrieval
system, or transmitted, in any form or by any means, mechanical, photocopying, recording, or otherwise, without the prior written permission of OSIsoft, Inc.
© Copyright 1995-2009 OSIsoft, LLC, 777 Davis St., Suite 250, San Leandro, CA 94577
Page 76
6. More PI ProcessBook
6.1 Dynamic Elements
Dynamic Elements are ProcessBook objects that are linked to PI data and that update in real-
time. The following Dynamic Elements can be added to a display:
Trend
XY Plots
Bar Graphs
Dynamic Values
Multi-State Objects
Hovering the mouse cursor over an object presents an Identifying Tooltip. The Tooltip
shows the object's associated tag's current value. If the object is multi-state, it also presents
the current state.
Data Favorites is a way to store a persistent list of the tags you reference the most often. It is
accessed by View> Data Favorites. This allows you to configure dynamic elements by
dropping a Datasource from the list onto the display or element. You specify if you would
like to create a Bar, Trend, Dynamic Value or XY Plot elements when a data reference is
dropped. Additional traces are added when dropped onto an existing Trend or XY Plot. You
can also create multiple items at a time.
The Data Favorites pane consists of two sections, the Search and Favorites sections. The
Search section is where you can search for tags based on tag mask or use the Tag Search icon
to open a dialog for increased search options. When the tags are listed, you can drag and drop
individual tags into your Favorites section, or you can select one or multiple tags, right-click,
and then select Add to Favorites. The list of Data Favorites is local to the machine only. So
to propagate a consistent list of Data Favorites across multiple physical machines, it is
possible to import and export your list of Data Favorites to and from a file. Simply right-click
in the Favorites section and choose the appropriate action. You can import favorite tags from
any applications supporting drag and drop like Excel, Word, etc.
6.1.1 Trends
To build a trend in a display, you must first be in Build mode. There are then three different
ways to build a trend. You can just drag and drop the Data Favorite with the Trend option
selected. Alternatively, you can use the menu option by selecting Draw > Trend or use the
toolbar by clicking on the Trend icon. Then draw a rectangle with the mouse to define the
size of the trend. A design window with four different tabs allows configuration of the trend:
General;
Display Format;
Trace Format;
Layout.

The Visuals: PI ProcessBook, PI DataLink, and RtWebParts
All rights reserved. No part of this publication may be reproduced, stored in a retrieval
system, or transmitted, in any form or by any means, mechanical, photocopying, recording, or otherwise, without the prior written permission of OSIsoft, Inc.
© Copyright 1995-2009 OSIsoft, LLC, 777 Davis St., Suite 250, San Leandro, CA 94577
Page 77
Under the General Tab you will name the trend under Plot and select PI tags or Data Sets to
display using the Tag Search or Data Sets buttons. There is a maximum of fifty traces by
default, but this setting can be changed. You can adjust the vertical axis to use a single,
multiple, or logarithmic scale. You can also add a regression line in the form y=mx+b,
where m is the slope and b is the y-intercept. The scale Minimum and Maximum can be set
to use the Database, which uses the tag‟s zero and span to determine minimum and
maximum, Autorange, which uses the minimum and maximum values recorded over the
specified time range, or User Defined, where the user can specify an absolute range.
You will also need to specify the Start and End times. There are several predefined time
ranges provided in a drop down menu, but you can also enter your own PI Time, whether it is
an absolute or a combined time. You also have three choices as to how the timestamp is
displayed: full, partial, or relative timestamp.
When you first build the trend, you can create more than one trend at a time using the
New/Delete options. Each time you click the New button, it will add an entire other trend,
rather than add an additional trace to the existing trend. You can use the drop down menu of
Plot Names to cycle through the different trends and configure each one separately.
Under the Display Format tab, you get to customize how the trend is displayed. You can use
the radio buttons to set whether the trend tracks horizontally (default) or vertically. There are
a number of checkboxes that control the Legend and Display. The choices are:
Tag name (right side, default);
Description (under the trend);
Value (right side, default);
Engineering units (right side, default).
Title (upper left corner, default);
Vertical axis scale inside (default);
Grid (default);
Markers (indicates PI archived values).
The sample window at the bottom allows you to view the selected options. According to the
space available for a trend, some elements might not show even if they were selected. In Full
Screen mode, all options are automatically displayed.
The Trace Format Tab is used to define pens, text, axis and background:
Color;
Marker type;
Line style ;
Line thickness.
Again, the sample window allows you to view the selected options.
The Layout tab is only available during trend creation. This tab allows the user to define the
respective position of different trends when multiple trends are created at once. To add a new
trend in the current window, use the New Plot tool in the General tab. A preview is shown
on the building screen. Click on the zone to update the display.
The Visuals: PI ProcessBook, PI DataLink, and RtWebParts
All rights reserved. No part of this publication may be reproduced, stored in a retrieval
system, or transmitted, in any form or by any means, mechanical, photocopying, recording, or otherwise, without the prior written permission of OSIsoft, Inc.
© Copyright 1995-2009 OSIsoft, LLC, 777 Davis St., Suite 250, San Leandro, CA 94577
Page 78
Note: The trends that were built in this method are no longer connected in any way and can be edited and
moved independently.
You can also use the toolbar to quickly set the Trend:
Font
Font size
Font style
Trend background
Use the Format paintbrush to copy the formatting properties to another trend. Double-clicking
the Formatting Paintbrush button allows you to apply formatting to more than one symbol.
To turn off the formatting paintbrush selection, click the button again or press the ESC key.
6.1.2 XY Plots
XY Plots, also known as Scatter Plots, are used to show relationships between value sets. It is
a powerful tool to graphically show the correlation between two or more tags.
Values on the horizontal scale (x-axis) represent the values of a PI point rather than time. To
create an XY Plot, you again must be in Build mode. You can then drag and drop from the
Data Favorites pane with XY Plot as your default dynamic element. Or you can go through
the Draw>XY Plot menu or the XY Plot icon on the toolbar. This action will open up a new
dialog similar to the Trend configuration dialog.
In the Define XY Plot dialog box the first tag you select will become the base for the plot
(the radio button will be selected). The base will be set at the position of the x-axis. The
second and any additional tags will be represented against the y-axis. You can change the tag
used as the base tag by selecting a different tag‟s radio button.
Under Data Retrieval Methods, you can select whether you will use the interpolated values,
or the actual recorded values. If you select interpolated values, you will have to specify an
interval to use as the sampling rate.
All tags you select to participate in the XY Plot whose radio buttons are blank will be
represented along the y-axis. You have a number of options for data retrieval. As with the
base tag, if you select interpolated, you will have to specify an interval to use as the sampling
rate. Your data retrieval method applies to individually selected tags in the Tags in Plot List
(unless Use for all Y tags is checked). The default data retrieval method is Synchronize.
To use multiple time ranges, select Recorded or Interpolated. In this case, data is paired by
position in the point list. If Interpolated is selected for the X Tag as well, the interval value
for the Y tag defaults to the one for the X tag. When Recorded is the retrieval mechanism,
the results are not skewed by minor timestamp differences.
To pair values by time, rather than by list position, choose one of these retrieval methods:
Synchronize, Match, Match or Previous, or Match or Next.
Match: This option will find the point for the y-axis corresponding to the exact
timestamp for the x-axis.

The Visuals: PI ProcessBook, PI DataLink, and RtWebParts
All rights reserved. No part of this publication may be reproduced, stored in a retrieval
system, or transmitted, in any form or by any means, mechanical, photocopying, recording, or otherwise, without the prior written permission of OSIsoft, Inc.
© Copyright 1995-2009 OSIsoft, LLC, 777 Davis St., Suite 250, San Leandro, CA 94577
Page 79
Match or Previous: This option will find the point for the y-axis corresponding to
the exact timestamp for the x-axis. If there is none, it will find the value that is the
closest but at an earlier timestamp.
Match or Next: This option will find the point for the y-axis corresponding to the
exact timestamp for the x-axis. If there is none, it will find the value that is the
closest but at a later timestamp.
Synchronize: This option will synchronize data found for the x-axis with data for
the y-axis using the timestamps for the x-axis data.
Synchronize and Match use different PI SDK value retrieval methods. Synchronize uses
TimedValues. Match uses RecordedValues and then uses the ones where the timestamps
match.
Synchronize is disabled for ODBC and Custom Data Sets. If Synchronize or any of the
Match selections are chosen, the start and end times for that tag are set to the ones for the x-
axis tag.
Statistics are available for XYPlots. To access the Statistics Window, double-click on the top
part of the XY plot element.
You can always edit a Trend or XYPlot after it has been created. Select a trend, and click on
Edit > Selected Item or Double-click on the trend in Build mode.
6.1.3 Exercise – Building Trends in ProcessBook
The following exercise is intended to reinforce key information presented in this
chapter or section. The answer can be found at the end of the exercise.
Objectives
Build trends.
Familiarize yourself with the different trend building options.
Problem Description
You are now ready to create a trend with PI tags. You will need a new display in your workbook to do
this. Make sure you create the display inside your workbook.
Approach
Create a ProcessBook independent display file called Exercise PB3.PDI. The goal of this exercise is to
build a trend similar to the figure below using the following steps:
Add a trend containing the SINUSOID tag. Use the trend item from the tool bar.
(Hint: Make sure you are in build mode)
Make the trend show the last 5 days of values;
Label the trend so the title reads Exercise PB3.
If the time permits, add a second trend showing all of the tags that begin with the letters BA:.

The Visuals: PI ProcessBook, PI DataLink, and RtWebParts
All rights reserved. No part of this publication may be reproduced, stored in a retrieval
system, or transmitted, in any form or by any means, mechanical, photocopying, recording, or otherwise, without the prior written permission of OSIsoft, Inc.
© Copyright 1995-2009 OSIsoft, LLC, 777 Davis St., Suite 250, San Leandro, CA 94577
Page 80
Try to do this exercise on your own before proceeding to the step-by-step solution.
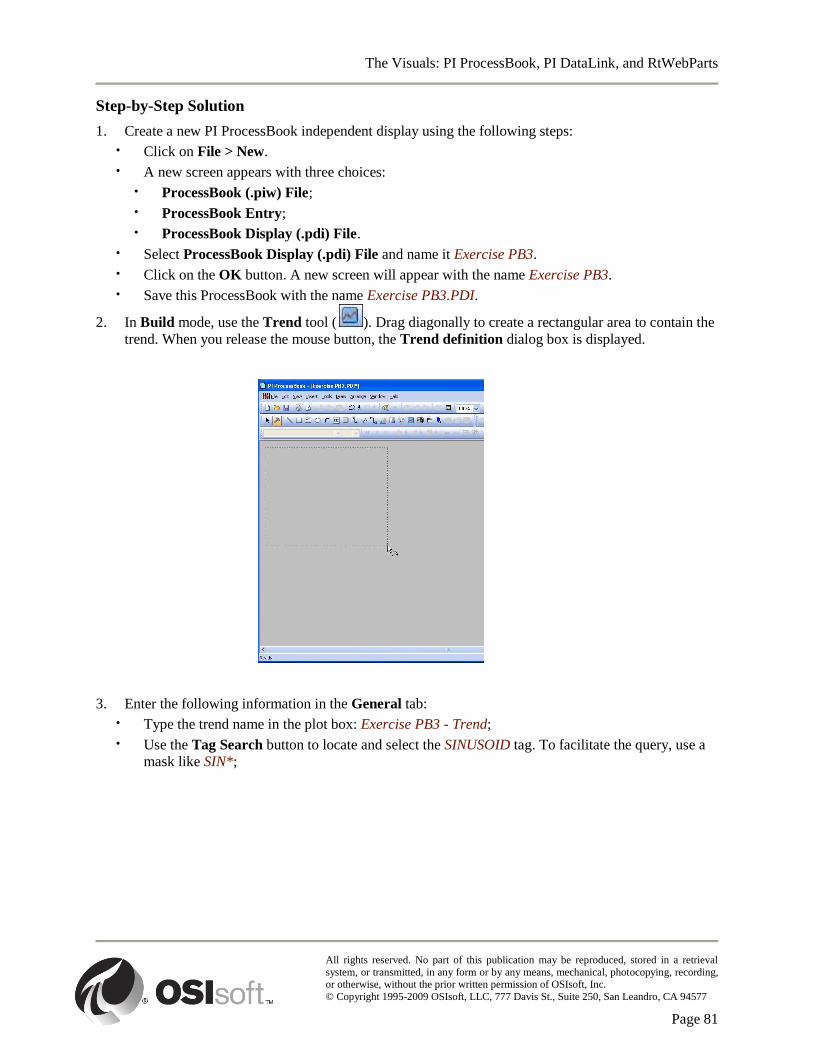
The Visuals: PI ProcessBook, PI DataLink, and RtWebParts
All rights reserved. No part of this publication may be reproduced, stored in a retrieval
system, or transmitted, in any form or by any means, mechanical, photocopying, recording, or otherwise, without the prior written permission of OSIsoft, Inc.
© Copyright 1995-2009 OSIsoft, LLC, 777 Davis St., Suite 250, San Leandro, CA 94577
Page 81
Step-by-Step Solution
1. Create a new PI ProcessBook independent display using the following steps:
· Click on File > New.
· A new screen appears with three choices:
· ProcessBook (.piw) File;
· ProcessBook Entry;
· ProcessBook Display (.pdi) File.
· Select ProcessBook Display (.pdi) File and name it Exercise PB3.
· Click on the OK button. A new screen will appear with the name Exercise PB3.
· Save this ProcessBook with the name Exercise PB3.PDI.
2. In Build mode, use the Trend tool ( ). Drag diagonally to create a rectangular area to contain the
trend. When you release the mouse button, the Trend definition dialog box is displayed.
3. Enter the following information in the General tab:
· Type the trend name in the plot box: Exercise PB3 - Trend;
· Use the Tag Search button to locate and select the SINUSOID tag. To facilitate the query, use a
mask like SIN*;
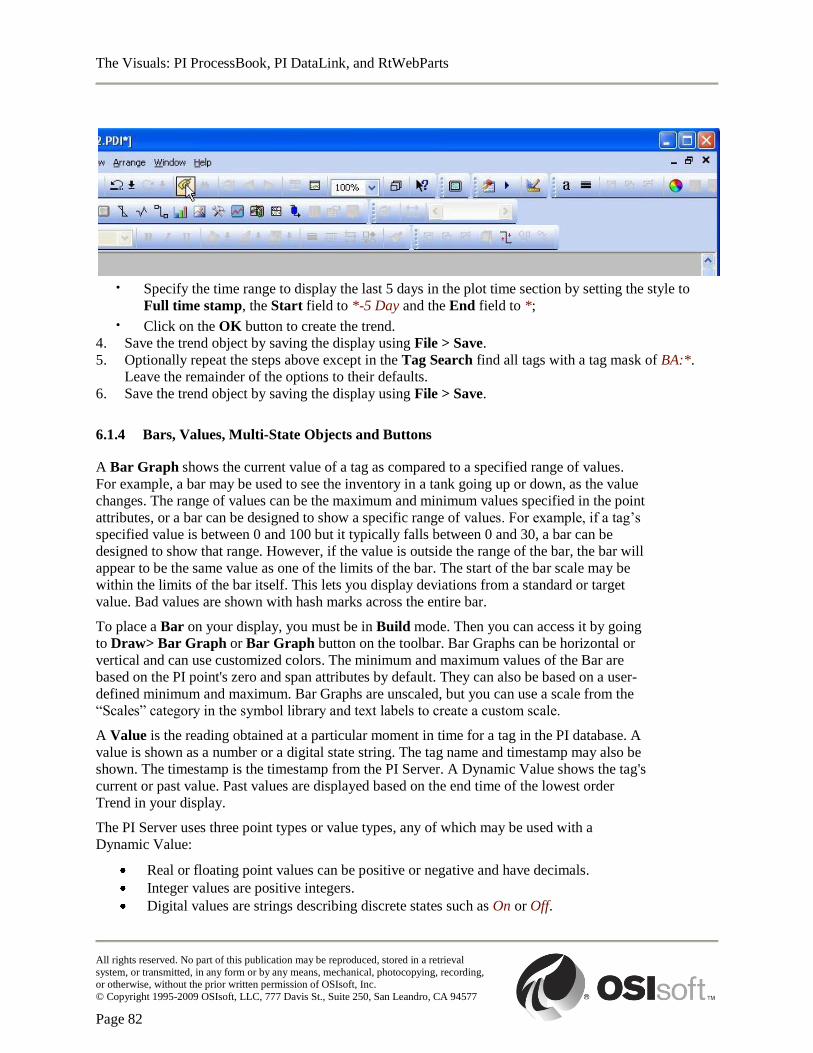
The Visuals: PI ProcessBook, PI DataLink, and RtWebParts
All rights reserved. No part of this publication may be reproduced, stored in a retrieval
system, or transmitted, in any form or by any means, mechanical, photocopying, recording, or otherwise, without the prior written permission of OSIsoft, Inc.
© Copyright 1995-2009 OSIsoft, LLC, 777 Davis St., Suite 250, San Leandro, CA 94577
Page 82
· Specify the time range to display the last 5 days in the plot time section by setting the style to
Full time stamp, the Start field to *-5 Day and the End field to *;
· Click on the OK button to create the trend.
4. Save the trend object by saving the display using File > Save.
5. Optionally repeat the steps above except in the Tag Search find all tags with a tag mask of BA:*.
Leave the remainder of the options to their defaults.
6. Save the trend object by saving the display using File > Save.
6.1.4 Bars, Values, Multi-State Objects and Buttons
A Bar Graph shows the current value of a tag as compared to a specified range of values.
For example, a bar may be used to see the inventory in a tank going up or down, as the value
changes. The range of values can be the maximum and minimum values specified in the point
attributes, or a bar can be designed to show a specific range of values. For example, if a tag‟s
specified value is between 0 and 100 but it typically falls between 0 and 30, a bar can be
designed to show that range. However, if the value is outside the range of the bar, the bar will
appear to be the same value as one of the limits of the bar. The start of the bar scale may be
within the limits of the bar itself. This lets you display deviations from a standard or target
value. Bad values are shown with hash marks across the entire bar.
To place a Bar on your display, you must be in Build mode. Then you can access it by going
to Draw> Bar Graph or Bar Graph button on the toolbar. Bar Graphs can be horizontal or
vertical and can use customized colors. The minimum and maximum values of the Bar are
based on the PI point's zero and span attributes by default. They can also be based on a user-
defined minimum and maximum. Bar Graphs are unscaled, but you can use a scale from the
“Scales” category in the symbol library and text labels to create a custom scale.
A Value is the reading obtained at a particular moment in time for a tag in the PI database. A
value is shown as a number or a digital state string. The tag name and timestamp may also be
shown. The timestamp is the timestamp from the PI Server. A Dynamic Value shows the tag's
current or past value. Past values are displayed based on the end time of the lowest order
Trend in your display.
The PI Server uses three point types or value types, any of which may be used with a
Dynamic Value:
Real or floating point values can be positive or negative and have decimals.
Integer values are positive integers.
Digital values are strings describing discrete states such as On or Off.
The Visuals: PI ProcessBook, PI DataLink, and RtWebParts
All rights reserved. No part of this publication may be reproduced, stored in a retrieval
system, or transmitted, in any form or by any means, mechanical, photocopying, recording, or otherwise, without the prior written permission of OSIsoft, Inc.
© Copyright 1995-2009 OSIsoft, LLC, 777 Davis St., Suite 250, San Leandro, CA 94577
Page 83
You can add one by going to View> Dynamic Value or the Value button in the toolbar. The
configuration choices are very simple:
Show or not the tag name (and where)
Show or not the timestamp (and where)
Show or not the engineering units
A Multi-State symbol is one that changes color to reflect changes in value for a particular
tag. Any object except a trend, graphic, button, or OLE object can be made a Multi-State
symbol by assigning a tag to it.
You determine the number of value ranges, and the colors assigned to each range. As the
value of the tag changes, the Multi-State symbol changes color to reflect the current value.
You can make a symbol seem to disappear by setting a state color to the background color or
to a color of none. For alarms or other purposes, you can set a state color to blink. After you
have drawn a symbol or copied one from the Symbol Library, select it with the Build mode
pointer. Select Edit > Multi-State or click the Multi-State Symbol button. The Multi-State
Symbol dialog box is displayed. In the Tag Name field, type the name of the tag you want to
assign to the symbol or click the Tag Search button to use the Tag Search feature. Select the
number of states for the symbol. If the number of states is not entered, the number defaults to
two. For digital tags, the number of states is automatically set to the number of defined states
for that tag. If desired, select a color that will be used when the information is bad from the
Color For Bad Data drop-down list. In the State field, choose State 1. In the adjacent
Values fields, a range of values for this state is displayed. The total range of the tag is
automatically divided by the number of states. If desired, you may change the range for this
state by manually entering new values. The total amount must equal exactly 100% when
entered manually. You can also click the Blink checkbox to make the color blink. For digital
tags, the state name is shown in these boxes. Select the color that will be used for the state
from the Color drop-down list.
Buttons are elements that create a link to other applications, such as a calculator or word
processor, or other ProcessBook workbooks or displays. They give you the ability to navigate
to the desired information quickly, efficiently, and logically can mean the difference between
an application that is useful and one that frustrates the user. There are two types of navigation
when using PI ProcessBook, and they are not exclusive.
Using the Workbook hierarchy;
Command Buttons within displays.
For example, if you find you work often with a particular display and frequently need to
update a report with the information you have been monitoring, you can add a Button that
automatically will open a spreadsheet program. You also can use a Button to connect to
frequently used displays, other ProcessBook workbooks, or Web sites.
Adding a Button is accessed by Draw> Button or the Button icon. You can configure the
Button to launch any operating system command, recognized file type, or any VBA-
developed macro. It can also be used for an internal navigation scheme.
The Visuals: PI ProcessBook, PI DataLink, and RtWebParts
All rights reserved. No part of this publication may be reproduced, stored in a retrieval
system, or transmitted, in any form or by any means, mechanical, photocopying, recording, or otherwise, without the prior written permission of OSIsoft, Inc.
© Copyright 1995-2009 OSIsoft, LLC, 777 Davis St., Suite 250, San Leandro, CA 94577
Page 84
6.1.5 Exercise – Inserting Dynamic Elements into Displays
The following exercise is intended to reinforce key information presented in this
chapter or section. The answers can be found at the end of the exercise.
Objectives
Bar Graph;
Value of a PI Tag;
Multi-State Symbol;
Command Button.
Problem Description
Dynamic elements allow displaying changes of operating conditions in time, which facilitates the
understanding of the use of dynamic elements in schematics. With this exercise, you use the display
created in Exercise 2 and save it under Exercise PB4.PDI, add a level indicator and an alarm display (low
and high). Modify the design of the tank so that it graphically shows the level.
Approach
You need to edit the display entry in your ProcessBook display from Exercise 2 to contain the items
found in the list below (all items can be found in the Draw Menu). Try to use the Data Favorites add-in
to speed up the creation of dynamic elements.
One Dynamic Value indicating the level in the tank. You will use the tag
BA:LEVEL.1. Place that near the tank. You may wish to alter the color and size of
the text for visibility.
One Bar Graph to indicate visually the level in the tank. You will use the tag
BA:LEVEL.1. Place that over the tank body and make it slightly smaller than the
tank. This might be easier if you activate the Snap to Grid option by clicking on
Arrange > Snap to Grid. You will have to experiment with the Forward and
Backward options in the Arrange Menu to get the tank on the bottom, the bar
graph, and the mixer to display all at once.
Two Multi-state Symbols will act as visual alarms for high and low level. You will
use the tag BA:LEVEL.1 as the triggering tag. To do this, add two small circles or
squares to the display, off to one side of the tank. They will have the following
parameters:
The upper circle/square will be green if the value is below 50 and red if above
50.
The lower circle/square will be green if the value is above 10 and red if below
10.
One Multi-state Symbol will act as visual indicator of the valve position. You will
use the tag BA:ACTIVE.1. The valve itself will be a multi-state symbol with the
following parameters:
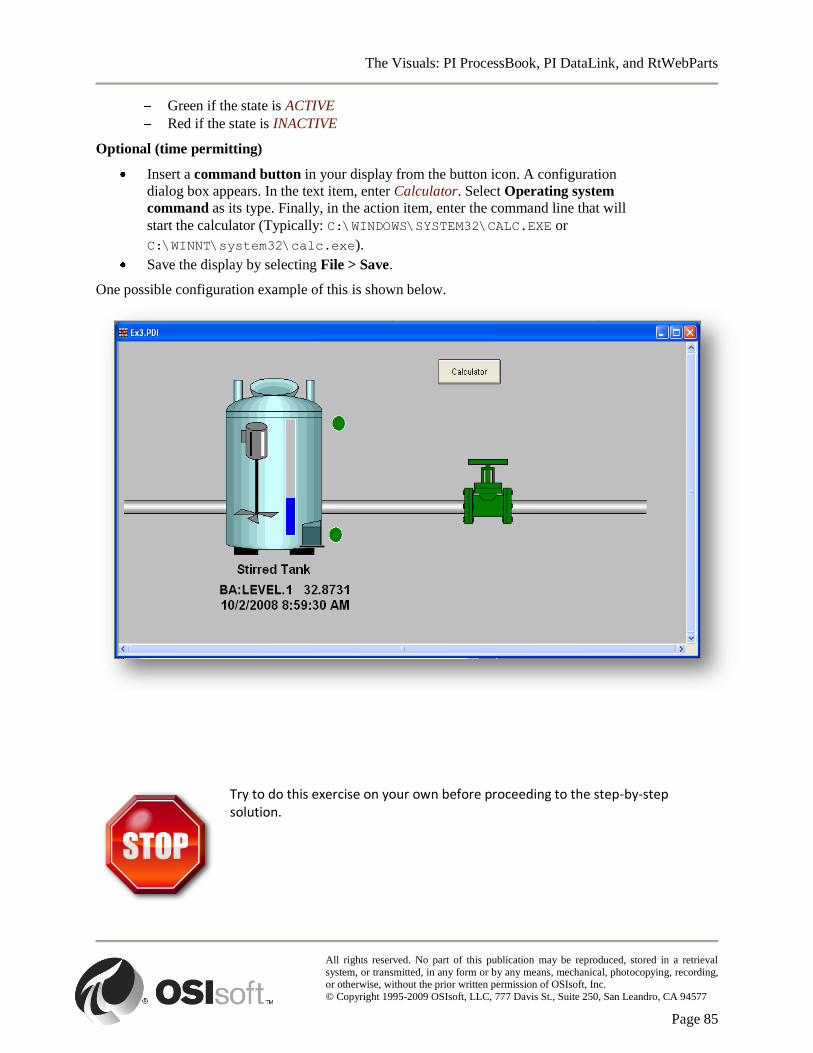
The Visuals: PI ProcessBook, PI DataLink, and RtWebParts
All rights reserved. No part of this publication may be reproduced, stored in a retrieval
system, or transmitted, in any form or by any means, mechanical, photocopying, recording, or otherwise, without the prior written permission of OSIsoft, Inc.
© Copyright 1995-2009 OSIsoft, LLC, 777 Davis St., Suite 250, San Leandro, CA 94577
Page 85
Green if the state is ACTIVE
Red if the state is INACTIVE
Optional (time permitting)
Insert a command button in your display from the button icon. A configuration
dialog box appears. In the text item, enter Calculator. Select Operating system
command as its type. Finally, in the action item, enter the command line that will
start the calculator (Typically: C:\WINDOWS\SYSTEM32\CALC.EXE or
C:\WINNT\system32\calc.exe).
Save the display by selecting File > Save.
One possible configuration example of this is shown below.
Try to do this exercise on your own before proceeding to the step-by-step solution.
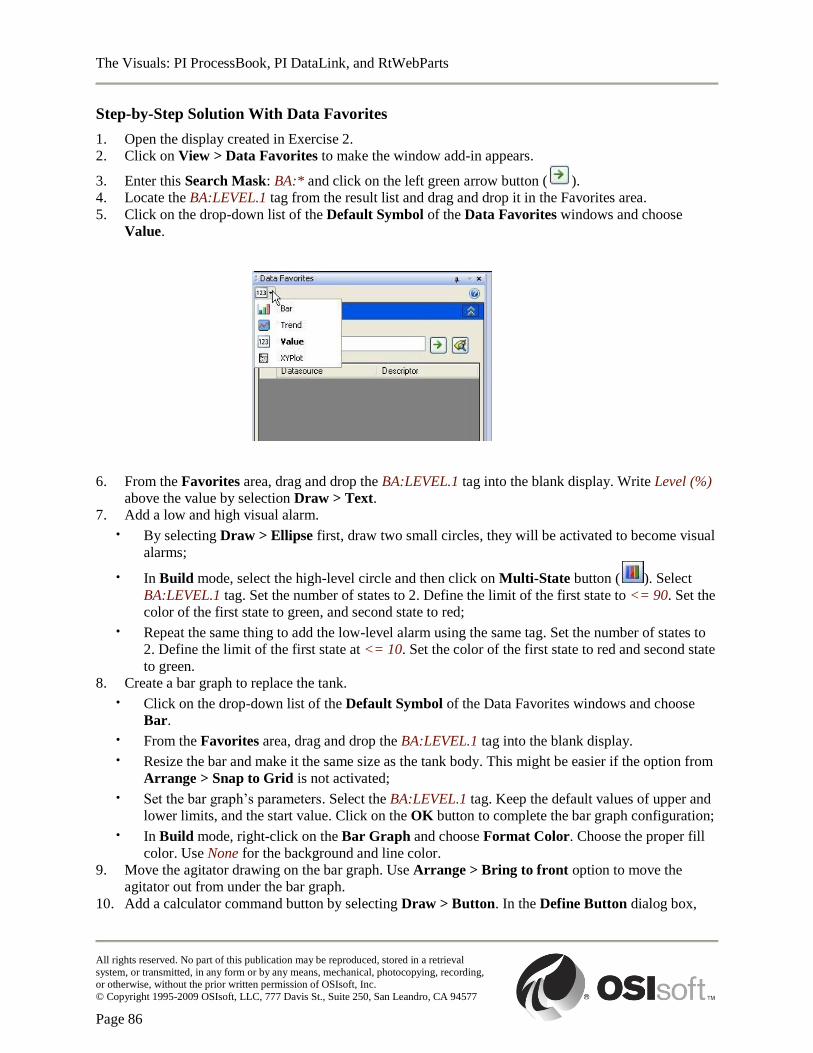
The Visuals: PI ProcessBook, PI DataLink, and RtWebParts
All rights reserved. No part of this publication may be reproduced, stored in a retrieval
system, or transmitted, in any form or by any means, mechanical, photocopying, recording, or otherwise, without the prior written permission of OSIsoft, Inc.
© Copyright 1995-2009 OSIsoft, LLC, 777 Davis St., Suite 250, San Leandro, CA 94577
Page 86
Step-by-Step Solution With Data Favorites
1. Open the display created in Exercise 2.
2. Click on View > Data Favorites to make the window add-in appears.
3. Enter this Search Mask: BA:* and click on the left green arrow button ( ).
4. Locate the BA:LEVEL.1 tag from the result list and drag and drop it in the Favorites area.
5. Click on the drop-down list of the Default Symbol of the Data Favorites windows and choose
Value.
6. From the Favorites area, drag and drop the BA:LEVEL.1 tag into the blank display. Write Level (%)
above the value by selection Draw > Text.
7. Add a low and high visual alarm.
· By selecting Draw > Ellipse first, draw two small circles, they will be activated to become visual
alarms;
· In Build mode, select the high-level circle and then click on Multi-State button ( ). Select
BA:LEVEL.1 tag. Set the number of states to 2. Define the limit of the first state to <= 90. Set the
color of the first state to green, and second state to red;
· Repeat the same thing to add the low-level alarm using the same tag. Set the number of states to
2. Define the limit of the first state at <= 10. Set the color of the first state to red and second state
to green.
8. Create a bar graph to replace the tank.
· Click on the drop-down list of the Default Symbol of the Data Favorites windows and choose
Bar.
· From the Favorites area, drag and drop the BA:LEVEL.1 tag into the blank display.
· Resize the bar and make it the same size as the tank body. This might be easier if the option from
Arrange > Snap to Grid is not activated;
· Set the bar graph‟s parameters. Select the BA:LEVEL.1 tag. Keep the default values of upper and
lower limits, and the start value. Click on the OK button to complete the bar graph configuration;
· In Build mode, right-click on the Bar Graph and choose Format Color. Choose the proper fill
color. Use None for the background and line color.
9. Move the agitator drawing on the bar graph. Use Arrange > Bring to front option to move the
agitator out from under the bar graph.
10. Add a calculator command button by selecting Draw > Button. In the Define Button dialog box,

The Visuals: PI ProcessBook, PI DataLink, and RtWebParts
All rights reserved. No part of this publication may be reproduced, stored in a retrieval
system, or transmitted, in any form or by any means, mechanical, photocopying, recording, or otherwise, without the prior written permission of OSIsoft, Inc.
© Copyright 1995-2009 OSIsoft, LLC, 777 Davis St., Suite 250, San Leandro, CA 94577
Page 87
put in a name for the button: Calculator. In the action item, enter the command line that will start the
calculator. You will find the calculator (calc.exe) in the C:\WINDOWS\SYSTEM32 or
C:\WINNT\SYSTEM32 according to the operating system used.
11. Save your display with the Save as option under the name: Exercise PB4.
The Visuals: PI ProcessBook, PI DataLink, and RtWebParts
All rights reserved. No part of this publication may be reproduced, stored in a retrieval
system, or transmitted, in any form or by any means, mechanical, photocopying, recording, or otherwise, without the prior written permission of OSIsoft, Inc.
© Copyright 1995-2009 OSIsoft, LLC, 777 Davis St., Suite 250, San Leandro, CA 94577
Page 88
Step-by-Step Solution without the use of Data Favorites
1. Open the display created in Exercise 2.
2. Insert a level indicator. Select Draw > Value to insert the BA:LEVEL.1 tag value. Write Level (%)
above the value by selection Draw > Text.
3. Add a low and high visual alarm.
· By selecting Draw > Ellipse first, draw two small circles, they will be activated to become visual
alarms;
· In Build mode, select the high-level circle and then click on Multi-State button ( ). Select
BA:LEVEL.1 tag. Set the number of states to 2. Define the limit of the first state to <= 90. Set the
color of the first state to green, and second state to red;
· Repeat the same thing to add the low-level alarm using the same tag. Set the number of states to
2. Define the limit of the first state at <= 10. Set the color of the first state to red and second state
to green.
4. Create a bar graph to replace the tank.
· Use Draw > Bar to create a bar graph. Draw a rectangle over the tank body and make it the same
size as the tank body. This might be easier if the option from Arrange > Snap to Grid is not
activated;
· Set the bar graph‟s parameters. Select the BA:LEVEL.1 tag. Keep the default values of upper and
lower limits, and the start value. Click on the OK button to complete the bar graph configuration;
· In Build mode, right-click on the Bar Graph and choose Format Color. Choose the proper fill
color. Use None for the background and line color.
5. Move the agitator drawing on the bar graph. Use Arrange > Bring to front option to move the
agitator out from under the bar graph.
6. Add a calculator command button by selecting Draw > Button. In the Define Button dialog box,
put in a name for the button: Calculator. In the action item, enter the command line that will start the
calculator. You will find the calculator (calc.exe) in the C:\WINDOWS\SYSTEM32 or
C:\WINNT\SYSTEM32 according to the operating system used.
7. Save your display with the Save as option under the name: Exercise PB4.
6.2 Organizing Displays
A ProcessBook Workbook is a collection of individual displays of data and analysis. It
organizes data from the PI Server and other sources in the same workspace. A ProcessBook
Workbook can organize OS Commands, Hyperlinks to files or URLs, or a linked display. A
Workbook and its displays are stored in a single file (.piw). They are useful because you can
allow easier sharing of displays across the enterprise and manage displays by tasks or by
roles. There are fewer files to manage and they incorporate other needed content.
Use any of these procedures to open a ProcessBook Entry from either Book view or Outline
view of a ProcessBook:
Click on the Entry title, then on the New button to activate the selected entry into a new
window or click on the entry title, then on the Open button to open the entry into the last
window you used. If none are open, a new window will open.
The Visuals: PI ProcessBook, PI DataLink, and RtWebParts
All rights reserved. No part of this publication may be reproduced, stored in a retrieval
system, or transmitted, in any form or by any means, mechanical, photocopying, recording, or otherwise, without the prior written permission of OSIsoft, Inc.
© Copyright 1995-2009 OSIsoft, LLC, 777 Davis St., Suite 250, San Leandro, CA 94577
Page 89
With the Run mode pointer, double-click on the entry. The entry will open and will appear
within an existing window, if possible. Click and drag the entry title to an unused area in the
application work area and release the mouse. This opens a new window in addition to the
already opened windows. If you drag the item on top of an open item, it will close that item
while opening the one that you dragged.
To use the keyboard instead of the mouse, use CTRL+F6, to select the ProcessBook. Then
use the up or down arrow keys to select the entry title. Press Enter. If you have more than
one window open, it will replace the open windows with the new display. Pressing ALT+N is
the same as clicking the New button.
If the entry is a Display, Linked Display, or Linked ProcessBook, the entry is opened and
the contents are displayed on your work area. If the entry is an Operating System
Command, the command is executed or the application is started.
Notes: If you click on an Operating System Command more than once, it may or may not open an
additional copy of the application, depending on the application. Displays re-open in the same position,
size, and shape as they were saved.
6.2.1 Viewing ProcessBook Workbooks
PI ProcessBook has 2 view modes, Book View and Outline View. Book view resembles a
binder with tabs and pages. Each page contains displays. Clicking on the tab along the right
side of the ProcessBook displays the first page of that group of displays. Select this view
from View > Book.
Outline view lists all the items in a hierarchy on a single page that can be scrolled up and
down. The hierarchy has 10 levels. In Book view, level 1 creates a new tab and levels 3 to 10
are displayed on level 3.
Select View > Outline to display a ProcessBook as an outline. When you are in Outline
view, an additional toolbar is added to the active ProcessBook window. You may need to
resize the window so that all the buttons are visible. Use the horizontal and vertical scroll bars
to see all the displays in the outline.
Sections of the outline can be collapsed or expanded to help you view the list of displays in a
meaningful manner. Any display with a plus sign to its left can be collapsed or expanded by
clicking on the plus sign, allowing you to hide or show additional displays that are
subordinate to the selected display.
Alternatively, highlight a section and use the plus and minus buttons on the Outline toolbar
to collapse or expand it. Use the arrows to move an entry left, right, up, or down. When
collapsed, subordinate displays are not visible and the plus sign to the left of the display
changes from hollow to solid.
Use the numbered buttons on the Outline toolbar to collapse the outline to a specific level.
For example, click on 3 to collapse the outline so that only levels 1, 2, and 3 are visible.
These buttons affect the entire outline, rather than a selected heading or level. Click All to
view all 10 levels.

The Visuals: PI ProcessBook, PI DataLink, and RtWebParts
All rights reserved. No part of this publication may be reproduced, stored in a retrieval
system, or transmitted, in any form or by any means, mechanical, photocopying, recording, or otherwise, without the prior written permission of OSIsoft, Inc.
© Copyright 1995-2009 OSIsoft, LLC, 777 Davis St., Suite 250, San Leandro, CA 94577
Page 90
6.3 Creating a New ProcessBook
In Build mode, select File > New > ProcessBook (.piw) File option button;
Type the title of the ProcessBook in the ProcessBook Name text box;
Click on the OK button. A new ProcessBook is displayed. If you entered a name in the name
text box, the name is shown in the title bar of the ProcessBook, otherwise it shows Untitled.
Notes: An asterisk (*) beside the name of the file in the title bar means that the document has not been
saved or has been modified since the last save.
The next step in creating a ProcessBook is to add individual entries. By arranging and
combining displays and other entry types, you can create a complete working environment
for plant personnel. You can add the entry titles to the ProcessBook and then complete the
detailed design of the entries later.
There are five specific types of entries:
Text entries: provide headings or to provide static information. Useful for
organizing PI ProcessBook documents by adding titles;
Display entries: page that can contain different objects (trends, process mimics,
etc.);
Linked Display entries: link with a display, internal or external, to the current PI
ProcessBook. A Linked Display allows you to link a display title in a ProcessBook
to an entry elsewhere in the ProcessBook or in another ProcessBook. This means
that you create and store only one copy of the entry;
Linked ProcessBook entries: link to another PI ProcessBook document;
Operating System Command entries: open another application. The icon will
usually represent the application. If that icon is not available, the default icon is the
running man.
6.3.1 How to Create a Text Entry
Text entries are common for titles and section headings. If used as the first level, they appear
as tabs in Book view. They are also useful for storing any static information you want
associated with that Workbook. To create a new Text Entry, follow the steps below.
Inside a ProcessBook, select File > New. The New dialog is displayed. The default creates a
new ProcessBook entry. The name of the ProcessBook is shown at the bottom of the dialog.
Click on the OK button. The Define ProcessBook Entry dialog is displayed. In the Label
field, type the entire text of the entry. There is no limit to the number of characters you may
use, but for headings, you should try to be as brief and descriptive as possible. Select Text
from the Type radio buttons. Enter the Level at which you want to position the entry in the
ProcessBook hierarchy of entries. Type a number between 1 and 10 or click the up and down
arrows. If it is the first entry in the ProcessBook, the level is automatically set to 1 and cannot
be changed. Click on the OK button. The entry is added to the ProcessBook. Finally, click on
The Visuals: PI ProcessBook, PI DataLink, and RtWebParts
All rights reserved. No part of this publication may be reproduced, stored in a retrieval
system, or transmitted, in any form or by any means, mechanical, photocopying, recording, or otherwise, without the prior written permission of OSIsoft, Inc.
© Copyright 1995-2009 OSIsoft, LLC, 777 Davis St., Suite 250, San Leandro, CA 94577
Page 91
the Save button. If you are creating several entries in one session, you may wait to save until
the last one is entered.
6.3.2 How to Create a Display Entry
A Display is the main element of a ProcessBook Workbook. It behaves just like the
standalone Displays previously mentioned in which you can combine static and dynamic
elements that relate to one or many data sources. To create a Display Entry, follow these
steps. Inside a ProcessBook, select File > New. The New dialog is displayed. The default
creates a new ProcessBook Entry. The name of the ProcessBook is shown at the bottom of
the dialog. Click on the OK button. The Define ProcessBook Entry dialog is displayed.
Type the entry title in the Label text box. The entry in the Type selection is Display. Enter
the Level at which you want to position the entry in the ProcessBook hierarchy of entries.
Click on the OK button. The entry is added to the ProcessBook and a blank display is
opened. If the entry is at level 1 and you are in Book view, a tab is created. Click on the Save
button. If you are creating several entries, you may wait to save until the last one is entered.
6.3.3 How to Link an Existing ProcessBook Element
It is not uncommon to have independent Displays or even Workbooks that have information
applicable to many different areas. To take advantage of this fact, you can link ProcessBook
Elements together, giving you an easy way to navigate between all of your data. It
accomplishes this by referencing to objects that already exist. To add a Link, follow these
instructions. Select File > New or Display > Insert when in build mode. Enter the name of
the ProcessBook (Label). Select the type (Linked / OS Command). Select the hierarchical
level (Level). Under Browse, select ProcessBook file and browse to the location of the file.
Click on the OK button. Click on the Save button. If you are creating several entries, you
may wait to save until the last one is entered.
6.3.4 How to Launch External Files, Applications, and Websites
It is also possible to create links to other files and applications outside of ProcessBook.
Examples may include applications like Notepad or the Calculator, or files such as DataLink
reports in Excel. You can even enter website URLs to link to desired websites. Select File >
New or Display > Insert when in build mode. Enter the name of the ProcessBook (Label).
Select the type (Linked / OS Command). Select the hierarchical level (Level). Under
Browse, select All files or Applications, as appropriate, and browse to the location of the file
or application. For websites, just enter the URL. Click on the OK button. Click on the Save
button. If you are creating several entries, you may wait to save until the last one is entered.

The Visuals: PI ProcessBook, PI DataLink, and RtWebParts
All rights reserved. No part of this publication may be reproduced, stored in a retrieval
system, or transmitted, in any form or by any means, mechanical, photocopying, recording, or otherwise, without the prior written permission of OSIsoft, Inc.
© Copyright 1995-2009 OSIsoft, LLC, 777 Davis St., Suite 250, San Leandro, CA 94577
Page 92
6.3.5 Group Recap Questions
The following questions are intended to reinforce key information presented in this
chapter or section. The answers can be found at the end of this document.
Questions
1. When creating a new ProcessBook entry in a workbook, what option needs to be set to display that
entry as a separate tab?
2. Name the five dynamic elements that can be created in a ProcessBook display.
Answer
1. The level of the entry need to be set to 1.
2. The Trend, XY plot, Bar Graph, value and any Multi-state Symbol are all dynamic elements.
6.3.6 Exercise – Organize Your Displays
The following exercise is intended to reinforce key information presented in this
chapter or section. The answers can be found at the end of the exercise.
Objectives
Learn how to build and modify a PI ProcessBook;
Understand the PI ProcessBook entries hierarchy;
Use the Book and Outline views to visualize and modify a PI ProcessBook.
Problem Description
You need to organize existing displays from your organization to give one access point for
users. You want to publish only the path to this ProcessBook file (workbook) to facilitate the
deployment and security management from the enterprise‟s IT/IS group.
Approach
Create a ProcessBook file called Exercise PB5.PIW and follow these instructions:
Insert a text separator that will appear as a tab in book view and name it Exercises
Book
Create a display named Plant Status that will be put at level 2
Create a linked display to Exercise PB4.PDI that will be put at level 3 and name
it Batch Reactor.

The Visuals: PI ProcessBook, PI DataLink, and RtWebParts
All rights reserved. No part of this publication may be reproduced, stored in a retrieval
system, or transmitted, in any form or by any means, mechanical, photocopying, recording, or otherwise, without the prior written permission of OSIsoft, Inc.
© Copyright 1995-2009 OSIsoft, LLC, 777 Davis St., Suite 250, San Leandro, CA 94577
Page 93
Create a linked ProcessBook to PIDEMO.PIW file that will be put at level 2 and
name it External Plant. The file PIDEMO.PIW is located under the
PIPC\Procbook\en folder.
Create a link to call the calculator from PI ProcessBook. Browse to select the
calc.exe file from the c:\windows\system32 directory for Windows XP/ME/2003.
This entry will be at level 2.
Modify the hierarchy to follow these instructions.
Leave the text separator as the first item at level 1
Second item is External Plant at level 3
Third item is Plant Status at level 3
Fourth item is Batch Reactor at level 2
Fifth item is Calculator at level 3
Try to do this exercise on your own before proceeding to the step-by-step solution.
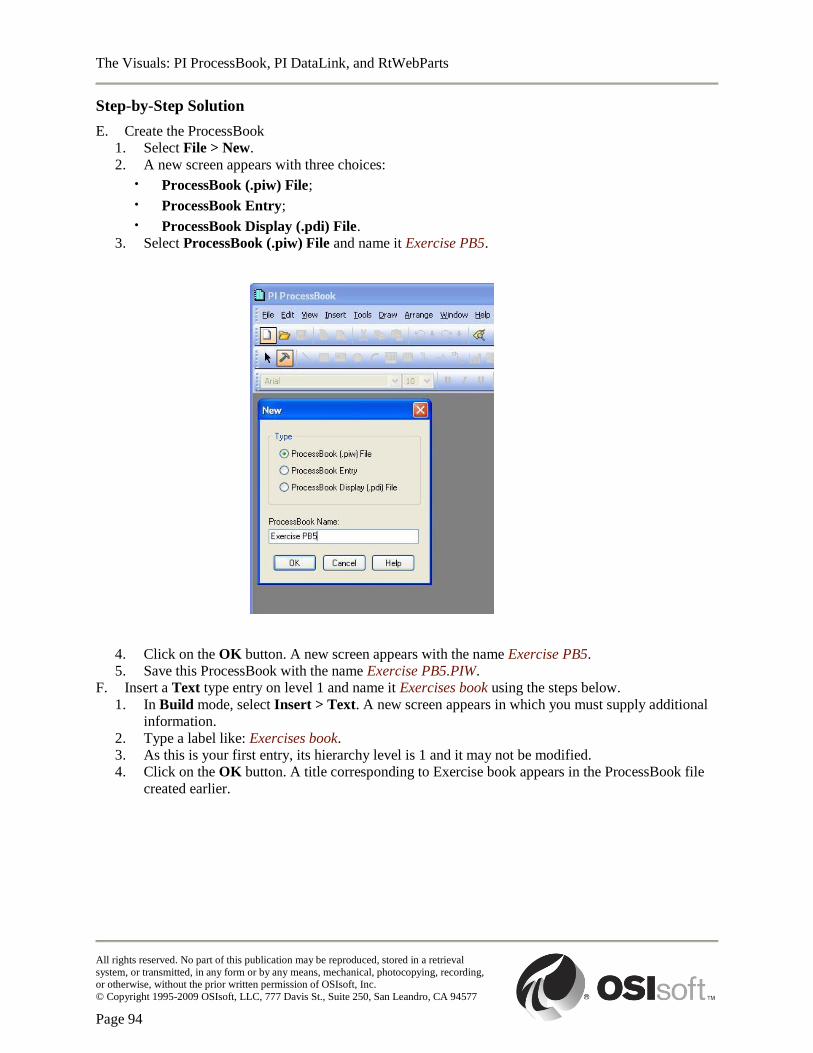
The Visuals: PI ProcessBook, PI DataLink, and RtWebParts
All rights reserved. No part of this publication may be reproduced, stored in a retrieval
system, or transmitted, in any form or by any means, mechanical, photocopying, recording, or otherwise, without the prior written permission of OSIsoft, Inc.
© Copyright 1995-2009 OSIsoft, LLC, 777 Davis St., Suite 250, San Leandro, CA 94577
Page 94
Step-by-Step Solution
E. Create the ProcessBook
1. Select File > New.
2. A new screen appears with three choices:
· ProcessBook (.piw) File;
· ProcessBook Entry;
· ProcessBook Display (.pdi) File.
3. Select ProcessBook (.piw) File and name it Exercise PB5.
4. Click on the OK button. A new screen appears with the name Exercise PB5.
5. Save this ProcessBook with the name Exercise PB5.PIW.
F. Insert a Text type entry on level 1 and name it Exercises book using the steps below.
1. In Build mode, select Insert > Text. A new screen appears in which you must supply additional
information.
2. Type a label like: Exercises book.
3. As this is your first entry, its hierarchy level is 1 and it may not be modified.
4. Click on the OK button. A title corresponding to Exercise book appears in the ProcessBook file
created earlier.
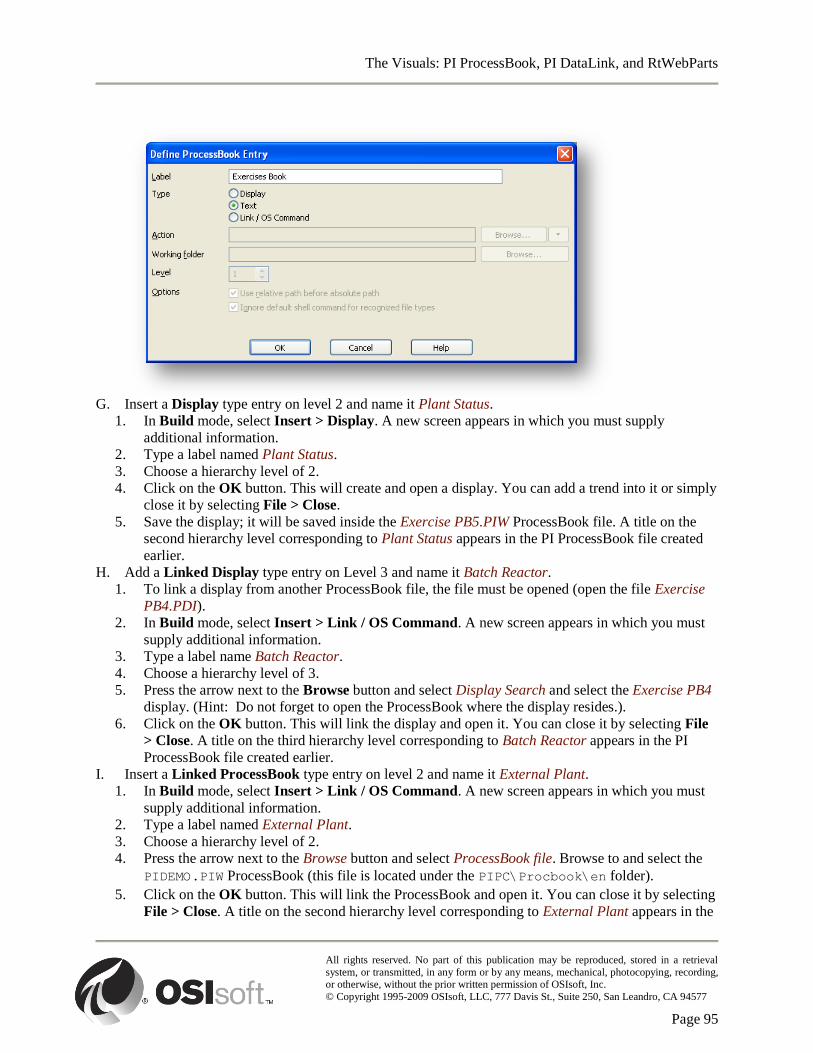
The Visuals: PI ProcessBook, PI DataLink, and RtWebParts
All rights reserved. No part of this publication may be reproduced, stored in a retrieval
system, or transmitted, in any form or by any means, mechanical, photocopying, recording, or otherwise, without the prior written permission of OSIsoft, Inc.
© Copyright 1995-2009 OSIsoft, LLC, 777 Davis St., Suite 250, San Leandro, CA 94577
Page 95
G. Insert a Display type entry on level 2 and name it Plant Status.
1. In Build mode, select Insert > Display. A new screen appears in which you must supply
additional information.
2. Type a label named Plant Status.
3. Choose a hierarchy level of 2.
4. Click on the OK button. This will create and open a display. You can add a trend into it or simply
close it by selecting File > Close.
5. Save the display; it will be saved inside the Exercise PB5.PIW ProcessBook file. A title on the
second hierarchy level corresponding to Plant Status appears in the PI ProcessBook file created
earlier.
H. Add a Linked Display type entry on Level 3 and name it Batch Reactor.
1. To link a display from another ProcessBook file, the file must be opened (open the file Exercise
PB4.PDI).
2. In Build mode, select Insert > Link / OS Command. A new screen appears in which you must
supply additional information.
3. Type a label name Batch Reactor.
4. Choose a hierarchy level of 3.
5. Press the arrow next to the Browse button and select Display Search and select the Exercise PB4
display. (Hint: Do not forget to open the ProcessBook where the display resides.).
6. Click on the OK button. This will link the display and open it. You can close it by selecting File
> Close. A title on the third hierarchy level corresponding to Batch Reactor appears in the PI
ProcessBook file created earlier.
I. Insert a Linked ProcessBook type entry on level 2 and name it External Plant.
1. In Build mode, select Insert > Link / OS Command. A new screen appears in which you must
supply additional information.
2. Type a label named External Plant.
3. Choose a hierarchy level of 2.
4. Press the arrow next to the Browse button and select ProcessBook file. Browse to and select the
PIDEMO.PIW ProcessBook (this file is located under the PIPC\Procbook\en folder).
5. Click on the OK button. This will link the ProcessBook and open it. You can close it by selecting
File > Close. A title on the second hierarchy level corresponding to External Plant appears in the
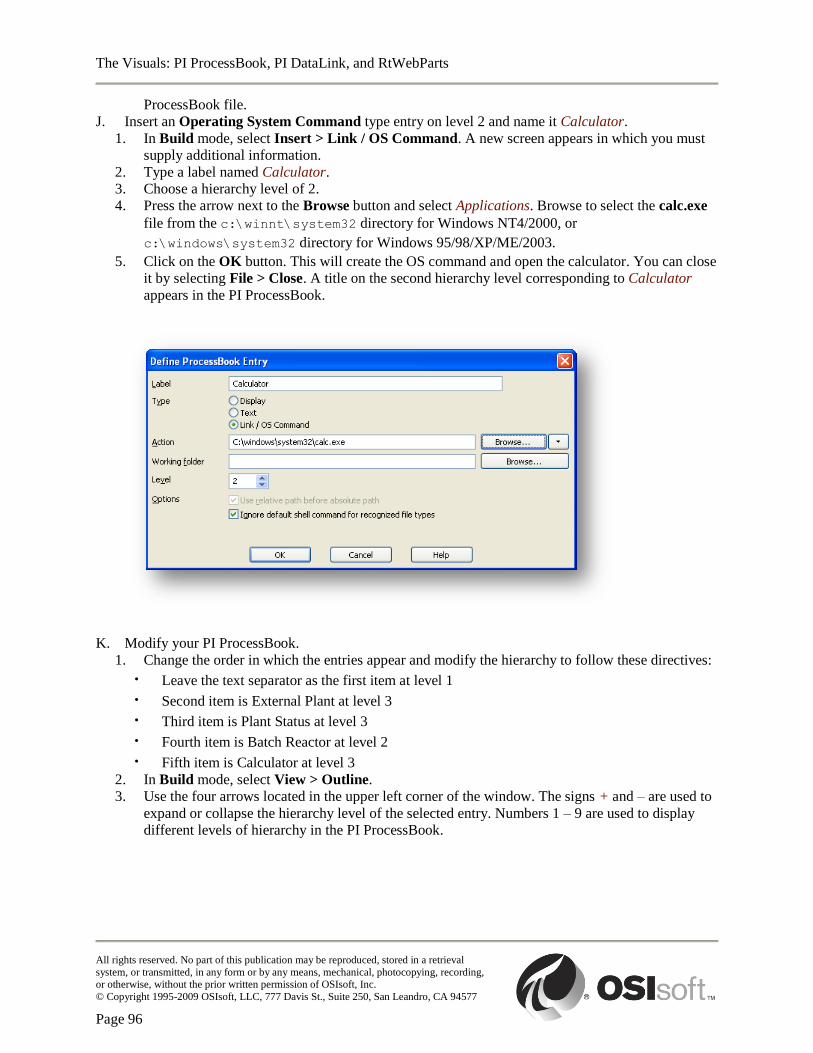
The Visuals: PI ProcessBook, PI DataLink, and RtWebParts
All rights reserved. No part of this publication may be reproduced, stored in a retrieval
system, or transmitted, in any form or by any means, mechanical, photocopying, recording, or otherwise, without the prior written permission of OSIsoft, Inc.
© Copyright 1995-2009 OSIsoft, LLC, 777 Davis St., Suite 250, San Leandro, CA 94577
Page 96
ProcessBook file.
J. Insert an Operating System Command type entry on level 2 and name it Calculator.
1. In Build mode, select Insert > Link / OS Command. A new screen appears in which you must
supply additional information.
2. Type a label named Calculator.
3. Choose a hierarchy level of 2.
4. Press the arrow next to the Browse button and select Applications. Browse to select the calc.exe
file from the c:\winnt\system32 directory for Windows NT4/2000, or
c:\windows\system32 directory for Windows 95/98/XP/ME/2003.
5. Click on the OK button. This will create the OS command and open the calculator. You can close
it by selecting File > Close. A title on the second hierarchy level corresponding to Calculator
appears in the PI ProcessBook.
K. Modify your PI ProcessBook.
1. Change the order in which the entries appear and modify the hierarchy to follow these directives:
· Leave the text separator as the first item at level 1
· Second item is External Plant at level 3
· Third item is Plant Status at level 3
· Fourth item is Batch Reactor at level 2
· Fifth item is Calculator at level 3
2. In Build mode, select View > Outline.
3. Use the four arrows located in the upper left corner of the window. The signs + and – are used to
expand or collapse the hierarchy level of the selected entry. Numbers 1 – 9 are used to display
different levels of hierarchy in the PI ProcessBook.

The Visuals: PI ProcessBook, PI DataLink, and RtWebParts
All rights reserved. No part of this publication may be reproduced, stored in a retrieval
system, or transmitted, in any form or by any means, mechanical, photocopying, recording, or otherwise, without the prior written permission of OSIsoft, Inc.
© Copyright 1995-2009 OSIsoft, LLC, 777 Davis St., Suite 250, San Leandro, CA 94577
Page 97
7. More PI DataLink
7.1 Inserting a Trend
You can create trends similar to ProcessBook Trends in your DataLink reports. These Trends
can be based on PI data and/or data from the worksheet. These Trends have the option to
update automatically. You can also modify scales and appearance and zoom in a part of the
trend in much the same way you can within ProcessBook. To insert a Trend, select the Trend
icon in the Tools section of the PI Ribbon.
The Trend Control is an ActiveX control that can be inserted onto any Excel spreadsheet. The
trend can display data from both the spreadsheet and a PI Server tag. To create a trend, a
trend wizard is provided to make inserting trends easier, which allows you to define the data
source(s) and how they are displayed. There are two sources of data that the Trend Control
can plot: Worksheet Data and PI Data.
To use Worksheet Data, you must specify the cell range of the data by typing it manually or
selecting it with the mouse. For ease of use with PI DataLink functions, the Include all cells
in array option is specified as the default, in which case you need choose only one cell of the
array. The Stepped option plots the data in a stepwise manner, much as the Step attribute for
a point. To use PI data, you must specify the tag name by typing it manually, searching for it
using the Search… button, or using a reference to a cell. You then click on the Add button.
The last screen of the Trend Wizard is to configure the trend title and the placement of the
trend. If a new worksheet is selected, the trend is placed on a blank worksheet at the top left
corner. If the existing worksheet option is specified, then the cell where the trend is to be
placed must be specified.
Quick changes can be made to the trend by selecting some of the items on the right-click
menu. The right-click menu allows the user to temporarily modify the scales and the time
frame, revert to the original scales and time frame, permanently modify the scales and the
time frame, add a scroll bar for the time frame, add markers, change the trend's appearance,
add or remove traces, and delete, move, or resize the trend. Using the Change Scale… item
allows you to change both trend time range and Y-axis scale. If a change in the scale is
deemed undesirable, the Revert option can be selected to undo the changes made. The
Revert option always reverts back to the settings defined in the Trend Wizard.
To scroll through time, scroll bars can be enabled with the Scroll Bar option. The scroll bar
appears at the bottom of the trend. Again, the Revert option can be used to undo changes
made by the scroll bar. To change the format of the trace or the trend itself, use the Format…
option. For instance, this option can be used to change the color or line thickness of a trace.
Also it can be used to add legends to the trend. Define Trend… and Define Trend Time
Range… bring back the Trend Wizard screens.
The Visuals: PI ProcessBook, PI DataLink, and RtWebParts
All rights reserved. No part of this publication may be reproduced, stored in a retrieval
system, or transmitted, in any form or by any means, mechanical, photocopying, recording, or otherwise, without the prior written permission of OSIsoft, Inc.
© Copyright 1995-2009 OSIsoft, LLC, 777 Davis St., Suite 250, San Leandro, CA 94577
Page 98
7.1.1 Exercise – Tank Level
The following exercise is intended to reinforce key information presented in this
chapter or section. The answer can be found at the end of the exercise.
Objectives
Learn to use the Insert Trend function with data from MS Excel worksheet and PI
data.
Problem Description
You have some production limit specifications and you want to be able to see how the previous day‟s
production measured up against those limits. The production tag you need to use is CDT158 and the
limits are as follows:
Upper Limit 225
Target Rate 150
Lower Limit 75
Approach
Use a PI Trend in MS Excel to display real-time data alongside MS Excel data. We could use MS Excel‟s
graphing capability. However, we would not be able to automatically refresh the graph. Open up
Exercise_DL3_Template.xls and use this template to construct the desired comparison trend.
Try to do this exercise on your own before proceeding to the step-by-step solution.
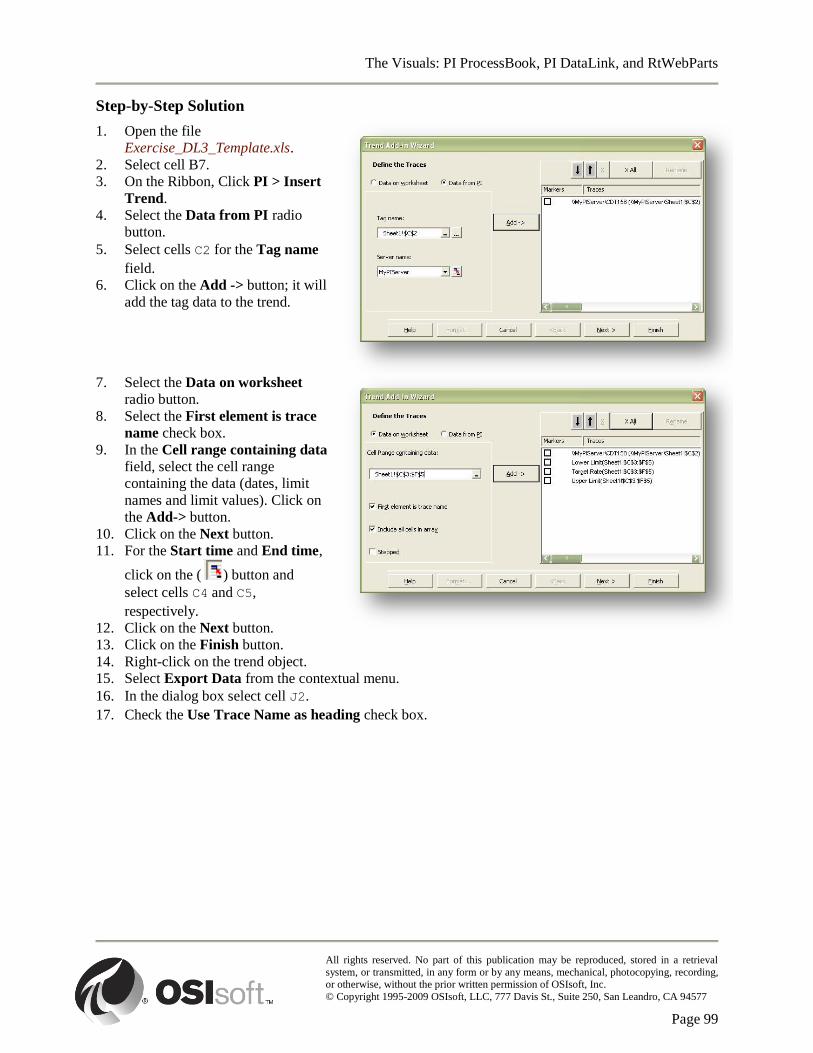
The Visuals: PI ProcessBook, PI DataLink, and RtWebParts
All rights reserved. No part of this publication may be reproduced, stored in a retrieval
system, or transmitted, in any form or by any means, mechanical, photocopying, recording, or otherwise, without the prior written permission of OSIsoft, Inc.
© Copyright 1995-2009 OSIsoft, LLC, 777 Davis St., Suite 250, San Leandro, CA 94577
Page 99
Step-by-Step Solution
1. Open the file
Exercise_DL3_Template.xls.
2. Select cell B7.
3. On the Ribbon, Click PI > Insert
Trend.
4. Select the Data from PI radio
button.
5. Select cells C2 for the Tag name
field.
6. Click on the Add -> button; it will
add the tag data to the trend.
7. Select the Data on worksheet
radio button.
8. Select the First element is trace
name check box.
9. In the Cell range containing data
field, select the cell range
containing the data (dates, limit
names and limit values). Click on
the Add-> button.
10. Click on the Next button.
11. For the Start time and End time,
click on the ( ) button and
select cells C4 and C5,
respectively.
12. Click on the Next button.
13. Click on the Finish button.
14. Right-click on the trend object.
15. Select Export Data from the contextual menu.
16. In the dialog box select cell J2.
17. Check the Use Trace Name as heading check box.
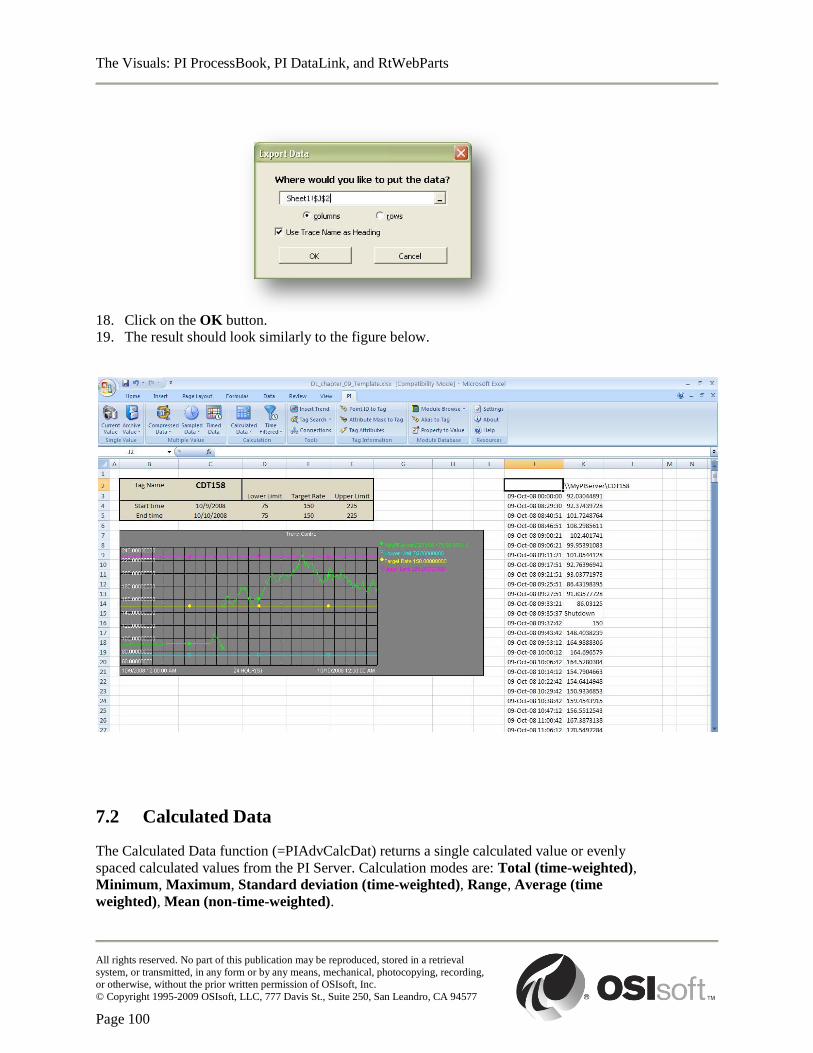
The Visuals: PI ProcessBook, PI DataLink, and RtWebParts
All rights reserved. No part of this publication may be reproduced, stored in a retrieval
system, or transmitted, in any form or by any means, mechanical, photocopying, recording, or otherwise, without the prior written permission of OSIsoft, Inc.
© Copyright 1995-2009 OSIsoft, LLC, 777 Davis St., Suite 250, San Leandro, CA 94577
Page 100
18. Click on the OK button.
19. The result should look similarly to the figure below.
7.2 Calculated Data
The Calculated Data function (=PIAdvCalcDat) returns a single calculated value or evenly
spaced calculated values from the PI Server. Calculation modes are: Total (time-weighted),
Minimum, Maximum, Standard deviation (time-weighted), Range, Average (time
weighted), Mean (non-time-weighted).
The Visuals: PI ProcessBook, PI DataLink, and RtWebParts
All rights reserved. No part of this publication may be reproduced, stored in a retrieval
system, or transmitted, in any form or by any means, mechanical, photocopying, recording, or otherwise, without the prior written permission of OSIsoft, Inc.
© Copyright 1995-2009 OSIsoft, LLC, 777 Davis St., Suite 250, San Leandro, CA 94577
Page 101
To retrieve a single calculated value, do not specify an interval and the PIAdvCalcVal()
function is used. To retrieve evenly spaced calculated data, the specified interval, in relative
PI Time format, determines the spacing of the calculation and the PIAdvCalcDat() function is
used.
You must supply the PI Server name or cell reference, Tag name or cell reference(s) to a list
of tags, and the start and end times for the calculation. The Time Interval is optional and
refers to how often the calculation will be performed. When a Time Interval is specified, the
show start time and show end time options become available. If no Time Interval is
specified, the calculation will only be performed once over the specified time range. The
conversion factor is typically only applicable to the Total calculation mode and will be
discussed in further detail below.
Check show pctgood if you want DataLink to display the percentage of the time range that
contains good value. We recommend that you always look at the percent good value before
using the calculation result. The percent good value is normally returned to the right of
calculated value cell. Timestamp(s) are returned when the calculation mode is Minimum,
Maximum, or Range.
7.2.1 Exercise – Daily Production
The following exercise is intended to reinforce key information presented in this
chapter or section. The answer can be found at the end of the exercise.
Objectives
Learn to extract calculated values using Calculated Data function.
Problem Description
You are the production manager and want to create a report showing last week‟s daily production totals.
In this report, you want to display the total production, average, minimum and maximum and standard
deviation for that week. Also, you would like to present this data on a daily basis.
Approach
We will use the built-in PI Calculated Data functions to show the above statistics for the entire week
(using no time interval) and each day of the week (using a time interval of 24h). Use the file
Try to do this exercise on your own before proceeding to the step-by-step solution.

The Visuals: PI ProcessBook, PI DataLink, and RtWebParts
All rights reserved. No part of this publication may be reproduced, stored in a retrieval
system, or transmitted, in any form or by any means, mechanical, photocopying, recording, or otherwise, without the prior written permission of OSIsoft, Inc.
© Copyright 1995-2009 OSIsoft, LLC, 777 Davis St., Suite 250, San Leandro, CA 94577
Page 102
Exercise_DL4_Template.xls to organize and display this data.
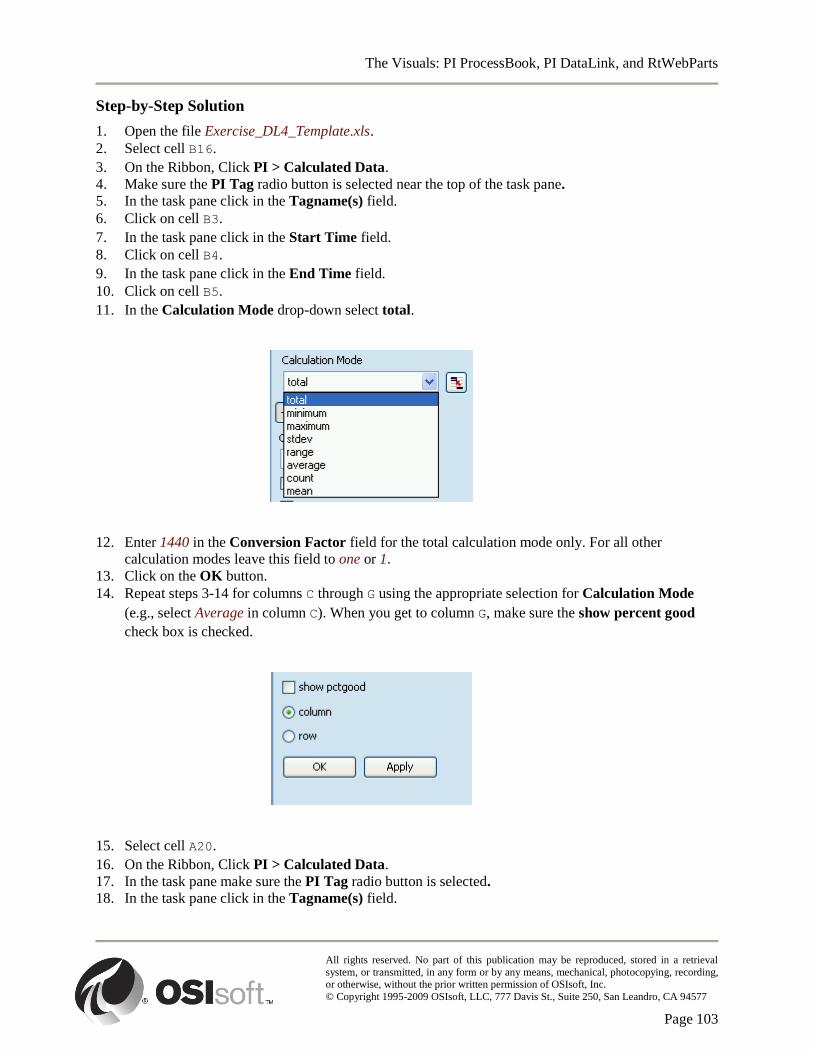
The Visuals: PI ProcessBook, PI DataLink, and RtWebParts
All rights reserved. No part of this publication may be reproduced, stored in a retrieval
system, or transmitted, in any form or by any means, mechanical, photocopying, recording, or otherwise, without the prior written permission of OSIsoft, Inc.
© Copyright 1995-2009 OSIsoft, LLC, 777 Davis St., Suite 250, San Leandro, CA 94577
Page 103
Step-by-Step Solution
1. Open the file Exercise_DL4_Template.xls.
2. Select cell B16.
3. On the Ribbon, Click PI > Calculated Data.
4. Make sure the PI Tag radio button is selected near the top of the task pane.
5. In the task pane click in the Tagname(s) field.
6. Click on cell B3.
7. In the task pane click in the Start Time field.
8. Click on cell B4.
9. In the task pane click in the End Time field.
10. Click on cell B5.
11. In the Calculation Mode drop-down select total.
12. Enter 1440 in the Conversion Factor field for the total calculation mode only. For all other
calculation modes leave this field to one or 1.
13. Click on the OK button.
14. Repeat steps 3-14 for columns C through G using the appropriate selection for Calculation Mode
(e.g., select Average in column C). When you get to column G, make sure the show percent good
check box is checked.
15. Select cell A20.
16. On the Ribbon, Click PI > Calculated Data.
17. In the task pane make sure the PI Tag radio button is selected.
18. In the task pane click in the Tagname(s) field.
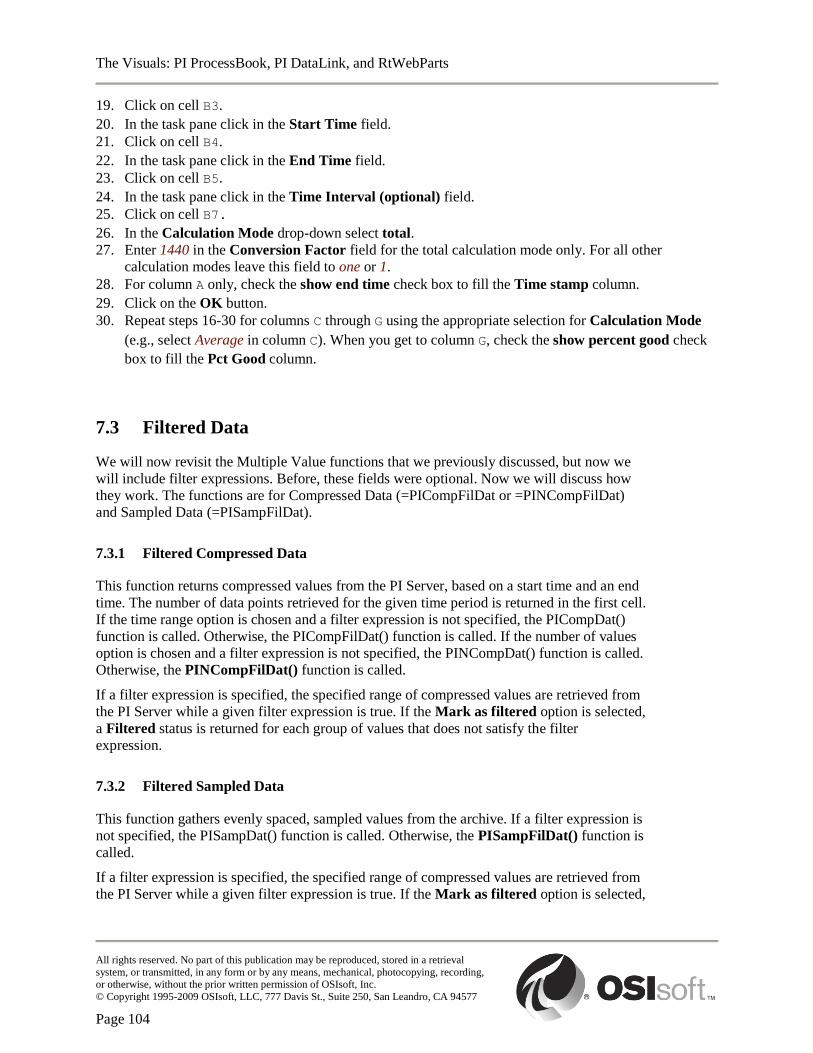
The Visuals: PI ProcessBook, PI DataLink, and RtWebParts
All rights reserved. No part of this publication may be reproduced, stored in a retrieval
system, or transmitted, in any form or by any means, mechanical, photocopying, recording, or otherwise, without the prior written permission of OSIsoft, Inc.
© Copyright 1995-2009 OSIsoft, LLC, 777 Davis St., Suite 250, San Leandro, CA 94577
Page 104
19. Click on cell B3.
20. In the task pane click in the Start Time field.
21. Click on cell B4.
22. In the task pane click in the End Time field.
23. Click on cell B5.
24. In the task pane click in the Time Interval (optional) field.
25. Click on cell B7.
26. In the Calculation Mode drop-down select total.
27. Enter 1440 in the Conversion Factor field for the total calculation mode only. For all other
calculation modes leave this field to one or 1.
28. For column A only, check the show end time check box to fill the Time stamp column.
29. Click on the OK button.
30. Repeat steps 16-30 for columns C through G using the appropriate selection for Calculation Mode
(e.g., select Average in column C). When you get to column G, check the show percent good check
box to fill the Pct Good column.
7.3 Filtered Data
We will now revisit the Multiple Value functions that we previously discussed, but now we
will include filter expressions. Before, these fields were optional. Now we will discuss how
they work. The functions are for Compressed Data (=PICompFilDat or =PINCompFilDat)
and Sampled Data (=PISampFilDat).
7.3.1 Filtered Compressed Data
This function returns compressed values from the PI Server, based on a start time and an end
time. The number of data points retrieved for the given time period is returned in the first cell.
If the time range option is chosen and a filter expression is not specified, the PICompDat()
function is called. Otherwise, the PICompFilDat() function is called. If the number of values
option is chosen and a filter expression is not specified, the PINCompDat() function is called.
Otherwise, the PINCompFilDat() function is called.
If a filter expression is specified, the specified range of compressed values are retrieved from
the PI Server while a given filter expression is true. If the Mark as filtered option is selected,
a Filtered status is returned for each group of values that does not satisfy the filter
expression.
7.3.2 Filtered Sampled Data
This function gathers evenly spaced, sampled values from the archive. If a filter expression is
not specified, the PISampDat() function is called. Otherwise, the PISampFilDat() function is
called.
If a filter expression is specified, the specified range of compressed values are retrieved from
the PI Server while a given filter expression is true. If the Mark as filtered option is selected,
The Visuals: PI ProcessBook, PI DataLink, and RtWebParts
All rights reserved. No part of this publication may be reproduced, stored in a retrieval
system, or transmitted, in any form or by any means, mechanical, photocopying, recording, or otherwise, without the prior written permission of OSIsoft, Inc.
© Copyright 1995-2009 OSIsoft, LLC, 777 Davis St., Suite 250, San Leandro, CA 94577
Page 105
a Filtered status is returned for each group of values that does not satisfy the filter
expression.
Note: When using a cell reference for your Filter Expression, be sure that if the Filter Expression begins
with a timestamp or tag name that you use two single quotes. The first single quote is used in Excel to
identify a text string, rather than a value, and will not be seen by the filter expression.
7.4 Excel Conditional Formatting
This topic is not specific to PI DataLink, but the Conditional Formatting found in Excel
2007 can give your DataLink reports a great look and a comprehensive perspective. It is
useful to compare values extracted from PI. Conditional Formatting is found in the Home
Ribbon in the Styles section.
7.4.1 Exercise – Production Level Report
The following exercise is intended to reinforce key information presented in this
chapter or section. The answer can be found at the end of the exercise.
Objectives
Learn to use the Filter Expression option of the Sampled Data function to
constrain the values that are extracted.
Combine PI values with Excel conditional formatting for more intuitive reports.
Problem Description
As a quality control manager, you want to examine the tank level of product over the last 12 hours for a
tag that does not report many values due to its lack of volatility, and thus it has a high compression rate
on the PI Sever. Since there are only a few values passing through the compression test, it is better to
perform a Sampled Data query rather than a Compressed Data query.
The tag you will use is SINUSOID. You want to build a report that will filter out mean tank levels, which
is defined as a level between 30 and 80. You want to use red conditional formatting to know when the
tank is in danger of overflowing, defined as the highest 10% of values. You are also interested in the
times of low product level, defined as the lowest 20% of values, which should be highlighted in green.
For all values returned, data bars should be used to visually show the overall level of the product in the
tank. Then change the upper and lower limits to 75 and 25, respectively, to test your report.
Approach
Use PI Datalink‟s Sampled Data function to get evenly spaced data. Since we only want to see data that
are outside of the norm, we will apply filters to show high values, low values, and a list including both.
Use the file Exercise_DL5_Template.xlsx as a template to design this report.

The Visuals: PI ProcessBook, PI DataLink, and RtWebParts
All rights reserved. No part of this publication may be reproduced, stored in a retrieval
system, or transmitted, in any form or by any means, mechanical, photocopying, recording, or otherwise, without the prior written permission of OSIsoft, Inc.
© Copyright 1995-2009 OSIsoft, LLC, 777 Davis St., Suite 250, San Leandro, CA 94577
Page 106
Note: The MS Excel Today() function returns the serial number of the current date. The serial number is
the date-time code used by Microsoft Excel for date and time calculations. Microsoft Excel stores dates as
whole number of days starting at 1900. Dates and times are values and therefore can be added, subtracted,
and included in other calculations.
Syntax: =TODAY()
Example: =(Today() –10 + 16/24) is today minus 10 days at 4 PM
When you enter a date in Microsoft Excel 97 and you enter only two digits for the year, Microsoft Excel
enters the year as follows: The years 2000 through 2029 if you type 00 through 29 for the year. For
example, if you type 5/28/19, Microsoft Excel assumes the date is May 28, 2019.The years 1930 through
1999 if you type 30 through 99 for the year. For example, if you type 5/28/91, Microsoft Excel assumes
the date is May 28, 1991.
Try to do this exercise on your own before proceeding to the step-by-step solution.
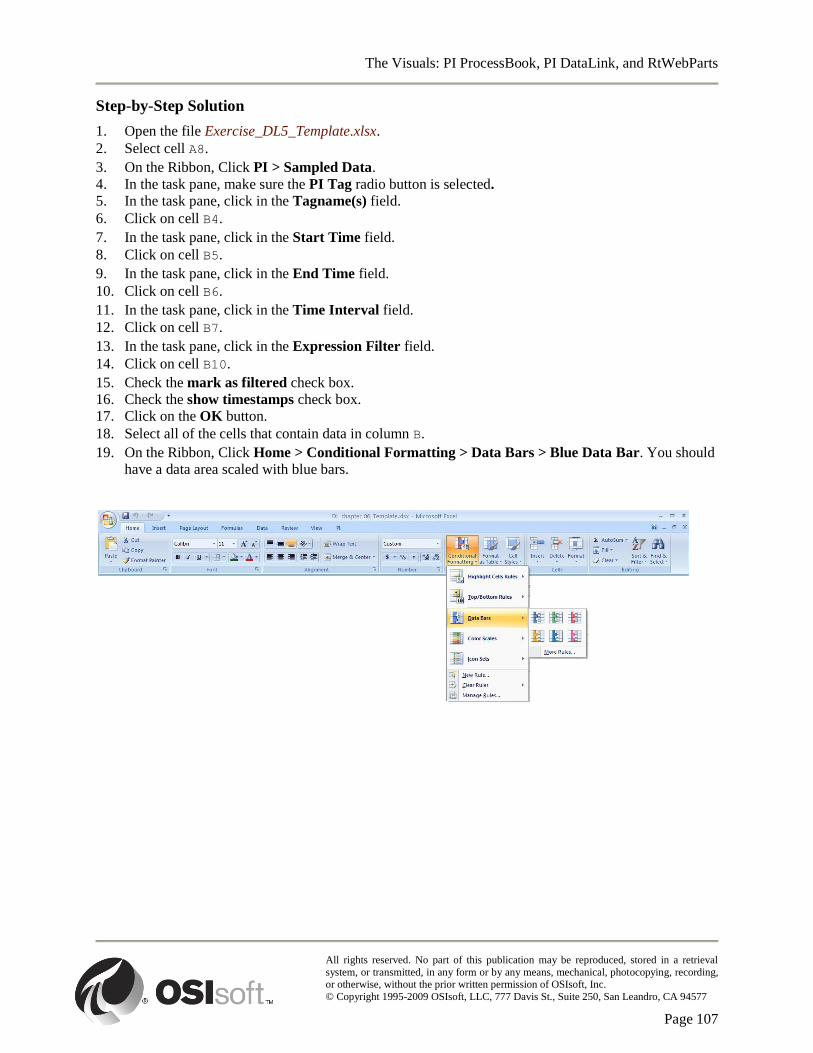
The Visuals: PI ProcessBook, PI DataLink, and RtWebParts
All rights reserved. No part of this publication may be reproduced, stored in a retrieval
system, or transmitted, in any form or by any means, mechanical, photocopying, recording, or otherwise, without the prior written permission of OSIsoft, Inc.
© Copyright 1995-2009 OSIsoft, LLC, 777 Davis St., Suite 250, San Leandro, CA 94577
Page 107
Step-by-Step Solution
1. Open the file Exercise_DL5_Template.xlsx.
2. Select cell A8.
3. On the Ribbon, Click PI > Sampled Data.
4. In the task pane, make sure the PI Tag radio button is selected.
5. In the task pane, click in the Tagname(s) field.
6. Click on cell B4.
7. In the task pane, click in the Start Time field.
8. Click on cell B5.
9. In the task pane, click in the End Time field.
10. Click on cell B6.
11. In the task pane, click in the Time Interval field.
12. Click on cell B7.
13. In the task pane, click in the Expression Filter field.
14. Click on cell B10.
15. Check the mark as filtered check box.
16. Check the show timestamps check box.
17. Click on the OK button.
18. Select all of the cells that contain data in column B.
19. On the Ribbon, Click Home > Conditional Formatting > Data Bars > Blue Data Bar. You should
have a data area scaled with blue bars.
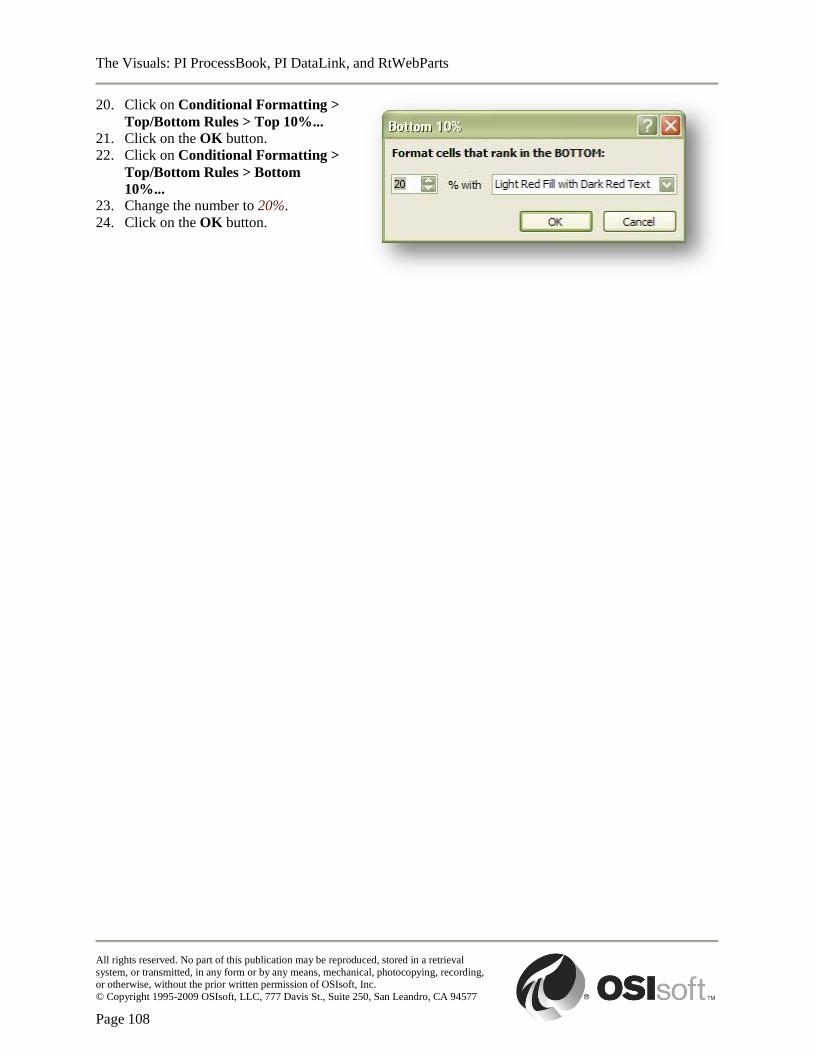
The Visuals: PI ProcessBook, PI DataLink, and RtWebParts
All rights reserved. No part of this publication may be reproduced, stored in a retrieval
system, or transmitted, in any form or by any means, mechanical, photocopying, recording, or otherwise, without the prior written permission of OSIsoft, Inc.
© Copyright 1995-2009 OSIsoft, LLC, 777 Davis St., Suite 250, San Leandro, CA 94577
Page 108
20. Click on Conditional Formatting >
Top/Bottom Rules > Top 10%... 21. Click on the OK button.
22. Click on Conditional Formatting >
Top/Bottom Rules > Bottom
10%... 23. Change the number to 20%.
24. Click on the OK button.
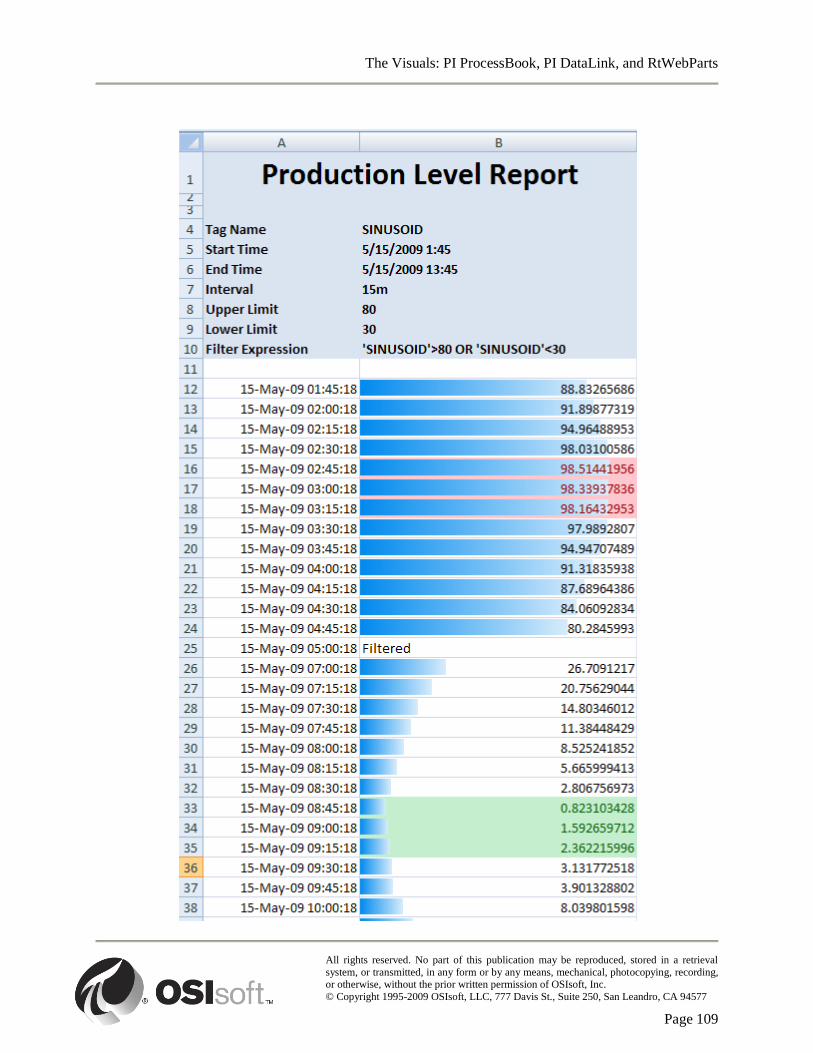
The Visuals: PI ProcessBook, PI DataLink, and RtWebParts
All rights reserved. No part of this publication may be reproduced, stored in a retrieval
system, or transmitted, in any form or by any means, mechanical, photocopying, recording, or otherwise, without the prior written permission of OSIsoft, Inc.
© Copyright 1995-2009 OSIsoft, LLC, 777 Davis St., Suite 250, San Leandro, CA 94577
Page 109
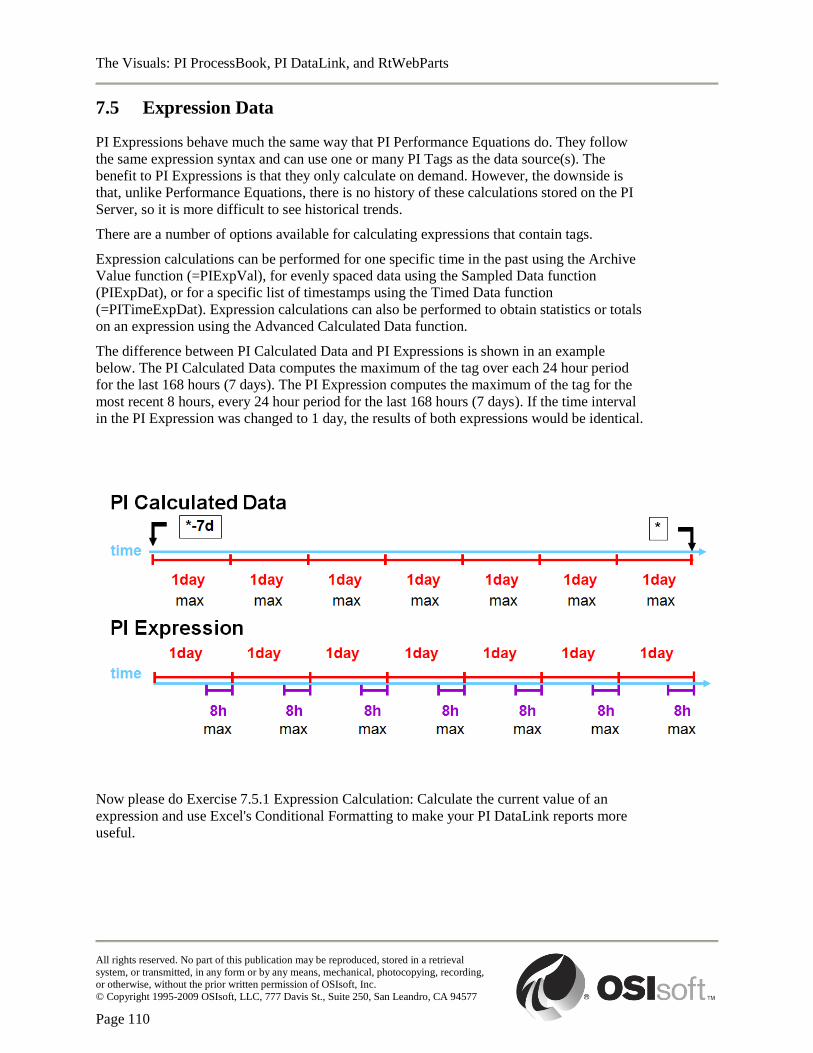
The Visuals: PI ProcessBook, PI DataLink, and RtWebParts
All rights reserved. No part of this publication may be reproduced, stored in a retrieval
system, or transmitted, in any form or by any means, mechanical, photocopying, recording, or otherwise, without the prior written permission of OSIsoft, Inc.
© Copyright 1995-2009 OSIsoft, LLC, 777 Davis St., Suite 250, San Leandro, CA 94577
Page 110
7.5 Expression Data
PI Expressions behave much the same way that PI Performance Equations do. They follow
the same expression syntax and can use one or many PI Tags as the data source(s). The
benefit to PI Expressions is that they only calculate on demand. However, the downside is
that, unlike Performance Equations, there is no history of these calculations stored on the PI
Server, so it is more difficult to see historical trends.
There are a number of options available for calculating expressions that contain tags.
Expression calculations can be performed for one specific time in the past using the Archive
Value function (=PIExpVal), for evenly spaced data using the Sampled Data function
(PIExpDat), or for a specific list of timestamps using the Timed Data function
(=PITimeExpDat). Expression calculations can also be performed to obtain statistics or totals
on an expression using the Advanced Calculated Data function.
The difference between PI Calculated Data and PI Expressions is shown in an example
below. The PI Calculated Data computes the maximum of the tag over each 24 hour period
for the last 168 hours (7 days). The PI Expression computes the maximum of the tag for the
most recent 8 hours, every 24 hour period for the last 168 hours (7 days). If the time interval
in the PI Expression was changed to 1 day, the results of both expressions would be identical.
Now please do Exercise 7.5.1 Expression Calculation: Calculate the current value of an
expression and use Excel's Conditional Formatting to make your PI DataLink reports more
useful.
The Visuals: PI ProcessBook, PI DataLink, and RtWebParts
All rights reserved. No part of this publication may be reproduced, stored in a retrieval
system, or transmitted, in any form or by any means, mechanical, photocopying, recording, or otherwise, without the prior written permission of OSIsoft, Inc.
© Copyright 1995-2009 OSIsoft, LLC, 777 Davis St., Suite 250, San Leandro, CA 94577
Page 111
7.5.1 Exercise – Expression Calculation
The following exercise is intended to reinforce key information presented in this
chapter or section. The answer can be found at the end of the exercise.
Objectives
Learn to carry out a calculation for the current value of an expression;
Use MS Excel‟s Conditional Formatting to make your PI Data Link reports more
useful.
Problem Description
As a Shift Team Leader in a bottling plant, you want to produce a real time report that shows the average
speed of the bottle filler for the past hour. You also wish to compare this average to the average of the 3
hours before, to know whether you are positively impacting production speed for your shift or not. The
speed of the bottle filler is measured by the tag SINUSOID.
Approach
Using the built-in function TagAvg, calculate and display the average for the filler speed tag (SINUSOID)
for the last hour. Using the built-in functions Sgn and TagAvg, calculate whether your hourly production
rate is better or worse than that for the three hours prior. Use MS Excel‟s conditional formatting to get a
quick view of your performance. Use the file Exercise_DL6_Template.xls as a template for this report.
Try to do this exercise on your own before proceeding to the step-by-step solution.
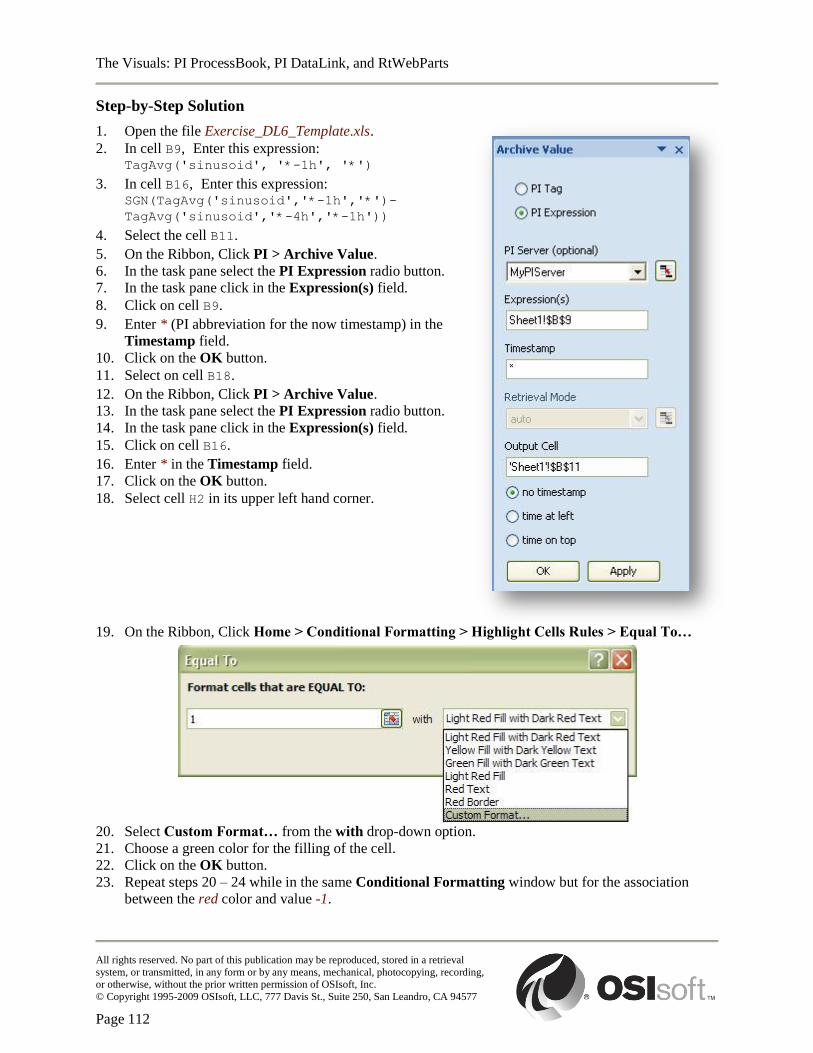
The Visuals: PI ProcessBook, PI DataLink, and RtWebParts
All rights reserved. No part of this publication may be reproduced, stored in a retrieval
system, or transmitted, in any form or by any means, mechanical, photocopying, recording, or otherwise, without the prior written permission of OSIsoft, Inc.
© Copyright 1995-2009 OSIsoft, LLC, 777 Davis St., Suite 250, San Leandro, CA 94577
Page 112
Step-by-Step Solution
1. Open the file Exercise_DL6_Template.xls.
2. In cell B9, Enter this expression: TagAvg('sinusoid', '*-1h', '*')
3. In cell B16, Enter this expression: SGN(TagAvg('sinusoid','*-1h','*')-
TagAvg('sinusoid','*-4h','*-1h'))
4. Select the cell B11.
5. On the Ribbon, Click PI > Archive Value.
6. In the task pane select the PI Expression radio button.
7. In the task pane click in the Expression(s) field.
8. Click on cell B9.
9. Enter * (PI abbreviation for the now timestamp) in the
Timestamp field.
10. Click on the OK button.
11. Select on cell B18.
12. On the Ribbon, Click PI > Archive Value.
13. In the task pane select the PI Expression radio button.
14. In the task pane click in the Expression(s) field.
15. Click on cell B16.
16. Enter * in the Timestamp field.
17. Click on the OK button.
18. Select cell H2 in its upper left hand corner.
19. On the Ribbon, Click Home > Conditional Formatting > Highlight Cells Rules > Equal To…
20. Select Custom Format… from the with drop-down option.
21. Choose a green color for the filling of the cell.
22. Click on the OK button.
23. Repeat steps 20 – 24 while in the same Conditional Formatting window but for the association
between the red color and value -1.
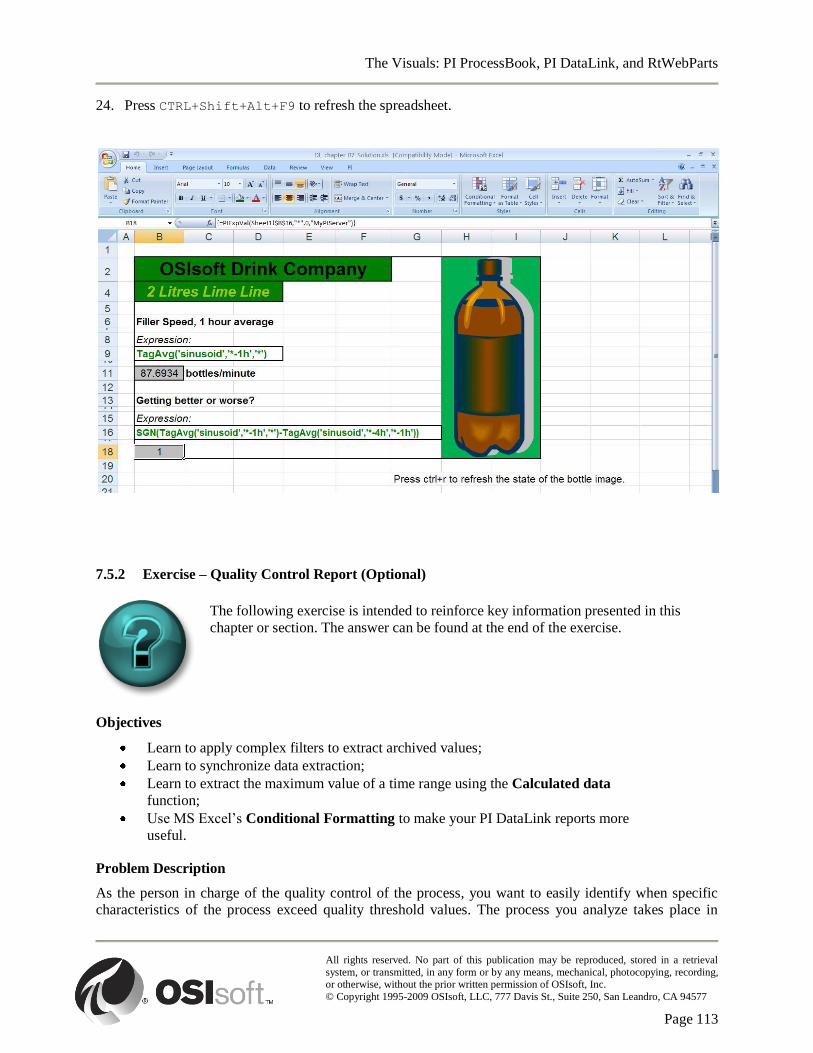
The Visuals: PI ProcessBook, PI DataLink, and RtWebParts
All rights reserved. No part of this publication may be reproduced, stored in a retrieval
system, or transmitted, in any form or by any means, mechanical, photocopying, recording, or otherwise, without the prior written permission of OSIsoft, Inc.
© Copyright 1995-2009 OSIsoft, LLC, 777 Davis St., Suite 250, San Leandro, CA 94577
Page 113
24. Press CTRL+Shift+Alt+F9 to refresh the spreadsheet.
7.5.2 Exercise – Quality Control Report (Optional)
The following exercise is intended to reinforce key information presented in this
chapter or section. The answer can be found at the end of the exercise.
Objectives
Learn to apply complex filters to extract archived values;
Learn to synchronize data extraction;
Learn to extract the maximum value of a time range using the Calculated data
function;
Use MS Excel‟s Conditional Formatting to make your PI DataLink reports more
useful.
Problem Description
As the person in charge of the quality control of the process, you want to easily identify when specific
characteristics of the process exceed quality threshold values. The process you analyze takes place in

The Visuals: PI ProcessBook, PI DataLink, and RtWebParts
All rights reserved. No part of this publication may be reproduced, stored in a retrieval
system, or transmitted, in any form or by any means, mechanical, photocopying, recording, or otherwise, without the prior written permission of OSIsoft, Inc.
© Copyright 1995-2009 OSIsoft, LLC, 777 Davis St., Suite 250, San Leandro, CA 94577
Page 114
seven (7) phases. During three (3) phases of the process, the monitoring of physical characteristics is
critical at the phase change; these phases are Phase1, Phase3 and Phase5. The physical characteristics
give indication of the quality of the product made in the reactor.
The physical characteristics are the electrical conductivity which is measured by the expression:
'BA:CONC.1' / 100 and the temperature is measured by the expression: 'BA:TEMP.1' * 10. The
threshold value for electrical conductivity should not overcome 0.45 Siemens/cm, and temperature in the
reactor should not overcome 500 degree Celsius.
Also, it is necessary to determine the conductivity and temperature maximums of the day and find when
these values occurred.
You need to build your report to make it easier to analyze in a short period of time. You decide to put red
visual indicators when threshold values are exceeded and blue indicators when everything is normal. You
need to be able to locate any high values of the day using the MS Excel Conditional Formatting.
Approach
We will use the Compressed Data function with a filter expression to retrieve when the different critical
phases took place during the day. The filter expression will contain many criteria tied together with an
OR logical operator.
The Archive Value function will be used to retrieve physical characteristic measurements as the phases
change. We will use the built-in PI Calculated Data function to show the conductivity and temperature
peak of the day. Use MS Excel‟s Conditional Formatting to get a quick view of your performance. Use
the file Exercise_DL7_Template.xls as a template for this report.
Try to do this exercise on your own before proceeding to the step-by-step solution.
The Visuals: PI ProcessBook, PI DataLink, and RtWebParts
All rights reserved. No part of this publication may be reproduced, stored in a retrieval
system, or transmitted, in any form or by any means, mechanical, photocopying, recording, or otherwise, without the prior written permission of OSIsoft, Inc.
© Copyright 1995-2009 OSIsoft, LLC, 777 Davis St., Suite 250, San Leandro, CA 94577
Page 115
Step-by-Step Solution
1. Open the file Exercise_DL7_Template.xls.
2. In cell B4, enter the tag name 'BA:PHASE.1
3. In cell B5, enter the expression: ''BA:CONC.1' / 100.
4. In cell B6, enter the expression: ''BA:TEMP.1' * 10.
5. In cell B9, build the filter expression to use. Enter the expression: ''BA:PHASE.1'="Phase1" OR 'BA:PHASE.1'="Phase3" OR 'BA:PHASE.1'="Phase5"
6. Select cell A12.
7. On the Ribbon, Click PI > Compressed Data.
8. In the task pane click in the Tagname(s) field.
9. Click on cell B4.
10. In the task pane click in the Start Time field.
11. Click on cell B7.
12. In the task pane click in the End Time field.
13. Click on cell B8.
14. In the task pane click in the Filter Expression (optional) field.
15. Click on cell B9.
16. Check the hide count option to remove the number of values extracted.
17. Check the show timestamps option.
18. Click on the OK button.
19. To extract the conductivity measurement at the phase‟s change, we need to use the individual
timestamps returned by the Compressed Data function as input timestamps for the Archive Value
function. Let us start by selecting cell C12.
20. On the Ribbon, Click PI > Archive Value.
21. Select the PI Expression radio button in the task pane.
22. In the task pane click in the Expression(s) field.
23. Click on cell B5.
24. In the task pane click in the Timestamp field.
25. Click on cell A12.
26. Click on the OK button.
27. Select cell C12. In the Formula Bar, localize the second argument (this will be a cell reference) and
click on the text forming the cell address.
28. Press on the F4 key on the keyboard two (2) times. This will transform the absolute cell reference
into a row relative cell reference. It means the dollar sign in front of the row position will be
removed. You will then see a reference like Sheet1!$A12 instead of Sheet1!$A$12.
29. Propagate the result down to cell C150 by dragging the cell‟s handle at the cell‟s lower-right corner.
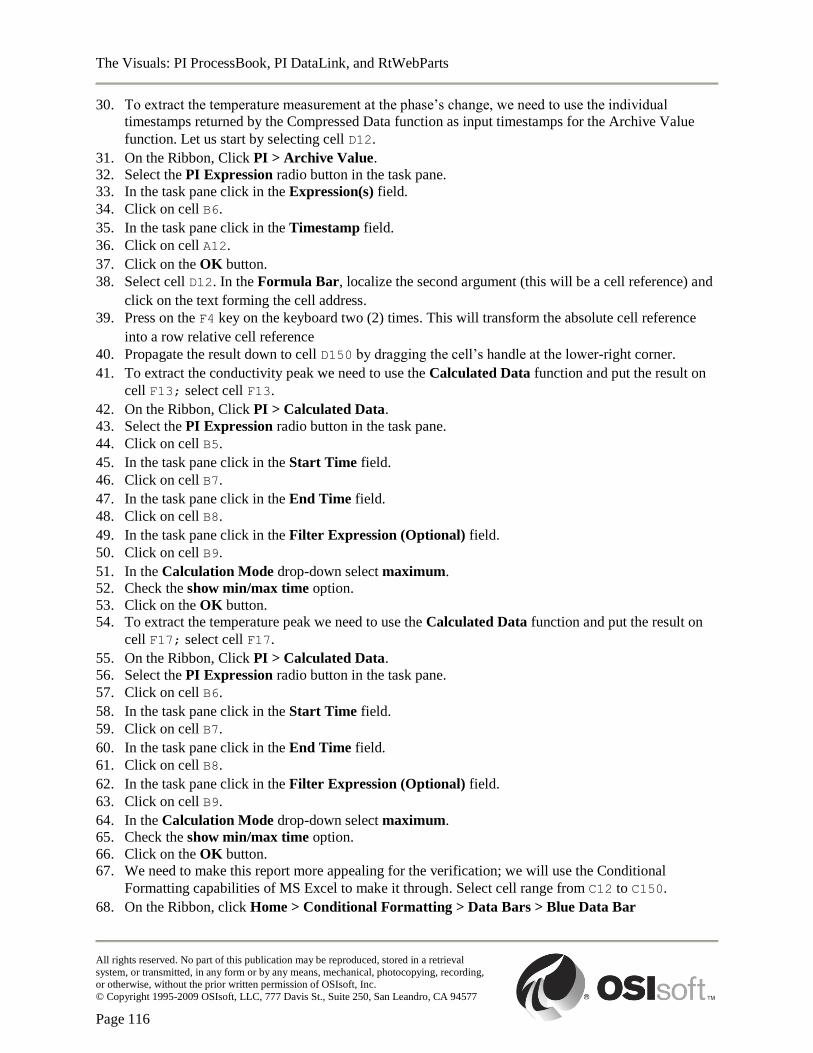
The Visuals: PI ProcessBook, PI DataLink, and RtWebParts
All rights reserved. No part of this publication may be reproduced, stored in a retrieval
system, or transmitted, in any form or by any means, mechanical, photocopying, recording, or otherwise, without the prior written permission of OSIsoft, Inc.
© Copyright 1995-2009 OSIsoft, LLC, 777 Davis St., Suite 250, San Leandro, CA 94577
Page 116
30. To extract the temperature measurement at the phase‟s change, we need to use the individual
timestamps returned by the Compressed Data function as input timestamps for the Archive Value
function. Let us start by selecting cell D12.
31. On the Ribbon, Click PI > Archive Value.
32. Select the PI Expression radio button in the task pane.
33. In the task pane click in the Expression(s) field.
34. Click on cell B6.
35. In the task pane click in the Timestamp field.
36. Click on cell A12.
37. Click on the OK button.
38. Select cell D12. In the Formula Bar, localize the second argument (this will be a cell reference) and
click on the text forming the cell address.
39. Press on the F4 key on the keyboard two (2) times. This will transform the absolute cell reference
into a row relative cell reference
40. Propagate the result down to cell D150 by dragging the cell‟s handle at the lower-right corner.
41. To extract the conductivity peak we need to use the Calculated Data function and put the result on
cell F13; select cell F13.
42. On the Ribbon, Click PI > Calculated Data.
43. Select the PI Expression radio button in the task pane.
44. Click on cell B5.
45. In the task pane click in the Start Time field.
46. Click on cell B7.
47. In the task pane click in the End Time field.
48. Click on cell B8.
49. In the task pane click in the Filter Expression (Optional) field.
50. Click on cell B9.
51. In the Calculation Mode drop-down select maximum.
52. Check the show min/max time option.
53. Click on the OK button.
54. To extract the temperature peak we need to use the Calculated Data function and put the result on
cell F17; select cell F17.
55. On the Ribbon, Click PI > Calculated Data.
56. Select the PI Expression radio button in the task pane.
57. Click on cell B6.
58. In the task pane click in the Start Time field.
59. Click on cell B7.
60. In the task pane click in the End Time field.
61. Click on cell B8.
62. In the task pane click in the Filter Expression (Optional) field.
63. Click on cell B9.
64. In the Calculation Mode drop-down select maximum.
65. Check the show min/max time option.
66. Click on the OK button.
67. We need to make this report more appealing for the verification; we will use the Conditional
Formatting capabilities of MS Excel to make it through. Select cell range from C12 to C150.
68. On the Ribbon, click Home > Conditional Formatting > Data Bars > Blue Data Bar
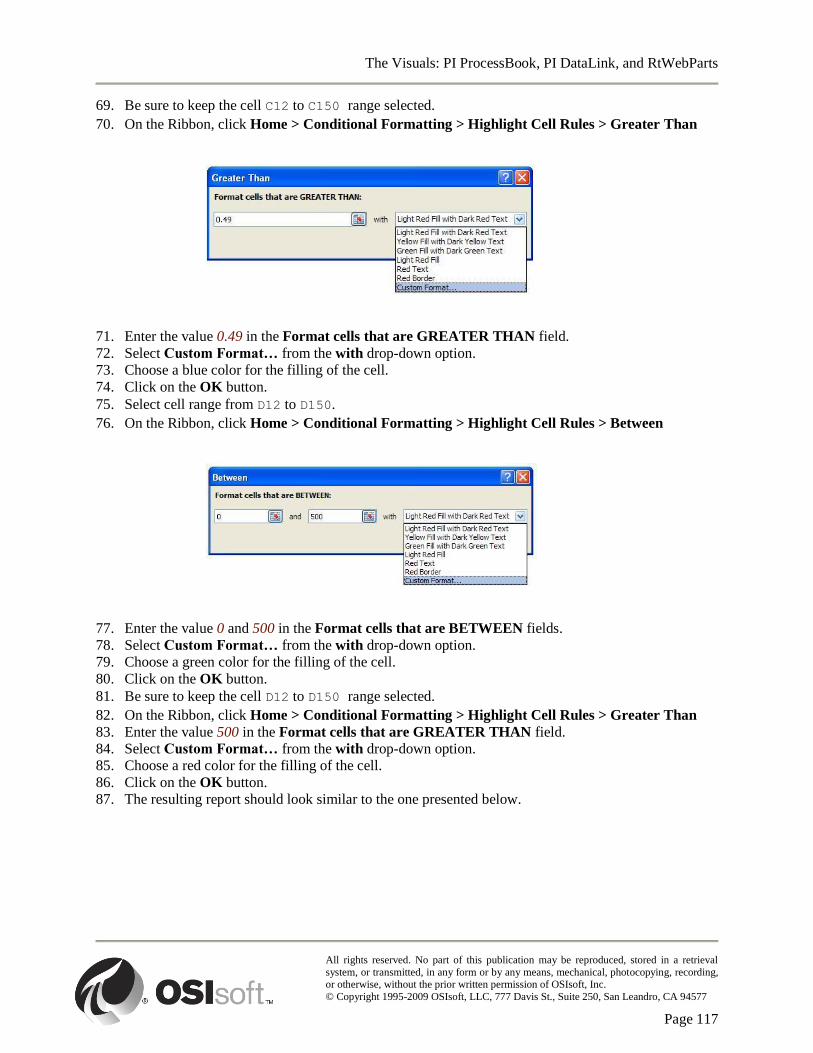
The Visuals: PI ProcessBook, PI DataLink, and RtWebParts
All rights reserved. No part of this publication may be reproduced, stored in a retrieval
system, or transmitted, in any form or by any means, mechanical, photocopying, recording, or otherwise, without the prior written permission of OSIsoft, Inc.
© Copyright 1995-2009 OSIsoft, LLC, 777 Davis St., Suite 250, San Leandro, CA 94577
Page 117
69. Be sure to keep the cell C12 to C150 range selected.
70. On the Ribbon, click Home > Conditional Formatting > Highlight Cell Rules > Greater Than
71. Enter the value 0.49 in the Format cells that are GREATER THAN field.
72. Select Custom Format… from the with drop-down option.
73. Choose a blue color for the filling of the cell.
74. Click on the OK button.
75. Select cell range from D12 to D150.
76. On the Ribbon, click Home > Conditional Formatting > Highlight Cell Rules > Between
77. Enter the value 0 and 500 in the Format cells that are BETWEEN fields.
78. Select Custom Format… from the with drop-down option.
79. Choose a green color for the filling of the cell.
80. Click on the OK button.
81. Be sure to keep the cell D12 to D150 range selected.
82. On the Ribbon, click Home > Conditional Formatting > Highlight Cell Rules > Greater Than
83. Enter the value 500 in the Format cells that are GREATER THAN field.
84. Select Custom Format… from the with drop-down option.
85. Choose a red color for the filling of the cell.
86. Click on the OK button.
87. The resulting report should look similar to the one presented below.
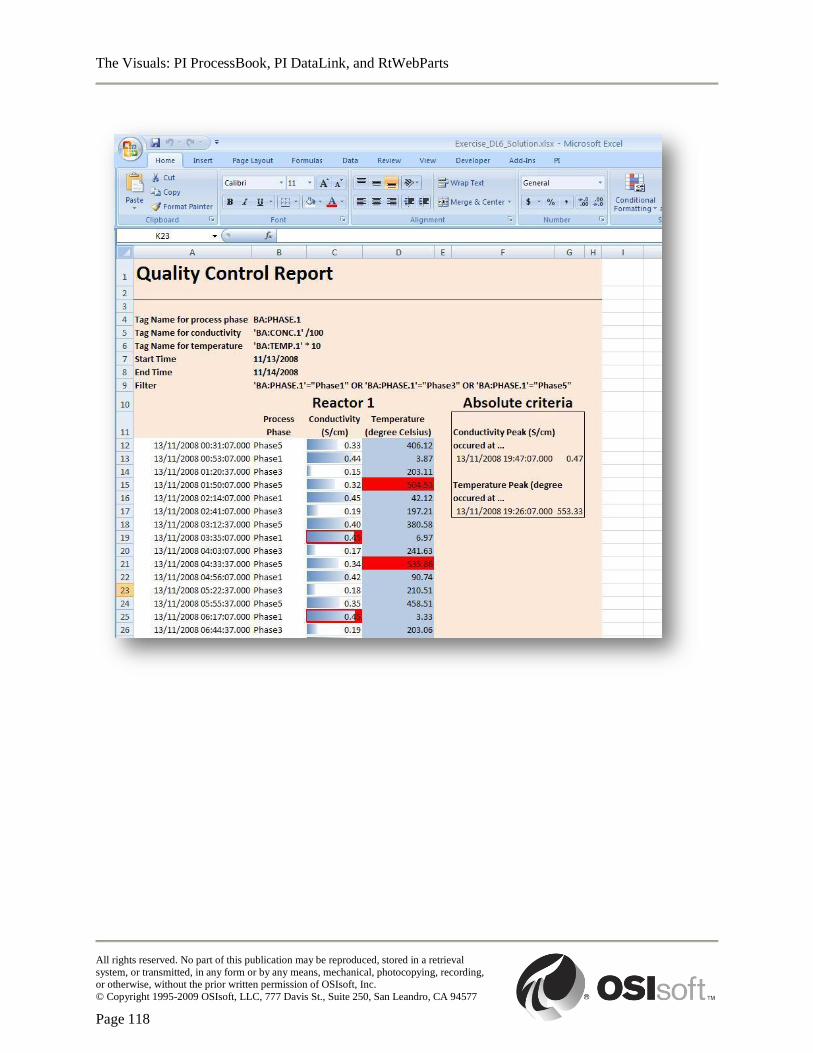
The Visuals: PI ProcessBook, PI DataLink, and RtWebParts
All rights reserved. No part of this publication may be reproduced, stored in a retrieval
system, or transmitted, in any form or by any means, mechanical, photocopying, recording, or otherwise, without the prior written permission of OSIsoft, Inc.
© Copyright 1995-2009 OSIsoft, LLC, 777 Davis St., Suite 250, San Leandro, CA 94577
Page 118
The Visuals: PI ProcessBook, PI DataLink, and RtWebParts
All rights reserved. No part of this publication may be reproduced, stored in a retrieval
system, or transmitted, in any form or by any means, mechanical, photocopying, recording, or otherwise, without the prior written permission of OSIsoft, Inc.
© Copyright 1995-2009 OSIsoft, LLC, 777 Davis St., Suite 250, San Leandro, CA 94577
Page 119
8. More RtWebParts
8.1 RtTrend
The RtTrend web part provides data visualization using an interactive trend graph updating in
real-time. This is very similar to the Trend in ProcessBook and DataLink. The web part
supports trend cursors and zooming. The configuration panel includes Time range selection,
Data selection, Vertical scale, Trends properties and formatting, and Time Scale. The default
time scale values use a full timestamp format, but other timestamp formats are available:
Full timestamp displays the start time at the origin and the end time at the far end of
the time scale.
Partial timestamp displays evenly spaced date or time units along the time scale
axis, as space permits. For example, an eight-hour plot may display individual hourly
time values along the time scale. The current date and time appear in the upper right
corner.
Relative timestamp displays time unit offsets from the End Time. Using the
previous example, the scale would be labeled -1 to -7 moving from the end to the
beginning of the time scale axis. The units are displayed in the middle of the scale,
with current date and time displayed in the upper right corner of the trend.
Select the Export to Excel option from the RtTrend web part menu. Data contained in the
RtTrend web part (original configuration or zoomed in area) will be exported in an Excel
spreadsheet.
Note: The Export to Excel > Save is currently a known bug. This should open a save dialogue box to
save the file without opening it, but this is not currently the case. This should be updated in the next
release. In the meantime opening the file and then saving is a simple work around.
8.2 RtTimeRange
RtTimeRange web part makes an implicit connection to other RtWebParts and it allows the
user to change the start and end times for other web parts on the page. The buttons next to the
text fields open a calendar dialog box for selecting a date and time or timestamps can be
directly entered in the fields. Both PI and Windows time formats are supported. By default,
when you edit the RtTimeRange web part, it will affect all RtTrends on the same page. These
connections can be made explicitly, rather than implicitly. We will cover making explicit
connections later.

The Visuals: PI ProcessBook, PI DataLink, and RtWebParts
All rights reserved. No part of this publication may be reproduced, stored in a retrieval
system, or transmitted, in any form or by any means, mechanical, photocopying, recording, or otherwise, without the prior written permission of OSIsoft, Inc.
© Copyright 1995-2009 OSIsoft, LLC, 777 Davis St., Suite 250, San Leandro, CA 94577
Page 120
8.2.1 Exercise – Configure and Export RtTrend
The following exercise is intended to reinforce key information presented in this
chapter or section. The answer can be found at the end of the exercise.
Objectives
Familiarize yourself with configuring a RtTrend web part;
Familiarize yourself with export capabilities of the RtTrend web part.
Problem Description
You want to see a trend with data and so you will create a page and use the RtTrend web part. You also
want to use the RtTimeRange web part to control the trend. Finally, you want to export the value to
Microsoft Excel.
Approach
Create a new page in your Team Site called Exercise_R5. Add one RtTrend and one RtTimeRange web
part to any zone. Add the tag CDT158 to the data area of the RtTrend web part. Exit the edit mode and
test the web part interaction by changing the time in the RtTimeRange web part to a Start Time of *-24h
and notice the effect on the RtTrend. Click on the upper-right menu icon for the RtTrend web part and
select Export to Excel > Open. Once the file is opened, save it to your desktop. Re-open the file and
verify the contents.
Try to do this exercise on your own before proceeding to the step-by-step solution.
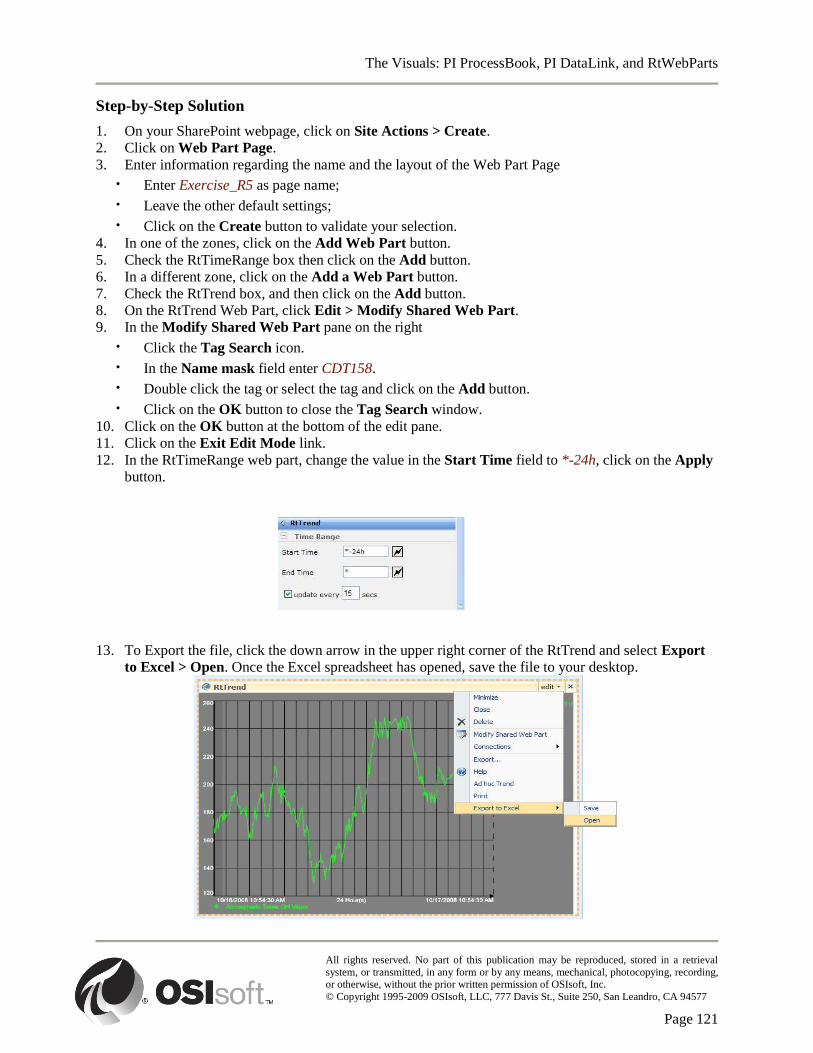
The Visuals: PI ProcessBook, PI DataLink, and RtWebParts
All rights reserved. No part of this publication may be reproduced, stored in a retrieval
system, or transmitted, in any form or by any means, mechanical, photocopying, recording, or otherwise, without the prior written permission of OSIsoft, Inc.
© Copyright 1995-2009 OSIsoft, LLC, 777 Davis St., Suite 250, San Leandro, CA 94577
Page 121
Step-by-Step Solution
1. On your SharePoint webpage, click on Site Actions > Create.
2. Click on Web Part Page.
3. Enter information regarding the name and the layout of the Web Part Page
· Enter Exercise_R5 as page name;
· Leave the other default settings;
· Click on the Create button to validate your selection.
4. In one of the zones, click on the Add Web Part button.
5. Check the RtTimeRange box then click on the Add button.
6. In a different zone, click on the Add a Web Part button.
7. Check the RtTrend box, and then click on the Add button.
8. On the RtTrend Web Part, click Edit > Modify Shared Web Part.
9. In the Modify Shared Web Part pane on the right
· Click the Tag Search icon.
· In the Name mask field enter CDT158.
· Double click the tag or select the tag and click on the Add button.
· Click on the OK button to close the Tag Search window.
10. Click on the OK button at the bottom of the edit pane.
11. Click on the Exit Edit Mode link.
12. In the RtTimeRange web part, change the value in the Start Time field to *-24h, click on the Apply
button.
13. To Export the file, click the down arrow in the upper right corner of the RtTrend and select Export
to Excel > Open. Once the Excel spreadsheet has opened, save the file to your desktop.
The Visuals: PI ProcessBook, PI DataLink, and RtWebParts
All rights reserved. No part of this publication may be reproduced, stored in a retrieval
system, or transmitted, in any form or by any means, mechanical, photocopying, recording, or otherwise, without the prior written permission of OSIsoft, Inc.
© Copyright 1995-2009 OSIsoft, LLC, 777 Davis St., Suite 250, San Leandro, CA 94577
Page 122
14. Reopen the saved Excel file and verify the content.
8.3 RtGraphic
8.3.1 SVG
Scalable Vector Graphics is an Adobe graphic file format that enables dynamic generation of
high quality graphics from real time data. PI ProcessBook 2.2 and higher has an SVG add-in
that allows the conversion of ProcessBook files into the SVG type and vice-versa. The SVG
Viewer can also be downloaded from: http://www.adobe.com/svg/viewer/install/main.html
Scalable Vector Graphics (SVG) is a graphic file format and web development language
based on XML. SVG enables Web developers and designers to create dynamically generated,
high-quality graphics from real-time data with precise structural and visual control. With this
powerful technology, SVG developers can create a generation of Web applications based on
data-driven, interactive, and personalized graphics.
Because it is based on XML, SVG content can be linked to back-end business processes such
as e-commerce systems, corporate databases, and other rich sources of real-time information.
You can create web-based applications, tools or sophisticated user interfaces with common
Web scripting and programming languages such as JavaScript, Java, and Microsoft Visual
Basic.
Source: http://www.adobe.com/svg/overview/svg.html
8.3.2 RtGraphic uses PI ProcessBook SVG files
The RtGraphic presents ProcessBook displays that are saved in an SVG format. They are then
shared in a document library, making it easier for users to share files. The SVG files that you
want to display in RtGraphic web parts must be uploaded to a SharePoint document library.
PI ProcessBook SVG files do not support VBA Scripting, SQC, and Batch trends. The
RtActiveView web part must be used to maintain all of the functionality of PI ProcessBook
PDI displays, which will be covered later.
This section of the RtGraphic Configuration tool provides the ability to search for SVG
files and select one for display. There is also a button to configure a web part connection that
sends a path to a file. The section is expanded by default, but can be collapsed by clicking its
collapse button (-). This tool part contains two main sections, Selected File and XSL
Transform.
The Select File field shows the full path to the SVG file to display in the web part. The path
may be a UNC path to a file share or an absolute or relative URL. Typically, we recommend
uploading the SVG file to the SharePoint Server in one of the Document Libraries associated
with the site and use the URL to the file in that library. The contents of the field can be
changed by typing or by selecting a different file from the File Search dialog box.
The XSL Transform File text field accepts a URL to an XSLT file. By using an XSLT in an
RtGraphic web part, the user can enhance an SVG file that is authored in PI ProcessBook
without permanently altering its contents. The transformation logic can include pattern-based
The Visuals: PI ProcessBook, PI DataLink, and RtWebParts
All rights reserved. No part of this publication may be reproduced, stored in a retrieval
system, or transmitted, in any form or by any means, mechanical, photocopying, recording, or otherwise, without the prior written permission of OSIsoft, Inc.
© Copyright 1995-2009 OSIsoft, LLC, 777 Davis St., Suite 250, San Leandro, CA 94577
Page 123
substitution to change tags or server names, adjust the visual representation of a display, or to
attach JavaScript logic to specific elements.
SVG Displays created in ProcessBook can be edited in the smart clients by:
Edit in PI ProcessBook option in the document library menu;
Launch Analysis Tool in the RtGraphic web part menu.
If you have PI ProcessBook installed on your local machine and you have access to the
PI Server on which the data in the RtGraphic web part relies, it is possible to perform what is
known as a Roundtrip in ProcessBook. This involves launching the SVG file in
PI ProcessBook, making any desired additions, edits, or deletions, and then saving the SVG
file. You can then save it directly the Document Library, or save the file locally and re-upload
it. The RtGraphic should be automatically updated with the changes you made in
ProcessBook. You may have to refresh the screen so that it renders again.
8.3.3 Exercise – Configure the RtGraphic WebPart
The following exercise is intended to reinforce key information presented in this
chapter or section. The answer can be found at the end of the exercise.
Objectives
Familiarize yourself with using PI ProcessBook displays in web parts.
Problem Description
You have some PI ProcessBook displays that your users would like to preserve in web parts.
Approach
Create a new page in your Team Site called Exercise_R6. If you are not already in Edit Mode, select Edit
Page from the upper right page menu. Add one RtGraphic web part to any zone. Minimize the browser
window and open PI ProcessBook. Select the display Main Column Bottom and open it. Use the Save As
function and save it to your desktop in the .SVG file format. Go back to your browser and navigate to the
ProcessBook Files Document Library you created earlier. Upload the .SVG file there. Finally, go back to
the page you created for this exercise and configure the RtGraphic web part to display your .SVG file.
Try to do this exercise on your own before proceeding to the step-by-step solution.
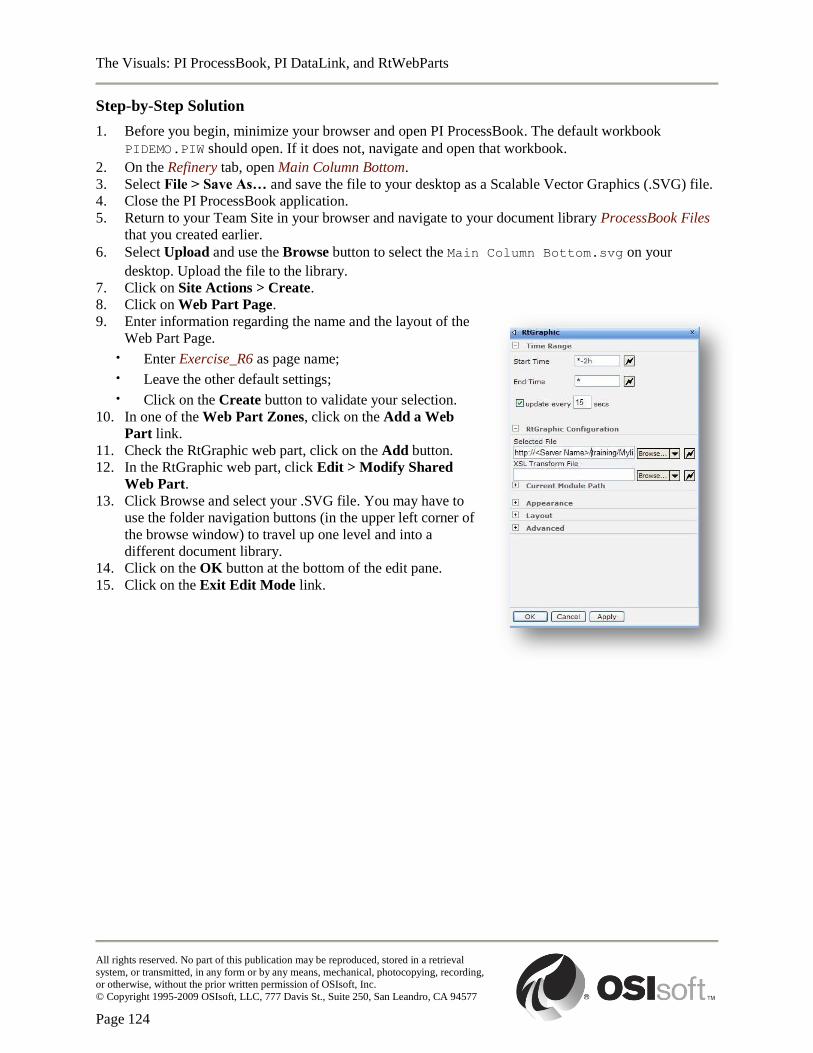
The Visuals: PI ProcessBook, PI DataLink, and RtWebParts
All rights reserved. No part of this publication may be reproduced, stored in a retrieval
system, or transmitted, in any form or by any means, mechanical, photocopying, recording, or otherwise, without the prior written permission of OSIsoft, Inc.
© Copyright 1995-2009 OSIsoft, LLC, 777 Davis St., Suite 250, San Leandro, CA 94577
Page 124
Step-by-Step Solution
1. Before you begin, minimize your browser and open PI ProcessBook. The default workbook
PIDEMO.PIW should open. If it does not, navigate and open that workbook.
2. On the Refinery tab, open Main Column Bottom.
3. Select File > Save As… and save the file to your desktop as a Scalable Vector Graphics (.SVG) file.
4. Close the PI ProcessBook application.
5. Return to your Team Site in your browser and navigate to your document library ProcessBook Files
that you created earlier.
6. Select Upload and use the Browse button to select the Main Column Bottom.svg on your
desktop. Upload the file to the library.
7. Click on Site Actions > Create.
8. Click on Web Part Page.
9. Enter information regarding the name and the layout of the
Web Part Page.
· Enter Exercise_R6 as page name;
· Leave the other default settings;
· Click on the Create button to validate your selection.
10. In one of the Web Part Zones, click on the Add a Web
Part link.
11. Check the RtGraphic web part, click on the Add button.
12. In the RtGraphic web part, click Edit > Modify Shared
Web Part.
13. Click Browse and select your .SVG file. You may have to
use the folder navigation buttons (in the upper left corner of
the browse window) to travel up one level and into a
different document library.
14. Click on the OK button at the bottom of the edit pane.
15. Click on the Exit Edit Mode link.
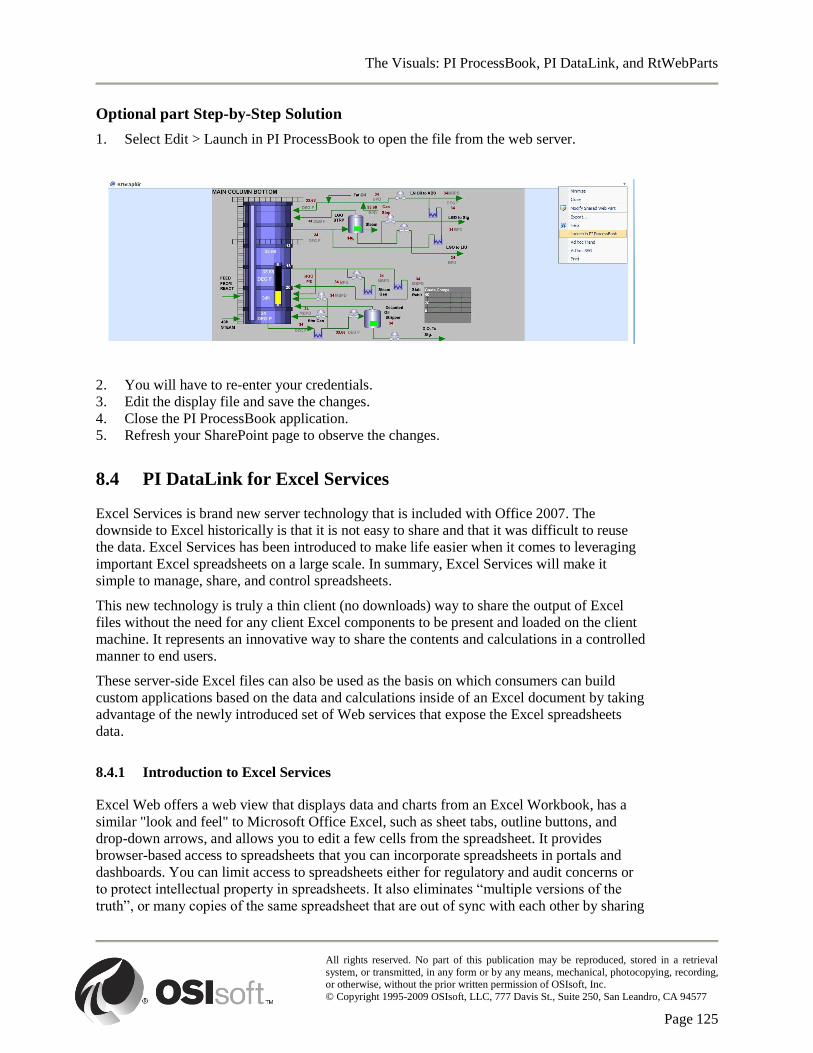
The Visuals: PI ProcessBook, PI DataLink, and RtWebParts
All rights reserved. No part of this publication may be reproduced, stored in a retrieval
system, or transmitted, in any form or by any means, mechanical, photocopying, recording, or otherwise, without the prior written permission of OSIsoft, Inc.
© Copyright 1995-2009 OSIsoft, LLC, 777 Davis St., Suite 250, San Leandro, CA 94577
Page 125
Optional part Step-by-Step Solution
1. Select Edit > Launch in PI ProcessBook to open the file from the web server.
2. You will have to re-enter your credentials.
3. Edit the display file and save the changes.
4. Close the PI ProcessBook application.
5. Refresh your SharePoint page to observe the changes.
8.4 PI DataLink for Excel Services
Excel Services is brand new server technology that is included with Office 2007. The
downside to Excel historically is that it is not easy to share and that it was difficult to reuse
the data. Excel Services has been introduced to make life easier when it comes to leveraging
important Excel spreadsheets on a large scale. In summary, Excel Services will make it
simple to manage, share, and control spreadsheets.
This new technology is truly a thin client (no downloads) way to share the output of Excel
files without the need for any client Excel components to be present and loaded on the client
machine. It represents an innovative way to share the contents and calculations in a controlled
manner to end users.
These server-side Excel files can also be used as the basis on which consumers can build
custom applications based on the data and calculations inside of an Excel document by taking
advantage of the newly introduced set of Web services that expose the Excel spreadsheets
data.
8.4.1 Introduction to Excel Services
Excel Web offers a web view that displays data and charts from an Excel Workbook, has a
similar "look and feel" to Microsoft Office Excel, such as sheet tabs, outline buttons, and
drop-down arrows, and allows you to edit a few cells from the spreadsheet. It provides
browser-based access to spreadsheets that you can incorporate spreadsheets in portals and
dashboards. You can limit access to spreadsheets either for regulatory and audit concerns or
to protect intellectual property in spreadsheets. It also eliminates “multiple versions of the
truth”, or many copies of the same spreadsheet that are out of sync with each other by sharing
The Visuals: PI ProcessBook, PI DataLink, and RtWebParts
All rights reserved. No part of this publication may be reproduced, stored in a retrieval
system, or transmitted, in any form or by any means, mechanical, photocopying, recording, or otherwise, without the prior written permission of OSIsoft, Inc.
© Copyright 1995-2009 OSIsoft, LLC, 777 Davis St., Suite 250, San Leandro, CA 94577
Page 126
them via online document libraries. It also allows you to leverage servers to offload long-
running calculations from desktop machines.
An Excel Web Access Web Part is also available which allows embedded Excel reports into
existing Portal pages. Interaction with other Web Parts is available through the use of
connections, covered later.
8.4.2 Publishing Reports in Excel Services
Similar to the way you must save and upload an SVG file to a Document Library to display
your independent ProcessBook Displays, you must publish the Excel file to a Document
Library to use it in a Web Part. The Excel Services are installed only with Microsoft Office
SharePoint Server (MOSS), not WSS or SPS.
8.4.3 Exercise – Configure DataLink for Excel Services
The following exercise is intended to reinforce key information presented in this
chapter or section. The answer can be found at the end of the exercise.
Objectives
Familiarize students with using DataLink reports in a web page.
Problem Description
Your manager wants to be able to see reports on the intranet. You decide to use PI DataLink
for Excel Services to post live PI DataLink reports in a web page.
Approach
Open a spreadsheet containing data from the PI DataLink Compressed Data (Start
Time/Number) function (Exercise_DL5_Solution.xlsx if you do not wish to create your
own) and publish it on the SharePoint Server.
Create a new page in your Team Site called Exercise_R7. If you are not already in Edit
Mode, select Edit Page from the upper right page menu.
Add one EWA (Excel Web Access) web part to any zone on the page. Configure the web part
to use the spreadsheet that you just uploaded to your document library.
Note: The DataLink spreadsheet must be uploaded to the same Document Library as the Web Part Page is
stored.

The Visuals: PI ProcessBook, PI DataLink, and RtWebParts
All rights reserved. No part of this publication may be reproduced, stored in a retrieval
system, or transmitted, in any form or by any means, mechanical, photocopying, recording, or otherwise, without the prior written permission of OSIsoft, Inc.
© Copyright 1995-2009 OSIsoft, LLC, 777 Davis St., Suite 250, San Leandro, CA 94577
Page 127
Try to do this exercise on your own before proceeding to the step-by-step solution.

The Visuals: PI ProcessBook, PI DataLink, and RtWebParts
All rights reserved. No part of this publication may be reproduced, stored in a retrieval
system, or transmitted, in any form or by any means, mechanical, photocopying, recording, or otherwise, without the prior written permission of OSIsoft, Inc.
© Copyright 1995-2009 OSIsoft, LLC, 777 Davis St., Suite 250, San Leandro, CA 94577
Page 128
Step-by-Step Solution
1. Navigate to your Team Site in your browser and navigate to your document library Shared
Documents.
2. Select Upload and use the Browse button to select ProductionReport_Completred.xls from your
system (C:\class\). Upload the file to the library.
3. Click Site Actions > Create.
4. Click Add Web Part Page.
5. In the Name field enter Exercise_R7.
6. In one of the Web Part Zones, click Add a Web Part, and then click OK.
7. Check the Excel Web Access (EWA) box, click Add.
8. Click Edit > Modify Shared Web Part.
9. Browse for your workbook you uploaded.
10. Click OK.
11. Click OK to close the edit panel.
The Visuals: PI ProcessBook, PI DataLink, and RtWebParts
All rights reserved. No part of this publication may be reproduced, stored in a retrieval
system, or transmitted, in any form or by any means, mechanical, photocopying, recording, or otherwise, without the prior written permission of OSIsoft, Inc.
© Copyright 1995-2009 OSIsoft, LLC, 777 Davis St., Suite 250, San Leandro, CA 94577
Page 129
9. PI Module Database
Each PI Server has its own PI Module Database (PI MDB). The PI MDB is used to organize
an enterprise's information streams into logical sub-areas. The path to a certain area is called
a context. If the context (plant, unit, etc) is changed, the referenced PI points will change
without having to search again for their tag names. The structure of the PI Module Database
allows the information to be stored hierarchically in relation to a physical model, a business
model or an application model. Each module has:
Configurable information – PI Properties
Linked tags – PI Aliases
Dated versions - Revision number, Version number, Effective Date, Obsolete Date
and Query Date
System assigned information – UniqueID, Owner, Parent list, etc.
Sub-Modules with the same characteristics – PI Modules
PI Properties are collections of named values that can store information related to a PI
module. A PI Property has a Name and a Value. PI Properties can also be hierarchical. The
Value can be nearly any type: string, numeric, date, etc. PI Properties are used to store
information about a module, example:
Serial number
Installation date
Name of the technician who performed the installation
PI Aliases let you configure common names, the Alias, to access real time information
through references to PI tags.
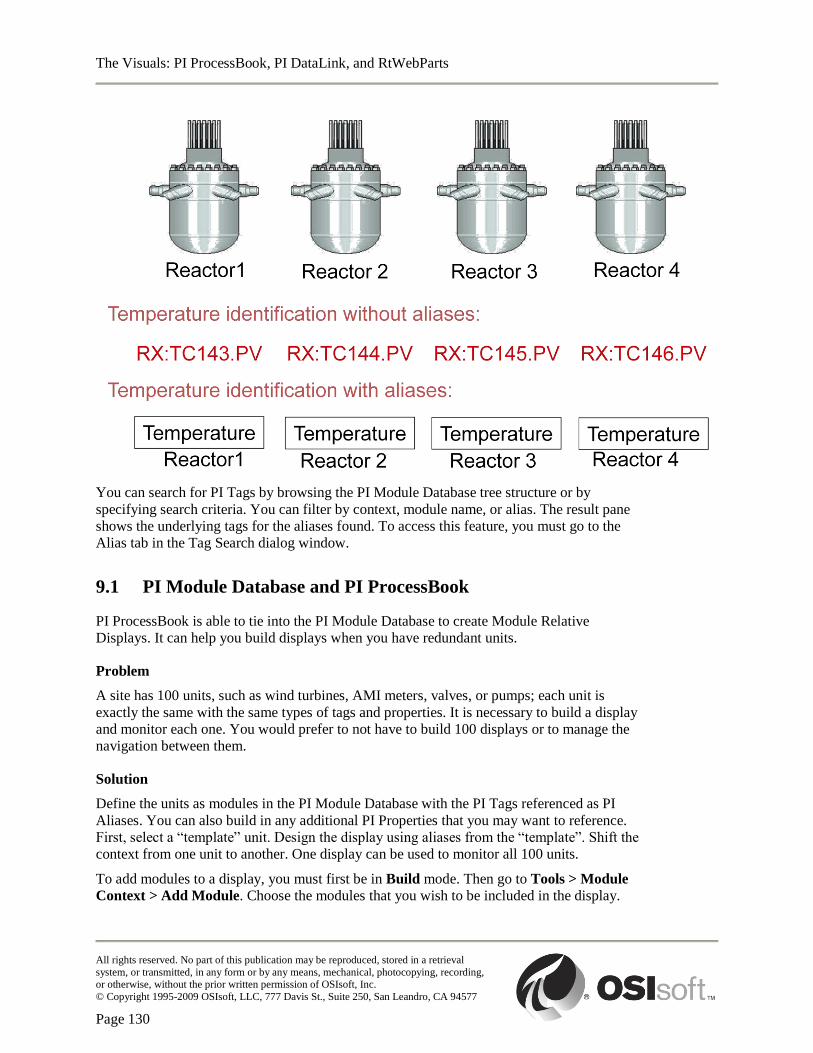
The Visuals: PI ProcessBook, PI DataLink, and RtWebParts
All rights reserved. No part of this publication may be reproduced, stored in a retrieval
system, or transmitted, in any form or by any means, mechanical, photocopying, recording, or otherwise, without the prior written permission of OSIsoft, Inc.
© Copyright 1995-2009 OSIsoft, LLC, 777 Davis St., Suite 250, San Leandro, CA 94577
Page 130
You can search for PI Tags by browsing the PI Module Database tree structure or by
specifying search criteria. You can filter by context, module name, or alias. The result pane
shows the underlying tags for the aliases found. To access this feature, you must go to the
Alias tab in the Tag Search dialog window.
9.1 PI Module Database and PI ProcessBook
PI ProcessBook is able to tie into the PI Module Database to create Module Relative
Displays. It can help you build displays when you have redundant units.
Problem
A site has 100 units, such as wind turbines, AMI meters, valves, or pumps; each unit is
exactly the same with the same types of tags and properties. It is necessary to build a display
and monitor each one. You would prefer to not have to build 100 displays or to manage the
navigation between them.
Solution
Define the units as modules in the PI Module Database with the PI Tags referenced as PI
Aliases. You can also build in any additional PI Properties that you may want to reference.
First, select a “template” unit. Design the display using aliases from the “template”. Shift the
context from one unit to another. One display can be used to monitor all 100 units.
To add modules to a display, you must first be in Build mode. Then go to Tools > Module
Context > Add Module. Choose the modules that you wish to be included in the display.

The Visuals: PI ProcessBook, PI DataLink, and RtWebParts
All rights reserved. No part of this publication may be reproduced, stored in a retrieval
system, or transmitted, in any form or by any means, mechanical, photocopying, recording, or otherwise, without the prior written permission of OSIsoft, Inc.
© Copyright 1995-2009 OSIsoft, LLC, 777 Davis St., Suite 250, San Leandro, CA 94577
Page 131
They will then be available in that display for reference. To add the aliases to a Dynamic
Element, you need to do the following:
Click Module Context in the dropdown list beside the Tag Search button.
You will see a list of all the aliases and properties defined in the current context.
Choose the item you want to display and click OK.
You have just created one display for multiple units. You can even configure the PI Module
Database and the display to show the current context being used with a value symbol.
ProcessBook 3.2 still ties in to the Module Database. However, it can also be used to create
Element Relative Displays (ERDs) that are based on AF Elements and Attributes instead of
Module Contexts and Aliases. The ProcessBook 3.2 release is meant to be a bridge between
MDB and AF. The process for creating ERDs is similar to creating MRDs, so we will not go
into it further at this time.
9.1.1 Exercise – Module Relative ProcessBook Displays
The following exercise is intended to reinforce key information presented in this
chapter or section. The answer can be found at the end of the exercise.
Objectives
Create a ProcessBook display that is driven by PI Module Database Aliases and
Properties instead of tag names.
Problem Description
There are two identical reactors in your lab. You want to create one display to view process information
for any given reactor instead of two separate displays. Use the existing PI Module Database structure to:
Display the values of Temperature, Level and Concentration of the chosen reactor;
Display the Height and Radius properties;
Trend the Temperature alias for the chosen unit.
Approach
Open PI ProcessBook and create a dynamic, module database driven display named Exercise
PB 6 using the two reactors. In a new display, add the two modules to the Available Modules
control via the Tools Menu. Add a tank to the center of the display for visual appeal. You can
select any tank from the Symbol Library. Then add 5 dynamic values and one trend. The
dynamic values should show the Temperature, Level and Concentration aliases and the
Height and Radius properties. The trend should show the Temperature alias. The completed
display may look similar to the one beside. Test the display by selecting between the
modules. You should notice that the values will change.
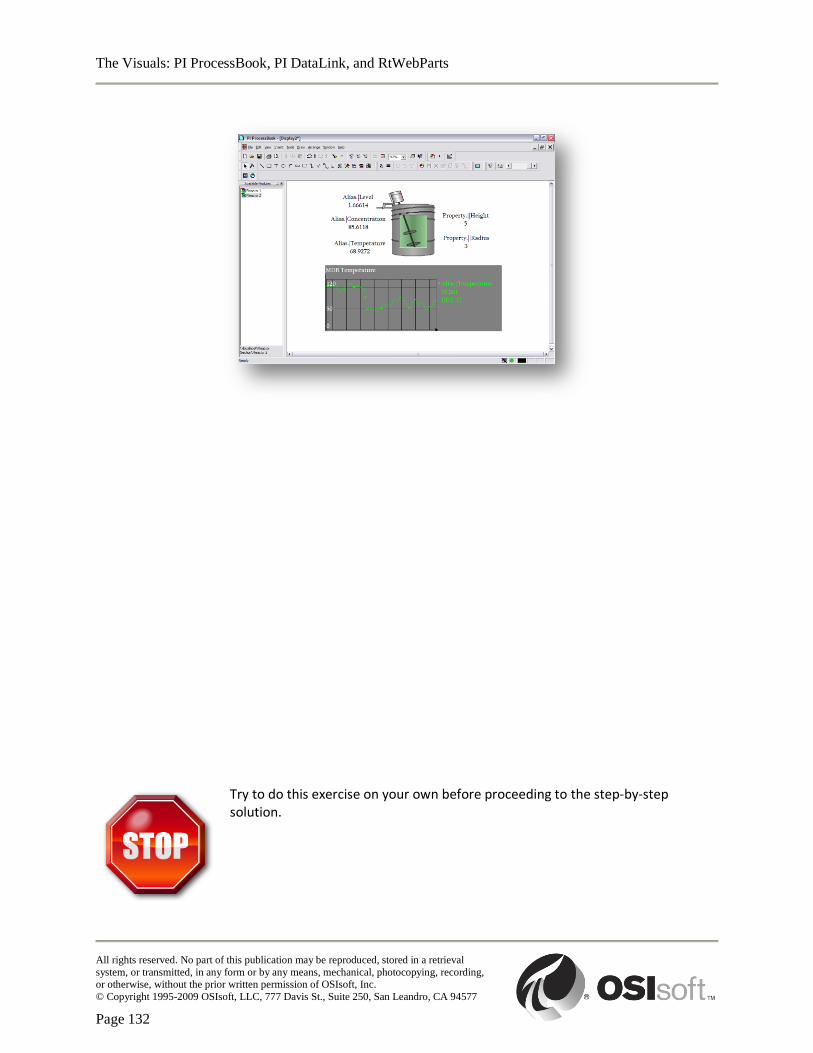
The Visuals: PI ProcessBook, PI DataLink, and RtWebParts
All rights reserved. No part of this publication may be reproduced, stored in a retrieval
system, or transmitted, in any form or by any means, mechanical, photocopying, recording, or otherwise, without the prior written permission of OSIsoft, Inc.
© Copyright 1995-2009 OSIsoft, LLC, 777 Davis St., Suite 250, San Leandro, CA 94577
Page 132
Try to do this exercise on your own before proceeding to the step-by-step solution.
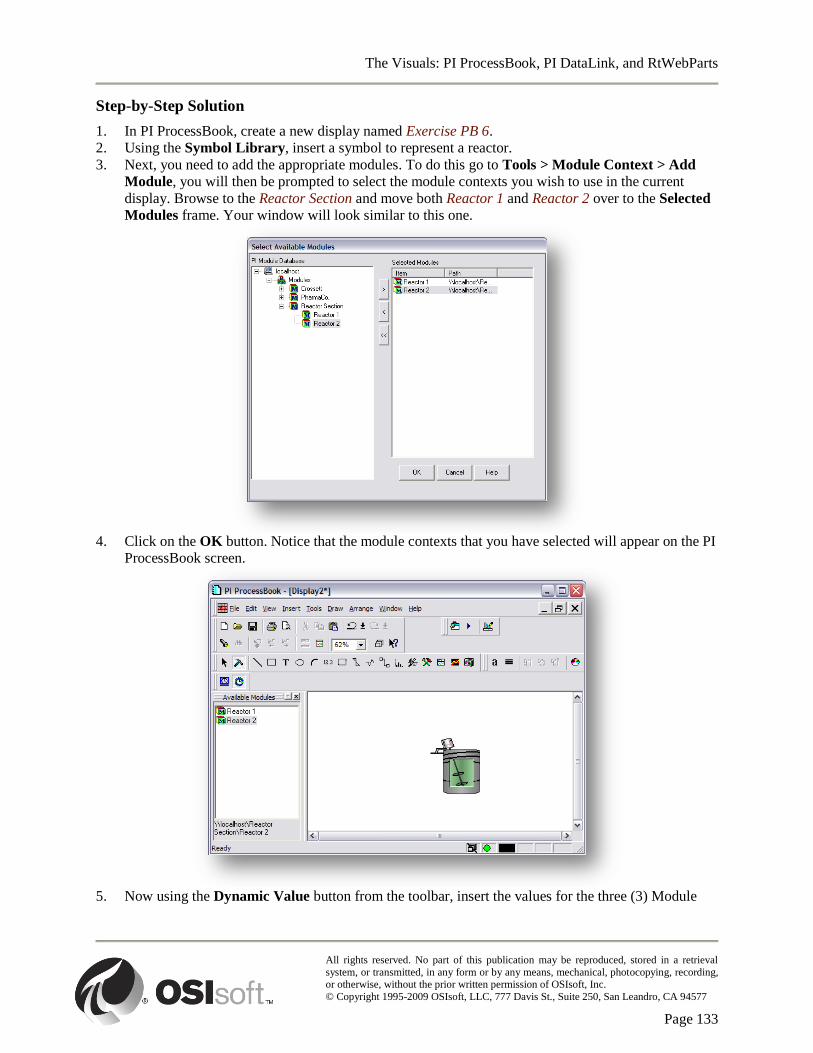
The Visuals: PI ProcessBook, PI DataLink, and RtWebParts
All rights reserved. No part of this publication may be reproduced, stored in a retrieval
system, or transmitted, in any form or by any means, mechanical, photocopying, recording, or otherwise, without the prior written permission of OSIsoft, Inc.
© Copyright 1995-2009 OSIsoft, LLC, 777 Davis St., Suite 250, San Leandro, CA 94577
Page 133
Step-by-Step Solution
1. In PI ProcessBook, create a new display named Exercise PB 6.
2. Using the Symbol Library, insert a symbol to represent a reactor.
3. Next, you need to add the appropriate modules. To do this go to Tools > Module Context > Add
Module, you will then be prompted to select the module contexts you wish to use in the current
display. Browse to the Reactor Section and move both Reactor 1 and Reactor 2 over to the Selected
Modules frame. Your window will look similar to this one.
4. Click on the OK button. Notice that the module contexts that you have selected will appear on the PI
ProcessBook screen.
5. Now using the Dynamic Value button from the toolbar, insert the values for the three (3) Module
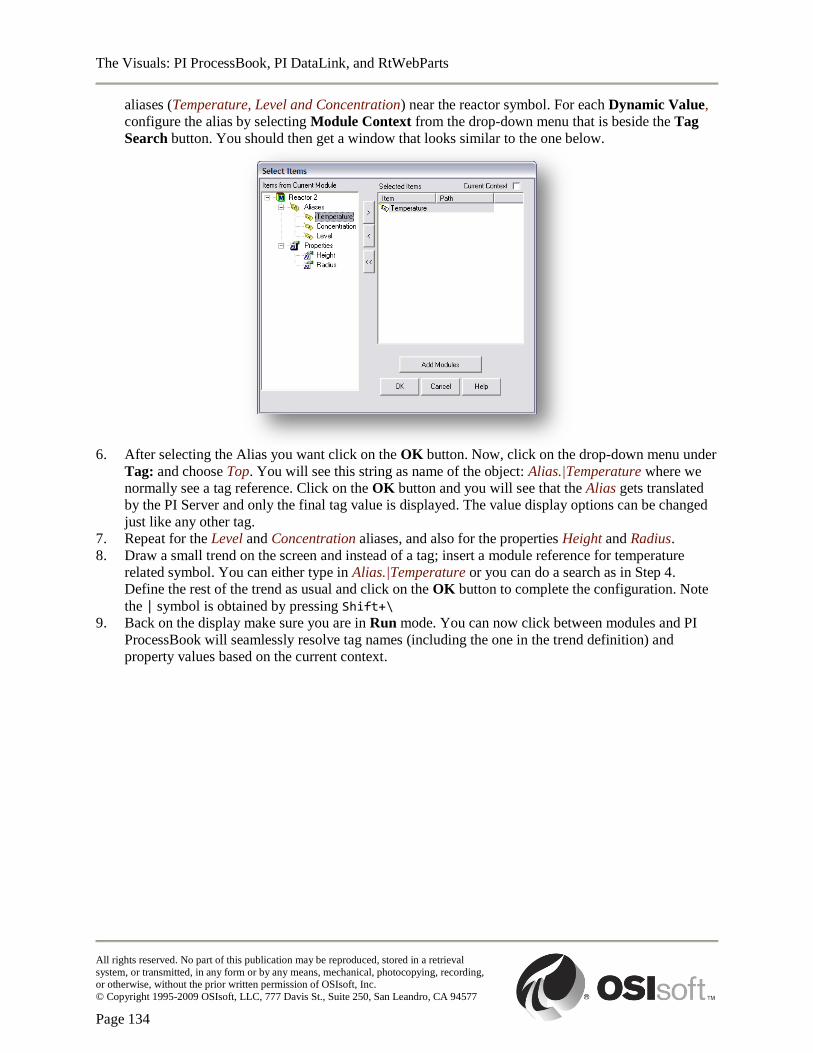
The Visuals: PI ProcessBook, PI DataLink, and RtWebParts
All rights reserved. No part of this publication may be reproduced, stored in a retrieval
system, or transmitted, in any form or by any means, mechanical, photocopying, recording, or otherwise, without the prior written permission of OSIsoft, Inc.
© Copyright 1995-2009 OSIsoft, LLC, 777 Davis St., Suite 250, San Leandro, CA 94577
Page 134
aliases (Temperature, Level and Concentration) near the reactor symbol. For each Dynamic Value,
configure the alias by selecting Module Context from the drop-down menu that is beside the Tag
Search button. You should then get a window that looks similar to the one below.
6. After selecting the Alias you want click on the OK button. Now, click on the drop-down menu under
Tag: and choose Top. You will see this string as name of the object: Alias.|Temperature where we
normally see a tag reference. Click on the OK button and you will see that the Alias gets translated
by the PI Server and only the final tag value is displayed. The value display options can be changed
just like any other tag.
7. Repeat for the Level and Concentration aliases, and also for the properties Height and Radius.
8. Draw a small trend on the screen and instead of a tag; insert a module reference for temperature
related symbol. You can either type in Alias.|Temperature or you can do a search as in Step 4.
Define the rest of the trend as usual and click on the OK button to complete the configuration. Note
the | symbol is obtained by pressing Shift+\
9. Back on the display make sure you are in Run mode. You can now click between modules and PI
ProcessBook will seamlessly resolve tag names (including the one in the trend definition) and
property values based on the current context.
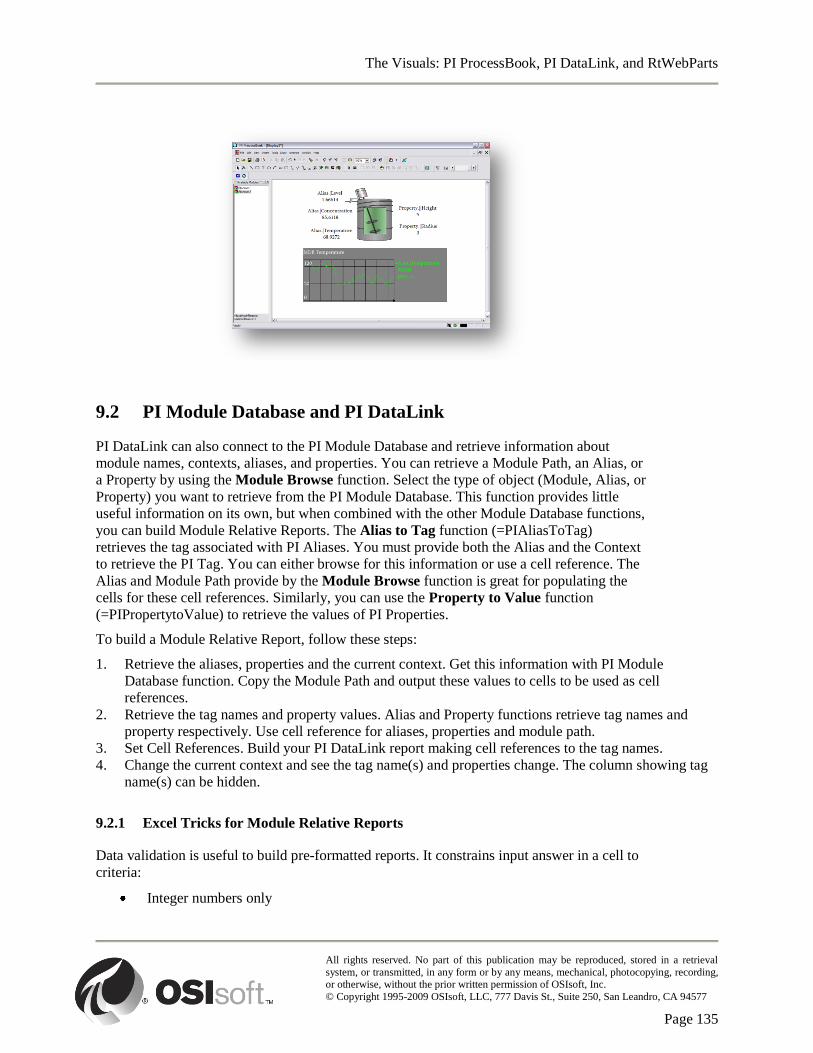
The Visuals: PI ProcessBook, PI DataLink, and RtWebParts
All rights reserved. No part of this publication may be reproduced, stored in a retrieval
system, or transmitted, in any form or by any means, mechanical, photocopying, recording, or otherwise, without the prior written permission of OSIsoft, Inc.
© Copyright 1995-2009 OSIsoft, LLC, 777 Davis St., Suite 250, San Leandro, CA 94577
Page 135
9.2 PI Module Database and PI DataLink
PI DataLink can also connect to the PI Module Database and retrieve information about
module names, contexts, aliases, and properties. You can retrieve a Module Path, an Alias, or
a Property by using the Module Browse function. Select the type of object (Module, Alias, or
Property) you want to retrieve from the PI Module Database. This function provides little
useful information on its own, but when combined with the other Module Database functions,
you can build Module Relative Reports. The Alias to Tag function (=PIAliasToTag)
retrieves the tag associated with PI Aliases. You must provide both the Alias and the Context
to retrieve the PI Tag. You can either browse for this information or use a cell reference. The
Alias and Module Path provide by the Module Browse function is great for populating the
cells for these cell references. Similarly, you can use the Property to Value function
(=PIPropertytoValue) to retrieve the values of PI Properties.
To build a Module Relative Report, follow these steps:
1. Retrieve the aliases, properties and the current context. Get this information with PI Module
Database function. Copy the Module Path and output these values to cells to be used as cell
references.
2. Retrieve the tag names and property values. Alias and Property functions retrieve tag names and
property respectively. Use cell reference for aliases, properties and module path.
3. Set Cell References. Build your PI DataLink report making cell references to the tag names.
4. Change the current context and see the tag name(s) and properties change. The column showing tag
name(s) can be hidden.
9.2.1 Excel Tricks for Module Relative Reports
Data validation is useful to build pre-formatted reports. It constrains input answer in a cell to
criteria:
Integer numbers only
The Visuals: PI ProcessBook, PI DataLink, and RtWebParts
All rights reserved. No part of this publication may be reproduced, stored in a retrieval
system, or transmitted, in any form or by any means, mechanical, photocopying, recording, or otherwise, without the prior written permission of OSIsoft, Inc.
© Copyright 1995-2009 OSIsoft, LLC, 777 Davis St., Suite 250, San Leandro, CA 94577
Page 136
Decimal numbers only
Date and/or time
Items chosen from a list
In the Excel 2007 Ribbon go to Data > Data Tools > Data Validation to launch the Data
Validation dialog box. Cannot combine text and references to cells in PI DataLink dialog
boxes
You cannot nest a cell reference inside an expression inside a PI DataLink formula. The PI
DataLink program cannot follow a cell reference in an expression. So you must use the
concatenate function in order to build the expression, and then have PI DataLink read the
expression. It is possible to join up to 30 text items using the Concatenate Excel function. The
text items can be text strings, numbers, or single-cell references. The & operator can be used
instead of the Concatenate function to join text items.
Items can be:
Text
Numbers
References to cell
We recommend using the Data Validation and Concatenate functions to build Module Paths
(contexts). This allows you to easily change the context. If you have built your spreadsheet
using cell references, all of your Aliases and Properties will update automatically. This has
the added advantage that all of the “back-end” mechanics of the call can be hidden in the
spreadsheet, giving the end user a clean, visually appealing experience.
9.2.2 Exercise – Module Relative PI DataLink Reports
The following exercise is intended to reinforce key information presented in this
chapter or section. The answer can be found at the end of the exercise.
Objectives
Understand the structure of the PI Module Database, and how to dynamically access
properties and aliases;
Reduce the time required to produce and execute PI DataLink reports by basing them
upon module contexts.
Prerequisites
The file MDBStruct.xlsx or MDBStruct.xls, which contains the necessary MDB
structure, must have been exported prior to start this exercise.
Problem Description

The Visuals: PI ProcessBook, PI DataLink, and RtWebParts
All rights reserved. No part of this publication may be reproduced, stored in a retrieval
system, or transmitted, in any form or by any means, mechanical, photocopying, recording, or otherwise, without the prior written permission of OSIsoft, Inc.
© Copyright 1995-2009 OSIsoft, LLC, 777 Davis St., Suite 250, San Leandro, CA 94577
Page 137
You want to create a PI Datalink report to monitor in real time the temperature, level and concentration of
two similar reactors. You want this report to be based on your PI Module Database so that you only have
to create one report to view data for both reactors.
Approach
A PI Module Database (MDB) structure has already been defined by your System Administrator. First
you will need to become familiar with its structure. You can browse through it from the PI > Module
Database… We will use the Reactor Section Module. We have provided the file named
Exercise_DL8_Template.xls for you to use as a template if you wish. Add the three (3) aliases to the
spreadsheet. You can either type in the names Temperature, Level and Concentration or you can perform
a search using the PI DataLink Module Database… function. Then add the labels for properties Height
and Radius under the dimensions heading. Somewhere above the aliases and properties insert the Module
Database Path into one of the cells. Again you can perform a search using the PI DataLink Module
Database… function. In PI DataLink, you cannot resolve a Current Value from an alias so you must
resolve the tag names first. Use the PI DataLink Alias… function in the cells next to the alias names to
resolve. Use cell references for the alias names and module path. To the right of the tag names you can
resolve for Current Value. By using the cell references correctly, changing the Module Path cell to the
other reactor should update the tag names and also the current values. Resolve the properties as you did
the aliases using the PI DataLink Properties… function. Again, you can test by changing the module
path cell to the other reactor. The property values should update. Finally, MS Excel will perform a
calculation to determine the mass of a component in the chosen reactor, based on the real-time data and
the reactor‟s physical properties. This calculation will determine our valuable stuff in the reactor. If we
assume that our reactor is cylindrical, the formula for its total volume is expressed by
Π x r2 x h
Where r is the radius and h is the height. Since the level is a percentage of the total, we
multiply the formula by the level (L) to get the volume of liquid, resulting in:
Π x r2 x h x L
Since our radius and height are both in meters, our volume will be in m3. The concentration
(C) is in kg/1000L, and there are 1000L in 1 m3 (if we assume the density of water). To find
the total kg of valuable stuff the formula is:
π x r2 x h x L x C
In MS Excel, the way we will represent this is with the following formula:
=PI()*J8^2*J7*F8*F7/100
The great feature of MDB is that you only need to input once what properties and aliases you are looking
for. You will hide the properties and the tag names, since all you want are the final numbers.

The Visuals: PI ProcessBook, PI DataLink, and RtWebParts
All rights reserved. No part of this publication may be reproduced, stored in a retrieval
system, or transmitted, in any form or by any means, mechanical, photocopying, recording, or otherwise, without the prior written permission of OSIsoft, Inc.
© Copyright 1995-2009 OSIsoft, LLC, 777 Davis St., Suite 250, San Leandro, CA 94577
Page 138
Try to do this exercise on your own before proceeding to the step-by-step solution.
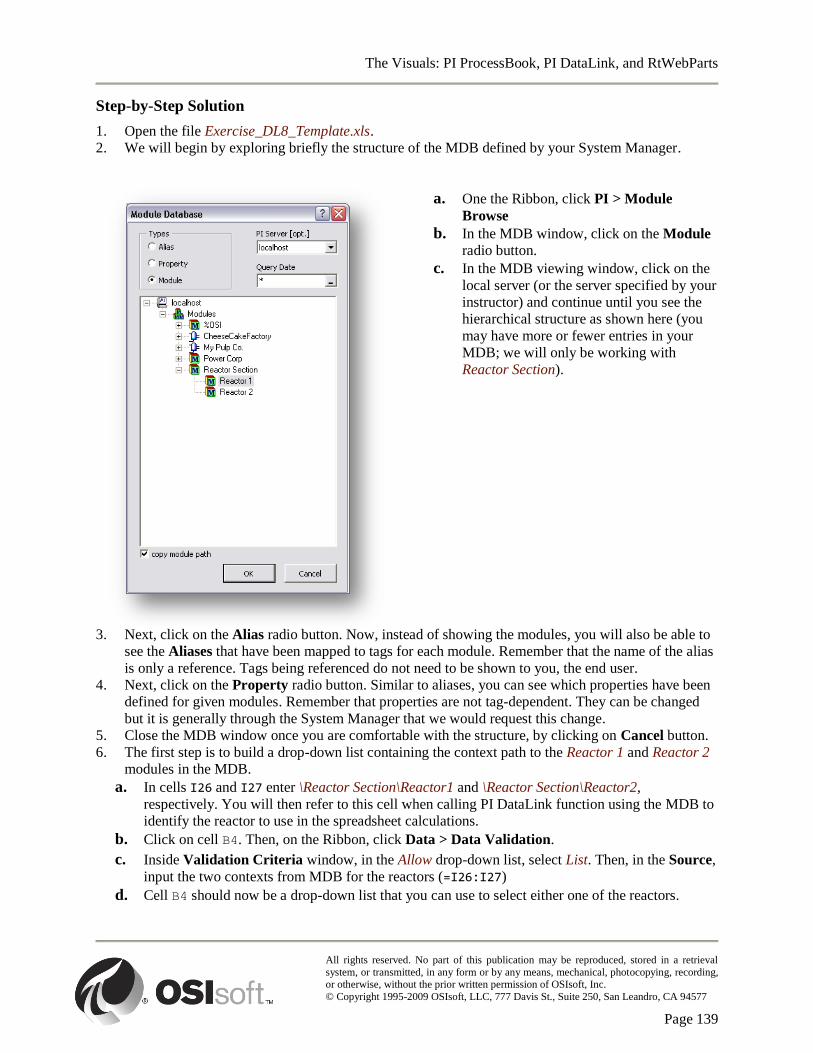
The Visuals: PI ProcessBook, PI DataLink, and RtWebParts
All rights reserved. No part of this publication may be reproduced, stored in a retrieval
system, or transmitted, in any form or by any means, mechanical, photocopying, recording, or otherwise, without the prior written permission of OSIsoft, Inc.
© Copyright 1995-2009 OSIsoft, LLC, 777 Davis St., Suite 250, San Leandro, CA 94577
Page 139
Step-by-Step Solution
1. Open the file Exercise_DL8_Template.xls.
2. We will begin by exploring briefly the structure of the MDB defined by your System Manager.
a. One the Ribbon, click PI > Module
Browse
b. In the MDB window, click on the Module
radio button.
c. In the MDB viewing window, click on the
local server (or the server specified by your
instructor) and continue until you see the
hierarchical structure as shown here (you
may have more or fewer entries in your
MDB; we will only be working with
Reactor Section).
3. Next, click on the Alias radio button. Now, instead of showing the modules, you will also be able to
see the Aliases that have been mapped to tags for each module. Remember that the name of the alias
is only a reference. Tags being referenced do not need to be shown to you, the end user.
4. Next, click on the Property radio button. Similar to aliases, you can see which properties have been
defined for given modules. Remember that properties are not tag-dependent. They can be changed
but it is generally through the System Manager that we would request this change.
5. Close the MDB window once you are comfortable with the structure, by clicking on Cancel button.
6. The first step is to build a drop-down list containing the context path to the Reactor 1 and Reactor 2
modules in the MDB.
a. In cells I26 and I27 enter \Reactor Section\Reactor1 and \Reactor Section\Reactor2,
respectively. You will then refer to this cell when calling PI DataLink function using the MDB to
identify the reactor to use in the spreadsheet calculations.
b. Click on cell B4. Then, on the Ribbon, click Data > Data Validation.
c. Inside Validation Criteria window, in the Allow drop-down list, select List. Then, in the Source,
input the two contexts from MDB for the reactors (=I26:I27)
d. Cell B4 should now be a drop-down list that you can use to select either one of the reactors.
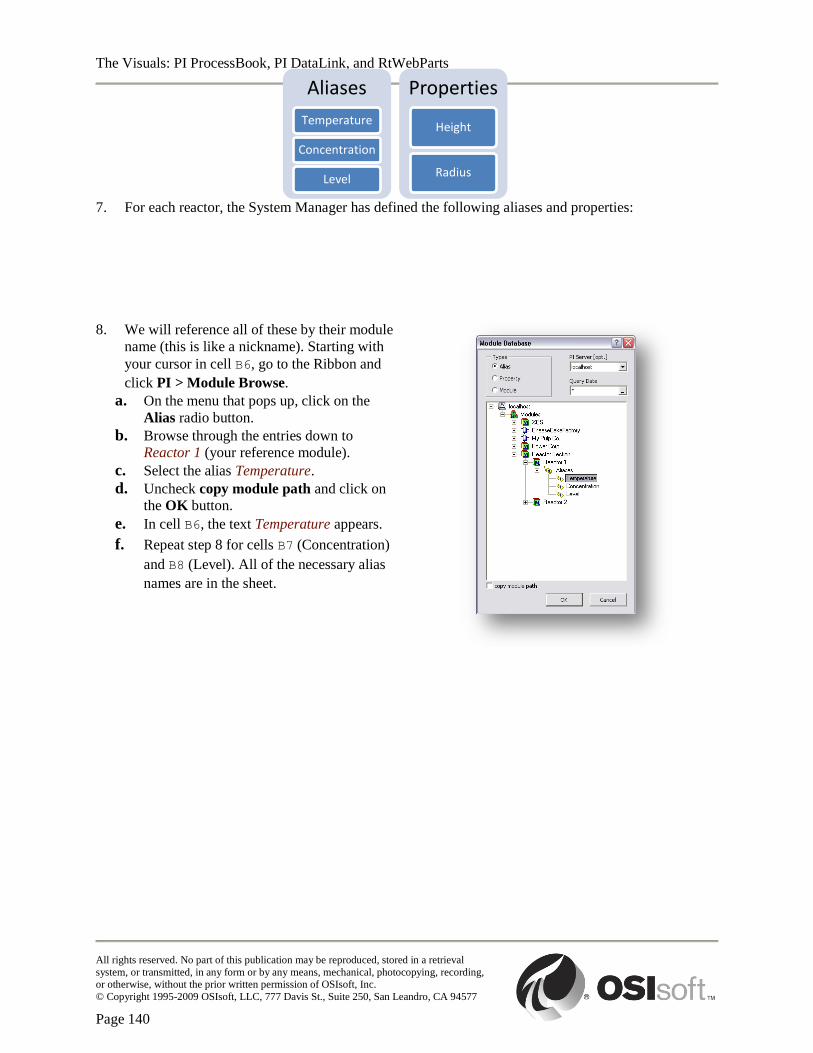
The Visuals: PI ProcessBook, PI DataLink, and RtWebParts
All rights reserved. No part of this publication may be reproduced, stored in a retrieval
system, or transmitted, in any form or by any means, mechanical, photocopying, recording, or otherwise, without the prior written permission of OSIsoft, Inc.
© Copyright 1995-2009 OSIsoft, LLC, 777 Davis St., Suite 250, San Leandro, CA 94577
Page 140
7. For each reactor, the System Manager has defined the following aliases and properties:
8. We will reference all of these by their module
name (this is like a nickname). Starting with
your cursor in cell B6, go to the Ribbon and
click PI > Module Browse.
a. On the menu that pops up, click on the
Alias radio button.
b. Browse through the entries down to
Reactor 1 (your reference module).
c. Select the alias Temperature.
d. Uncheck copy module path and click on
the OK button.
e. In cell B6, the text Temperature appears.
f. Repeat step 8 for cells B7 (Concentration)
and B8 (Level). All of the necessary alias
names are in the sheet.
Aliases
Temperature
Concentration
Level
Properties
Height
Radius
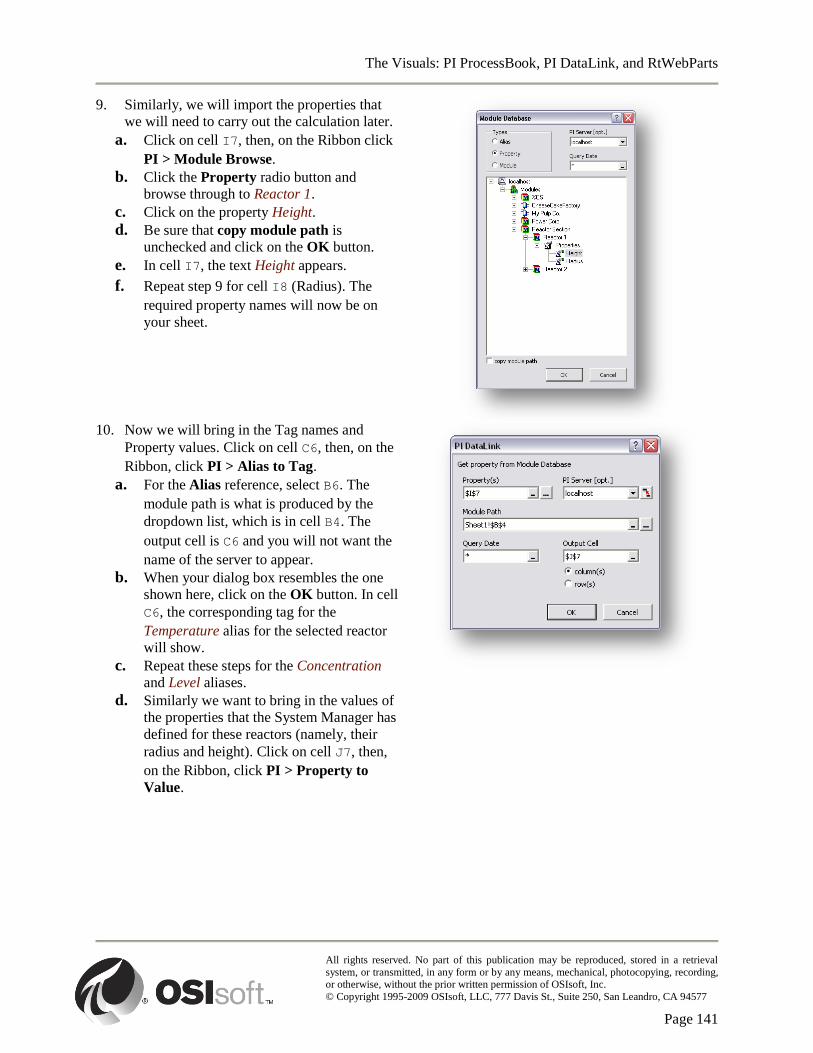
The Visuals: PI ProcessBook, PI DataLink, and RtWebParts
All rights reserved. No part of this publication may be reproduced, stored in a retrieval
system, or transmitted, in any form or by any means, mechanical, photocopying, recording, or otherwise, without the prior written permission of OSIsoft, Inc.
© Copyright 1995-2009 OSIsoft, LLC, 777 Davis St., Suite 250, San Leandro, CA 94577
Page 141
9. Similarly, we will import the properties that
we will need to carry out the calculation later.
a. Click on cell I7, then, on the Ribbon click
PI > Module Browse.
b. Click the Property radio button and
browse through to Reactor 1.
c. Click on the property Height.
d. Be sure that copy module path is
unchecked and click on the OK button.
e. In cell I7, the text Height appears.
f. Repeat step 9 for cell I8 (Radius). The
required property names will now be on
your sheet.
10. Now we will bring in the Tag names and
Property values. Click on cell C6, then, on the
Ribbon, click PI > Alias to Tag.
a. For the Alias reference, select B6. The
module path is what is produced by the
dropdown list, which is in cell B4. The
output cell is C6 and you will not want the
name of the server to appear.
b. When your dialog box resembles the one
shown here, click on the OK button. In cell
C6, the corresponding tag for the
Temperature alias for the selected reactor
will show.
c. Repeat these steps for the Concentration
and Level aliases.
d. Similarly we want to bring in the values of
the properties that the System Manager has
defined for these reactors (namely, their
radius and height). Click on cell J7, then,
on the Ribbon, click PI > Property to
Value.

The Visuals: PI ProcessBook, PI DataLink, and RtWebParts
All rights reserved. No part of this publication may be reproduced, stored in a retrieval
system, or transmitted, in any form or by any means, mechanical, photocopying, recording, or otherwise, without the prior written permission of OSIsoft, Inc.
© Copyright 1995-2009 OSIsoft, LLC, 777 Davis St., Suite 250, San Leandro, CA 94577
Page 142
e. To retrieve the correct property/properties,
make a reference to cell I7, a.k.a. the name
of the property (Height). The module path
will once again be B4 (output from the
dropdown list) and the output cell will be
J7.
f. When your dialog box looks like the one
here, click on the OK button.
g. Repeat these steps for the Radius property.
Now the values of these properties appear
on the sheet and are ready to use for
calculation.
11. We simply need to use a Current Value for the tag names that PI DataLink has translated from
MDB. As we did before, select cell F6 and, on the Ribbon, click PI > Current Value. In the Tag
Name(s) field highlight cells C6:C8. Click the OK button.
12. With the data we have brought in from the PI Server using the MDB, we are going to carry out a
calculation in Excel. We want to find out how much of our valuable stuff is in the reactor. If we
assume that our reactor is cylindrical, the formula for its total volume is expressed by
π x r2 x h
Where r is the radius and h is the height. Since the level is a percentage of the total, we multiply the
formula by the level (L) to get the volume of liquid, a.k.a.
π x r2 x h x L
Since the radius and height are both in meters, the volume will be in m3. The concentration (C) is in
kg/1000L, and there are 1000L in 1 m3 (if we assume the density of water). To find the total kg of
valuable stuff the formula to use is:
π x r2 x h x L x C
In MS Excel, the way we will represent this is with the following formula, entered in cell F10:
=PI()*J8^2*J7*F8*F7/100
For the reactor selected, the desired product mass will be shown in cell F10.
13. We can hide a lot of the sheet now. Try selecting the entire column C by right-clicking on the mouse
and selecting Hide from the menu. Repeat for columns D, E, I, J, and K.
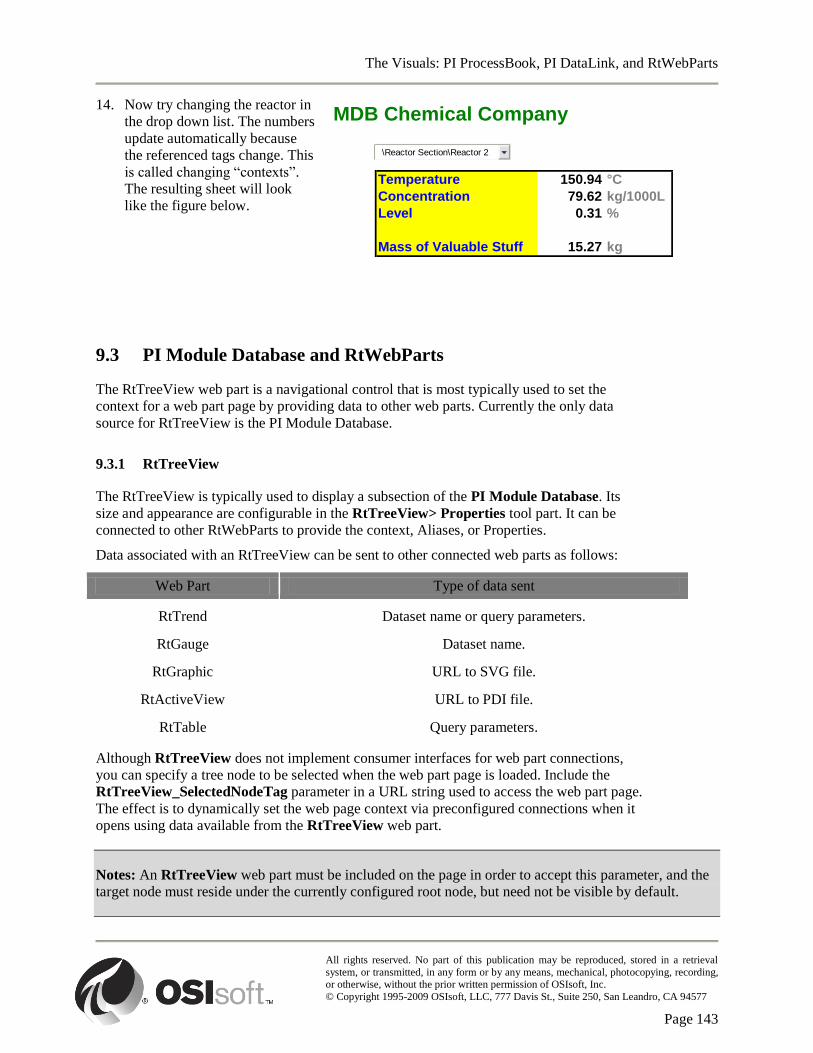
The Visuals: PI ProcessBook, PI DataLink, and RtWebParts
All rights reserved. No part of this publication may be reproduced, stored in a retrieval
system, or transmitted, in any form or by any means, mechanical, photocopying, recording, or otherwise, without the prior written permission of OSIsoft, Inc.
© Copyright 1995-2009 OSIsoft, LLC, 777 Davis St., Suite 250, San Leandro, CA 94577
Page 143
14. Now try changing the reactor in
the drop down list. The numbers
update automatically because
the referenced tags change. This
is called changing “contexts”.
The resulting sheet will look
like the figure below.
9.3 PI Module Database and RtWebParts
The RtTreeView web part is a navigational control that is most typically used to set the
context for a web part page by providing data to other web parts. Currently the only data
source for RtTreeView is the PI Module Database.
9.3.1 RtTreeView
The RtTreeView is typically used to display a subsection of the PI Module Database. Its
size and appearance are configurable in the RtTreeView> Properties tool part. It can be
connected to other RtWebParts to provide the context, Aliases, or Properties.
Data associated with an RtTreeView can be sent to other connected web parts as follows:
Web Part Type of data sent
RtTrend Dataset name or query parameters.
RtGauge Dataset name.
RtGraphic URL to SVG file.
RtActiveView URL to PDI file.
RtTable Query parameters.
Although RtTreeView does not implement consumer interfaces for web part connections,
you can specify a tree node to be selected when the web part page is loaded. Include the
RtTreeView_SelectedNodeTag parameter in a URL string used to access the web part page.
The effect is to dynamically set the web page context via preconfigured connections when it
opens using data available from the RtTreeView web part.
Notes: An RtTreeView web part must be included on the page in order to accept this parameter, and the
target node must reside under the currently configured root node, but need not be visible by default.
MDB Chemical Company
\Reactor Section\Reactor 2
Temperature 150.94 °C
Concentration 79.62 kg/1000L
Level 0.31 %
Mass of Valuable Stuff 15.27 kg
\Reactor Section\Reactor 2
The Visuals: PI ProcessBook, PI DataLink, and RtWebParts
All rights reserved. No part of this publication may be reproduced, stored in a retrieval
system, or transmitted, in any form or by any means, mechanical, photocopying, recording, or otherwise, without the prior written permission of OSIsoft, Inc.
© Copyright 1995-2009 OSIsoft, LLC, 777 Davis St., Suite 250, San Leandro, CA 94577
Page 144
The RtTreeView_SelectedNodeTag parameter value specifies an absolute path to a PI
Module Database node that is case-sensitive. Special characters can be encoded by
converting space ( ) to %20 or percent character (%) to %25.
For example, the URL can be written in both ways for identical result:
http://localhost/Shared Documents/RtTreeView.aspx?RtTreeView_SelectedNodeTag=\\qaPI
WebParts\%OSI
or
http://localhost/Shared%20Documents/RtTreeView.aspx?RtTreeView_SelectedNodeTag=\\q
aPI WebParts\%25OSI
Data associated with a node can be sent to other connected web parts. Data assigned to the
node is sent to other, connected web parts on the page using web part communication. The
name of the module, as well as its path in the PI Module Database, is always passed via web
part communication. In addition, any PI Properties matching those found in the module
indicated in the Template for PI Properties to Use field are passed. If the Include Aliases
check box is selected, any PI Aliases associated with the clicked node are also passed.
Add properties to the module that will be used to send the data. To be able to send Properties,
a path to a typical Properties Definition must be entered. To be able to send Aliases, the
Include Aliases option must be selected. When selected, this builds a list of resolved PI
Aliases found when a module is read from the PI Module Database. The list of semicolon-
delimited tags sent may differ for each module selected in the tree. This parameter is not
affected by the PI Aliases Template Node setting.
The number of node levels to be read for the initial page load from the PI Module Database,
relative to the configured root node. The default value is 2. If the Maximum Number of
Levels to Display is greater than this value, additional nodes are loaded when the tree view is
expanded in the web part. The number of node levels shown expanded for the initial page
load relative to the configured root node. The default value is 2. Additional levels are
collapsed, and can be expanded once the page has loaded, up to the Maximum Number of
Levels to Display. The maximum number of node levels to display at any time in the web
part, relative to the configured root node. Modules beyond the maximum level cannot be seen
in the web part, even if the visible modules are fully expanded. The default value is 8.
An absolute or site-relative URL location for stored image files used as tree view icons. A
module can specify a fully qualified URL to an image file as a PI Property, or a simple file
name, in which case the URL is used to resolve the icon location. The default value is read
from the image Directory setting in the PIPC\RtWebParts\web.config file on the web server.
9.3.2 Web Part Connections
Using simple menus and dialog boxes, you can connect Web Parts together by passing data
between them and synchronizing their behavior. For example, if you have a List View Web
Part of Contacts with a column that has a hyperlink to a picture of the contact and the Image
Web Part on a Web Part Page, you can connect the two Web Parts together. Each time you
select a row in the List View Web Part of Contacts, you can see the picture displayed in the
Image Web Part.
The Visuals: PI ProcessBook, PI DataLink, and RtWebParts
All rights reserved. No part of this publication may be reproduced, stored in a retrieval
system, or transmitted, in any form or by any means, mechanical, photocopying, recording, or otherwise, without the prior written permission of OSIsoft, Inc.
© Copyright 1995-2009 OSIsoft, LLC, 777 Davis St., Suite 250, San Leandro, CA 94577
Page 145
All RtWebParts, except the RtTreeView, are designed to use the client-side event-based
mechanism for receiving changes. These web parts and any others that support SharePoint
web part connection interface can be specifically configured to use the Start Time and End
Time parameters from the RtTimeRange web part. This web part provides data to other,
connected web parts, but does not accept values from other web parts.
To establish a connection between Web Parts, you must do the following:
1. On the Web Part Page title bar, click Site Actions> Edit Page. The Connections selection in the
Web Part menu only appears while in Edit mode.
2. Decide which two web parts you want to connect. You can create or modify the same connection
starting from either web part.
3. From either the Consumer (the Web Part receiving the data) or Producer (the one providing the data)
Web Part, click the Web Part menu, and then move the cursor over Connections.
4. From the connection type submenu, select the type of connection you want to create or modify, such
as Provide Row To or Filter Data With.
5. From the available Web Parts submenu, select the web part for which you want to create or modify
a connection.
Some web parts require editing in the configuration panel to complete the connection. In the
configuration pane for RtWebParts, click on the Connection button (lightning bolt) to
complete the connection.
9.3.3 Exercise – Making Connections
The following exercise is intended to reinforce key information presented in this
chapter or section. The answer can be found at the end of the exercise.
Objectives
Familiarize yourself with connecting web parts.
Problem Description
You understand that you can pass data from one web part to another. You want to create a web page
where you can see a list of tags, but drill down to view the recent history for any one of them. You decide
to use the RtValues web part to list some tags and want to pass selected tag names to the RtTimeSeries
web part.
Approach
Create a new page in your Team Site called Exercise_R8. Set the page in Edit Mode. Add one RtValues
and one RtTimeSeries web parts to any zone. Modify the settings of the RtValues web part by selecting
Modify Shared Web Part. Perform a tag search on tags that begin with CD and add them to the data
area. In the selected columns choose: DataSet, Time, Value, and Current State. Add the values for
Interval Maximum and Interval Minimum and click on the OK button.
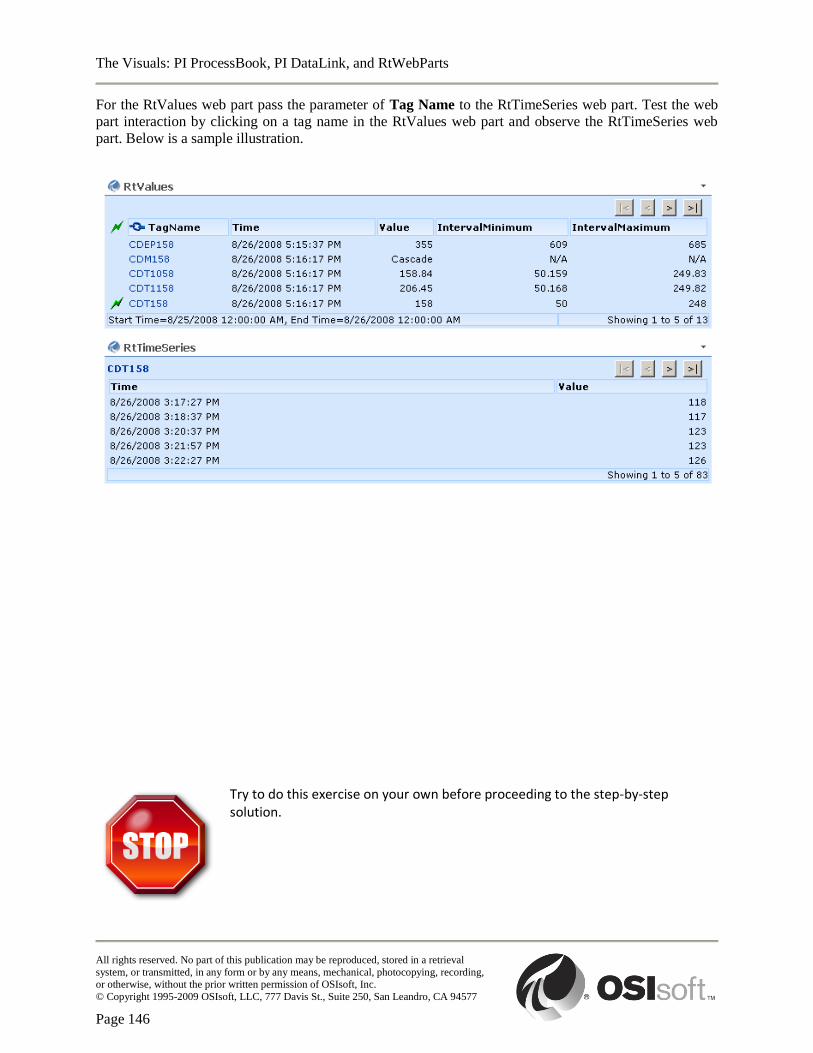
The Visuals: PI ProcessBook, PI DataLink, and RtWebParts
All rights reserved. No part of this publication may be reproduced, stored in a retrieval
system, or transmitted, in any form or by any means, mechanical, photocopying, recording, or otherwise, without the prior written permission of OSIsoft, Inc.
© Copyright 1995-2009 OSIsoft, LLC, 777 Davis St., Suite 250, San Leandro, CA 94577
Page 146
For the RtValues web part pass the parameter of Tag Name to the RtTimeSeries web part. Test the web
part interaction by clicking on a tag name in the RtValues web part and observe the RtTimeSeries web
part. Below is a sample illustration.
Try to do this exercise on your own before proceeding to the step-by-step solution.
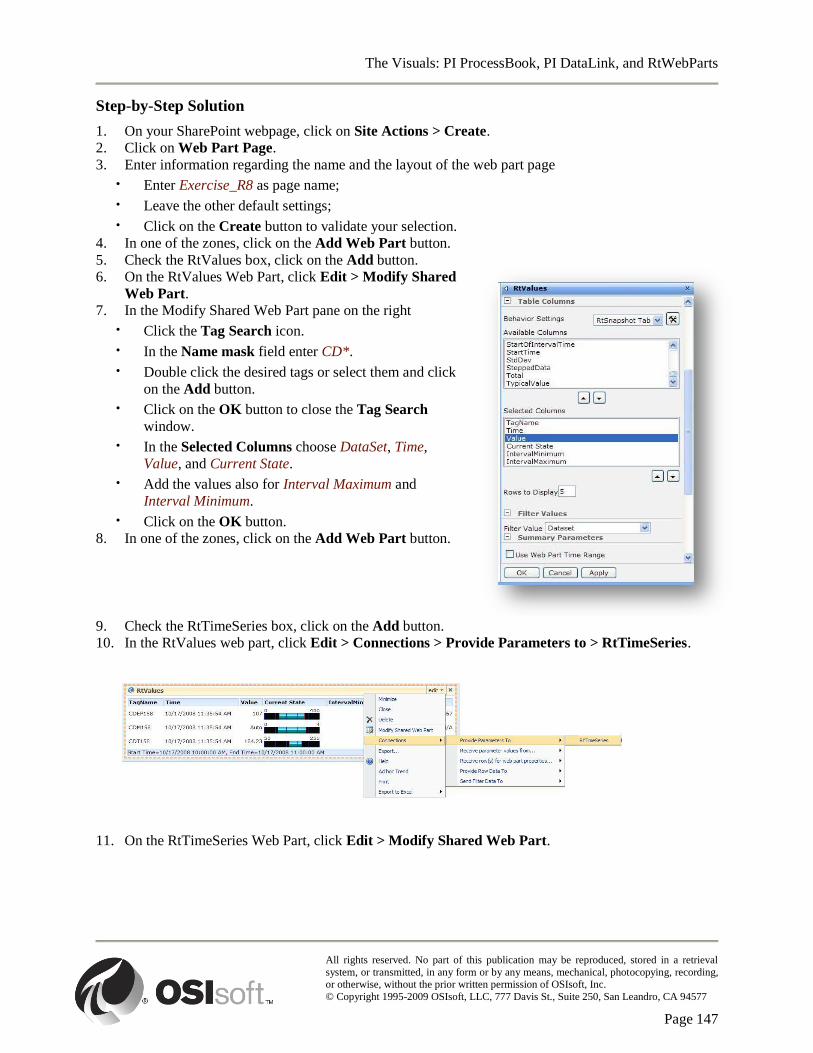
The Visuals: PI ProcessBook, PI DataLink, and RtWebParts
All rights reserved. No part of this publication may be reproduced, stored in a retrieval
system, or transmitted, in any form or by any means, mechanical, photocopying, recording, or otherwise, without the prior written permission of OSIsoft, Inc.
© Copyright 1995-2009 OSIsoft, LLC, 777 Davis St., Suite 250, San Leandro, CA 94577
Page 147
Step-by-Step Solution
1. On your SharePoint webpage, click on Site Actions > Create.
2. Click on Web Part Page.
3. Enter information regarding the name and the layout of the web part page
· Enter Exercise_R8 as page name;
· Leave the other default settings;
· Click on the Create button to validate your selection.
4. In one of the zones, click on the Add Web Part button.
5. Check the RtValues box, click on the Add button.
6. On the RtValues Web Part, click Edit > Modify Shared
Web Part.
7. In the Modify Shared Web Part pane on the right
· Click the Tag Search icon.
· In the Name mask field enter CD*.
· Double click the desired tags or select them and click
on the Add button.
· Click on the OK button to close the Tag Search
window.
· In the Selected Columns choose DataSet, Time,
Value, and Current State.
· Add the values also for Interval Maximum and
Interval Minimum.
· Click on the OK button.
8. In one of the zones, click on the Add Web Part button.
9. Check the RtTimeSeries box, click on the Add button.
10. In the RtValues web part, click Edit > Connections > Provide Parameters to > RtTimeSeries.
11. On the RtTimeSeries Web Part, click Edit > Modify Shared Web Part.
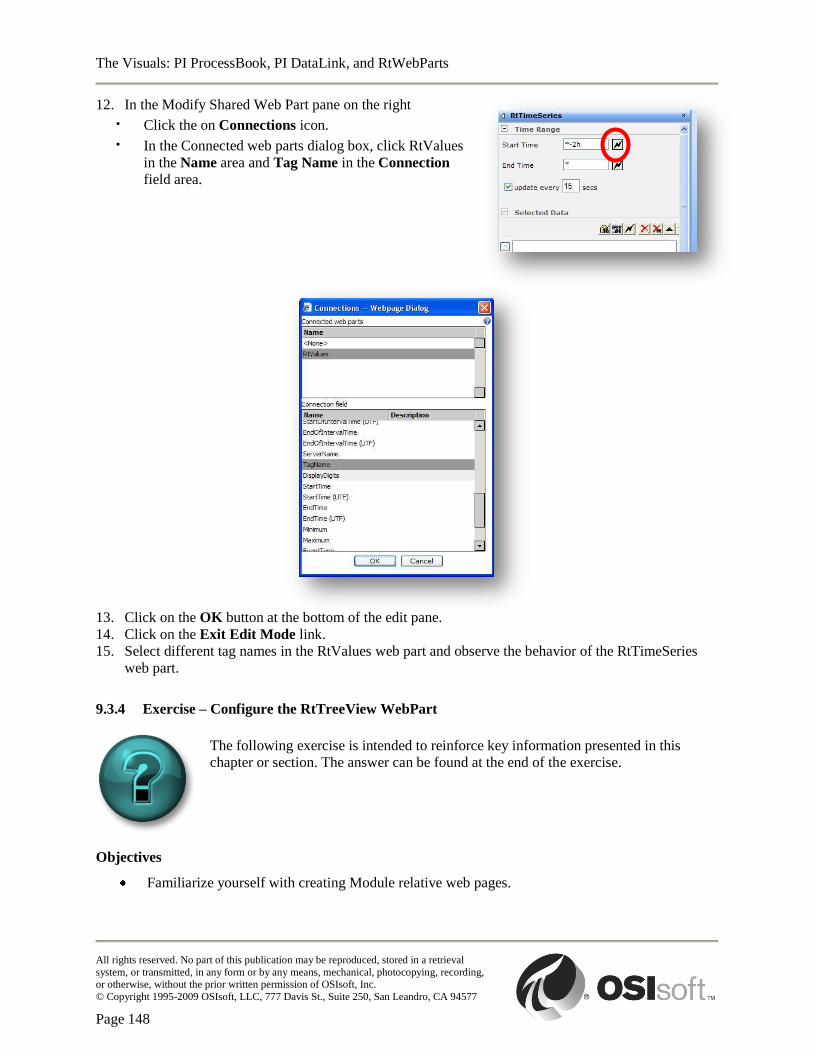
The Visuals: PI ProcessBook, PI DataLink, and RtWebParts
All rights reserved. No part of this publication may be reproduced, stored in a retrieval
system, or transmitted, in any form or by any means, mechanical, photocopying, recording, or otherwise, without the prior written permission of OSIsoft, Inc.
© Copyright 1995-2009 OSIsoft, LLC, 777 Davis St., Suite 250, San Leandro, CA 94577
Page 148
12. In the Modify Shared Web Part pane on the right
· Click the on Connections icon.
· In the Connected web parts dialog box, click RtValues
in the Name area and Tag Name in the Connection
field area.
13. Click on the OK button at the bottom of the edit pane.
14. Click on the Exit Edit Mode link.
15. Select different tag names in the RtValues web part and observe the behavior of the RtTimeSeries
web part.
9.3.4 Exercise – Configure the RtTreeView WebPart
The following exercise is intended to reinforce key information presented in this
chapter or section. The answer can be found at the end of the exercise.
Objectives
Familiarize yourself with creating Module relative web pages.

The Visuals: PI ProcessBook, PI DataLink, and RtWebParts
All rights reserved. No part of this publication may be reproduced, stored in a retrieval
system, or transmitted, in any form or by any means, mechanical, photocopying, recording, or otherwise, without the prior written permission of OSIsoft, Inc.
© Copyright 1995-2009 OSIsoft, LLC, 777 Davis St., Suite 250, San Leandro, CA 94577
Page 149
Problem Description
Your manager wants you to create a page where he can change tags displayed in an RtTrend for the
different units in your plant without going into configuration mode. (If the required module structure is
not built on your PI Server, you will need to build it according to the file MDB_MyPlant.xls)
Approach
Create a new web part page called Exercise_R9. On that page place one RtTreeView web part and one
RtTrend web part. Use whatever zone you wish.
Define the Root Node as being the MyPlant module and the other nodes as being Unit1.
Define the connection to the RtTrend.
Configure the RtTrend to receive the Alias Tag List from the RtTreeView.
Test your links by selecting each unit from the RtTreeView. The data should change.
Try to do this exercise on your own before proceeding to the step-by-step solution.
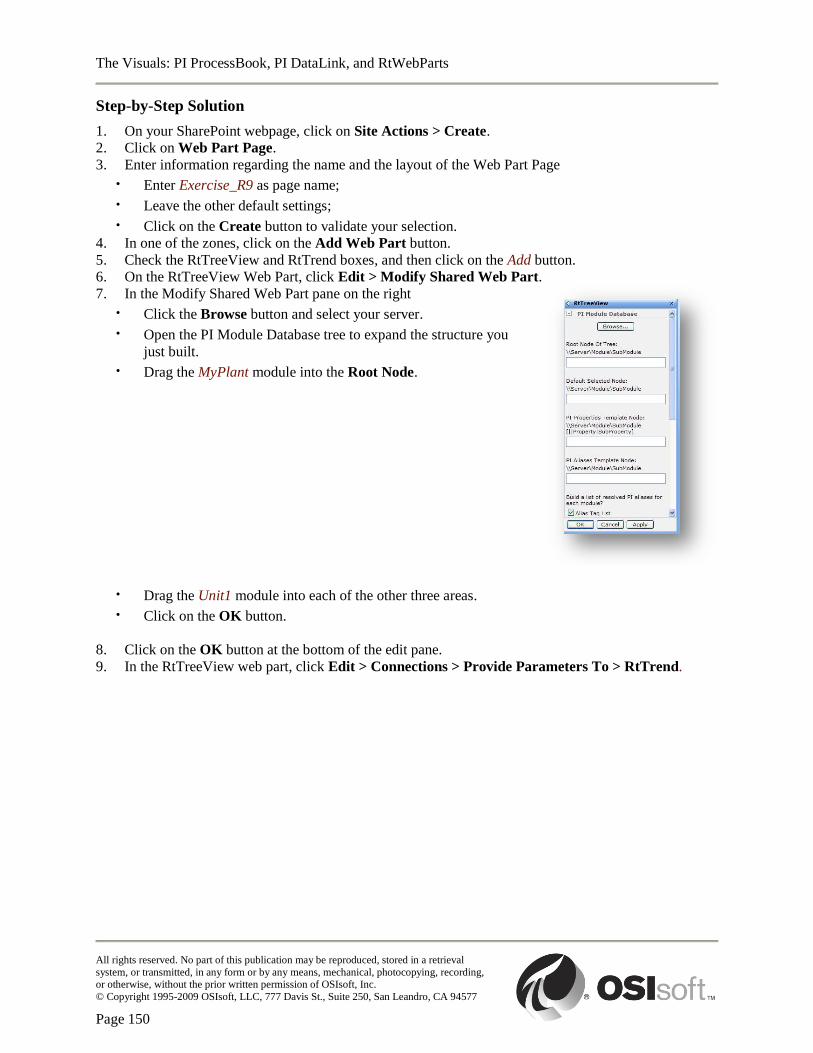
The Visuals: PI ProcessBook, PI DataLink, and RtWebParts
All rights reserved. No part of this publication may be reproduced, stored in a retrieval
system, or transmitted, in any form or by any means, mechanical, photocopying, recording, or otherwise, without the prior written permission of OSIsoft, Inc.
© Copyright 1995-2009 OSIsoft, LLC, 777 Davis St., Suite 250, San Leandro, CA 94577
Page 150
Step-by-Step Solution
1. On your SharePoint webpage, click on Site Actions > Create.
2. Click on Web Part Page.
3. Enter information regarding the name and the layout of the Web Part Page
· Enter Exercise_R9 as page name;
· Leave the other default settings;
· Click on the Create button to validate your selection.
4. In one of the zones, click on the Add Web Part button.
5. Check the RtTreeView and RtTrend boxes, and then click on the Add button.
6. On the RtTreeView Web Part, click Edit > Modify Shared Web Part.
7. In the Modify Shared Web Part pane on the right
· Click the Browse button and select your server.
· Open the PI Module Database tree to expand the structure you
just built.
· Drag the MyPlant module into the Root Node.
· Drag the Unit1 module into each of the other three areas.
· Click on the OK button.
8. Click on the OK button at the bottom of the edit pane.
9. In the RtTreeView web part, click Edit > Connections > Provide Parameters To > RtTrend.
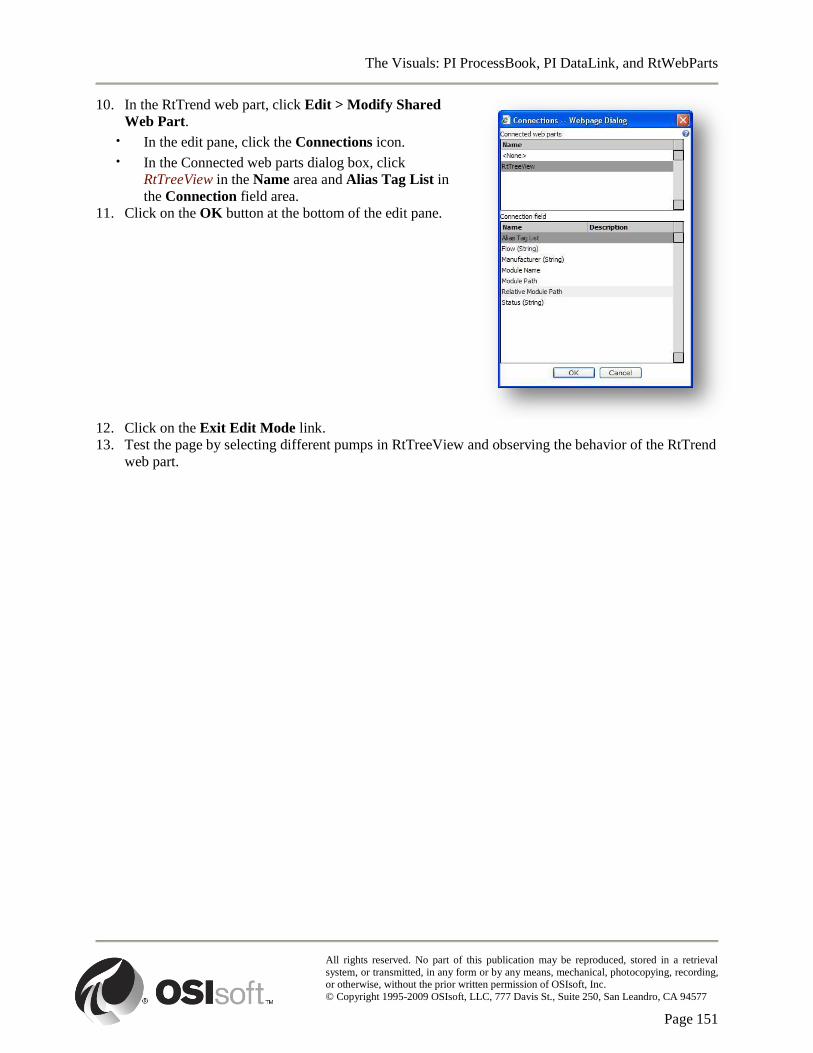
The Visuals: PI ProcessBook, PI DataLink, and RtWebParts
All rights reserved. No part of this publication may be reproduced, stored in a retrieval
system, or transmitted, in any form or by any means, mechanical, photocopying, recording, or otherwise, without the prior written permission of OSIsoft, Inc.
© Copyright 1995-2009 OSIsoft, LLC, 777 Davis St., Suite 250, San Leandro, CA 94577
Page 151
10. In the RtTrend web part, click Edit > Modify Shared
Web Part.
· In the edit pane, click the Connections icon.
· In the Connected web parts dialog box, click
RtTreeView in the Name area and Alias Tag List in
the Connection field area.
11. Click on the OK button at the bottom of the edit pane.
12. Click on the Exit Edit Mode link.
13. Test the page by selecting different pumps in RtTreeView and observing the behavior of the RtTrend
web part.

The Visuals: PI ProcessBook, PI DataLink, and RtWebParts
All rights reserved. No part of this publication may be reproduced, stored in a retrieval
system, or transmitted, in any form or by any means, mechanical, photocopying, recording, or otherwise, without the prior written permission of OSIsoft, Inc.
© Copyright 1995-2009 OSIsoft, LLC, 777 Davis St., Suite 250, San Leandro, CA 94577
Page 152
10. Advanced PI ProcessBook
Data Sets provide a means of displaying some data that was originally derived from raw
process values or other relational data.
Datasets can be:
A PI Calculation (summary or expression)
ODBC Data
AF Data
AF2 Data
We will only be covering the PI Calculation Data Set, as the other topics are more advanced
and covered in other classes offered by OSIsoft.
10.1 PI Calculations in PI ProcessBook
A PI Calculation Data Set uses the PI Performance Equation (PE) syntax. The main
differences between PI Calculations and PI Performance Equations are that PI Performance
Equations are continuously calculated, typically based on Snapshot events, and the results
stored in a PI Tag so that a history is available. PI Calculations, conversely, are calculated on
demand, with the results being displayed, but no history being recorded. They also use only
Archived data, which can differ from Snapshot data due to your Compression settings, and so
may not provide as high a resolution as a PI Performance Equation. PI Calculation Data Sets
results must be used in a dynamic element to be viewed. Data Sets will automatically
calculate the expression itself, statistics on the expression, and statistics on a single point.
When you add a tag name or an expression, PI ProcessBook automatically adds a number of
standard calculations, using the interval and sync times you used in the definition panel.
The Stepped Plot is used for calculations as the default. You normally do not wish to
interpolate between calculations. Tag Name can be typed or searched. Interval is the period
to examine. Sync Time is used to offset from other calculations for timing or load balancing.
When you define a dynamic element you can specify a PI Calculation Data Set instead of the
common use of a tag. Just click the drop-down arrow next to the Tag Search button and you
are presented with the PI Calculation Data Sets dialog box. Select a Data Set and the desired
column (calculation).
1. In PI ProcessBook go to Tools > Data Sets… > New > PI Calculation
2. Define the calculation by using a PE equation.
3. Set Calculation Interval by using a predefined interval or set a custom interval.
4. Set the Column Name.
5. Define the Refresh Interval.
Elements which include data from a data set are updated automatically. Many elements of a
ProcessBook can use the same Data Set simultaneously. Different ProcessBooks can include
the same Dataset. Modification of a data set will only affect elements of the current
ProcessBook (.PIW) and display (.PDI). It is important to verify which elements use a Data
The Visuals: PI ProcessBook, PI DataLink, and RtWebParts
All rights reserved. No part of this publication may be reproduced, stored in a retrieval
system, or transmitted, in any form or by any means, mechanical, photocopying, recording, or otherwise, without the prior written permission of OSIsoft, Inc.
© Copyright 1995-2009 OSIsoft, LLC, 777 Davis St., Suite 250, San Leandro, CA 94577
Page 153
Set prior to modifying it. The Show Use button of the Data Sets screen shows the list of
elements using a given Data Set.
10.1.1 Exercise – PI Calculation Data Sets
The following exercise is intended to reinforce key information presented in this
chapter or section. The answer can be found at the end of the exercise.
Objectives
Learn how to use dynamic elements based on data sets;
Learn how to obtain statistics from PI data archives;
Learn how to define equations with PI points.
Problem Description
You need to see displays not of raw data but showing the results of particular calculations. In one
calculation you need to see a 30 minute running average for CDT158. Also show the interval maximum
and minimum and display all with the live process value.
In a second calculation you want to create a display to illustrate the mixing of two
ingredients: CDT158 and BA:LEVEL.1. Your calculation will solve for the percent of Product
A (CDT158). You will show this graphically in a display. The approaches to solve each
problem with sample illustrations are on the next sections.
Problem Part A Approach
In the ProcessBook file (.piw) you created earlier in Exercise 11, add a new display entry called Exercise
PB7A. Add a new trend on the average value for the last 12 hours. The trend shows stair step trace. Also,
add the live process value to the trend. Label the trend CDT158 Calcs. The figure below illustrates the
resulting trend.
Try to do this exercise on your own before proceeding to the step-by-step solution.
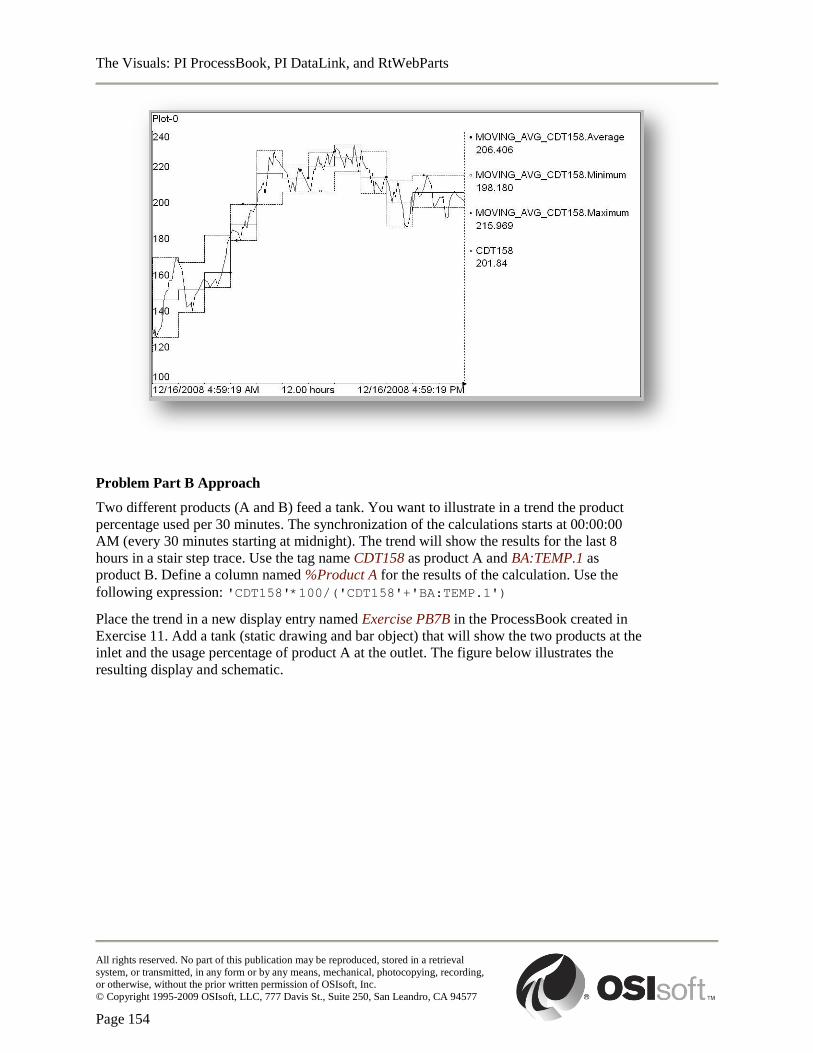
The Visuals: PI ProcessBook, PI DataLink, and RtWebParts
All rights reserved. No part of this publication may be reproduced, stored in a retrieval
system, or transmitted, in any form or by any means, mechanical, photocopying, recording, or otherwise, without the prior written permission of OSIsoft, Inc.
© Copyright 1995-2009 OSIsoft, LLC, 777 Davis St., Suite 250, San Leandro, CA 94577
Page 154
Problem Part B Approach
Two different products (A and B) feed a tank. You want to illustrate in a trend the product
percentage used per 30 minutes. The synchronization of the calculations starts at 00:00:00
AM (every 30 minutes starting at midnight). The trend will show the results for the last 8
hours in a stair step trace. Use the tag name CDT158 as product A and BA:TEMP.1 as
product B. Define a column named %Product A for the results of the calculation. Use the
following expression: 'CDT158'*100/('CDT158'+'BA:TEMP.1')
Place the trend in a new display entry named Exercise PB7B in the ProcessBook created in
Exercise 11. Add a tank (static drawing and bar object) that will show the two products at the
inlet and the usage percentage of product A at the outlet. The figure below illustrates the
resulting display and schematic.
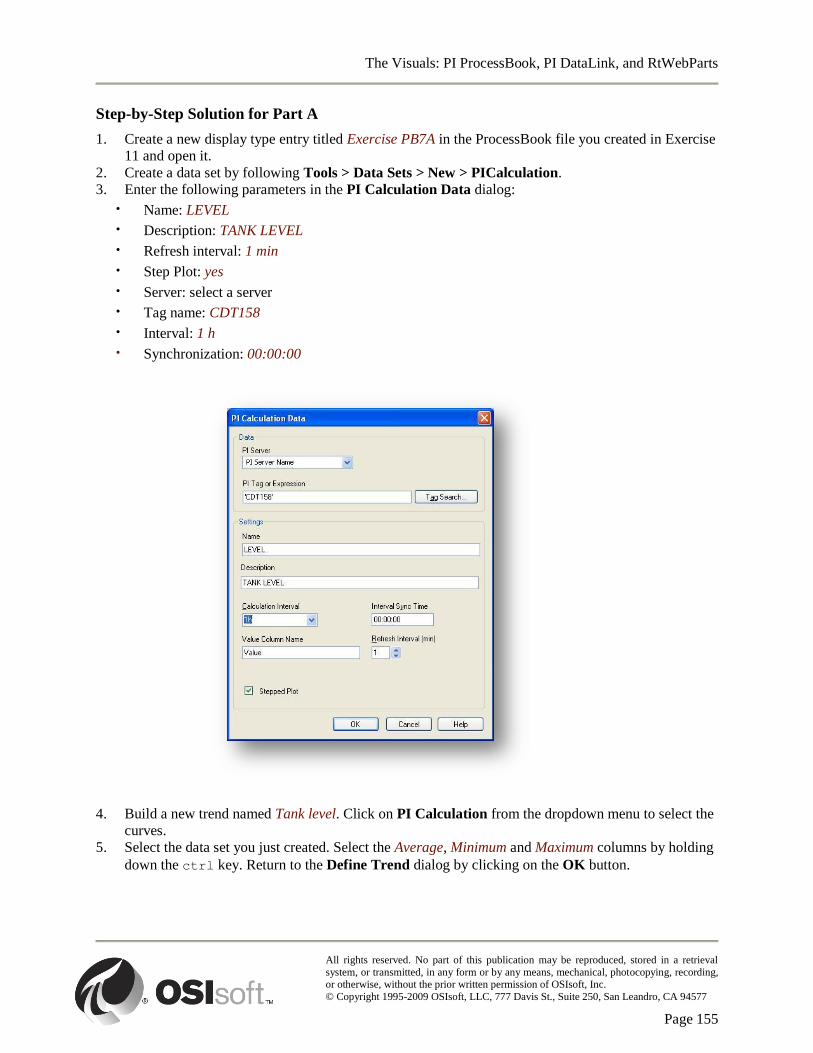
The Visuals: PI ProcessBook, PI DataLink, and RtWebParts
All rights reserved. No part of this publication may be reproduced, stored in a retrieval
system, or transmitted, in any form or by any means, mechanical, photocopying, recording, or otherwise, without the prior written permission of OSIsoft, Inc.
© Copyright 1995-2009 OSIsoft, LLC, 777 Davis St., Suite 250, San Leandro, CA 94577
Page 155
Step-by-Step Solution for Part A
1. Create a new display type entry titled Exercise PB7A in the ProcessBook file you created in Exercise
11 and open it.
2. Create a data set by following Tools > Data Sets > New > PICalculation.
3. Enter the following parameters in the PI Calculation Data dialog:
· Name: LEVEL
· Description: TANK LEVEL
· Refresh interval: 1 min
· Step Plot: yes
· Server: select a server
· Tag name: CDT158
· Interval: 1 h
· Synchronization: 00:00:00
4. Build a new trend named Tank level. Click on PI Calculation from the dropdown menu to select the
curves.
5. Select the data set you just created. Select the Average, Minimum and Maximum columns by holding
down the ctrl key. Return to the Define Trend dialog by clicking on the OK button.
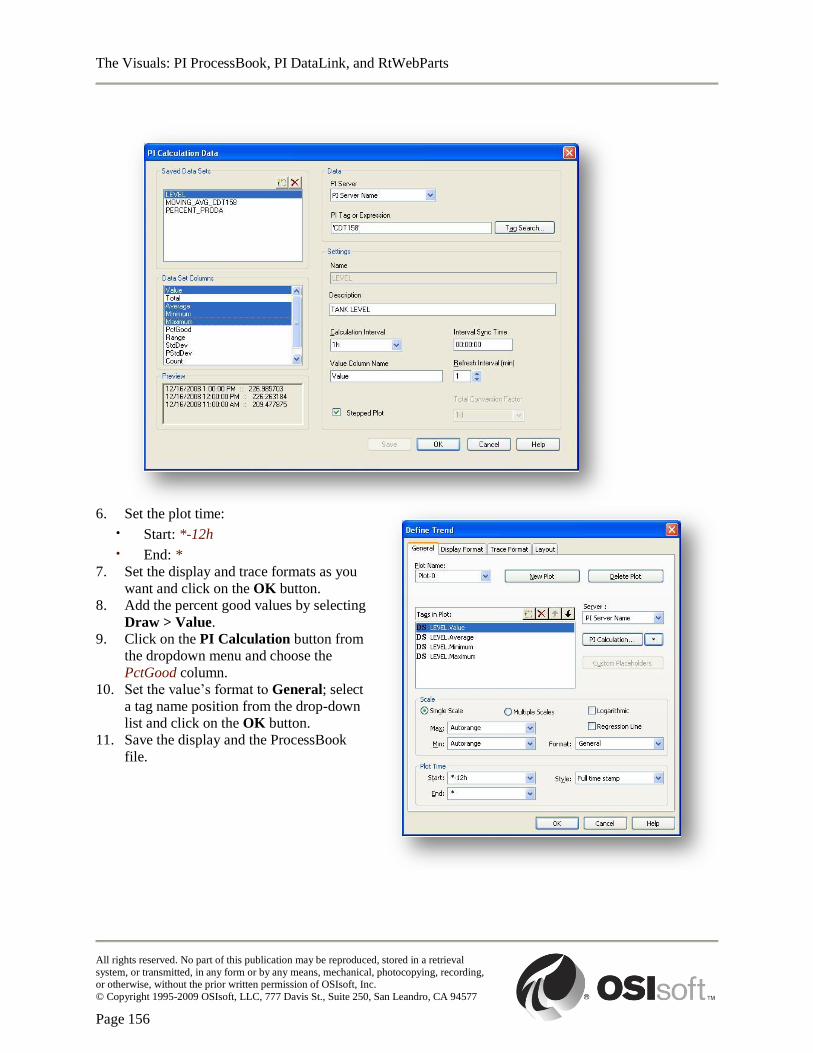
The Visuals: PI ProcessBook, PI DataLink, and RtWebParts
All rights reserved. No part of this publication may be reproduced, stored in a retrieval
system, or transmitted, in any form or by any means, mechanical, photocopying, recording, or otherwise, without the prior written permission of OSIsoft, Inc.
© Copyright 1995-2009 OSIsoft, LLC, 777 Davis St., Suite 250, San Leandro, CA 94577
Page 156
6. Set the plot time:
· Start: *-12h
· End: *
7. Set the display and trace formats as you
want and click on the OK button.
8. Add the percent good values by selecting
Draw > Value.
9. Click on the PI Calculation button from
the dropdown menu and choose the
PctGood column.
10. Set the value‟s format to General; select
a tag name position from the drop-down
list and click on the OK button.
11. Save the display and the ProcessBook
file.
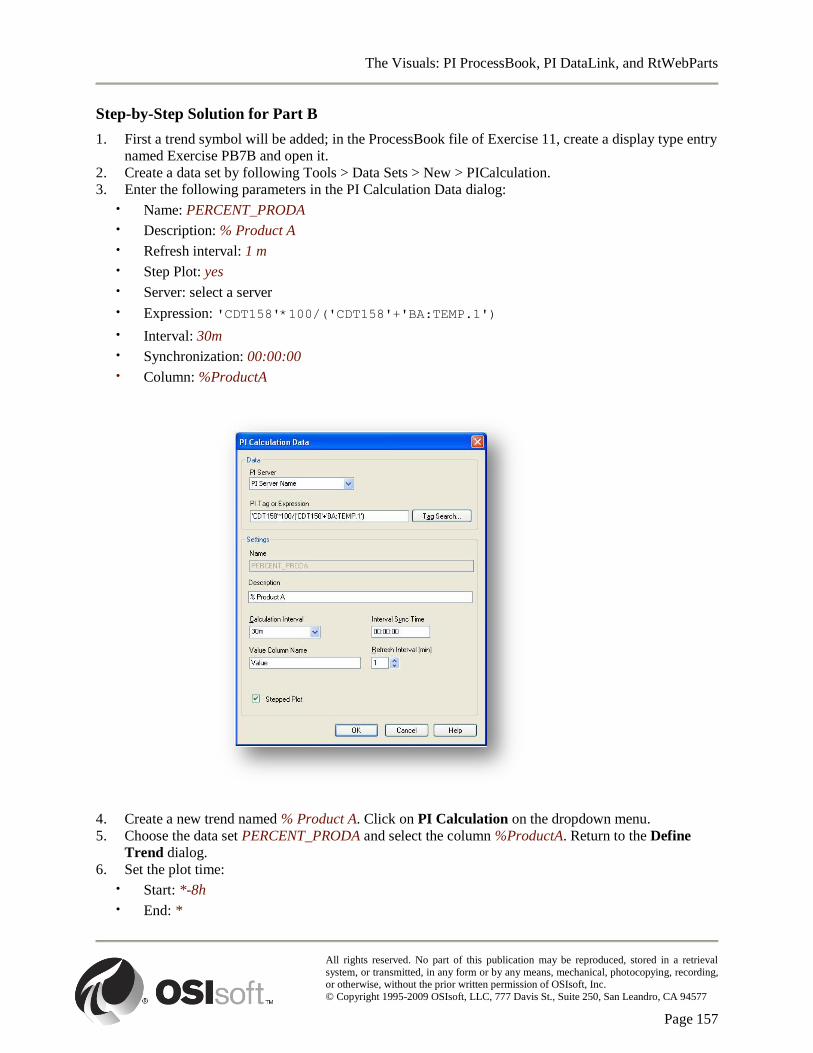
The Visuals: PI ProcessBook, PI DataLink, and RtWebParts
All rights reserved. No part of this publication may be reproduced, stored in a retrieval
system, or transmitted, in any form or by any means, mechanical, photocopying, recording, or otherwise, without the prior written permission of OSIsoft, Inc.
© Copyright 1995-2009 OSIsoft, LLC, 777 Davis St., Suite 250, San Leandro, CA 94577
Page 157
Step-by-Step Solution for Part B
1. First a trend symbol will be added; in the ProcessBook file of Exercise 11, create a display type entry
named Exercise PB7B and open it.
2. Create a data set by following Tools > Data Sets > New > PICalculation.
3. Enter the following parameters in the PI Calculation Data dialog:
· Name: PERCENT_PRODA
· Description: % Product A
· Refresh interval: 1 m
· Step Plot: yes
· Server: select a server
· Expression: 'CDT158'*100/('CDT158'+'BA:TEMP.1')
· Interval: 30m
· Synchronization: 00:00:00
· Column: %ProductA
4. Create a new trend named % Product A. Click on PI Calculation on the dropdown menu.
5. Choose the data set PERCENT_PRODA and select the column %ProductA. Return to the Define
Trend dialog.
6. Set the plot time:
· Start: *-8h
· End: *

The Visuals: PI ProcessBook, PI DataLink, and RtWebParts
All rights reserved. No part of this publication may be reproduced, stored in a retrieval
system, or transmitted, in any form or by any means, mechanical, photocopying, recording, or otherwise, without the prior written permission of OSIsoft, Inc.
© Copyright 1995-2009 OSIsoft, LLC, 777 Davis St., Suite 250, San Leandro, CA 94577
Page 158
7. Set the display and trace formats as you want and click on the OK button.
8. A tank symbol will be added; draw a tank with two inlet pipes and an outlet one.
9. Type the products‟ names and add the CDT158 tag value as product A and the BA:TEMP.1 tag value
as product B.
10. Type %ProductA = at the tank‟s outlet and add the value and the timestamp of column %ProductA
of the Product A data set.
11. Save the display and the ProcessBook file.

The Visuals: PI ProcessBook, PI DataLink, and RtWebParts
All rights reserved. No part of this publication may be reproduced, stored in a retrieval
system, or transmitted, in any form or by any means, mechanical, photocopying, recording, or otherwise, without the prior written permission of OSIsoft, Inc.
© Copyright 1995-2009 OSIsoft, LLC, 777 Davis St., Suite 250, San Leandro, CA 94577
Page 159
11. Advanced Calculations in PI DataLink
11.1 Advanced Calculated Data
Advanced Calculated Data (=PIAdvCalcDat) returns a single calculated value or evenly
spaced calculated values from the PI archive. Calculation modes are: total, minimum,
maximum, standard deviation, range, average and count.
If a filter expression is specified, the requested summaries on the source point are calculated
for the time ranges where the expression evaluates to true. To retrieve a single calculated
value, do not specify an interval. To retrieve evenly spaced calculated data, the specified
interval determines the spacing of the calculation.
Please consult PI DataLink's online help for more details about the parameters:
Expression sampling modes for the filter expression;
Expression sampling modes for expression to be summarized;
Expression sampling interval;
Calculation basis;
Minimum percent good parameters.
There are three (3) expression sampling modes for sampling the filter expression:
Pt. Compressed (default) – Evaluates the filter expression at the timestamp of any
compressed value of the source point;
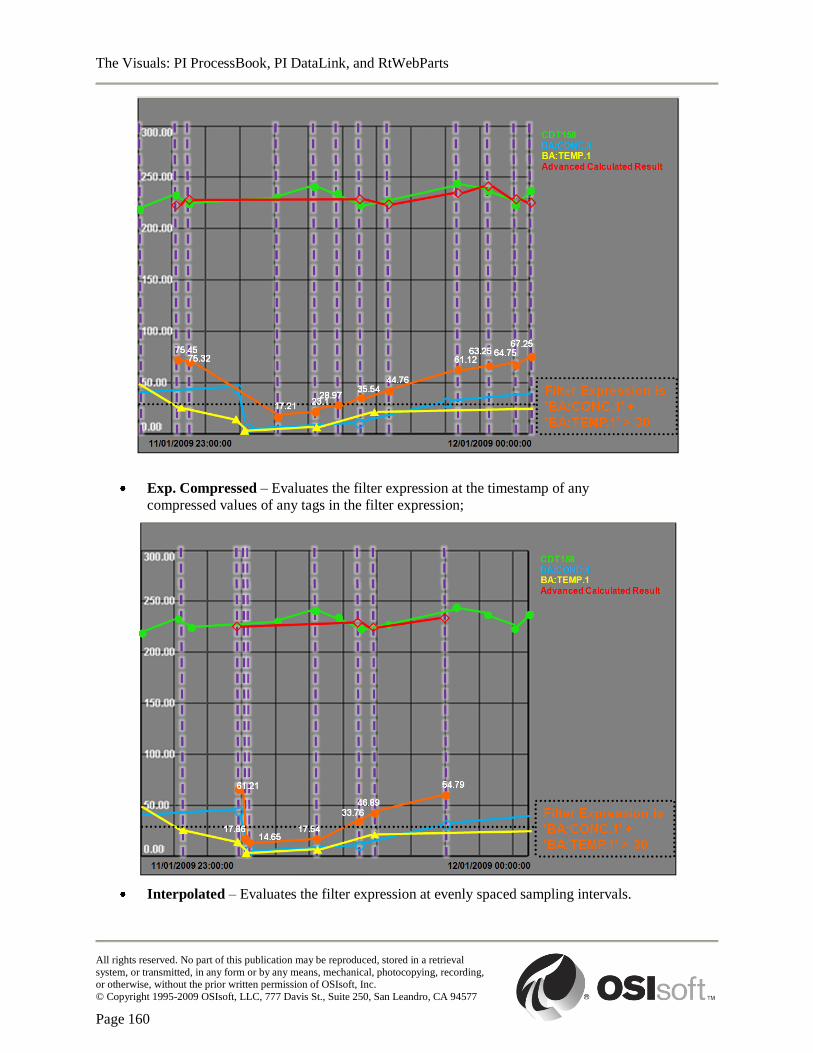
The Visuals: PI ProcessBook, PI DataLink, and RtWebParts
All rights reserved. No part of this publication may be reproduced, stored in a retrieval
system, or transmitted, in any form or by any means, mechanical, photocopying, recording, or otherwise, without the prior written permission of OSIsoft, Inc.
© Copyright 1995-2009 OSIsoft, LLC, 777 Davis St., Suite 250, San Leandro, CA 94577
Page 160
Exp. Compressed – Evaluates the filter expression at the timestamp of any
compressed values of any tags in the filter expression;
Interpolated – Evaluates the filter expression at evenly spaced sampling intervals.
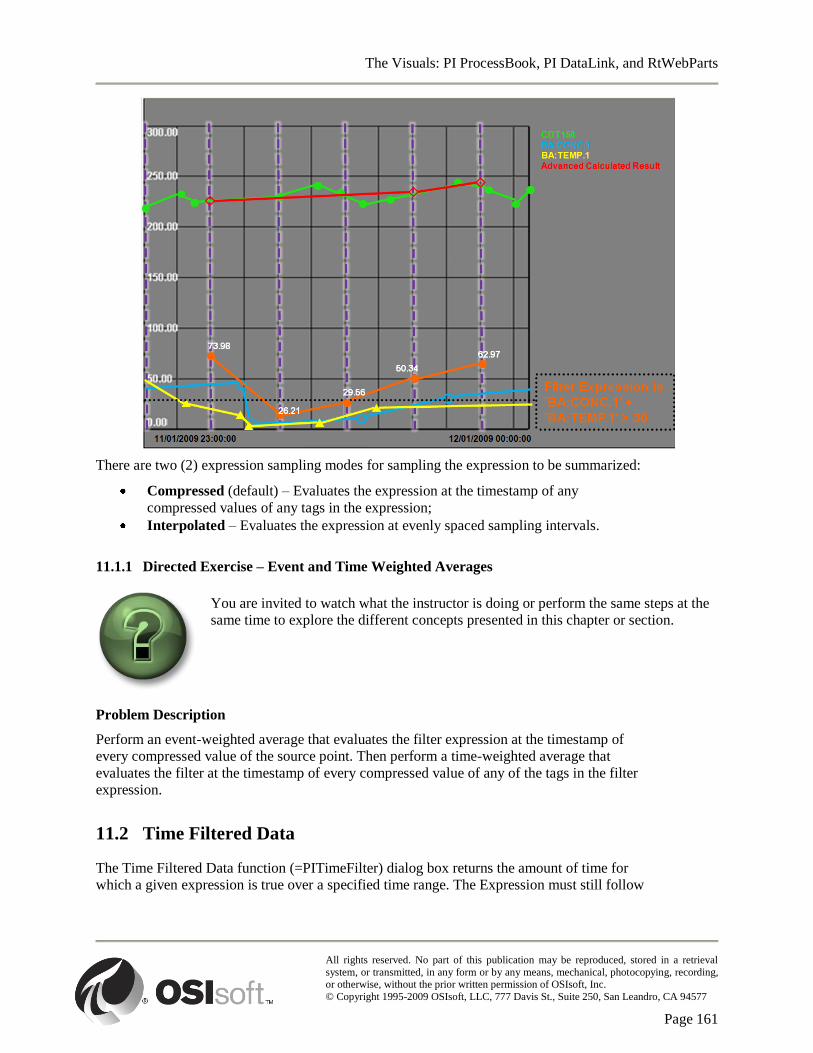
The Visuals: PI ProcessBook, PI DataLink, and RtWebParts
All rights reserved. No part of this publication may be reproduced, stored in a retrieval
system, or transmitted, in any form or by any means, mechanical, photocopying, recording, or otherwise, without the prior written permission of OSIsoft, Inc.
© Copyright 1995-2009 OSIsoft, LLC, 777 Davis St., Suite 250, San Leandro, CA 94577
Page 161
There are two (2) expression sampling modes for sampling the expression to be summarized:
Compressed (default) – Evaluates the expression at the timestamp of any
compressed values of any tags in the expression;
Interpolated – Evaluates the expression at evenly spaced sampling intervals.
11.1.1 Directed Exercise – Event and Time Weighted Averages
You are invited to watch what the instructor is doing or perform the same steps at the
same time to explore the different concepts presented in this chapter or section.
Problem Description
Perform an event-weighted average that evaluates the filter expression at the timestamp of
every compressed value of the source point. Then perform a time-weighted average that
evaluates the filter at the timestamp of every compressed value of any of the tags in the filter
expression.
11.2 Time Filtered Data
The Time Filtered Data function (=PITimeFilter) dialog box returns the amount of time for
which a given expression is true over a specified time range. The Expression must still follow
The Visuals: PI ProcessBook, PI DataLink, and RtWebParts
All rights reserved. No part of this publication may be reproduced, stored in a retrieval
system, or transmitted, in any form or by any means, mechanical, photocopying, recording, or otherwise, without the prior written permission of OSIsoft, Inc.
© Copyright 1995-2009 OSIsoft, LLC, 777 Davis St., Suite 250, San Leandro, CA 94577
Page 162
the PI Performance Equation Syntax. The user can specify multiple time ranges as evenly
spaced intervals as in the Calculated Data dialog box.
Note: If you can enter the expression into a cell on the worksheet and refer to it in the dialog box, begin
the expression with a single quote so that Excel will interpret the expression as a string.
Argument Explanation
Expression (string) The calculation expression.
Stime (string) The start time in PI time format
Etime (string) The end time in PI time format
Interval (string) The time interval in PI time format
Timeunit (string) Unit of time for the result to be displayed. Valid entries are:
s, h, m, d
Outcode (integer) An output code such as 0, 1, 2, or 3.
PIServer (string) The PI Server.
11.2.1 Exercise – Operating Time with Time Filtered Data
The following exercise is intended to reinforce key information presented in this
chapter or section. The answer can be found at the end of the exercise.
Objectives
Calculate an operating time with the Time Filtered function.
Problem Description
As the person in charge of the maintenance program, you want to know the operating time for a specific
pump. Find the amount of time the pump was ACTIVE using the function Time Filtered. This method
performs the calculation in a single step; saving the step of doing the filtering with the IF function in MS
Excel. It returns the amount of time that an expression is true.
The operating status is measured by the tag BA:ACTIVE.1.
Approach

The Visuals: PI ProcessBook, PI DataLink, and RtWebParts
All rights reserved. No part of this publication may be reproduced, stored in a retrieval
system, or transmitted, in any form or by any means, mechanical, photocopying, recording, or otherwise, without the prior written permission of OSIsoft, Inc.
© Copyright 1995-2009 OSIsoft, LLC, 777 Davis St., Suite 250, San Leandro, CA 94577
Page 163
The Time Filtered function returns the amount of time that an expression is true. Use the results to
perform an analysis of the time that your machine state was ACTIVE. The report should allow the user to
select the time unit to display. Use the file as Exercise_DL9_Template.xls a template for this report.
Try to do this exercise on your own before proceeding to the step-by-step solution.
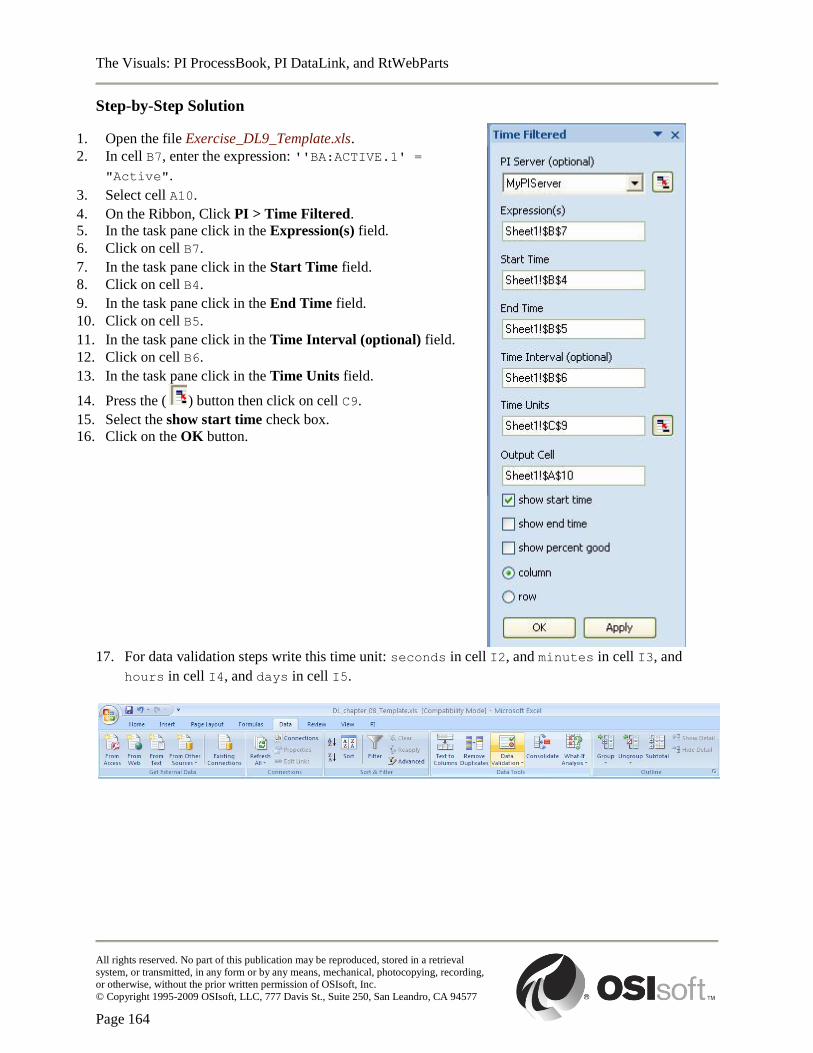
The Visuals: PI ProcessBook, PI DataLink, and RtWebParts
All rights reserved. No part of this publication may be reproduced, stored in a retrieval
system, or transmitted, in any form or by any means, mechanical, photocopying, recording, or otherwise, without the prior written permission of OSIsoft, Inc.
© Copyright 1995-2009 OSIsoft, LLC, 777 Davis St., Suite 250, San Leandro, CA 94577
Page 164
Step-by-Step Solution
17. For data validation steps write this time unit: seconds in cell I2, and minutes in cell I3, and
hours in cell I4, and days in cell I5.
1. Open the file Exercise_DL9_Template.xls.
2. In cell B7, enter the expression: ''BA:ACTIVE.1' =
"Active".
3. Select cell A10.
4. On the Ribbon, Click PI > Time Filtered.
5. In the task pane click in the Expression(s) field.
6. Click on cell B7.
7. In the task pane click in the Start Time field.
8. Click on cell B4.
9. In the task pane click in the End Time field.
10. Click on cell B5.
11. In the task pane click in the Time Interval (optional) field.
12. Click on cell B6.
13. In the task pane click in the Time Units field.
14. Press the ( ) button then click on cell C9.
15. Select the show start time check box.
16. Click on the OK button.
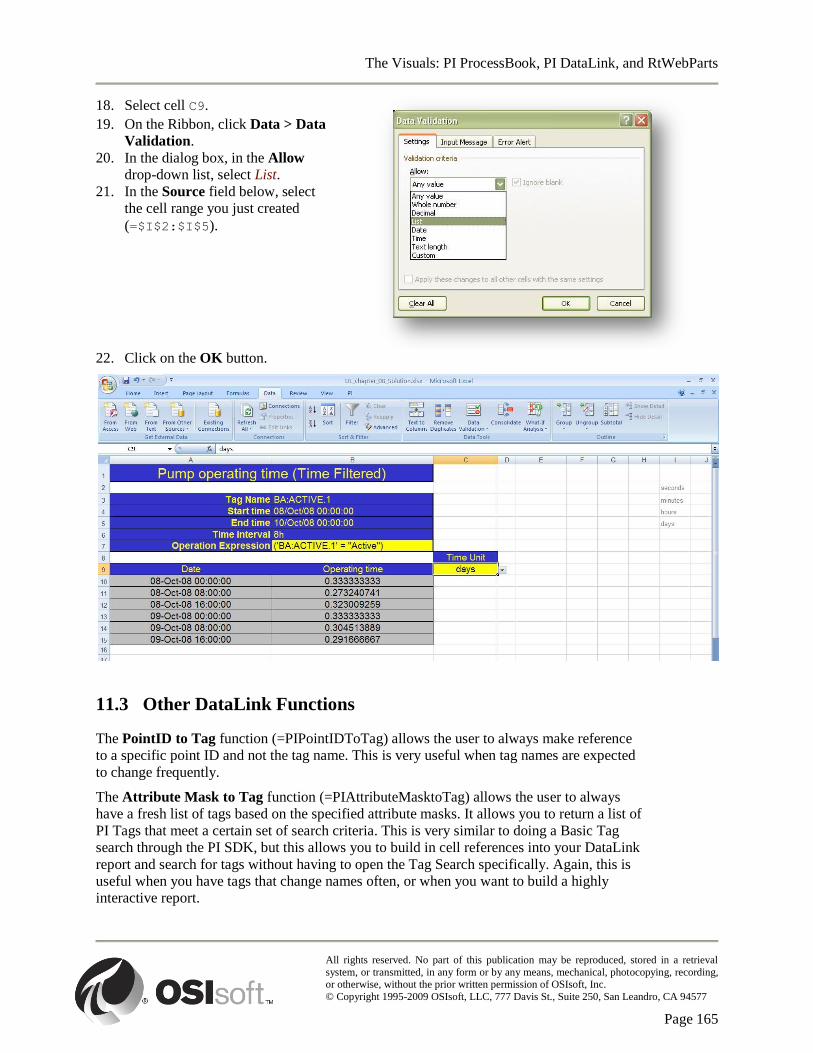
The Visuals: PI ProcessBook, PI DataLink, and RtWebParts
All rights reserved. No part of this publication may be reproduced, stored in a retrieval
system, or transmitted, in any form or by any means, mechanical, photocopying, recording, or otherwise, without the prior written permission of OSIsoft, Inc.
© Copyright 1995-2009 OSIsoft, LLC, 777 Davis St., Suite 250, San Leandro, CA 94577
Page 165
18. Select cell C9.
19. On the Ribbon, click Data > Data
Validation.
20. In the dialog box, in the Allow
drop-down list, select List.
21. In the Source field below, select
the cell range you just created
(=$I$2:$I$5).
22. Click on the OK button.
11.3 Other DataLink Functions
The PointID to Tag function (=PIPointIDToTag) allows the user to always make reference
to a specific point ID and not the tag name. This is very useful when tag names are expected
to change frequently.
The Attribute Mask to Tag function (=PIAttributeMasktoTag) allows the user to always
have a fresh list of tags based on the specified attribute masks. It allows you to return a list of
PI Tags that meet a certain set of search criteria. This is very similar to doing a Basic Tag
search through the PI SDK, but this allows you to build in cell references into your DataLink
report and search for tags without having to open the Tag Search specifically. Again, this is
useful when you have tags that change names often, or when you want to build a highly
interactive report.

The Visuals: PI ProcessBook, PI DataLink, and RtWebParts
All rights reserved. No part of this publication may be reproduced, stored in a retrieval
system, or transmitted, in any form or by any means, mechanical, photocopying, recording, or otherwise, without the prior written permission of OSIsoft, Inc.
© Copyright 1995-2009 OSIsoft, LLC, 777 Davis St., Suite 250, San Leandro, CA 94577
Page 166
11.3.1 Exercise – Advanced Calculated Data (Optional)
The following exercise is intended to reinforce key information presented in this
chapter or section. The answer can be found at the end of the exercise.
Objectives
Learn to perform operations on tags using Advanced Calculated Data.
Problem Description
As the section head of a small sawmill, you are responsible for the quality and the quantity of board that
is produced. You wish to create a PI DataLink report to help your weekly analysis of shift performance.
The tag BA:CONC.1 represents the length of board produced and each archived value represents another
full board. Boards under 5 feet long are considered scrap. This means they should not be included as
production. Accounting has determined that scrap production costs $2.00 for every foot.
The plant starts up on Monday at 8:00 am and goes idle at 4:00 pm on Friday. Shifts are 8 hours long and
run 24 hours per day.
Produce a report for last week, by shift, of the following:
The number of boards produced, excluding scrap;
The average board length produced, excluding scrap;
The cost of scrap.
Approach
We will combine a number of functions in the Advanced Calculated Data. We want to determine how
many boards were produced (each archived event represents one board produced) and the average length
of the boards produced (using an event-weighted expression). These calculations should be done if the
boards were over a certain length. Then, we will run a calculation to determine how much production was
lost to scrap. All of this will be done per interval, which coincides with shift schedule for all last week.
Use the file as Exercise_DL10_Template.xls a template for this report.
Try to do this exercise on your own before proceeding to the step-by-step solution.
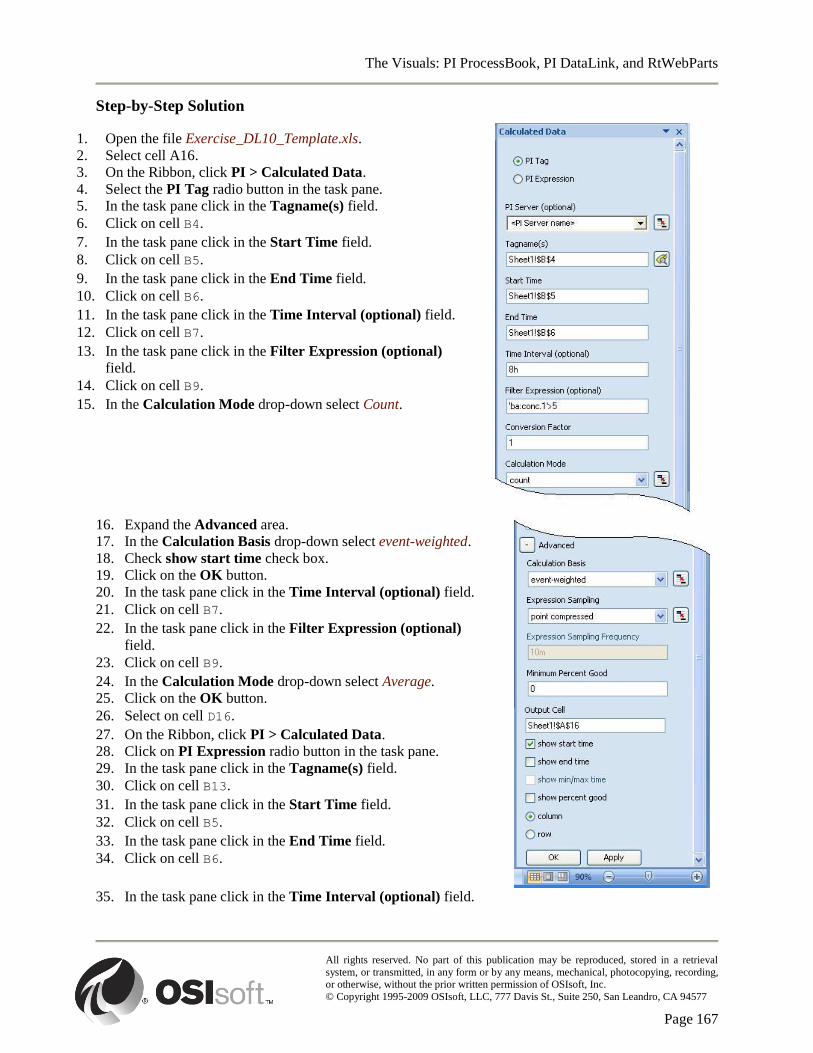
The Visuals: PI ProcessBook, PI DataLink, and RtWebParts
All rights reserved. No part of this publication may be reproduced, stored in a retrieval
system, or transmitted, in any form or by any means, mechanical, photocopying, recording, or otherwise, without the prior written permission of OSIsoft, Inc.
© Copyright 1995-2009 OSIsoft, LLC, 777 Davis St., Suite 250, San Leandro, CA 94577
Page 167
Step-by-Step Solution
16. Expand the Advanced area.
17. In the Calculation Basis drop-down select event-weighted.
18. Check show start time check box.
19. Click on the OK button.
20. In the task pane click in the Time Interval (optional) field.
21. Click on cell B7.
22. In the task pane click in the Filter Expression (optional)
field.
23. Click on cell B9.
24. In the Calculation Mode drop-down select Average.
25. Click on the OK button.
26. Select on cell D16.
27. On the Ribbon, click PI > Calculated Data.
28. Click on PI Expression radio button in the task pane.
29. In the task pane click in the Tagname(s) field.
30. Click on cell B13.
31. In the task pane click in the Start Time field.
32. Click on cell B5.
33. In the task pane click in the End Time field.
34. Click on cell B6.
35. In the task pane click in the Time Interval (optional) field.
1. Open the file Exercise_DL10_Template.xls.
2. Select cell A16.
3. On the Ribbon, click PI > Calculated Data.
4. Select the PI Tag radio button in the task pane.
5. In the task pane click in the Tagname(s) field.
6. Click on cell B4.
7. In the task pane click in the Start Time field.
8. Click on cell B5.
9. In the task pane click in the End Time field.
10. Click on cell B6.
11. In the task pane click in the Time Interval (optional) field.
12. Click on cell B7.
13. In the task pane click in the Filter Expression (optional)
field.
14. Click on cell B9.
15. In the Calculation Mode drop-down select Count.
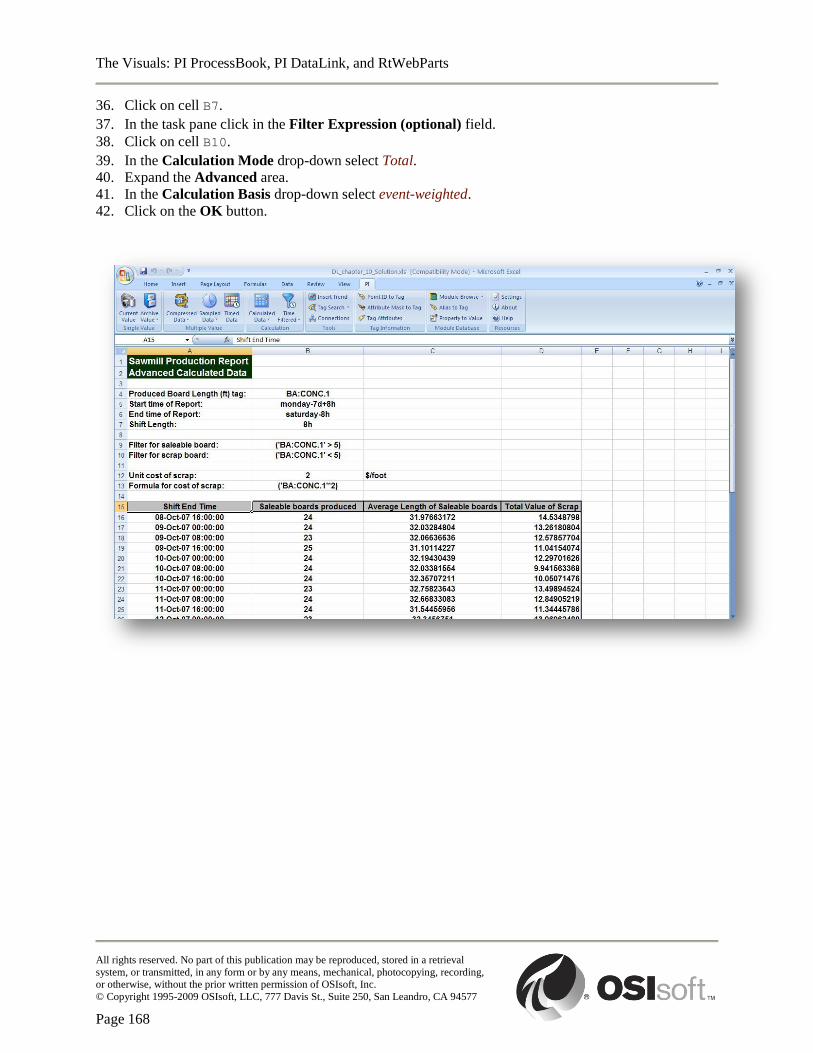
The Visuals: PI ProcessBook, PI DataLink, and RtWebParts
All rights reserved. No part of this publication may be reproduced, stored in a retrieval
system, or transmitted, in any form or by any means, mechanical, photocopying, recording, or otherwise, without the prior written permission of OSIsoft, Inc.
© Copyright 1995-2009 OSIsoft, LLC, 777 Davis St., Suite 250, San Leandro, CA 94577
Page 168
36. Click on cell B7.
37. In the task pane click in the Filter Expression (optional) field.
38. Click on cell B10.
39. In the Calculation Mode drop-down select Total.
40. Expand the Advanced area.
41. In the Calculation Basis drop-down select event-weighted.
42. Click on the OK button.
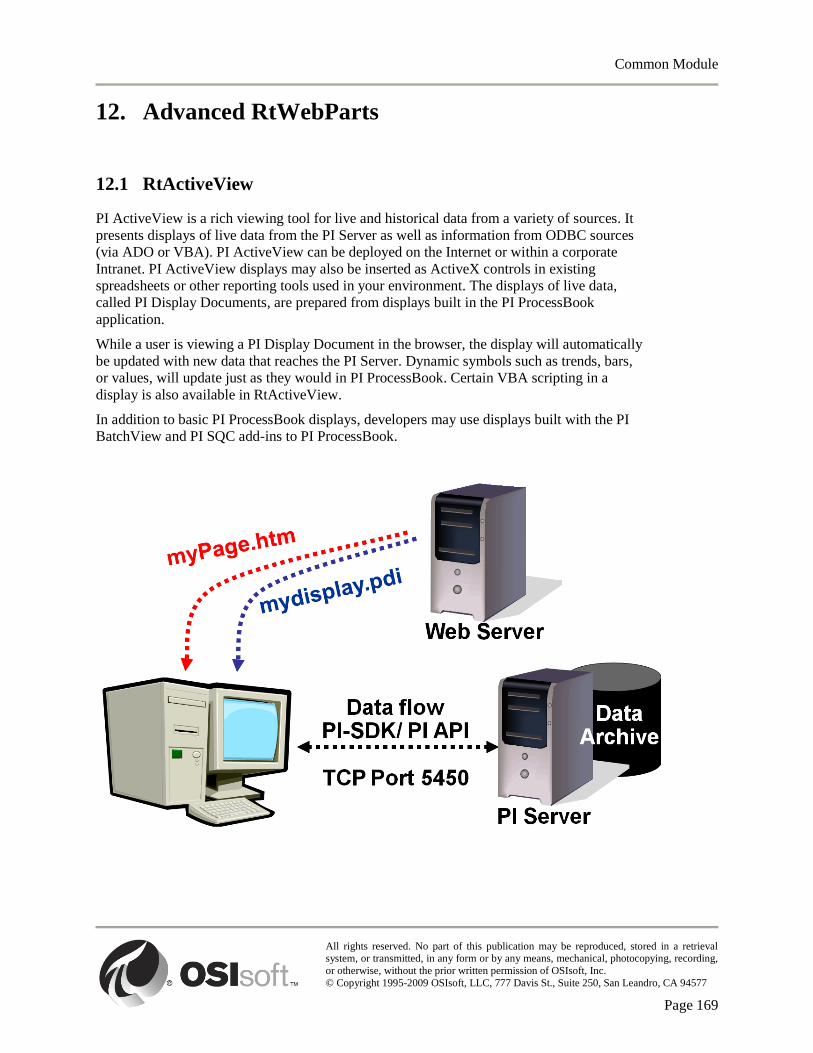
Common Module
All rights reserved. No part of this publication may be reproduced, stored in a retrieval system, or transmitted, in any form or by any means, mechanical, photocopying, recording,
or otherwise, without the prior written permission of OSIsoft, Inc.
© Copyright 1995-2009 OSIsoft, LLC, 777 Davis St., Suite 250, San Leandro, CA 94577
Page 169
12. Advanced RtWebParts
12.1 RtActiveView
PI ActiveView is a rich viewing tool for live and historical data from a variety of sources. It
presents displays of live data from the PI Server as well as information from ODBC sources
(via ADO or VBA). PI ActiveView can be deployed on the Internet or within a corporate
Intranet. PI ActiveView displays may also be inserted as ActiveX controls in existing
spreadsheets or other reporting tools used in your environment. The displays of live data,
called PI Display Documents, are prepared from displays built in the PI ProcessBook
application.
While a user is viewing a PI Display Document in the browser, the display will automatically
be updated with new data that reaches the PI Server. Dynamic symbols such as trends, bars,
or values, will update just as they would in PI ProcessBook. Certain VBA scripting in a
display is also available in RtActiveView.
In addition to basic PI ProcessBook displays, developers may use displays built with the PI
BatchView and PI SQC add-ins to PI ProcessBook.
Common Module
All rights reserved. No part of this publication may be reproduced, stored in a retrieval system, or transmitted, in any form or by any means, mechanical, photocopying, recording,
or otherwise, without the prior written permission of OSIsoft, Inc.
© Copyright 1995-2009 OSIsoft, LLC, 777 Davis St., Suite 250, San Leandro, CA 94577
Page 170
RtActiveView is a client application that allows users to post pdi files to their Intranet. There
are a few rules to using RtActiveView that each user and developer has to keep in mind. One
is that the application will not open a ProcessBook workbook. You must break your
workbook out into individual component display (.pdi) files and insert them as Objects within
HTML (hypertext markup language) files. These can be either .htm files, .asp files, or any
variation on that web standard.
You can do this manually or you can use a utility that OSIsoft includes in every
RtActiveView installation. This utility is a small application written in VBA that performs
these tasks. It is possible to find it in: .\PIPC\ACVIEW\WebDev\EXPORT.PDI
Because RtActiveView connects directly to the PI Server, it does require a direct connection
through port 5450 and a local installation. This does mean that RtActiveView is a smart
client, not a thin client. Thus, we find it usually better suited to a company‟s intranet
environment, rather than a full web deployment.
Note: Linked ProcessBook buttons do NOT work with RtActiveView. You must remove them from PI
ProcessBook before you create your display files.
The configuration process for the RtActiveView WebPart is the same as for the RtGraphic.
The primary difference is that the file now is a .PDI file instead of a .SVG file. However, you
still follow the same procedure to upload the file to a SharePoint Document Library and link
the file to the appropriate webpart.
12.2 Other RtWebParts
There are two other specialty RtWebParts that we should mention. The RtBatchTable
interfaces with PI Batch to display batch data. This web part is really only useful if you have
licensed our PI Batch software.
The RtMessenger interfaces with Windows Office Communicator to display who in your
organization is online.
These specialty web parts are covered in more depth in our other training options such as our
RtWebParts User and Administration class and in some of our online webinars.

Common Module
All rights reserved. No part of this publication may be reproduced, stored in a retrieval system, or transmitted, in any form or by any means, mechanical, photocopying, recording,
or otherwise, without the prior written permission of OSIsoft, Inc.
© Copyright 1995-2009 OSIsoft, LLC, 777 Davis St., Suite 250, San Leandro, CA 94577
Page 171
13. Conclusion
13.1 Training
The OSIsoft Training page is located at http://training.osisoft.com. From here you can see our
current training offerings and upcoming events. There are currently 5 Ways to Learn about
PI, with additional methods coming shortly.
Live training webinars are offered regularly for customers who are enrolled in the Software
Reliance Program (SRP). We have both the “Show Me the Value” webinar series which
provides new and exciting business ideas, and the “Show Me How” webinar series that
provides technical knowledge on a very specific topic.
13.2 vCampus
vCampus is a subscription-based, online offering that consists of providing everything people
need to develop applications on the PI System. Focusing on 'doing it right', this community-
oriented program provides resources such as:
Full development PI System;
Community experience with discussion forums and blogs;
Online library;
Technical, interactive webinars.
vCampus is intended to facilitate and encourage communication around PI programming and
integration between OSIsoft partners, customers and employees. Please consult our
Frequently Asked Questions (FAQ) section at http://vcampus.osisoft.com/content/FAQ.aspx
or contact us at [email protected] for more details.
13.3 Tech Support
We recommend visiting the Tech Support site, http://techsupport.osisoft.com, often. From
here you have many options. You can download anything your company is licensed for using
the Download center. You can view our Engineering plan to get information about the most
current releases and predicated release dates and features for new version or products. You
can login and view your support calls, both currently open and previously closed. You can
also search through our Knowledge Base to try and troubleshoot any issues you may be
having on your own.
The phone number and email address for OSIsoft Technical Support:
phone: (01) 510 297-5828
e-mail: [email protected]
Before you contact Tech Support, it is helpful to have certain information readily available.
The OSIsoft engineer will ask the name of the product, the version number, and the computer
Common Module
All rights reserved. No part of this publication may be reproduced, stored in a retrieval system, or transmitted, in any form or by any means, mechanical, photocopying, recording,
or otherwise, without the prior written permission of OSIsoft, Inc.
© Copyright 1995-2009 OSIsoft, LLC, 777 Davis St., Suite 250, San Leandro, CA 94577
Page 172
platform. Determine the PI version and build numbers using the Operation > Version option
in PI SMT. Alternately, you can learn the version of almost all PI executables (including
interfaces) by invoking the executable with the –v parameter from a command prompt. Here
is an example:
cd \pipc\bin
bufserv -v
Get computer platform (CPU type, operating system, and version number) as follows:
On Windows, right-click on My Computer icon and select Properties tab.
On UNIX, type uname -a
Note the time that the difficulty started, and be prepared to report the contents of the message
log at that time. The message log is found in the Operation > Message Log Viewer option in
SMT. You will likely also need the PIPC log covering the applicable timerange. This log is
located in \\pipc\dat.
13.4 Further Questions
For questions about Licensing, if you are in the US, you can find your salesman listed at
http://www.osisoft.com > Contact Us > US Sales. If you are outside the US you can find
your salesman listed at http://www.osisoft.com > Contact Us > International Sales.
For questions about existing Support Issues, you should call technical support at 510 297-
5828 or visit http://techsupport.osisoft.com > My Support > My Calls.
For questions about unresolved training issues, contact your instructor or email
For all other questions, please contact our Customer Service group via email at

Common Module
All rights reserved. No part of this publication may be reproduced, stored in a retrieval system, or transmitted, in any form or by any means, mechanical, photocopying, recording,
or otherwise, without the prior written permission of OSIsoft, Inc.
© Copyright 1995-2009 OSIsoft, LLC, 777 Davis St., Suite 250, San Leandro, CA 94577
Page 173
14. Exercise – Global Recap Question
The following exercise is intended to reinforce key information presented throughout
this course.
Objectives
Review the main functionalities of PI ProcessBook, PI DataLink and RtWebParts.
Understand and use the relationships between the software.
Problem Description
Your company has extended the production plant with brand new machinery. In order to give
access to the plant data to your coworkers, you need to implement new material using the
PI ProcessBook, PI DataLink and RtWebParts.
Some of the data will only be used by operators who are experienced with PI ProcessBook
and like its flexibility. You will need to create a few displays for them and organize them
adequately. Other data requires a more numerical analysis and you prefer using PI DataLink
to analyze it. Finally, other data are of interest for the whole plant staff and you chose to
distribute it using RtWebParts so that everyone will be able to access the data using their web
browser.
Approach
Here are the items that should be implemented so that your users can have an efficient access
to the data of the new section in the plant:
PI ProcessBook files with the following characteristics:
A standalone display showing a pump picture and two tags related to it,
BA:ACTIVE.1 and B A:CONC.1.
A ProcessBook containing a link to the display mentioned above, an embedded
display (described below) and a URL link to the OSIsoft technical support
website.
The embedded display showing a tank image and a scaled bar graph with its
level. This display will be module relative by using the context provided by your
instructor.
PI DataLink and Excel report with the following characteristics:
A cell showing the current state of a piece of machinery using tag CDM158.
A table with the latest 10 values of tag CDT158.
A PI trend based on values of the above table.

Common Module
All rights reserved. No part of this publication may be reproduced, stored in a retrieval system, or transmitted, in any form or by any means, mechanical, photocopying, recording,
or otherwise, without the prior written permission of OSIsoft, Inc.
© Copyright 1995-2009 OSIsoft, LLC, 777 Davis St., Suite 250, San Leandro, CA 94577
Page 174
The table should use conditional formatting to highlight the lowest 10% of values
to help the users visualize the report.
RtWebParts page with the following properties
An RtGauge web part showing the key performance indicator (KPI) represented
by tag sinusoidu
A text web part explaining in 1 sentence how the users can pull an ad hoc trend
of the current electrical consumption using the RtGauge.
An RtTimeSeries web part showing the history of the last 10 minutes of the tag
BA:TEMP.1.
An RtGraphic web part containing the display previously created in ProcessBook
An Excel Web Access web part containing the PI DataLink report previously
created.
Note: This recap exercise can be performed in various ways, no Step-by-Step solution is provided so you
can design your own solution. Please consult your instructor if you have any questions.