Embed Size (px)
Citation preview

Strategy Report to Clients Jan. 28, 2014 Page 1
Client Strategy Report by John Chew Jan. 28, 2014
G O L D I S M O N E Y . . . EVERYTHING ELSE IS CREDIT - J.P. Morgan
I will separately send out a detailed analysis of your portfolio. This letter is to give you a better understanding of the
past year’s performance (or lack thereof) and our ongoing strategy.
Since my strategy of owning mostly precious metal miners and some gold/silver bullion through closed-end funds is
very unorthodox, I should tell you how this came to pass. I have no love for gold or miners; I would rather own a
successful, growing business that can compound over time. Owning gold is like having money that can’t be debased
by fiat. The high price of most stocks forced me out of many of our franchise companies. I will go into great detail
about why the stock market will struggle because of unsustainably high profit margins. Not only does the
current market sport profit margins at almost double their historical norm, but the multiple on those profits is also
high. Any regression to the mean will augur in low returns—probably over the next decade. My search for value led
me to precious metals mining companies—the most hated asset class of the past two to three years’. As the famous
investor John Templeton said, “Go where the outlook is bleakest, the outlook the worst to find values.” A value
investor needs to find distressed or forced selling. Believe me; investors were selling miners after three years of
declining prices not because of certainty but because of pain of further loss. A video of John Templeton’s investing
philosophy which is similar to mine is here: http://wp.me/p2OaYY-2fN.
There is a catch. Since investing in miners means owning a cyclical asset, I must be contrarian—buying on sell-offs
and selling on rallies—while being patient. The bottoming process has been almost 9 months, so if/when the miners
turn, a new bull market will likely be for a few years unless prices rise rapidly and relentlessly. Think of how the
businesses operate. It may take a year to close a mine or stop production. The 80% price decline of many junior
miners sent a strong signal to investors and managements to change. Odds in terms of time and price favor the
bottom being in as of Dec. 31, 2013 though in the markets as in life there is no absolute certainty.

Strategy Report to Clients Jan. 28, 2014 Page 2
In a nutshell, I think we are well-positioned being diversified (mostly) in—by far—the cheapest asset class,
precious metals miners that produce real money (gold and silver). The general stock market of the NYSE, S&P
500 and NASDAQ has mostly fully-priced stocks of which I will give an example later. I sold out of general stocks
mid-year 2013 and began accumulating depressed miners. The momentum continued to push up stocks and depress
miners. But so far in 2014 there seems to be a reversal.
Your account (general client accounts) was down approximately 20% from the prior year while the S&P 500 scored
one of its best years ever, up close to 32% with dividends. Ironically, the most over-indebted and heavily shorted
stocks fared the best in a world awash in money printing by the Fed to purchase U.S. Treasury debt to suppress
interest rates—central planning at work! I began selling our franchise-type companies back in April/May of 2013 to
buy miners and other resource-based companies. The relative underperformance was huge for that time period.
I would rather look like a fool during a boom than a bust.
Also, I believe the current calm belies massive problems festering in the US and Europe like growing debt burdens,
weak growth and continued central bank money printing. This article sums up the situation I see today:
http://www.acting-man.com/?p=28229. Set aside all the words, charts and graphs in this report and ask your
common sense, “Does central planning work?” Note Eastern Europe, Communist Russia and Nazi Germany
collapsing. Can money printing foster economic growth and solve our debt problem while maintaining the value of
our currency? Has currency debasement and currency wars ever solved anything? If your answer to any question is
no, then own some gold.
A short time period can just be noise or
investors may be waking up to risks in
corporate earnings, emerging markets
currency crisis, and weakening/deflating
economies.
Since gold is money, it is a store of value
and medium of exchange. Gold will
maintain its historical exchange ratio for
goods BOTH in high and rising inflation
and with deflation or credit collapse.
Our miners would benefit the most in a
credit crisis (input costs decline vs. gold).
You can see the
long bottoming
process after a
sharp decline.

Strategy Report to Clients Jan. 28, 2014 Page 3
Just to show you how one can paint the target wherever the arrow lands, being down 20% in mining equities
was a vast improvement over the best performing gold mutual fund: Tocqueville Gold Fund.
Named by Lipper as the Best Fund in the Precious Metals Category for the Past 3 Year and 5 Years ended 12/31/12.
Tocqueville Gold Fund Average Annual Returns as of 09/30/13
3 Month YTD 1YR 3YR 5YR 10YR
Tocqueville Fund* 8.54% -40.04% -47.69% -19.64% 4.26% 7.11%
S&P 500 Index 5.24% 19.79% 19.34% 16.27% 10.02% 7.57%
Phil. Stk Ex. G/S I 16.95% -42.54% -49.97% -20.58% -5.24% 1.51%
But I am not trying to compare my investing to the S&P 500 or Tocqueville gold fund. My goal is to protect our (I
am invested right alongside you in many of the same positions) capital so the money invested will grow in real
value—to buy more in goods and services than at the beginning of the investment period. If the numbers were
inverted and the S&P 500 was down 35% while your portfolio was down 20%, I wouldn’t consider that 10%
outperformance. You would be concerned about permanent loss of capital.
I begin the shift into miners and gold. GLD is a
gold ETF. Last purchases at year-end

Strategy Report to Clients Jan. 28, 2014 Page 4
A Non-Conventional Strategy
The critical issue is what WILL the companies in your portfolio be worth in a few years? I will go into the reasons
why I think the values will be much higher than today but first let me describe in more detail what led me to this
unorthodox strategy?
The main reasons for my strategy:
1. I can't find traditional companies with a margin of safety based on today's valuations. I see high risks
or low future returns in the general stock market. See
http://www.hussmanfunds.com/wmc/wmc140120.htm http://www.hussmanfunds.com/wmc/wmc140113.htm
2. I was forced to seek the cheapest assets/companies--precious metals miners.
3. EVEN IF gold does not go up much or stays stable. OUR MINERS could go up 50% or more because of
extreme undervaluation.
4. In a world where Japan, the US, Russia, China and Europe have large government debts and are in a currency
war(s) then I want to own the MONEY (GOLD/Silver is a store of value and medium of exchange but it is not a
currency) that can't be debased (printed out of thin air). All the conditions that drove gold higher since 2001 exist
today. See a full research report here: http://www.incrementum.li/research-analysis/in-gold-we-trust-2013/
Many money managers seem to believe that the Federal Reserve can withdraw stimulus (QE) while the economy
improves (reaches “escape velocity”). I believe that inevitably the failures of the Fed’s central planning such as
mal-investment and intervention to prevent prices (interest rates) from moving to their natural level will be revealed.
Perhaps financial assets will reach “decent velocity.” (A bad joke!)

Strategy Report to Clients Jan. 28, 2014 Page 5
5. The reasons for the rise in gold from $250 in 2001 to $1,920 in 2011 are still prevalent. Speculative investors
who feared hyperinflation and a collapse in the Eurozone did not have their expectations met and may have migrated
to the rising stock markets. There was a huge speculative swing from long to short in the West. Meanwhile, demand
for physical gold is STRONG and growing stronger due to increasing wealth in the EAST. A 29% sell-off in gold is
not unusual in a long bull market. A 50% decline occurred in 1976 when gold fell from $200 to $100 before rising to
$850 in 1980.
The gold price has tracked the debt
ceiling (until recently) because the rising
debt is being paid for by an increasing
supply of fiat dollars. Will the debt
decline in the future? So far, with debt
compounding even at current low interest
rates, there are no signs of government
frugality.
What did happen? The S&P 500 has tracked the Fed’s asset growth.
Perhaps, banks are buying or lending to those who are buying stocks.
Note the rapid rise in govt. debt during and after the
financial crisis in 2007. This debt will have to be
restructured, defaulted on, or inflated away, but
these economies can’t grow their way out of this
burden at their current growth rates—esp. the US.

Strategy Report to Clients Jan. 28, 2014 Page 6
The Green shadow represents
spec. futures positions. Note
the three year decline. Low
speculative interest because of
declining prices. There are
fewer spec. longs to sell now.

Strategy Report to Clients Jan. 28, 2014 Page 7
What the chart above shows is the huge swing of physical gold holdings. Gold moved out of speculative hands of
ETF holders to the East as there were premiums as high as $35 per gold ounce in Shanghai to long term holders:
Chinese citizens and the government.
Risks:
The massive “quantitative easing” or the printing of dollars electronically to purchase Treasury debt was helping
companies expand their profit margins in the near-term but the growing debt beyond our ability to repay with taxes
will eventually devastate the U.S. dollar. The underlying causes of our prior bubbles such as the Internet craze and
the housing bubble are excess credit and manipulated interest rates by the Federal Reserve. See more here:
http://youtu.be/Z0YTY5TWtmU
You wouldn’t tell an alcoholic to cure his drinking problem by going on a bender. The government has chosen to
heap more government spending and debt on top of higher taxes (Obama Care was the largest tax increase in U.S.
history) and regulation. Rising interest rates will certainly hurt the U.S. dollar due to the heavy concentration of
long-term debt on the Fed’s balance sheet. The Fed’s bond holding provides backing to the U.S. dollar besides its
(reported but not audited) 8,111 tons of gold.
I do NOT want to own gold if the US government begins to reduce debts, deficits, taxes, and massive regulation,
while supporting strong money with high real interest rates. Also, central planning of interest rates ceases. An
example would be when Paul Volker received the political will to hike interest rates to 18% to quell the incipient
hyper-inflation back during the early 1980s. Gold went into a 20 year bear market relative to the U.S. dollar.
Wake me when that happens.
If there is a credit collapse, gold will be sold as well as the miners in the near-term for dollars, but the miners will
recover because gold will hold its value as money vs. the miners input costs like oil, energy, steel, etc. The Fed can
continue to increase QE and maintain the illusion of prosperity a bit longer, but the pressure on the dollar would
probably support gold in the long-term. One can’t predict the future but we can own the cheapest assets and avoid
the most expensive (riskiest) ones.
Gold is shipped East to Shanghai. Not returning
unless huge price premiums are paid in the
West. More than 1/3 of inventory lost!

Strategy Report to Clients Jan. 28, 2014 Page 8
Definitions
Debt is a force for deflation. Encumbered firms’ product to remain solvent. Heavily encumbered firms overproduce.
Overproduction presses down prices. Easy access to debt prolongs the life of marginal firms. They don’t go broke
but, finding ready access to speculative-grade credit, carry on, thus adding to the physical volume of production and
therefore to the overhead weight on prices. Debt is deflationary the more it drives production, or—in the case of
governments and individuals—the more it constricts consumption.
Money printing is inflationary. It lifts some prices like stocks and bond, but in the current cycle, not all of them.
Banks have been impaired. Borrowers have been reluctant. The dollars that the Fed has conjured, most of them, take
the shape of immobilized bank reserves. They are inert.
The Fed is egging on inflation with one hand but suppressing it with the other. It materializes the dollars that drive
some (right now financial assets like stocks/bonds) prices higher. It fosters the debt formation that presses certain
other prices lower. What it refuses to do is let markets clear.
So, I view our current situation as highly risky and unstable. Inflation or deflation? I don’t know but gold is a store
of value which protects return OF capital. Mining shares are the cheapest proxy for gold and silver. The belief that
central planners (the Fed) can guide the economy, interest rates and the stock market is absurd and will come to
tears. A fatal conceit. Imagine if your never-do-well brother-in-law who is bankrupt with massive credit card debt
asks you for help. Would you just give him a higher credit limit? More debt will not solve indebtedness
especially as the debt is going towards unproductive uses—see chart 1 below. If printing fiat money (quantitative
easing) by the worlds’ central banks solved problems, then Zimbabwe would be the richest country in the world.
Money and credit does not magically create capital.
--
The only way I see to preserve capital in the long run is to buy the most undervalued assets or franchises on an
absolute basis and avoid over-valued assets and franchises. Ideally, I would like to own profitable franchise1
companies like the ones we owned back in 2009 through early 2013 such as IBM, Coach, WMT, MMM, Colgate,
etc. at fair prices to return 15% per year compounded over time. As prices rose to and beyond my targets, I began to
1 A franchise is defined as a company with a structural competitive advantage that can grow profitably. Example: Coke with economies of scale coupled with customer captivity.
Almost half the U.S. population is on
some form of public assistance.
http://cnsnews.com/news/article/terence
-p-jeffrey/census-49-americans-get-
gov-t-benefits-82m-households-
medicaid
Off-balance sheet U.S. government
liabilities estimated above $200
Trillion. Unpayable at the current value
of the dollar.
http://usawatchdog.com/america-in-
worse-fiscal-shape-than-detroit-
professor-laurence-kotlikoff/
Sobering!
This chart implies that the
U.S.’s rising debts are not all
going to fund productive
activity. Therefore, the odds
increase that more debt will
be piled on to pay down old
debts—foreboding weakness
in the dollar.

Strategy Report to Clients Jan. 28, 2014 Page 9
sell and then try to reinvest those funds into other quality companies at the right prices. However, going on five
years of money printing by the Federal Reserve to suppress interest rates to near zero had forced almost all stocks
into full value in my estimation. I could find no margin of safety. Plus, profit margins had risen to all-time
highs as managements deferred growth capex due to uncertainty of future high tax rates and massive, smothering
regulation and ObamaCare. Managements are taking on debt to return excess cash to shareholders mostly through
buybacks. This is fine in the short-term but what about five years from now? What will fuel profitable
growth?
U.S equities are overvalued if corporate profits are mean-reverting:
Here you can see that profits presently exceed 10% of America’s GDP.
IF and when those profits revert, then stock prices are in for low to negative returns over the NEXT DECADE from
today’s prices.
“In the many years I’ve been surveying experts for their predictions for the coming year (2014),” writes New York
Times’ columnist James B. Stewart, “I cannot recall another time when optimism about the stock market, the
economy and corporate profits was so widespread. As is pessimism about the bond market.”
Contrary to
conventional
thinking, high
corporate profit
margins are
NEGATIVE for the
economy AS A
WHOLE.
READ ON.

Strategy Report to Clients Jan. 28, 2014 Page 10
What is driving the record profitability? CEOs have high time preference. They are deferring growth capital
expenditures to build up cash or return cash to shareholders via buy backs. In other words, rising net consumption is
driving profits. Capitalists’ revenue minus their productive expenditure equals their net consumption, which equals
aggregate profit.
One of the hallmarks of today's economy is the gap between the gains accrued to shareholders and the gains made
by workers in the recovery.
This gap has manifested itself in record corporate margins and massive piles of cash.
So what gives?
In a new-must read, GMO portfolio strategist James Montier delves into the origin of this issue.
Today I find myself once again digging through this toolkit, searching for a way to understand the development of
profit margins. Currently, U.S. profit margins are at record highs according to the NIPA data. More freakish still is
that these record high profit margins are coming during the weakest economic recovery in post-war history.
Here's a look at said margins.
GMO LLC
What's crucial here, from the perspective of investors, isn't just that margins are above previous highs, but that
current earnings projections assume they'll go even higher (At least as of late last year)!
GMO LLC
So what's the source of these incredibly high margins, and can they really persist?
Here Montier gets into the basics of the flow of funds and the national accounts, and he bases his work on the
economist Michael Kalecki, who identified this simple equation:

Strategy Report to Clients Jan. 28, 2014 Page 11
Income = Expenditure
That seems obvious, but it's a good starting point to recognize that every dollar spent represents income for someone
else.
Montier then notes that income equals profits and wages and that expenditures are divided into investment and
consumption, so the above equation actually turns into...
Profits = Investment + Consumption – Wages
That gets permuted some through a few more steps, so that ultimately the equation for profits turns out to be:
Profits = Investment – Household Savings – Government Savings – Foreign Savings + Dividends
And with that equation we can finally start figuring out the source of those monster profits.
This is how things looked like in 2011:
See the big source of profits? It was the government's negative savings. Or to put it another way, it was the huge
deficit equaling 7.6% of GDP that really boosted corporate profits.
Now what you have here is the justification for huge government deficits. Following the crisis, the private sector
balance sheets were badly damaged, and government deficits have done wonders towards boosting GDP and
corporations. The question being is how long we can continue our profligacy without dollar devastation?
The title of Montier's piece is: What Goes Up Must Come Down!
Read here:
http://www.zerohedge.com/sites/default/files/images/user5/imageroot/2012/02/Montier%20-
%20What%20goes%20up%20must%20come%20down.pdf
If you think that the deficit will inevitably shrink, then to maintain profits, something else has to change. Can
consumers afford to save less? Can we shrink our trade deficit? Will there be a reason for investment to jump? If
not, then the boom is over.
Since understanding why the current high profit margins are both unusual and unsustainable will be critical
to understanding how high the risks are in the stock market, let me simplify.
High time preference determines the proportions in which people devote their income and wealth to present
consumption (more) versus provision for the future (less) due to financial repression, higher taxes, and regulation.
But you may ask, “How can fear of the future lead to high profits?” Imagine if you were a primitive native who

Strategy Report to Clients Jan. 28, 2014 Page 12
fishes with his hands. Each day you catch two fish so your net consumption is high; you live in the present. Your
profit is two fish! You could take half a day off to make a spear but your net consumption would fall to one fish but
your capital (the spear) could be made. That day you spend a half day making your spear your “profit” or two fish
drops 50% to one fish, but your investment in capital goods increases to one spear. Hopefully, your future
production will increase your catch to three or more fish each day. Your productivity to kill/catch fish would rise
with the use of your new spear. You are willing to defer consumption to save/invest for the future if you have
confidence in the return on your investment.
When the Fed increases fiat money then capitalists increase their amount of investment, i.e., capitalists’ demand for
productive goods virtually always exceeds the cost of investment. As a result, net investment will comprise a semi-
permanent component of aggregate profit. An increase of the quantity of money causes aggregate profit to rise.
Today’s increase in the quantity of money causes today’s prices--but not yesterday’s costs--to rise. The cost of
investment (depreciation) reflects the past purchases of capital goods, which were made at the lower prices
prevailing in the past. The Fed’s increase in fiat money creates the illusion of true profits.
Here is a chart that illustrates the above concept of low investment:
The drop in investment is dramatic – especially juxtaposed against the rising portion of cash that companies are
returning to shareholders. This shouldn’t be the case when earnings and profit margins are at peak levels and the
economy has been expanding for four years. And there is growing evidence that the way executives are paid is
playing a role in their investment decisions. Research published this year from Alexander Ljungqvist, a research
associate at the NBER, and two other colleagues, found that non-publicly traded companies have been investing at
twice the rates of those of publicly traded companies. Private companies invest 6.8 percent of total assets while
publicly traded companies invest just 3.7 percent. Also interesting, the researchers found that when a company
goes public, they change their investment behavior, investing at a lower rate. That is, newly publicly traded
companies slow the rate of their investments and begin to invest at the rate of the typical publicly traded company.
As the recovery continues to age, the standard explanations for low corporate investment rates become less
compelling. Investment hurdle rates aren’t very high with market interest rates so low. Record earnings and profit
margins should have already kick-started an investment boom. That fact that it hasn’t should have investors asking
questions about when that may change and what the long-term implications for such low corporate investment rates
will mean for the long-term growth rate of stocks and the economy.
A detailed discussion of the coming collapse of profit margins—unless QE is expanded greatly (negative for the
dollar, in my opinion) http://www.leithner.com.au/newsletter/feb13_newsletter.pdf
Perhaps American businesses
require less capital investment in
fixed assets or our future
productivity to pay down our
debt/obligations is being
compromised by
underinvestment.

Strategy Report to Clients Jan. 28, 2014 Page 13
For more detail on the nonsustainability of corporate profits click here:
http://www.hussmanfunds.com/rsi/cape.htm and Profits are mean-reverting:
http://www.kingworldnews.com/kingworldnews/Broadcast/Entries/2014/1/15_Rob_Arnott.html
Finally, government deficits are another driver of corporate profits:
“The deficit of one sector must be the surplus of another.
This is not a theory. It’s actually an accounting identity. But the effect of that identity is beyond question. Elevated
corporate profits can be directly traced to the massive government deficit and depressed household savings that we
presently observe.
I should note that this result is the outcome of hundreds of millions of individual transactions, so it’s tempting to
focus on those transactions as if they are alternate explanations. For example, one might argue that corporate
profits are high because people are unemployed, many workers have been outsourced, and government transfer
payments are allowing corporations to maintain revenues from consumers despite low wage payments. That’s a
perfectly reasonable of saying the same thing – but the transaction detail does not change the basic equilibrium that
profits are elevated because government and household savings are dismal. One will not be permanent without the
other being permanent. To see this, notice that corporate profit margins have always moved inversely to the sum of
government and household savings”
That’s a pretty important chart above. What it’s essentially showing is that government deficits have been a big
driver of corporate profits.

Strategy Report to Clients Jan. 28, 2014 Page 14
Currently profits are coming in at 11% of GDP, a level that is around 60% higher than the average of around 6% that
has been seen since 1952. It is even significantly higher than the average of the past 10 years - a period during which
low interest rates pushed up financial ratios past their traditional levels. To return to a more normalized ratio either
GDP would have to expand rapidly or profits would have to diminish. Given our view of the current economic
prospects, we believe the latter outcome is more likely.
If the US government can keep inflating its balance sheet for a while, then margins can remain high. A bubble
requires increasing credit.
The chart above shows corporate profits as a share of GDP, with a reminder of how elevated levels relate to
subsequent profit growth. I can’t emphasize enough that the issue is not what happens to profits over just the next 4
years, however. The issue is whether current profit margins are representative of what investors should expect for
the next 50 years.

Strategy Report to Clients Jan. 28, 2014 Page 15
Price/Earnings Ratios
Currently market bulls will tell you that current price to earnings ratios are well within their historic range. What P/E
ratios are based on are expected earnings for the coming year. But those earnings won't be known in full until well
into 2015. And like many forward-looking forecasts, they may be overly optimistic. More sophisticated investors
tend to rely on the Shiller S&P 500 P/E Ratio which compares U.S. stock prices to average inflation-adjusted
earnings actually delivered over the past 10 years. This takes a lot of the guess work out of the equation and
compares current U.S. stock prices to the historical long-term earnings power. Today the Shiller S&P 500 PE Ratio
is at 26.4. But going back 100+ years, the historic mean of the index is 16.5. This means the current ratio is 61%
higher than its long term average.
Shiller (1/2/2014)
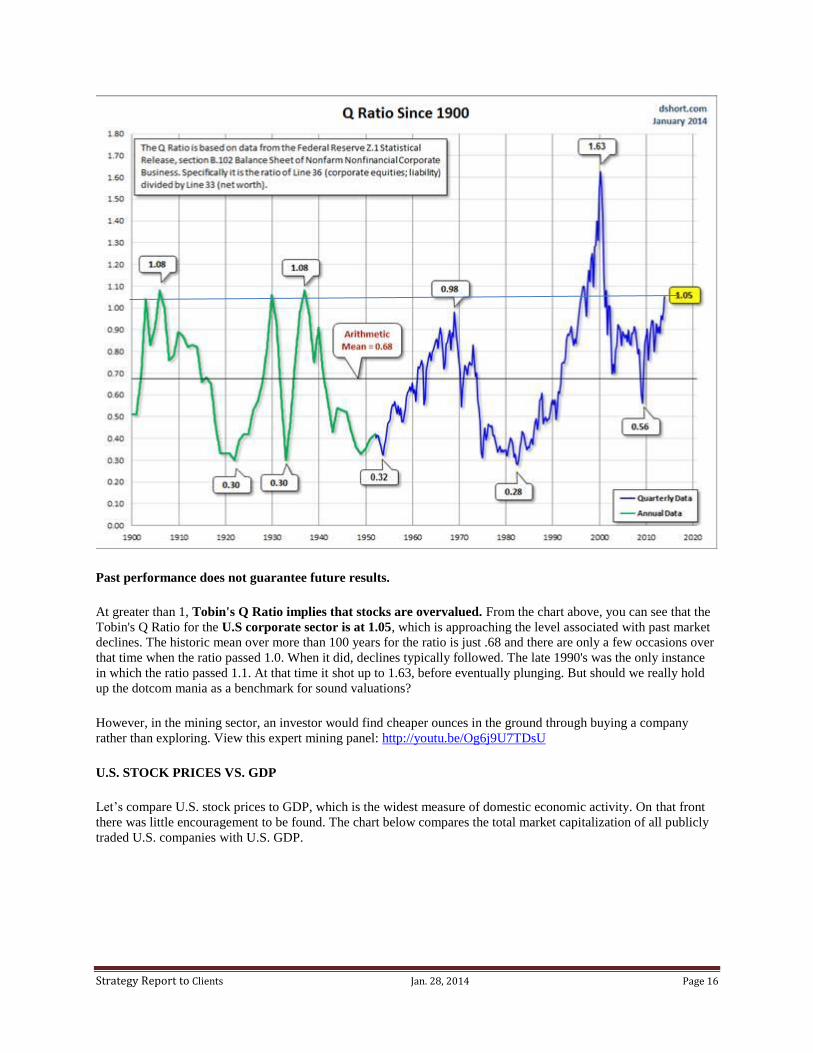
U.S. STOCK PRICES VS. CORPORATE ASSETS: TOBIN'S Q RATIO
But maybe earnings just aren't as important as they used to be. In order to try to justify current prices, I looked at
U.S. stock prices vs. corporate assets. Tobin's Q Ratio is a popular measure that compares the market value of a
company (which is a function of share price) to the amount it would cost to replace the company's assets.
So if a company owned a factory, and the market capitalization of the company was $1 million, but the factory
would cost $2 million to build today, Tobin's Q Ratio would be 0.5. The lower the ratio, the less the investor is
theoretically paying for the company's assets.
Strategy Report to Clients Jan. 28, 2014 Page 16
Past performance does not guarantee future results.
At greater than 1, Tobin's Q Ratio implies that stocks are overvalued. From the chart above, you can see that the
Tobin's Q Ratio for the U.S corporate sector is at 1.05, which is approaching the level associated with past market
declines. The historic mean over more than 100 years for the ratio is just .68 and there are only a few occasions over
that time when the ratio passed 1.0. When it did, declines typically followed. The late 1990's was the only instance
in which the ratio passed 1.1. At that time it shot up to 1.63, before eventually plunging. But should we really hold
up the dotcom mania as a benchmark for sound valuations?
However, in the mining sector, an investor would find cheaper ounces in the ground through buying a company
rather than exploring. View this expert mining panel: http://youtu.be/Og6j9U7TDsU
U.S. STOCK PRICES VS. GDP
Let’s compare U.S. stock prices to GDP, which is the widest measure of domestic economic activity. On that front
there was little encouragement to be found. The chart below compares the total market capitalization of all publicly
traded U.S. companies with U.S. GDP.

Strategy Report to Clients Jan. 28, 2014 Page 17
U.S. STOCK PRICES VS. MARGIN DEBT
Just as it's possible to buy houses with debt (mortgages), people can buy stocks with debt (it's called margin). As
stocks go higher, an increased number of investors may become tempted to tap into available margin in order to buy
appreciating assets. This is particularly true when low interest rates push down the cost of borrowing. Not
surprisingly, the chart below from the New York Times shows that stock margin debt as a percentage of GDP is
approaching the higher end of its historic range:
New York Times (5/31/2014)
U.S. STOCK PRICES VS. DIVIDEND YIELD
Of all the ways to measure stock valuations, dividend yield may be the most tangible. Evaluating dividends doesn't
require projections or assumptions, just straight math. Dividends are what investors are paid directly to own stocks.
Growth of margin debt can drive share prices higher but drive prices
lower if prices decline. Leverage works both ways. High leverage
equals higher risk.

Strategy Report to Clients Jan. 28, 2014 Page 18
Yields (which are calculated by dividing dividend payments by share price) give us a fairly good barometer of
relative value. By that metric, U.S. stocks are looking historically expensive.
Multpl.com (1/2/2014)
As you can see in the chart above, the dividend yield on the S&P 500 is the lowest it's ever been (with the exception
of the period around 1999 - there's that year again).
U.S. STOCK PRICES VS. INTEREST RATES
Ah, the Holy Grail of stock market bulls: interest rates. By definition, the present value of stocks is valued higher by
investors when interest rates are anticipated to be lower in the future (Meaning that investors are willing to pay more
for well-established income streams today in anticipation of lower rates making it more difficult to find yield in the
future).
The chart
below is also a
function of
interest rates.

Strategy Report to Clients Jan. 28, 2014 Page 19
As seen in the chart above, during the 30+ years from the early 1980s to 2013, yields on the 10-year Treasury bond
were cut in half between 1981 and 1989, from 16%. They were halved again by 2002, and again by 2011. From
there they decline another 25% before bottoming in May 2013, at 1.5%. These historic declines helped fuel an
historic rally in stocks.
Low interest rates also tend to keep corporate costs down and profits up (low rates are one of the main factors in the
current profit boom), and make stocks more attractive relative to bonds. They tend to be a further positive catalyst
for stocks. As a result of the Fed's current commitment to keep interest rates near zero for the foreseeable future,
many investors have adopted the "Don't Fight the Fed" rallying cry. (A new variant on this maxim is "As long as it's
Yellen, don't think of sellin.")
But here's the problem...interest rates remain in historically low territory and have been trending upward
slowly for the past year and a half. It's unreasonable to expect this trend to reverse and interest rates to fall once
again into record low territory. Instead, it would be more likely that rates would rise from current levels, especially
if the Fed goes through with its tapering campaign and diminishes the amount of Treasury bonds it buys on a
monthly basis (purchases that have helped keep rates low).
In the first weeks of 2014, yields on 10-year Treasuries flirted with three percent for the first time since July 2011, a
time in which the Dow Jones Industrial Average was about 23% below current levels. We could argue that the
recent increase in yields, and the likelihood that it continues, has yet to be factored into stock prices. Instead,
investors appear to be expecting permanently low rates.
IN CONCLUSION
While the above analysis is in no way exhaustive, I believe that the above metrics make a fairly solid case that
U.S. stocks are likely overvalued. I believe that the current optimism is based solely on confidence in
monetary policy and the belief that the U.S. has embarked on a period of sustained expansion. However, as Peter
Schiff has explained many times (see videos: http://youtu.be/Z0YTY5TWtmU on 2000 and 2008 busts), the
economy now shows many of the over-leveraged and delusional characteristics that existed before the recessions of
2000 and 2008. Perhaps that helps to explain why today's markets so closely resemble those periods. View
comments about today’s conditions: http://youtu.be/zkbhq36oxEE

Strategy Report to Clients Jan. 28, 2014 Page 20
Could the U.S. stock market go up from here? Of course it can. Irrational increases often go on longer than level-
headed people expect. But the longer it goes on, the more worrisome it becomes. The greater will be the
misallocation of capital. Booms require ever increasing doses of credit/easy money. Who knows how the markets
will react if the Fed has to reverse and INCREASE quantitative easing (“QE”). The game will be over? If QE is
eliminated (I’m doubtful) then the boom is over. There is no way the current situation can remain stablefa.
But while the mainstream media on Wall Street continues to paint pretty pictures, other facets of the financial
establishment are following a different script. According to a recent report from a Bank of America Merrill Lynch
analyst, while private buying of stocks has increased briskly in the past year, institutional players (the so-called
"smart money") have accelerated their sales.
Stock prices may not plummet but a repeat of the 1970’s stagflation market may occur. Sideways and volatile.
The market’s valuation: http://www.hussmanfunds.com/wmc/wmc140120.htm

Strategy Report to Clients Jan. 28, 2014 Page 21
I hope you realize how risky the market in general has become. Not all stocks are over-
priced; I am speaking in terms of the averages. On top of the stock market, there are other dangers/bubbles lurking,
real estate implosion: http://www.oftwominds.com/blogjan14/CRE-deadwood1-14.html
Of artificial profits and inflated stock markets: http://www.leithner.com.au/newsletter/feb13_newsletter.pdf
A Search for Cheapness: Precious Metals Miners at all-time lows.
In my search for cheap companies, I came across precious metal mining companies. It was a hated asset class
because of declining gold and silver prices plus mining companies had underperformed the rise in metals’ prices due
to poor acquisitions, dilutive share issuance, overexpansion, etc. As I dug further, I saw that declining prices were
forcing management changes to focus on returns on capital and not just growth for growth’s sake. And gold, as
money that can’t be debased, is the best store of value in a currency war, credit crisis or hyper inflationary event.
No matter what metrics you use, miners are at historically low prices. Let's Get Physical: gold bullion and Bitcoin |
Tocqueville and Gold Monitor (please click through).
Empirical Evidence of Cheapness/Undervaluation
Recently Goldcorp made a hostile bid for a high cost miner, Osisko, at a price premium that would give certain
companies in our portfolios a 100% higher price. http://business.financialpost.com/2014/01/20/osisko-board-rejects-
goldcorp-hostile-bid/. This is the beginning of empirical evidence that our assets are too cheap relative to their future
cash flows and properties. I expect that over the next eighteen months we will see many more takeovers as the
industry consolidates. Meanwhile, weak companies will fold. All that helps our portfolio since we own well-
capitalized producers and projects.
The Hui Gold Mining Index daily chart of a nine month bottom.
The rising blue line indicates that
gold prices are going up more or
down less than the Barrons Gold
Mining Index (BGMI). Prices
recently touched the third lowest
price (miners in terms of gold and
silver prices) in over 90 years.
Veteran observers say the miners
have been in the worst bear market
in 35 years!
Or this could be a once in a
generation opportunity to buy
cheaply.

Strategy Report to Clients Jan. 28, 2014 Page 22
Gold (GLD) relative to
Miners (HUI)
Note that miners
underperformed the gold
price after 2008. Miners
sought growth without
considering return on
capital. That thinking
has changed as 70% of
all management CEOs at
major miners have been
changed.
The cure for low prices is low
prices. The laws of economics
grind slowly.
The day to day volatility has
been huge, but Mr. Market is a
voting machine not a weighing
machine. If you are not a
contrarian , you are a victim.
Strategy Report to Clients Jan. 28, 2014 Page 23
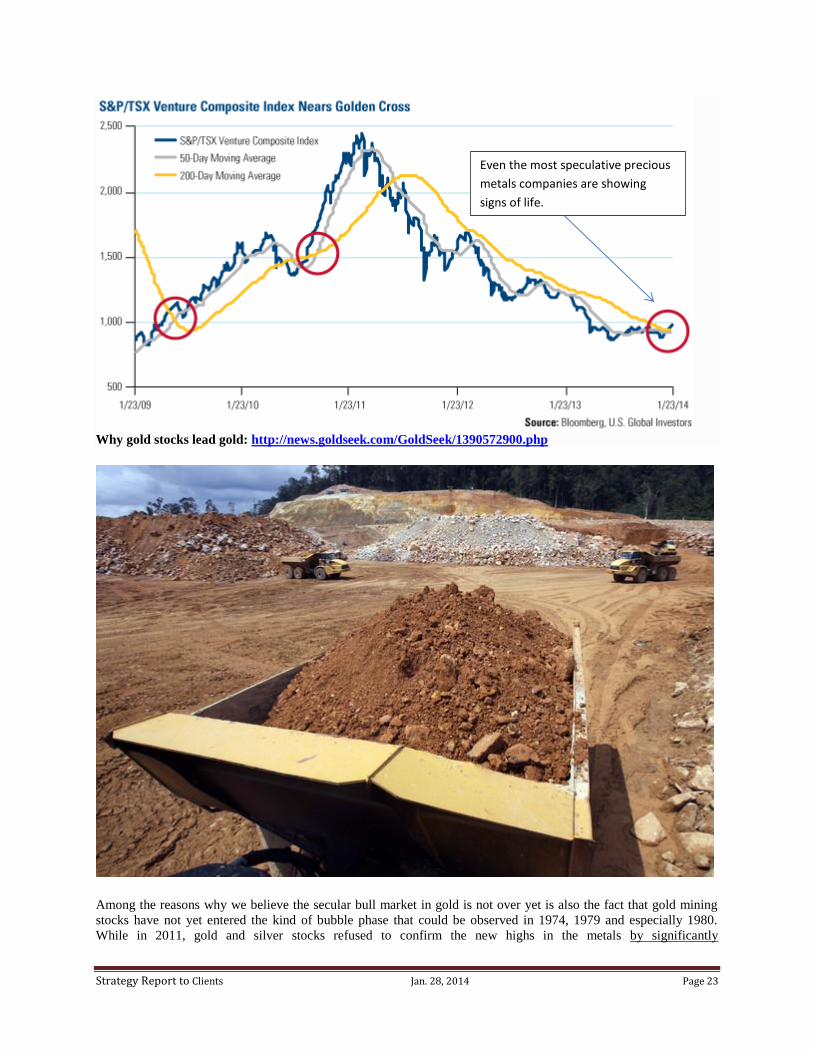
Why gold stocks lead gold: http://news.goldseek.com/GoldSeek/1390572900.php
Among the reasons why we believe the secular bull market in gold is not over yet is also the fact that gold mining
stocks have not yet entered the kind of bubble phase that could be observed in 1974, 1979 and especially 1980.
While in 2011, gold and silver stocks refused to confirm the new highs in the metals by significantly
Even the most speculative precious
metals companies are showing
signs of life.

Strategy Report to Clients Jan. 28, 2014 Page 24
underperfoming in the latter stages of the rally, something qualitatively slightly different happened at the end of the
1970s bull market. While the shares of mining companies also underperformed during the rally that peaked in
January 1980, they subsequently rose to higher highs concurrently with gold and silver putting in secondary lower
peaks in September of 1980. In short, there was a great deal of enthusiasm for the sector shortly after the bull market
had actually ended. This is the polar opposite of what could recently be observed – in fact, gold stocks haven't
declined this much relative to the price of gold in more than seven decades:
However, as the picture above shows, mining is very capital intensive and cyclical. Note the huge swings in price in
the long-term HUI chart. I believe we have bottomed.
Note that a few of our companies like Royal Gold (Royalty company) bottomed in late June 2013 versus Dec. 30 for
the index of miners
The important point is that the market is bifurcating between strong companies versus weaker companies. My
strategy is to be well diversified within the mining sector. A 5,000 year industry can’t be eliminated, but individual
companies can.

Strategy Report to Clients Jan. 28, 2014 Page 25
GOLD’s Fundamentals Are Strong
Gold is moving into strong hands.
Here are briefly the factors which we believe to be the main drivers of the cyclical bear market from the early
September 2011 high. First of all, at the 2011 high, there was a large premium embedded in the gold price as
a result of the euro area debt crisis. This combined sovereign debt/banking system crisis was likely a very
important factor driving the rally from about $1,200 to $1,900. This 'crisis premium' was subsequently lost,
something that was also mirrored in 'safe haven currencies' like the Swiss franc and the yen (it is interesting in this
Gold tonnage moving from Western
investors hands in ETFs to Asia.
Speculative interest that both drove
prices up from $1,000 to $1,900 down
to $1,179 is now very low. The worst
may be over.
Strategy Report to Clients Jan. 28, 2014 Page 26
context that the interim peaks in gold in 2012 all coincided with major central bank announcements aimed at
getting both real and imagined crisis situations under control).
Secondly, the US federal deficit has begun to decline from its previous record highs (However, the total debt
continues to compound and grow). This has received very little attention, but we tend to believe that it is one of the
factors playing a role in determining gold's price trend (it is fairly easy to figure out why: the larger the deficit, the
greater the probability that it will be financed by central bank monetization, notwithstanding official
protestations to the contrary).
Thirdly, inflation expectations have incongruously declined quite sharply in 2013, but without entering the
'deflation scare' zone. Such an environment of declining expectations regarding future CPI rates of change tends to
be bearish for gold. We are not saying that these expectations will turn out to be correct – we merely note that this is
what could be observed.
And finally, expectations regarding the state of the economy have become as distorted as the economy itself. There is now an almost unanimous consensus among economists, Wall Street strategists and in the financial press
that we are on the cusp of what could be termed 'business as usual', i.e., a 'normal' economic expansion. This
consensus is even more deeply entrenched than the bearish consensus on gold, and it seems highly likely that it will
turn out to be quite misguided. This won't necessarily happen immediately, but it will as soon as 'tapering' leads to a
distinct slowdown in money supply growth.
To us it is just amazing that people seriously believe that following the biggest financial crisis since the 1930s and
right after the biggest money supply and debt expansion since the end of WW2 (which was accompanied by the
weakest 'recovery' of the entire post WW2 era to boot), we are about to return to something
resembling 'normalcy'. That strikes us as a case of wishful thinking (the image that suggest itself is that
of a herd of buffalo in the African plains that thinks the pride of lions that was stalking it is gone because it
has temporarily ducked behind a copse of trees).
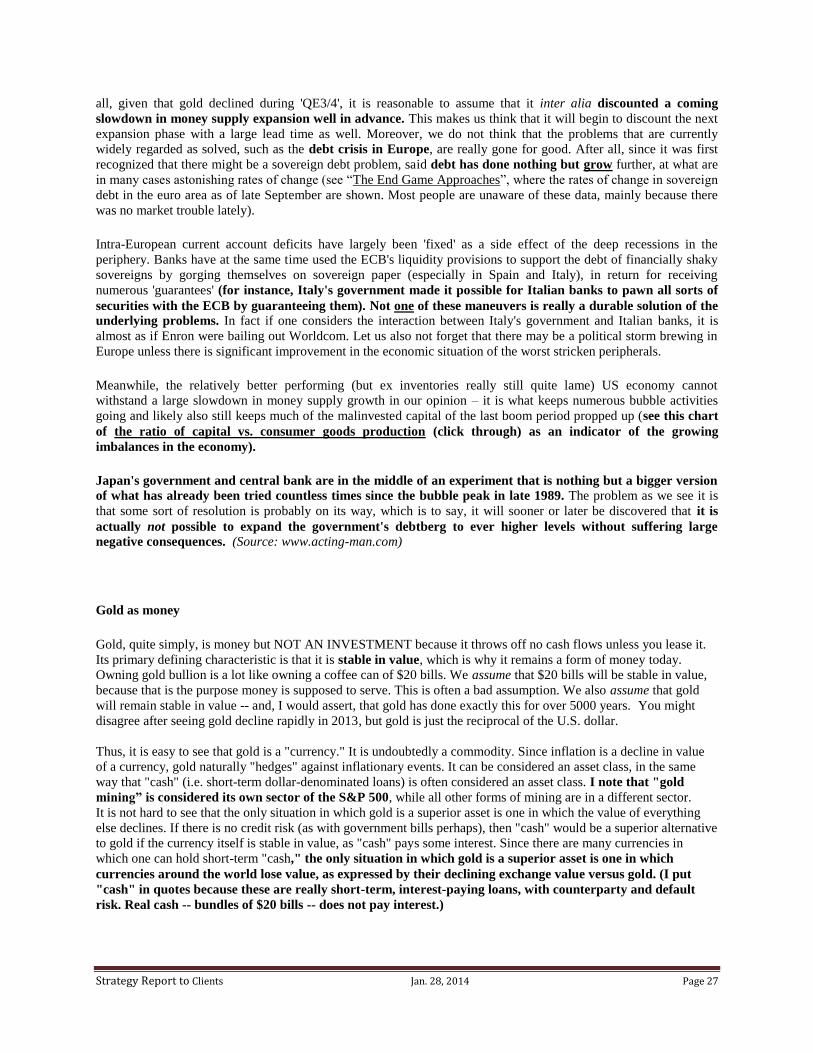
Gold from 1999 to 2014 – once again, many triangles have formed on the way up, followed by a large triangle
preceding the recent cyclical bear market – we believe the last triangle and the bear market since then is a somewhat
expanded 1975-1976 analog – click to enlarge.
Possible Future Developments
Considering all of the above factors, we have formed an opinion as to what is likely going to happen over the next
few years. Of course you should take this opinion with a grain of salt – we may well turn out to be wrong. First of
Strategy Report to Clients Jan. 28, 2014 Page 27
all, given that gold declined during 'QE3/4', it is reasonable to assume that it inter alia discounted a coming
slowdown in money supply expansion well in advance. This makes us think that it will begin to discount the next
expansion phase with a large lead time as well. Moreover, we do not think that the problems that are currently
widely regarded as solved, such as the debt crisis in Europe, are really gone for good. After all, since it was first
recognized that there might be a sovereign debt problem, said debt has done nothing but grow further, at what are
in many cases astonishing rates of change (see “The End Game Approaches”, where the rates of change in sovereign
debt in the euro area as of late September are shown. Most people are unaware of these data, mainly because there
was no market trouble lately).
Intra-European current account deficits have largely been 'fixed' as a side effect of the deep recessions in the
periphery. Banks have at the same time used the ECB's liquidity provisions to support the debt of financially shaky
sovereigns by gorging themselves on sovereign paper (especially in Spain and Italy), in return for receiving
numerous 'guarantees' (for instance, Italy's government made it possible for Italian banks to pawn all sorts of
securities with the ECB by guaranteeing them). Not one of these maneuvers is really a durable solution of the
underlying problems. In fact if one considers the interaction between Italy's government and Italian banks, it is
almost as if Enron were bailing out Worldcom. Let us also not forget that there may be a political storm brewing in
Europe unless there is significant improvement in the economic situation of the worst stricken peripherals.
Meanwhile, the relatively better performing (but ex inventories really still quite lame) US economy cannot
withstand a large slowdown in money supply growth in our opinion – it is what keeps numerous bubble activities
going and likely also still keeps much of the malinvested capital of the last boom period propped up (see this chart
of the ratio of capital vs. consumer goods production (click through) as an indicator of the growing
imbalances in the economy).
Japan's government and central bank are in the middle of an experiment that is nothing but a bigger version
of what has already been tried countless times since the bubble peak in late 1989. The problem as we see it is
that some sort of resolution is probably on its way, which is to say, it will sooner or later be discovered that it is
actually not possible to expand the government's debtberg to ever higher levels without suffering large
negative consequences. (Source: www.acting-man.com)
Gold as money
Gold, quite simply, is money but NOT AN INVESTMENT because it throws off no cash flows unless you lease it.
Its primary defining characteristic is that it is stable in value, which is why it remains a form of money today.
Owning gold bullion is a lot like owning a coffee can of $20 bills. We assume that $20 bills will be stable in value,
because that is the purpose money is supposed to serve. This is often a bad assumption. We also assume that gold
will remain stable in value -- and, I would assert, that gold has done exactly this for over 5000 years. You might
disagree after seeing gold decline rapidly in 2013, but gold is just the reciprocal of the U.S. dollar.
Thus, it is easy to see that gold is a "currency." It is undoubtedly a commodity. Since inflation is a decline in value
of a currency, gold naturally "hedges" against inflationary events. It can be considered an asset class, in the same
way that "cash" (i.e. short-term dollar-denominated loans) is often considered an asset class. I note that "gold
mining” is considered its own sector of the S&P 500, while all other forms of mining are in a different sector.
It is not hard to see that the only situation in which gold is a superior asset is one in which the value of everything
else declines. If there is no credit risk (as with government bills perhaps), then "cash" would be a superior alternative
to gold if the currency itself is stable in value, as "cash" pays some interest. Since there are many currencies in
which one can hold short-term "cash," the only situation in which gold is a superior asset is one in which
currencies around the world lose value, as expressed by their declining exchange value versus gold. (I put
"cash" in quotes because these are really short-term, interest-paying loans, with counterparty and default
risk. Real cash -- bundles of $20 bills -- does not pay interest.)

Strategy Report to Clients Jan. 28, 2014 Page 28
In practice, when the world's primary currency loses value significantly, it is all-but-impossible for other currencies
not to follow it lower. This was true in the 1930s, when Britain began a worldwide cycle of devaluation, and it was
true in the 1970s, when the US began a worldwide cycle of devaluation. The reason for this is simply that other
countries cannot bear the effects of exchange rate changes caused by these devaluations. Eventually, political
pressure builds to keep exchange rates relatively stable. The yen was pegged to gold at 12,600/oz. of gold and
ÔøΩ360/dollar in 1970, when the dollar was worth 1/35thounce of gold
. In 1980, with the dollar at $850/oz., if the
yen had remained pegged to gold, the yen/dollar exchange rate would have been 114.8/dollar. "Free trade"
would not have been possible under such circumstances, as the Japanese economy would have been crushed
by cheap imports and unfair competition.
It may rankle many to consider that gold's value doesn't change significantly -- by more than perhaps 10% either
way. Isn't it driven by a "wave of investor mania?" Doesn't it "decouple from currencies?" What about the incredibly
short and sudden spike to $850/oz. back in 1980? Certainly that was a case of a gold "bubble," no?
This is because you are assuming that $20 bills are stable in value, and gold is not. Which, as noted previously, is
exactly the opposite of reality. Gold is stable money, and $20 bills are a floating currency.
However, if it is true that gold is a stable measure of value, then when "gold goes up" it means that the value of
the currency measured against gold goes down. When a currency's value declines, markets will naturally adjust to
this reality, and it will tend to take more dollars to buy all manner of goods and services. In other words, a) if gold
"goes up" and there is no accompanying evidence of "inflation," that may be a sign of gold's value changing, but b)
if "gold goes up" and there is accompanying evidence of "inflation," that is evidence that the currency's value has
fallen while gold's value has remained essentially unchanged.
While the major currencies typically don't move much against each other in an average week, currencies are
certainly capable of tremendous and sudden changes in value. Let's look at the Indonesian rupiah (IDR) during
1998-2000.
The great gold boom (dollar bust) of 1980 was also pretty wild, but ultimately not that much different than the
rupiah bust of 1998.

Strategy Report to Clients Jan. 28, 2014 Page 29
In 1998, the dollar had been rising against gold.
But, if you were an Indonesian, gold was soaring in 1998, its price more than quintupling!
In short, I am proposing that the 1979-1980 "gold event" was really a dollar panic, very much like the rupiah
panic of 1998. They were resolved much the same way -- with Paul Volcker taking a hawkish, monetarist-tinged

Strategy Report to Clients Jan. 28, 2014 Page 30
stance to support the currency in 1980, and the Indonesian central bank taking a hawkish, monetarist-tinged stance
to support the currency in 1998. As you can see, they played out very similarly in a technical sense.
The remainder of this exercise would be to show that prices for all sorts of things, in dollar terms, were rising in or
soon after 1980, showing that the "rise in gold" was indeed a decline in the dollar's value. We won't look at most of
the usual suspects -- CPI, interest rates, PPI, crude prices, etc., etc., -- now, but be assured that "inflation," as
popularly conceived, was a big deal at the time, and intensified greatly during this time. In short, virtually
everything you can point to reinforce the idea that gold is stable while the dollar varies in value. At some point,
we may look into this is more depth. To begin with, here is a comparison of the dollar's value vs. gold and the
dollar's value versus a wide range of industrial commodities, represented by the CRB commodities index.
See how stable commodity prices are when the money is stable in value? Flat as a pancake for most of the Bretton
Woods gold-standard era.
Do you see how the dollar's value vs. gold leads changes in the dollar's value versus other commodities? This
is particularly apparent in the 1980-present period. In his book The Golden Constant, Roy Jastram found that this
pattern holds for over 400 years. I suppose some would complain that commodities didn't actually rise much in the
1979-1980 period. This is likely because economies were rather depressed at the time, and also because the spike to
$800+/oz. was so brief. Basic commodities tend to lag the dollar/gold ratio by a few months to a year or two. The
commodities futures market shows a dramatic spike during this time.

Strategy Report to Clients Jan. 28, 2014 Page 31
Gold is "money." We call it "money" because it is stable in value, and that's the quality we want in our money.
Because gold is stable in value, we used gold as the foundation of monetary systems for hundreds of years,
until 1971, and it worked just fine. Other than that, it's just a chunk of metal. Not an investment.
----
There's no return on capital. But, if you're interested in return OF capital, it is the King
of Kings. Gold is an interesting speculation at only one time: when currencies are losing value. And not only
that: if one currency, like the Indonesian rupiah in 1998, is losing value, then you can go to a currency that is not
losing value, like the US dollar in 1998. That would be more profitable than gold, as it pays some interest. So, the
only period in which gold is an attractive speculation is when all currencies are losing value, which typically
takes place when the major international currencies lose value. Thus, we need to look toward the currency
managers, central banks, to manage our gold speculation effectively. Today, especially in the US, it appears that
central banks are not only complacent regarding the worsening inflation, they are outright negligent. Ben Bernanke
built his career on the notion that the Great Depression could have been averted by a brisk inflation in the early years
of the 1930s. It's false, and Ben Bernanke is going to prove it today.
Eventually, people get it. The value of their currency is collapsing. It takes more and more ... dollars, marks, yen,
whatever ... to buy an ounce of gold. The only apparent way to preserve financial value is to own gold, or some
foreign currency that is stable in value. When the entire world is inflating, as was the case in the late 1970s,
and there are no foreign currencies that are reliable, then gold is the only option. The "demand" for paper
currency collapses, causing its value to collapse, and the "price of gold" soars.
Unlike most anything else out there that one could invest or speculate in, gold does not have a valuation. It is
never expensive or cheap. It might be overbought or oversold, or some such thing, which is really a way of
saying that a floating currency compared to gold is oversold or overbought. Gold is money. It is money
because its value is stable.
Thus, there can never be a "bubble" in gold. A "bubble", at the very least, must be a period when people pay far
more for an asset than it is worth. What's gold worth? One ounce of gold is worth....one ounce of gold. It's money.
It's also true that there are times when it is extremely beneficial to speculate in gold (1971-1980) and times
when it is extremely unrewarding (1980-2002). But you could say the same thing about dollar bills in a coffee can
(a wonderful investment in 1929-1932, a terrible one in 1970-1980). That's really just the paper equivalent of

Strategy Report to Clients Jan. 28, 2014 Page 32
stuffing gold in a vault in Zurich. In 1923, during the German hyperinflation, it is said that a hotel was purchased for
one ounce of gold. The price of one ounce of gold, in Germany, reached about 84 trillion marks. Yet, in 1923 one
ounce of gold was $20 in the US, as had been the case for the past 134 years. Was there a bubble in Germany but
not in the US, for the same easily transported, easily traded item?
Most all investible assets can be valued on some cash flow basis. This is true of stocks and bonds, of course, and real
estate, which constitute among them the vast majority of assets worldwide. Gold has no cash flow. Other
commodities can be valued ultimately on their usefulness. This translates into a demand, which is balanced by a
supply, which is closely related to production cost. Gold's value is ultimately related to production cost as well, but
because annual production is a tiny fraction of available holdings (less than 2% these days), changes in production
have little effect on gold. If all gold production ceased for the next ten years, nothing in particular would happen.
There would never be a shortage of gold, because it is never "consumed." On the demand side, nobody needs to buy
gold either, for industrial purposes. (A tiny amount is used in electronics.) Gold is useful, of course. It is useful as
money. One of the requirements of money is that it is not useful (at least at its present value) for anything but
money. You can see this is true of dollar bills as well. Nobody uses them as anything but money. (Source: Nathan
Lewis)
Meanwhile, the cognoscenti of Wall Street opine that Gold will decline.
Dec. 31, 2013, 5:35 p.m. EST
Gold’s prospects in 2014 look tarnished
Commentary: Gold prices fell 28% in 2013 and 2014 may be another year of loss
Gold will average $1,209 an ounce this year, judging by recent forecasts from six big banks.
This is another good sign—dour sentiment. We have gold moving from West (speculative hands in the ETFs) to
the East (China and India, the strong hands); government debt is growing, currency wars are raging as Japan
destroys its currency, the stock market/real estate has high risks while a stable form of money, gold, is hated.
Regardless of whether gold rallies, precious metals miners are set to improve their values due to their extreme
undervaluation relative to their product prices. However, if the US government became serious about not
intervening in free markets and tackled entitlements, debt and deficits, then my strategy would need to change
quickly. Let’s hope that day comes.
I have thrown many charts, graphs, and descriptions at you. Please call with any questions, especially where you
disagree. Your individual reports will follow. END. --