Embed Size (px)
Citation preview
Program Design and Evaluation Services
Client Satisfaction with Case Management Services: Ryan White Part B Service Area
Results from the 2007 Survey Prepared by: Linda Drach Tim Holbert
December 28, 2007
Program Design and Evaluation Services
800 NE Oregon Street, Suite 550 Portland, OR 97232
Client Satisfaction with HIV Case Management Services in the Part B Service Area: Results from the 2007 Survey
1
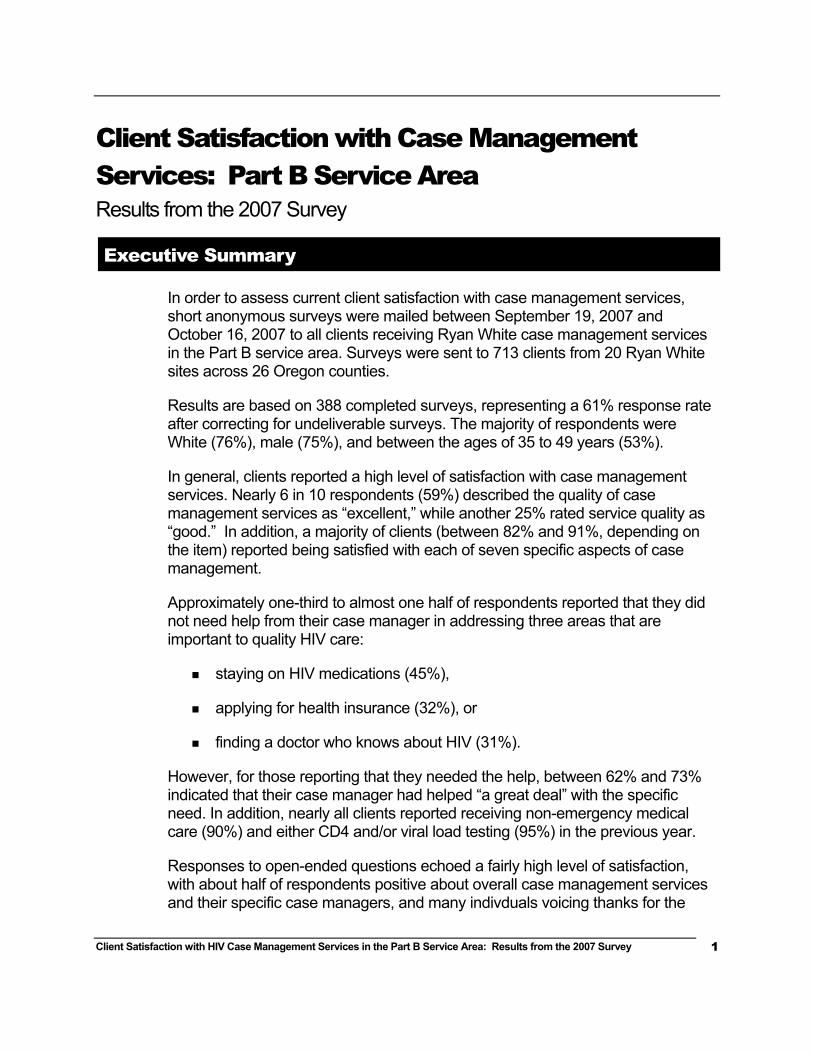
Client Satisfaction with Case Management Services: Part B Service Area Results from the 2007 Survey
Executive Summary
In order to assess current client satisfaction with case management services, short anonymous surveys were mailed between September 19, 2007 and October 16, 2007 to all clients receiving Ryan White case management services in the Part B service area. Surveys were sent to 713 clients from 20 Ryan White sites across 26 Oregon counties.
Results are based on 388 completed surveys, representing a 61% response rate after correcting for undeliverable surveys. The majority of respondents were White (76%), male (75%), and between the ages of 35 to 49 years (53%).
In general, clients reported a high level of satisfaction with case management services. Nearly 6 in 10 respondents (59%) described the quality of case management services as “excellent,” while another 25% rated service quality as “good.” In addition, a majority of clients (between 82% and 91%, depending on the item) reported being satisfied with each of seven specific aspects of case management.
Approximately one-third to almost one half of respondents reported that they did not need help from their case manager in addressing three areas that are important to quality HIV care:
staying on HIV medications (45%),
applying for health insurance (32%), or
finding a doctor who knows about HIV (31%).
However, for those reporting that they needed the help, between 62% and 73% indicated that their case manager had helped “a great deal” with the specific need. In addition, nearly all clients reported receiving non-emergency medical care (90%) and either CD4 and/or viral load testing (95%) in the previous year.
Responses to open-ended questions echoed a fairly high level of satisfaction, with about half of respondents positive about overall case management services and their specific case managers, and many indivduals voicing thanks for the
Client Satisfaction with HIV Case Management Services in the Part B Service Area: Results from the 2007 Survey
2
services they receive. About half of respondents offered suggestions for improvement. Client-identified themes for quality improvement included:
improving the types or amounts of services offered (e.g. provide more help with transportation or food, provide more specialized information about HIV services or issues),
improving the HIV service system (e.g. increase funding, decrease bureaucracy),
improving customer service (e.g. more communication, prompt responses to requests), and
increasing staff and decreasing staff turnover.
Clients with fewer contacts with their case managers and clients that characterized the number of past-year case management contacts as “too few” were significantly less satisfied with the overall quality of case management services and with each of the seven satisfaction items (e.g. location, promptness, professional knowledge) than clients with more contact.
Women were less satisfied with the overall quality of service than were men, although no gender differences emerged when examining the individual satisfaction items, which makes this finding difference difficult to interpret, and important to monitor. There were no reported differences in satisfaction with overall quality or perceived helpfulness of case management services by age, race/ethnicity, region, years since HIV diagnosis, or length of time in case management.
Clients in 2004, 2005, and 2007 reported high levels of satisfaction with the overall quality and helpfulness of HIV case management services, although, in each year, clients with less case management contact have been significantly less satisfied with the services they received. In addition, there were no meaningful changes across years in satisfaction with the seven specific aspects of case management services, such as promptness, location, and professional knowledge of staff.
Client Satisfaction with HIV Case Management Services in the Part B Service Area: Results from the 2007 Survey
3
Background
Oregon's DHS HIV Client Services Program contracted with Program Design and Evaluation Services (PDES) to conduct an evaluation of HIV case management services in the Part B service area. The Health Resources & Services Adminsitration (HRSA), which administers Ryan White CARE Act funding, requires states receiving funding to regularly evaluate their programs. At the time of survey administration, there were 20 Ryan White sites for case management services, serving 713 clients across the 26 counties included in Oregon’s Part B service area.
The purpose of this survey was to:
Describe clients receiving case management services in the Part B service area,
Describe clients’ level of satisfaction with core features of case management services (including location and accessibility, promptness of service, empathy and listening skills, privacy, competence, knowledge of community resources, and respect),
Describe clients’ perceptions of the effectiveness of case managers in helping with typical client needs (including dealing more effectively with problems, finding a doctor, applying for health insurance, and staying on HIV medications),
Determine which respondent characteristics are associated with client satisfaction with case management services and with the perceived efficacy of case management in dealing with clients’ problems, and
Track changes in client satisfaction over time by comparing results with similar surveys conducted in 2004 and 2005.
Client Satisfaction with HIV Case Management Services in the Part B Service Area: Results from the 2007 Survey
4
Methods
Survey Instrument
Data were collected through a short, self-administered, anonymous mailed survey. The questionnaire posed 17 close-ended questions about satisfaction with case management, health status, and service utilization. Two open-ended questions asked respondents to provide the one thing that would most improve the quality of case management services, as well as to spontaneously share any other comments about case management services. Appendix A displays a copy of the survey along with overall results.
Clients dually enrolled in Part B HIV case management and the Oregon Housing Opportunities Program (OHOP) (n=92) also received a copy of the OHOP client satisfaction survey, which contained 26 additional items. The surveys were sent together to reduce client burden and the overall cost of administering the surveys. Results from the OHOP survey are presented in a separate report.
Survey Distribution
Surveys were provided to all clients living outside the Portland Transitional Grant Area (TGA) who were receiving HIV case management services through the Part B Ryan White program. Survey packets were prepared by PDES staff and mailed in bulk to case managers, who checked the addresses for validity and then distributed surveys to individual clients through the mail. Eight surveys were hand delivered to clients.. A $2 cash incentive was included with each survey. Clients were given postage-paid envelopes and instructed to return the anonymous surveys directly to PDES. Survey materials were sent to case managers on September 10, 2007. Case managers distributed surveys to clients September 19 through October 16, 2007. Most surveys were distributed by case managers in late September, but one county was not able to send surveys out until the middle of October due to staff shortages. Clients returned the surveys September 18 through December 7, 2007. The cut-off date for accepting completed surveys was December 7, 2007.
Return Rate
PDES received a total of 390 completed surveys, for an overall return rate of 61%. Two returned surveys were not included in the analysis because more than 50% of the items were not filled out. The second mailing helped raise the overall return rate from 46%. Based on tallies made by case managers, surveys were
Client Satisfaction with HIV Case Management Services in the Part B Service Area: Results from the 2007 Survey
5
sent to a total of 639 eligible clients1 (not including 63 clients whose surveys were returned as undeliverable or whose surveys could not be mailed and were not picked up at the case management site).
There were no significant differences between responders to the survey and non-responders with respect to gender, race/ethnicity, or region. There was a significant association between age and survey response with a higher proportion of older clients responding to the survey.
Analysis
The final dataset used for analysis included 388 of the 390 surveys returned to PDES.2 Data were analyzed using SPSS v15 for Windows©. The primary analysis was descriptive. We also explored whether there were differences in satisfaction with the overall quality of case management services across the following respondent characteristics: gender, age, ethnicity, region, length of time since HIV and AIDS (if appropriate) diagnoses, and objective and subjective number of contacts with case manager. Because of very few respondents in some subgroups, it was necessary to combine clients into larger, less-specific groups for purposes of these comparisons. For example, clients living in a large geographic area comprised of 13 counties east of the Cascades were combined into a group referred to as “Columbia/Eastern.” It was also necessary to create a three-way division across race/ethnicity, which we refer to as “ethnicity”: 1) White/non-Hispanic (which we refer to as “White”), 2) Hispanic, and 3) “all others” (combining across remaining ethnicity groups—Black, Asian, American Indian, or Multi-racial).
For these subgroup analyses, we performed Chi Square tests and used the traditional statistical cutoff of p < .05 as indication of statistically significant differences between groups. We tested for statistically significant differences between subgroups across nine survey items—the seven specific items related to satisfaction, the perception of overall quality of case management services, and the perceived helpfulness of case management in addressing clients’ problems. The satisfaction response categories for these questions were collapsed into two options (e.g., satisfied versus not satisfied, as were the perceived helpfulness questions (e.g., yes vs. no).
Percentages presented throughout the report are rounded to the nearest whole number and only include valid responses (e.g. missing data are excluded from the denominator). Most items had few missing data, so there is little difference
1 713 surveys were sent to case managers; 11 surveys were not sent to clients because case managers determined that the clients were ineligible (e.g. had received no services in past 12 months, moved out of state, deceased); 63 surveys were returned as undeliverable. 2 Two surveys were excluded from analysis because they contained greater than 50% missing data.
Client Satisfaction with HIV Case Management Services in the Part B Service Area: Results from the 2007 Survey
6
between valid and actual percentages. All actual percentages, including the number and percentage of missing responses, are shown in Appendix A.
One staff member coded qualitative data from the two open-ended questions into distinct themes identified in the statements, and then combined the themes into overall categories. Some responses indicated the presence of more than one distinct theme. In those cases, all themes were coded. Themes were grouped into primary and secondary themes, depending on the degree of resonance among participants.
Findings
Demographic Characteristics of Respondents
Of the 388 respondents, 75% identified as male, 24% as female and <1% (n=1) as transgender. Respondents ranged from 19 to 76 years old, with an average age of 46 years. Just over half of clients (53%) were between 35 and 49 years old and approximately another third (33%) were over 50 years old. A majority of respondents (76%) identified as non-Hispanic White, while 14% identified as Hispanic/Latino. Only ten percent (n=39) of clients identified as American Indian/Alaskan Native, Black/African-American, Asian, Pacific Islander, or more than one race, so these categories were combined for analysis.
Health Status and Medical Care Utilization of Respondents
A large proportion of respondents had been living with HIV for a number of years. Fewer than 1 in 5 clients (19%) had been diagnosed within the past five years, while 21% had been diganosed 6-10 years ago, 24% were diagnosed 11-15 years ago, and the largest proportion (31%) had been diagnosed more than 15 years ago.
Ninety percent of respondents stated that they had received non-emergency medical care in the past 12 months, and 95% said they had received a CD4 or viral load test during the same time period. Seventeen percent of clients reported being without health insurance for at least some period of time in the preceding year.
Region
When broken down across geographic area, most clients lived in the region defined as “I-5 Corridor” (71%). Other defined regions were “Coastal” (9%), “Central” (12%), and “Columbia/ Eastern” (10%).
Client Satisfaction with HIV Case Management Services in the Part B Service Area: Results from the 2007 Survey
7
Contact with Case Manager
Forty one percent of resondents had been seeing an HIV case manager for more than 5 years, 20% had been in case management for 3 to 5 years, 26% for 1 to 3 years, and 12% for less than one full year.
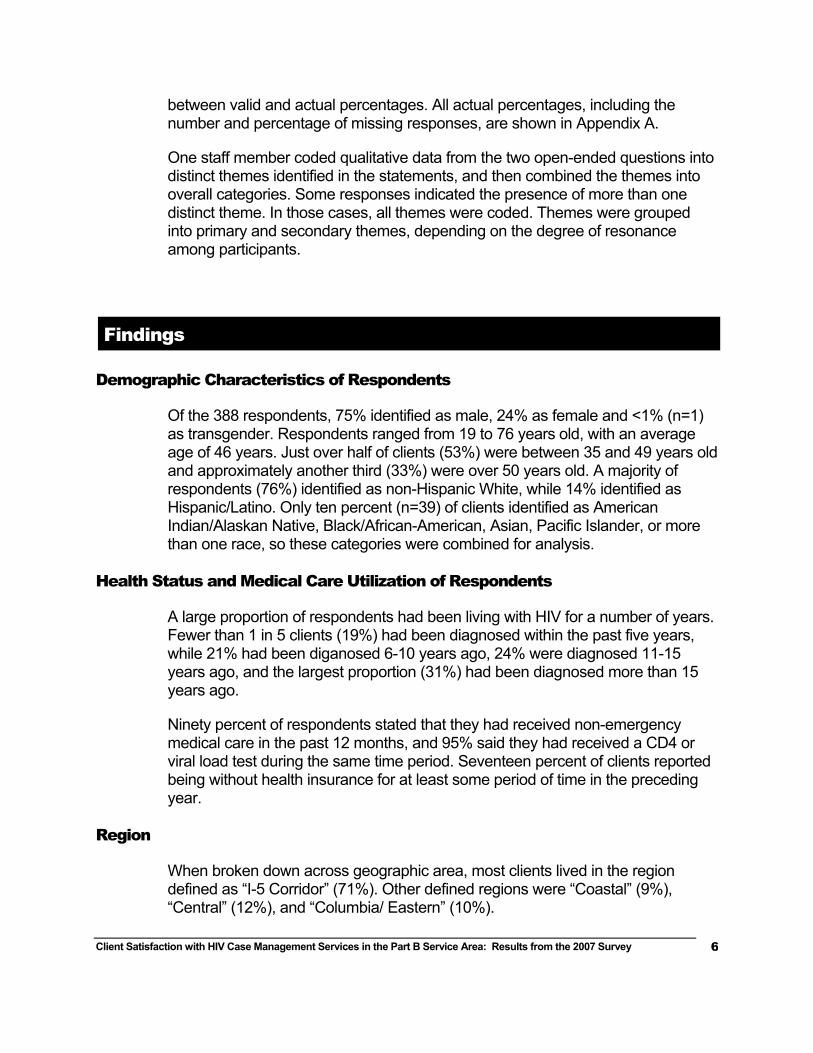
Respondents were asked approximately how many contacts, both phone and face-to-face, they had with their case manager in the past 12 months. Almost half of respondents (46%) had one to four contacts with their case manager in the previous year, up from 38% in 2005. However, 17% had 13 or more past-year contacts, reflecting the large variety of case manager time spent across different clients in their caseloads. Figure 1 shows the total breakdown for the distribution of client-case manager contact.
In 2004, a client’s number of contacts with his or her case manager was associated with satisfaction with services, with those reporting fewer past-year contacts reporting less satisfaction. Therefore, in 2005, we included an additional subjective item that asked how clients felt about the amount of contact they had with their case managers, and we included this item again in 2007. Most clients (76%) felt they had “just the right amount” of contact with their case manager, while a smaller, but notable portion (20%) characterized the number of contacts with their case manager as “too few.” Most clients (87%) who reported “too few” contacts saw their case manager 6 times or fewer in the preceding 12 months and, not surprisingly, clients who reported “too few” contacts were significantly more likely to have fewer contacts than those who felt they had “just the right number” (p<.001). Only 6 individuals (2%) felt they’d had “too many” contacts with their case manager in the preceding 12 months, the same proportion as in 2005.
Figure 1. Number of Reported Contacts with Case Manager in Past 12 Months
4%
28%
19%
15%
18%
17%
0% 5% 10% 15% 20% 25% 30%
none
1-2
3-4
5-6
7-12
13+
Num
ber o
f Con
tact
s
Valid Percent
Client Satisfaction with HIV Case Management Services in the Part B Service Area: Results from the 2007 Survey
8
Satisfaction with Overall Quality of Case Management Services
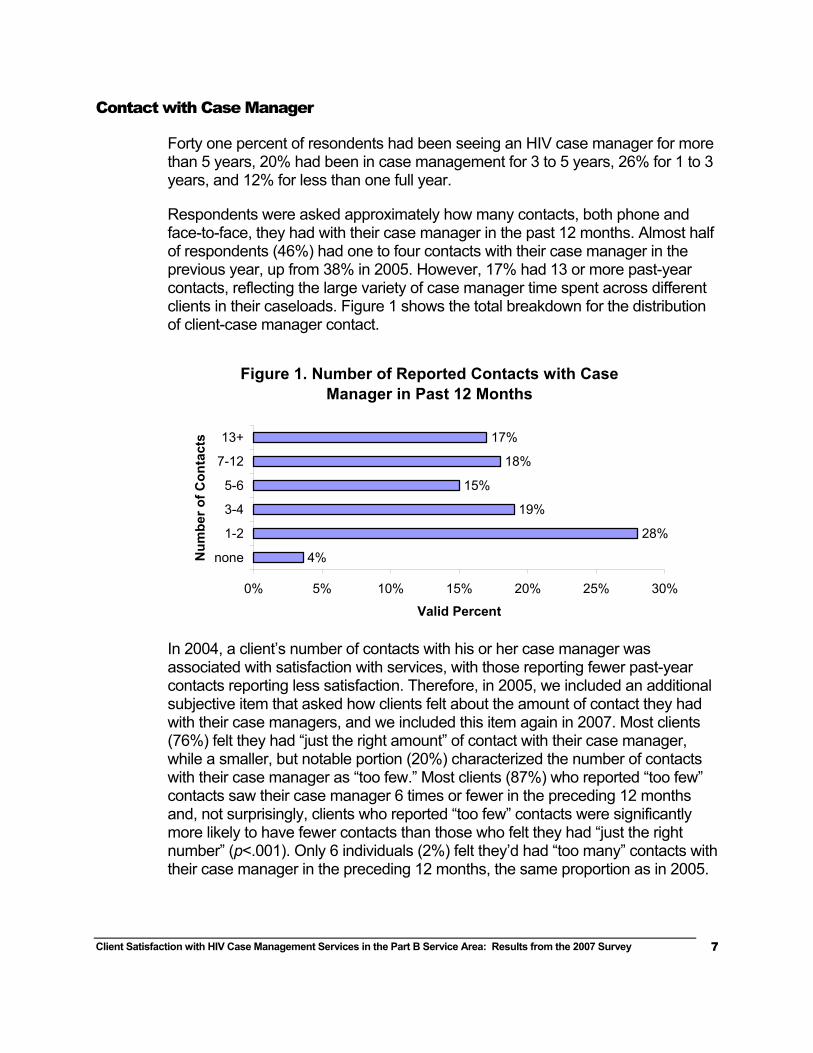
More than half (59%) of the respondents rated the overall quality of case management services as “excellent,” while one quarter (25%) rated services as “good” (see Figure 2 below); in other words, a majority of clients (84%) were pleased with the overall quality of case management services. The proportion rating the quality of services as good or excellent is the same as was reported in 2005.
Figure 2. Quality Rating of Case Management
5%10%
25%
59%
0%
20%
40%
60%
Poor Fair Good Excellent
Quality Rating
Valid
Per
cent
Satisfaction with Seven Specific Aspects of Case Management Services
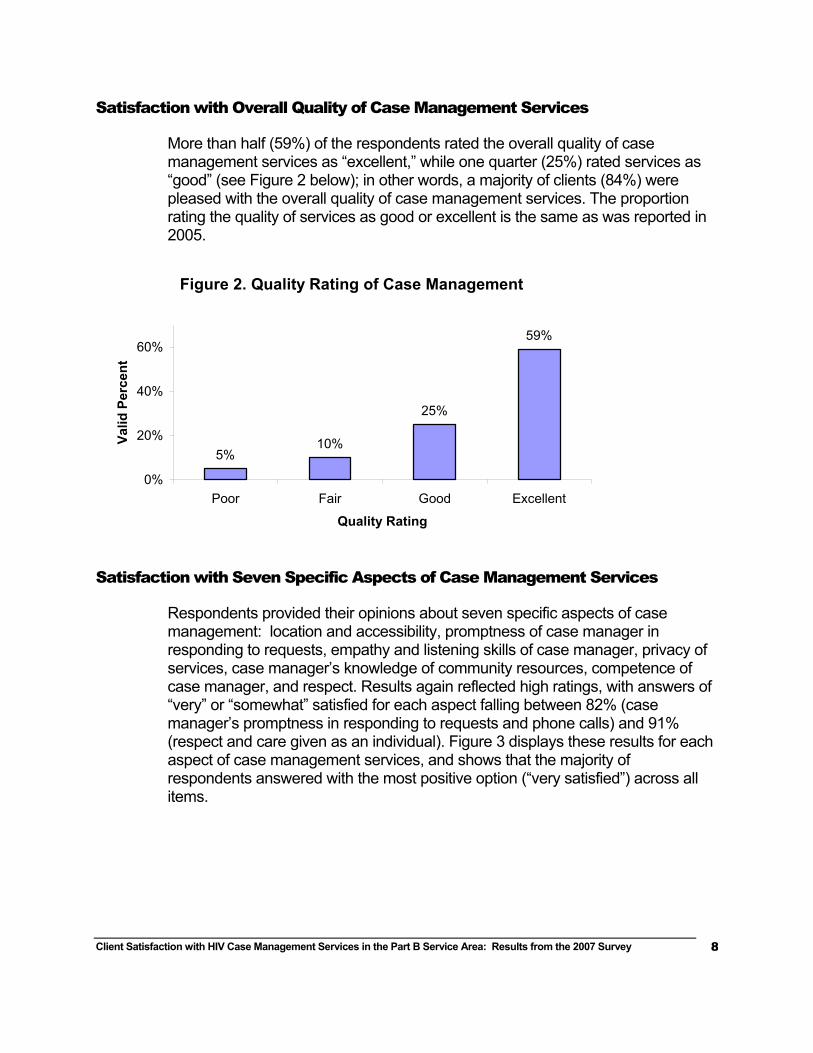
Respondents provided their opinions about seven specific aspects of case management: location and accessibility, promptness of case manager in responding to requests, empathy and listening skills of case manager, privacy of services, case manager’s knowledge of community resources, competence of case manager, and respect. Results again reflected high ratings, with answers of “very” or “somewhat” satisfied for each aspect falling between 82% (case manager’s promptness in responding to requests and phone calls) and 91% (respect and care given as an individual). Figure 3 displays these results for each aspect of case management services, and shows that the majority of respondents answered with the most positive option (“very satisfied”) across all items.
Client Satisfaction with HIV Case Management Services in the Part B Service Area: Results from the 2007 Survey
9
Changes in Satisfaction across Time—2004, 2005, and 2007
We examined client responses to similar items used in the 2004, 2005, and 2007 satisfaction surveys, but did not perform significance testing for methodological reasons3. Clients reported high levels of satisfaction in each year, with 90%, 84%, and 84% reporting good or excellent overall quality of case management services in 2004, 2005, and 2007 respectively4. There were no meaningful changes over time for the seven specific items measuring satisfaction with the different features of case management, such as promptness and professional knowledge.
Helpfulness of Case Management Services
Additional questions gathered information on clients’ perceptions regarding how helpful case management services had been to them. One item measured how often case management referrals met clients’ needs and four additional questions explored helpfulness in specific areas that are germane to quality HIV care.
For the question on how helpful referrals were overall, 19% of the respondents stated the question was not applicable to them because they received no referrals from their case manager. Of the respondents who had received referrals
3 Because this is an annual (or nearly annual) survey of a fairly stable population, it is certain that many respondents answered more than one survey between 2004 and 2007. However, because the surveys were anonymous, there is no way to know which clients responded more than once and, thus, no way to account for this correlation. 4 The 2005 and 2007 surveys are more directly comparable to one another; satisfaction items on the 2004 survey used slightly different scales and had different placement within the survey.
Figure 3. Satisfaction with Case Management: Percent Very or Somewhat Satisfied
64%
65%
73%
79%
66%
64%
81%
21%
17%
13%
12%
18%
20%
10%
0% 10% 20% 30% 40% 50% 60% 70% 80% 90% 100%
Location and accessibility
Promptness of response to call
Ability to listen and understand
Appropriate privacy
Knowledge and competence
Knowledge of resources
Respect and care given
Very SatisfiedSomewhat Satisfied
Client Satisfaction with HIV Case Management Services in the Part B Service Area: Results from the 2007 Survey
10
from their case manager, 45% reported that the referrals “always” helped meet their needs and 34% said they were “often” helpful. Nearly one in five respondents answered less enthusiastically, with 17% reporting the referrals were “sometimes” helpful and 5% reporting that they were “never” helpful.
For specific ways in which a case manager could be helpful, respondents were asked if their case manager had been “a great deal” helpful, “somewhat” helpful, or “not really” helpful in four important areas of HIV care:
dealing more effectively with problems,
finding a doctor who knows about HIV,
applying for health insurance, and
staying on HIV medications.
Respondents could also indicate that the question was not applicable because they did not need help.
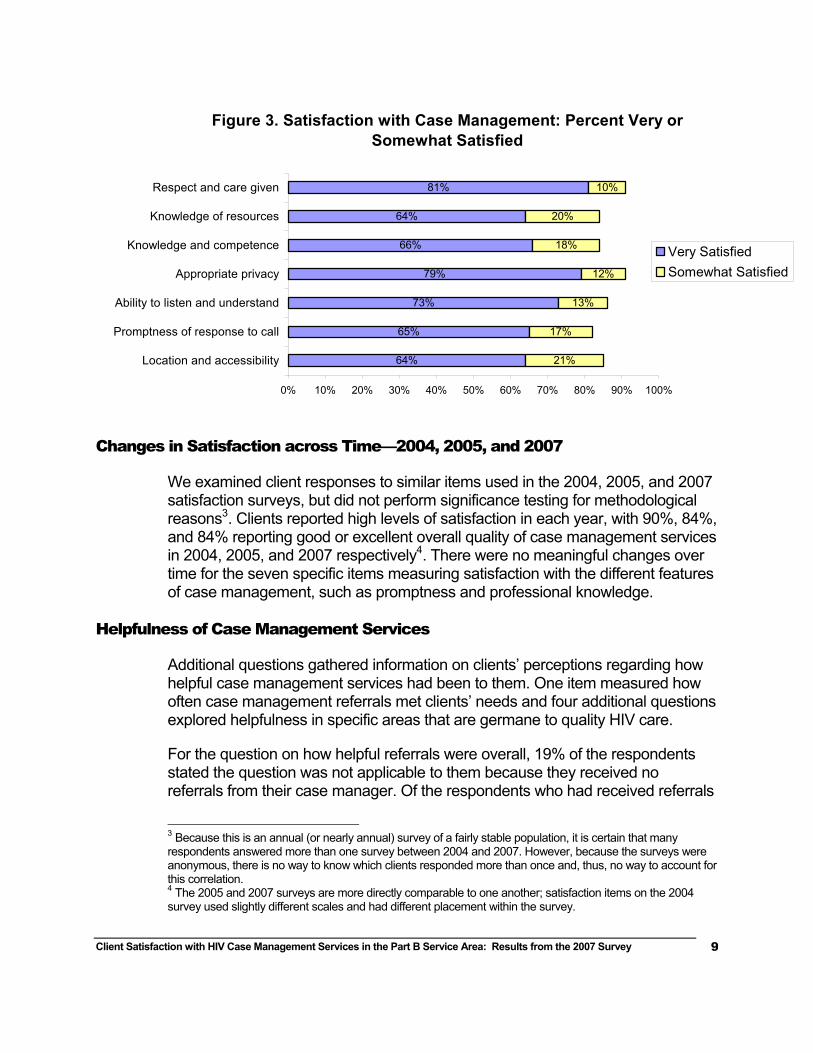
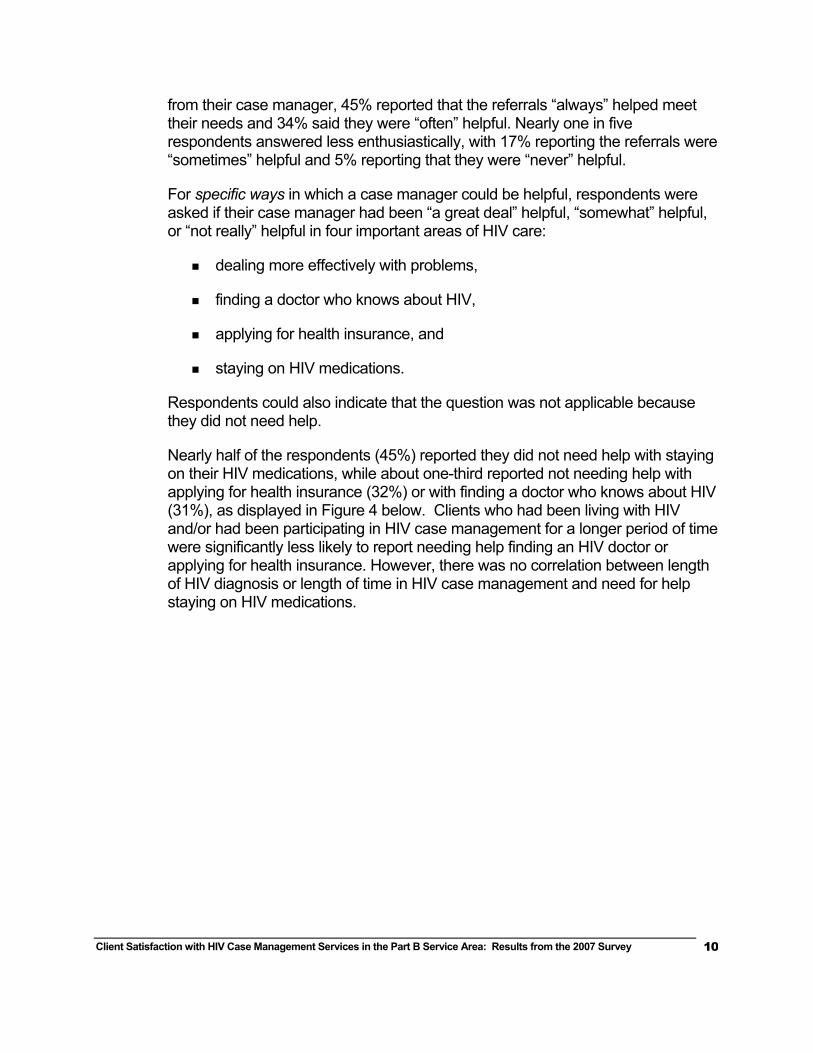
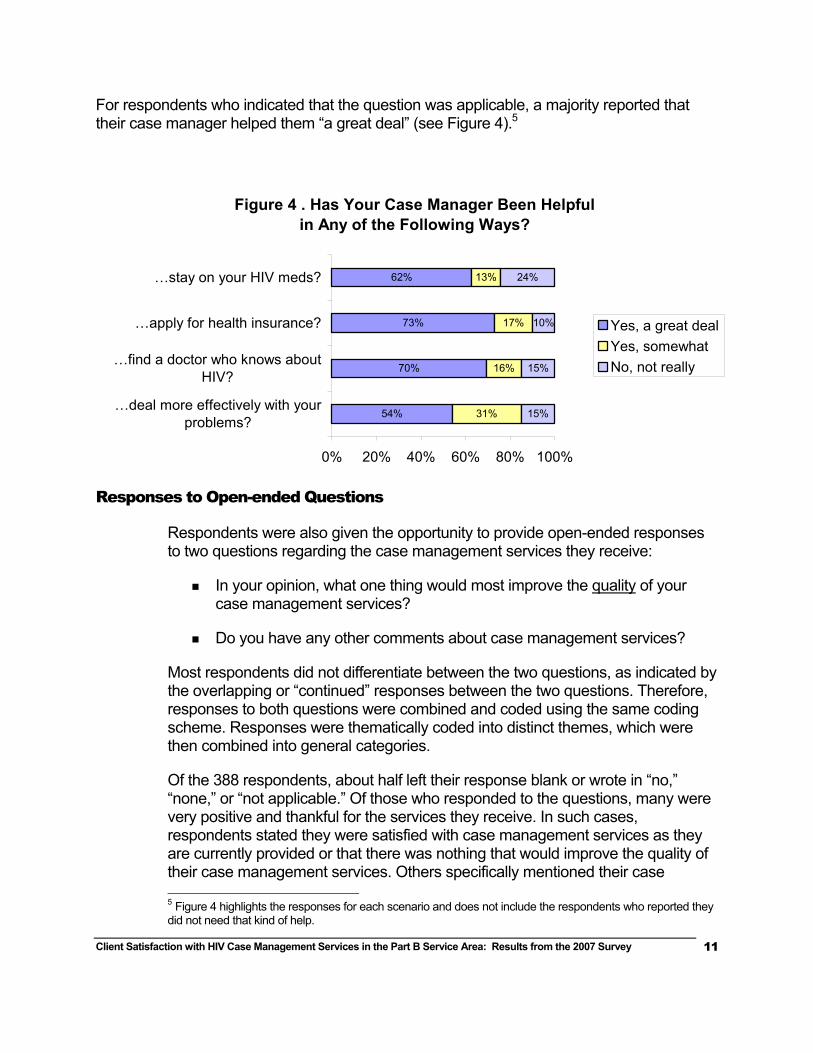
Nearly half of the respondents (45%) reported they did not need help with staying on their HIV medications, while about one-third reported not needing help with applying for health insurance (32%) or with finding a doctor who knows about HIV (31%), as displayed in Figure 4 below. Clients who had been living with HIV and/or had been participating in HIV case management for a longer period of time were significantly less likely to report needing help finding an HIV doctor or applying for health insurance. However, there was no correlation between length of HIV diagnosis or length of time in HIV case management and need for help staying on HIV medications.
Client Satisfaction with HIV Case Management Services in the Part B Service Area: Results from the 2007 Survey
11
For respondents who indicated that the question was applicable, a majority reported that their case manager helped them “a great deal” (see Figure 4).5
Responses to Open-ended Questions
Respondents were also given the opportunity to provide open-ended responses to two questions regarding the case management services they receive:
In your opinion, what one thing would most improve the quality of your case management services?
Do you have any other comments about case management services?
Most respondents did not differentiate between the two questions, as indicated by the overlapping or “continued” responses between the two questions. Therefore, responses to both questions were combined and coded using the same coding scheme. Responses were thematically coded into distinct themes, which were then combined into general categories.
Of the 388 respondents, about half left their response blank or wrote in “no,” “none,” or “not applicable.” Of those who responded to the questions, many were very positive and thankful for the services they receive. In such cases, respondents stated they were satisfied with case management services as they are currently provided or that there was nothing that would improve the quality of their case management services. Others specifically mentioned their case 5 Figure 4 highlights the responses for each scenario and does not include the respondents who reported they did not need that kind of help.
Figure 4 . Has Your Case Manager Been Helpful in Any of the Following Ways?
54%
70%
73%
62%
31%
16%
17%
13%
15%
15%
10%
24%
0% 20% 40% 60% 80% 100%
…deal more effectively with yourproblems?
…find a doctor who knows aboutHIV?
…apply for health insurance?
…stay on your HIV meds?
Yes, a great dealYes, somewhatNo, not really
Client Satisfaction with HIV Case Management Services in the Part B Service Area: Results from the 2007 Survey
12
manager by name and wrote how much they appreciated the help they receive or how grateful they are to their case manager. However, even with the overall positive responses, many respondents had suggestions for how case management services could be improved. The general categories are presented below, starting with the categories most frequently mentioned by clients. The themes are also discussed in order of frequency within each compressed category. Comments that provide good examples of the categories are presented in each section in italicized quotes.
Type or Amount of Services Offered
Sixty eight respondents offered suggestions for improvements that related to the types of services offered through HIV case management. The three areas of improvement identified within this category included more help (either generally or in specific service areas), more specialized HIV-related information, and support groups.
Most frequently (n=35), respondents requested more help, either overall or in specific areas (e.g. bus passes, food vouchers). Some comments related to services that have been discontinued or now have strict eligibility requirements. Other comments related to expansion of existing services or targeting services to specific groups of clients.
“More funding for dental services.”
“Reinstate the food vouchers and bus passes.”
“If there were more financial resources to tap into for SINGLE PARENTS living with HIV/AIDS. Parents are often looked over and our challenges aren't addressed.”
“If we could get more help, because we get sad and desperate when we don't have enough money to buy the medicines and the food and household expenses. Those of us with HIV/AIDS need more help.”
Other respondents requested more specialized HIV information from their case managers. Specific examples included HIV-related resource guides, information about HIV doctors and other specialists, and information about specific HIV-relatedhealth issues.
“Having a year-to-date HIV/AIDS resource guide available.”
“More information about clinics that specialize in HIV.
Client Satisfaction with HIV Case Management Services in the Part B Service Area: Results from the 2007 Survey
13
“Information about managing diet/nutrition as related to HIV and long-term survivors.”
“Need to know more about HIV doctors and what services offered.”
A small number of respondents (n=8) specifically requested support groups or other types of peer support as an augmentation to HIV case management.
“Confidential group mtgs for HIV people ONLY to meet & give each other support coordinated by HIV case manager.”
HIV Service System Issues
Fifty five respondents requested changes to the larger HIV service system in order to improve the overall quality of HIV case management services. Comments focused on three areas: ending budget cuts/improving Ryan White funding, improving access to case management, and eliminating bureacracy.
Twenty seven clients made specific pleas to improve funding. Some respondents specifically mentioned The Ryan White Care Act, while others focused on funds given to their local HIV case management system.
“It is my understanding that delays are due to too few staff for number of clients, so increased funding for staff is needed.”
“Bringing back RW funding to the level it was a few yrs ago when we got ocassional emergency help w/food, bills, rent, etc. We also used to get emergency help with dental services.”
“Give her more funding to work in HIV arena. Hours were cut drastically and should be reinstated.”
“Stop the cuts on RW services. [They] cut bus passes, gift cards, gas cards. These cuts have made some of those who have HIV stay home and just die alone.”
Twenty clients mentioned access issues. Access included things such as location of case management services, availability of case managers when clients need them, and frustration with reaching case managers by phone. Some clients just mentioned problems with access, while others provided conrete suggestions for improvement.
“More time should be available for all clients. There are lots of meetings when client services is closed down, and the place is closed on Fridays.”
Client Satisfaction with HIV Case Management Services in the Part B Service Area: Results from the 2007 Survey
14
“Having an 800 number by which to contact them.”
“Make her work hours more flexible.”
“The ability to reach my case manager more easily by phone. There is a lot of phone tag.”
“Make it exist again. I have all but forgot about my case mgmt, since it has all but disappeared off the face of the earth.”
Eight respondents said that eliminating or reducing some of the bureaucracy or “red tape” associated with case maangement would help improve the quality of services.
“Not requiring a mountain of paperwork to get assistance. I have declined services that I really needed because of paperwork and not having access to the required documents.”
Customer Service Issues
Forty five respondents mentioned issues that fell under the category of improving customer service. Specific areas mentioned included improving communication and follow-up, improving the promptness with which services are delivered, and improving case managers’ skill levels.
Twenty four clients said that improved communciation between case managers and clients would improve the quality of HIV case management services. Improved communication included increased number of contacts, more time to spend together, and better follow up on pending issues.
“In past, my case manager did not have to rush me out and showed concern, and asked about problems, worries. New case manager has no time for follow up or to review my case with me. Literally no time.”
“More contact with clients and when they say they'll do something, do it.”
“Case manager should actually return phone calls. Case managers should routinely follow up with all their cases, even if it’s just to call and see how someone is or to say hello.”
“For the case manager to have more contact with the clients. Maybe call them every month or two to check in?”
Client Satisfaction with HIV Case Management Services in the Part B Service Area: Results from the 2007 Survey
15
Twelve clients specifically mentioned requested greater promptness in responding to client needs.
“Getting back to you quicker if you call and leave a message.”
“They would make promises and then not keep them. Like saying I could see a dentist and then never getting around to it.”
“She calls right back but sometimes she will take a week or two getting me the information I ask for. But without her a lot of things would never get done.”
Nine clients suggested that their case manager needed to improve specific customer service skills.
“My case manager is somewhat rude and anytime I've seen her she seems like it is a chore to deal with me.”
“Please put people in this job that have the capacity to do it.”
Staffing Issues
Thirty five respondents mentioned staffing issues as impediments to quality case management services. These comments focused on two major areas: having more staff or smaller caseloads and having less staff turnover.
Twenty two respondents said that staff turnover impacted the quality of case management services provided.
“I wish they wouldn't quit their job just as soon as I got to know and like them very much.”
“My case management keeps changing due to county funds. Not sure who my case manager is.”
“Have a case manager stay in the position long enough to know the ins and outs of the programs available. And more than one case manager for the entire county.”
“The turnaround in employment is too high. We lost all our previous case managers in less than one year.”
Thirteen respondents also mentioned the need to add more staff or create smaller caseloads at the local level.
“Create one or more full-time case management positions.”
Client Satisfaction with HIV Case Management Services in the Part B Service Area: Results from the 2007 Survey
16
“Unfortunately, I think she has [too many new] cases and that causes her to ignore her existing cases.”
“The manager of my case has too many other responsibilities outside of HIV services to clients. I think it is one-fifth time.”
Although “staffing issues” had the fewest comments of the four overall categories noted for improvement, it is the category with the narrowest focus and should be noted for the consistency of comments in this area.
Differences across Client Characteristics
Analyses were performed to assess differences in satisfaction with overall quality of case management services and perceived helpfulness in dealing with problems across several respondent characteristics. Clients within several characteristics were combined because of low respondent numbers. Subgroups were defined by the following characteristics:
gender (men vs. women)6
age (<35, 35-49, 50 and older)
ethnicity (non-Hispanic White, Hispanic, all others)
region7 (Central, Coastal, Columbia/Eastern, and I-5 Corridor, )
length of time since diagnosis with HIV
length of time seeing a case manager
number of contacts with case manager (0-2, 3-6, 7 or more)
feelings about amount of contact with case manager (i.e., “just the right amount” vs. “too few”)
There were no reported differences in satisfaction with overall quality or perceived helpfulness of case management services by age, race/ethnicity, region, years since HIV diagnosis, or length of time in case management. However, women were less likely to be satisfied with the overall quality of case management services than were men, and clients with fewer contacts with their case manager were significantly less likely to be satisfied with either overall quality or with the helpfulness of case management. 6 The one individual identifying as transgender was eliminated from these analyses. 7 The following counties comprise the four regions: Central (Crook, Deschutes, Jefferson, Klamath, and Lake), Coastal (Clatsop, Coos, Curry, Lincoln, and Tillamook), Columbia/Eastern (Baker, Gilliam, Grant, Harney, Hood River, Malheur, Morrow, Sherman, Umatilla, Union, Wallowa, Wasco, and Wheeler), and I-5 Corridor (Benton, Douglas, Jackson, Josephine, Lane, Linn, Marion, and Polk).
Client Satisfaction with HIV Case Management Services in the Part B Service Area: Results from the 2007 Survey
17
Gender: Women and men were equally likely to say that case managers helped them deal with their problems, yet women were significantly more likely than men to be dissatisfied with the overall quality of case management services (23% of women dissatisfied vs. 13% of men, p=.023). There was no correlation between gender and other case management variables (e.g. length of time in case management, number of contacts).
Number of Contacts and Feelings about the Amount of Contact with Case Manager: Clients who had the least contact with their case manager—specifically, 0-2 contacts in the past 12 months—reported the lowest level of satisfaction across all items. Overall satisfaction increased in a stepwise pattern with number of contacts across all seven of the specific satisfaction items, although differences between clients with 3 to 6 and 7 or more contacts were very small on three of the items (promptness in responding, ability to listena nd understand problems, and respect and care given). Satisfaction with the overall quality of case management followed the same pattern, with 95% of clients who had 7 or more contacts with their case manager reporting satisfaction with overall quality, compared to 87% of clients with 3 to 6 contacts, and 72% of clients with 0-2 contacts. Similarly, in response to the question “Has your case manager helped you deal more effectively with your problems?”, 66% of clients with 7 or more contacts said their case manager had helped “a great deal” compared to 44% of clients with 3 to 6 contacts and only 31% of clients with 0-2 contacts.
Significant differences emerged between clients who felt they’d had “too few” contacts with their case manager in the past year (n=77) compared to those who felt they’d had “just the right amount” of contacts (n=294)8. Just about half (51%) of clients who felt they’d had “too few” contacts with their case manager rated the overall quality of case management as “excellent” or “good” compared to nearly all (95%) of those who felt they’d had “just the right amount” of contact. Clients with “too few” contacts were significantly less satisfied across all seven specific items, ranging from 40 percentage points lower for satisfaction with case managers’ ability to listen to and understand problems to 26 percentage points lower for satisfaction with the extent to which services are deliverd with privacy. Likewise, only 13% of clients who felt they’d had “too few” contacts with their case manager reported that the case manager had helped them “a great deal” with their problems compared to 57% of clients who reported “just the right amount” of contact.
8 Nineteen clients were excluded from these analyses: 13 who didn’t answer the question and 6 who reported “too many” contacts with their case manager in the past 12 months.
Client Satisfaction with HIV Case Management Services in the Part B Service Area: Results from the 2007 Survey
18
Subgroup Differences across Time: 2004, 2005 and 2007
In 2005, significant differences in satisfaction emerged between regions, but no regional differences were observed in the 2007 survey. Differences in satisfaction by gender were only identified in 2007.
Differences in satisfaction based on number of contacts were observed in all three surveys, with clients receiving more contact consistently more satisfied with case management services. Since client needs are highly individualied, we added to the 2005 and 2007 surveys a subjective item asking whether the client felt that he or she was receiving enough service. In both years, not surprisingly, clients that felt they were not receiving enough service were far less satisfied with the services they received. In both years, objective number of contacts and subjective opinion about the amount of contact were highly correlated, with clients with 0-2 contacts significantly more likely to feel they had “too few” contacts with their case managers.
Conclusions
Limitations
These results are based on self-reported opinions to a simple mailed survey, representing a specific point in time (Autumn/Winter, 2007). We did not receive a survey back from everyone asked to participate, so our results represent the target population—people with HIV, receiving case management services in the Part B service area—only if those who did not answer have similar views compared to those who did. It is not possible to know the extent of this “non-response bias,” so results should be considered with some caution. However, our response rate of 61% is generally considered satisfactory for this type of passive, self-administered survey and is consistent with response rates of previous client satisfaction surveys.
Region and demographic characteristics were available for all to whom the survey was sent. This allowed a comparison of responders and non-responders on those characteristics. There was no difference between responders and non-responders with respect to gender, race/ethnicity, or region. However, there was a significant association between age and response to the survey, with those not responding being more likely to be younger than responders. This association could be explained by association of age with disease progression and need for services.
Client Satisfaction with HIV Case Management Services in the Part B Service Area: Results from the 2007 Survey
19
Key Findings
Overall, clients reported a high level of satisfaction with case management services. This was true for the question about the overall quality of services received, as well as for several items that asked about specific service aspects and helpfulness of the case manager. This high level of satisfaction has been stable across surveys conducted in 2004, 2005, and 2007.
Five survey questions measured clients’ perceptions of their case managers’ helpfulness in helping them with specific problems and issues typically associated with HIV. Nearly half of all clients reported that they did not need help staying on their HIV medications and about one third needed no help finding a doctor or applying for health insurance. Of those who did need help, a majority reported that their case manager had helped them “a great deal” in achieving these goals. Nearly all clients reported receiving non-emergency medical care (90%) and either CD4 and/or viral load testing (95%) in the previous year.
Responses to open-ended questions echoed a fairly high level of satisfaction, with about half of respondents positive about overall case management services and their specific case managers, and many indivduals voicing thanks for the services and for their specific case mangers. About half of respondents offered suggestions for improvement. Client-identified themes for quality improvement included:
improving the types or amounts of services offered (e.g. provide more help with transportation or food, provide more specialized information about HIV services or issues),
improving the HIV service system (e.g. increase funding, decrease bureaucracy),
improving customer service (e.g. more communication, prompter service), and
increasing staff and decreasing staff turnover.
Clients with fewer contacts with their case managers and clients that characterized the number of past-year case management contacts as “too few” were significantly less satisfied with the overall quality of case management services and with each of the seven satisfaction items (e.g. location, promptness, professional knowledge) than clients with more contact.
There were no reported differences in satisfaction with overall quality or perceived helpfulness of case management services by age, race/ethnicity, region, years since HIV diagnosis, or length of time in case management. However, women were less satisfied with the overall quality of service than were men. No gender
Client Satisfaction with HIV Case Management Services in the Part B Service Area: Results from the 2007 Survey
20
differences emerged when examining the individual satisfaction items, which makes this difference difficult to interpret, but important to monitor.
Clients in 2004, 2005, and 2007 reported high levels of satisfaction with the overall quality and helpfulness of HIV case management services, although, in each year, clients with less case management contact have been significantly less satisfied with the services they received. In addition, there were no meaningful changes across years in satisfaction with the seven specific aspects of case management services, such as promptness, location, and professional knowledge of staff.
Implications
Recent studies support the theory that case management plays a critical part in ensuring that people living with HIV receive appropriate medical care and supportive services.9, 10 This satisfaction survey did not measure the effect of case management services, but case mangement clients continue to report a high level of satisfaction. In addition, most clients who needed help applying for health insurance, finding an HIV doctor, or staying on their HIV medications reported that case managers helped them “a great deal” in meeting these important goals. Many other clients, particularly those who had been living with HIV for a decade or longer, reported not needing some types of case management services—likely because the issues had already been worked out at an earlier point in their disease history. Notably, medication adherence was not related to length of time since diagnosis, indicating that case managers could play a role in assessing clients’ needs around medication management and making appropriate referrals.
In 2004, 2005, and 2007, respondents with less contact with case management were significantly less satisfied with the overall quality of case management services, as well as with the seven specific aspects of service that were measured. Although it is possible that less satisfied clients seek out case management services, it is more likely that for many clients, less contact with case managers leads to lower satisfaction with case management services. The fact that clients who had seen their case manager once, twice or not at all during the preceding year were also more likely to say that they’d had “too few” contacts with the case manager lends credibility to this theory, as do the open-ended comments requesting more contact between client and case manager, better follow up, and improved access. Although the effectiveness of HIV case management has not been well studied, there is some indication in the literature
9 Katz MH, Cunningham WE, Fleishman JA, Anderson RM, et al. Effect of case management on unmet needs and utilization of medical care and medications among HIV-infected persons. Annals of Internal Medicine 2001; 135: 557-565. 10 Gardner LI, Metsch LR, Anderson-Mahoney P, Loughlin AM, et al. Efficacy of a brief case management intervention to link recently diagnosed HIV-infected persons to care. AIDS 2005; 19:423-431.
Client Satisfaction with HIV Case Management Services in the Part B Service Area: Results from the 2007 Survey
21
that sustained or multiple contacts with a case manager are associated with fewer unmet needs for services and higher adherence to HIV treatment regimens for those receiving HIV treatment.11
In 2005, clients from two broadly defined regions in the state, the “Coastal” and “Columbia/Eastern” regions reported less satisfaction with case management services than clients living in the “Central” or “I-5 Corridor” regions. The four regions are markedly different, with the “Coastal” and “Columbia/Eastern” regions characterized by low population density, greater distances between needed services, and fewer dedicated HIV/AIDS service providers. These differences were not present in 2007.
However, new subgroup differences emerged in 2007: women were less likely to be satisfied with the overall quality of case management services than were men. There were no differences by gender in satisfaction with specific aspects of case management, so the disparity is not easily explained and should continue to be monitored. It is possible that women need different types of services than what is being offered currently through the case management system.
A thorough yearly assessment of individual client needs is a cornerstone of the Part B case management system, as is triaging of needs based on acuity level. Because of limited funding, case managers truly do have less time to spend with clients, particularly low acuity clients, than they had in past years. This is clearly an ongoing source of dissatisfaction for a portion of clients. More frequent contact with case managers, especially for recently diagnosed individuals who may have critical needs related to health insurance, medication adherence, and navigation of the medical care system—may be warranted. Ancillary systems, such as peer support or other channels for information sharing and social support (e.g. support groups) may be additional ways to improve quality of care for individuals that are marginally involved with the case management system, but who desire more contact.
Despite decreased federal funding and the local consequences identified by clients—larger caseloads and staff turnover—satisfaction with the overall quality of services has remained high across surveys conducted in 2004, 2005, and 2007. This speaks, in part, to the effectiveness of individual case managers in the field and, in part, to the sophisticated understanding that many HIV clients have of larger system issues, including budget cuts. It is possible that clients are adjusting their expectations to accommodate present realities, but overall, the Part B case management system appears to be achieving its mission of delivering case management services in an equitable manner to a diverse group of people with
11 Katz MH, Cunningham WE, Fleishman JA, Anderson RM, et al. Effect of case management on unmet needs and utilization of medical care and medications among HIV-infected persons. Annals of Internal Medicine 2001; 135: 557-565.
Client Satisfaction with HIV Case Management Services in the Part B Service Area: Results from the 2007 Survey
22
HIV, across large geographic areas, with limited resources. Continued assessment and adjustment will be necessary to ensure that some people are not left behind as the larger system continues to change.
APPENDIX A
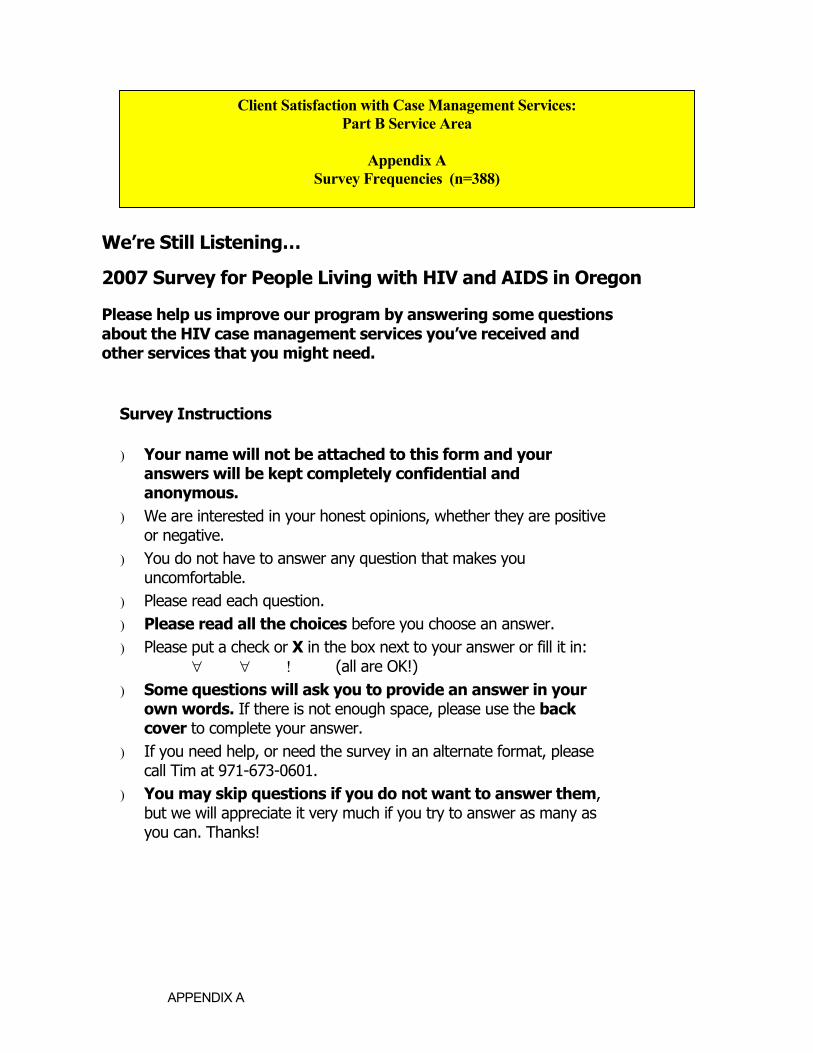
We’re Still Listening…
2007 Survey for People Living with HIV and AIDS in Oregon
Please help us improve our program by answering some questions about the HIV case management services you’ve received and other services that you might need.
Survey Instructions
) Your name will not be attached to this form and your
answers will be kept completely confidential and anonymous.
) We are interested in your honest opinions, whether they are positive or negative.
) You do not have to answer any question that makes you uncomfortable.
) Please read each question. ) Please read all the choices before you choose an answer. ) Please put a check or X in the box next to your answer or fill it in:
∀ ∀ ! (all are OK!) ) Some questions will ask you to provide an answer in your
own words. If there is not enough space, please use the back cover to complete your answer.
) If you need help, or need the survey in an alternate format, please call Tim at 971-673-0601.
) You may skip questions if you do not want to answer them, but we will appreciate it very much if you try to answer as many as you can. Thanks!
Client Satisfaction with Case Management Services: Part B Service Area
Appendix A
Survey Frequencies (n=388)
APPENDIX A
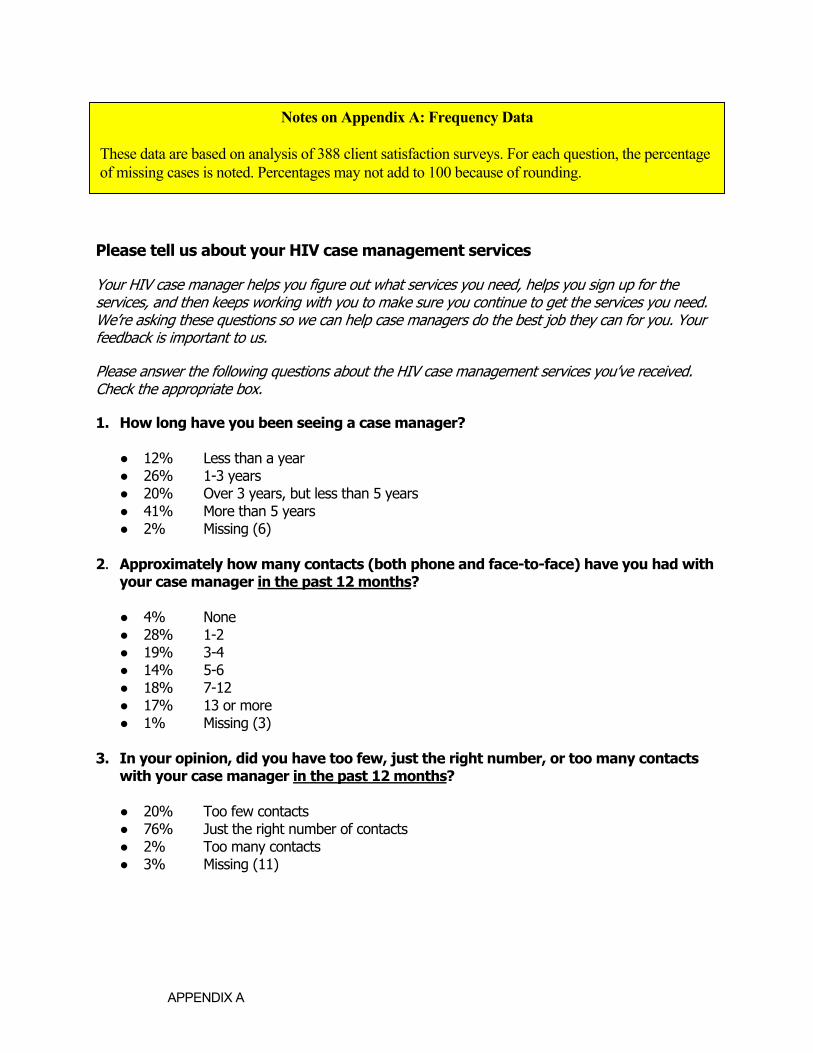
Please tell us about your HIV case management services Your HIV case manager helps you figure out what services you need, helps you sign up for the services, and then keeps working with you to make sure you continue to get the services you need. We’re asking these questions so we can help case managers do the best job they can for you. Your feedback is important to us. Please answer the following questions about the HIV case management services you’ve received. Check the appropriate box.
1. How long have you been seeing a case manager?
● 12% Less than a year ● 26% 1-3 years ● 20% Over 3 years, but less than 5 years ● 41% More than 5 years ● 2% Missing (6)
2. Approximately how many contacts (both phone and face-to-face) have you had with
your case manager in the past 12 months?
● 4% None ● 28% 1-2 ● 19% 3-4 ● 14% 5-6 ● 18% 7-12 ● 17% 13 or more ● 1% Missing (3)
3. In your opinion, did you have too few, just the right number, or too many contacts
with your case manager in the past 12 months?
● 20% Too few contacts ● 76% Just the right number of contacts ● 2% Too many contacts ● 3% Missing (11)
Notes on Appendix A: Frequency Data
These data are based on analysis of 388 client satisfaction surveys. For each question, the percentage of missing cases is noted. Percentages may not add to 100 because of rounding.
APPENDIX A
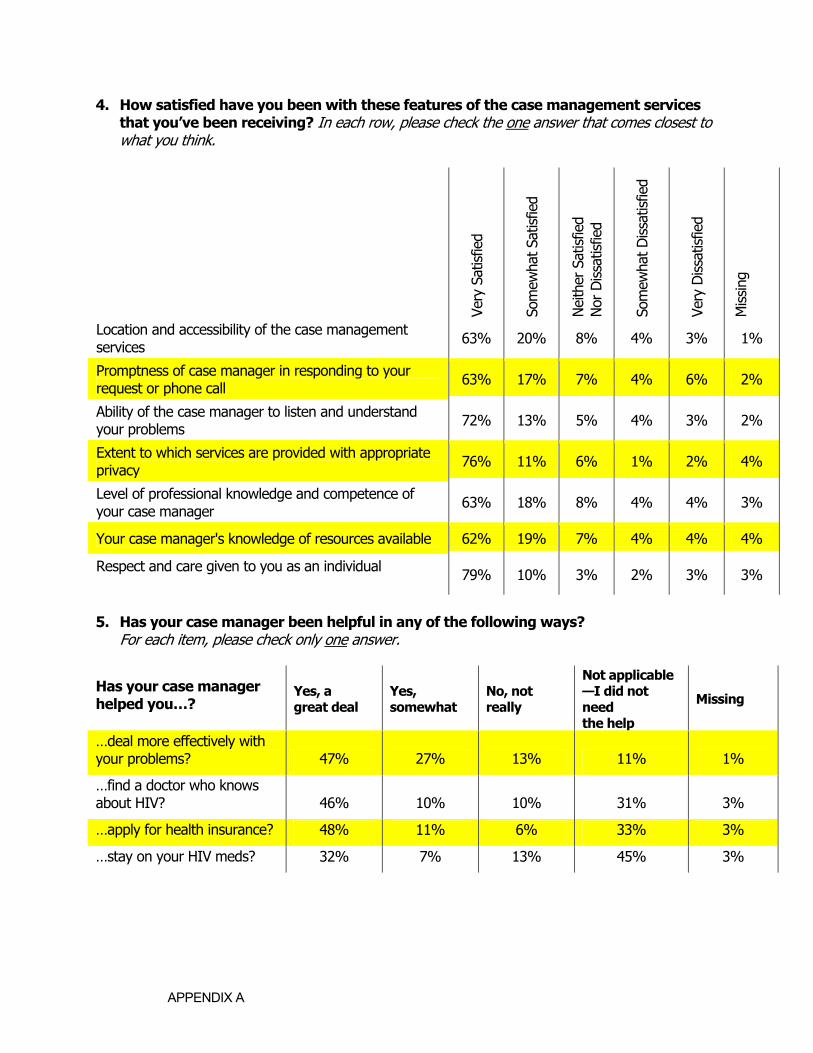
4. How satisfied have you been with these features of the case management services that you’ve been receiving? In each row, please check the one answer that comes closest to what you think.
5. Has your case manager been helpful in any of the following ways? For each item, please check only one answer.
Has your case manager helped you…?
Yes, a great deal
Yes, somewhat
No, not really
Not applicable —I did not need the help
Missing
…deal more effectively with your problems? 47% 27% 13% 11% 1%
…find a doctor who knows about HIV? 46% 10% 10% 31% 3%
…apply for health insurance? 48% 11% 6% 33% 3%
…stay on your HIV meds? 32% 7% 13% 45% 3%
Ve
ry S
atis
fied
Som
ewha
t Sat
isfie
d
Nei
ther
Sat
isfie
d
Nor
Dis
satis
fied
Som
ewha
t Dis
satis
fied
Very
Dis
satis
fied
Mis
sing
Location and accessibility of the case management services 63% 20% 8% 4% 3% 1%
Promptness of case manager in responding to your request or phone call 63% 17% 7% 4% 6% 2%
Ability of the case manager to listen and understand your problems 72% 13% 5% 4% 3% 2%
Extent to which services are provided with appropriate privacy 76% 11% 6% 1% 2% 4%
Level of professional knowledge and competence of your case manager 63% 18% 8% 4% 4% 3%
Your case manager's knowledge of resources available 62% 19% 7% 4% 4% 4%
Respect and care given to you as an individual 79% 10% 3% 2% 3% 3%
APPENDIX A
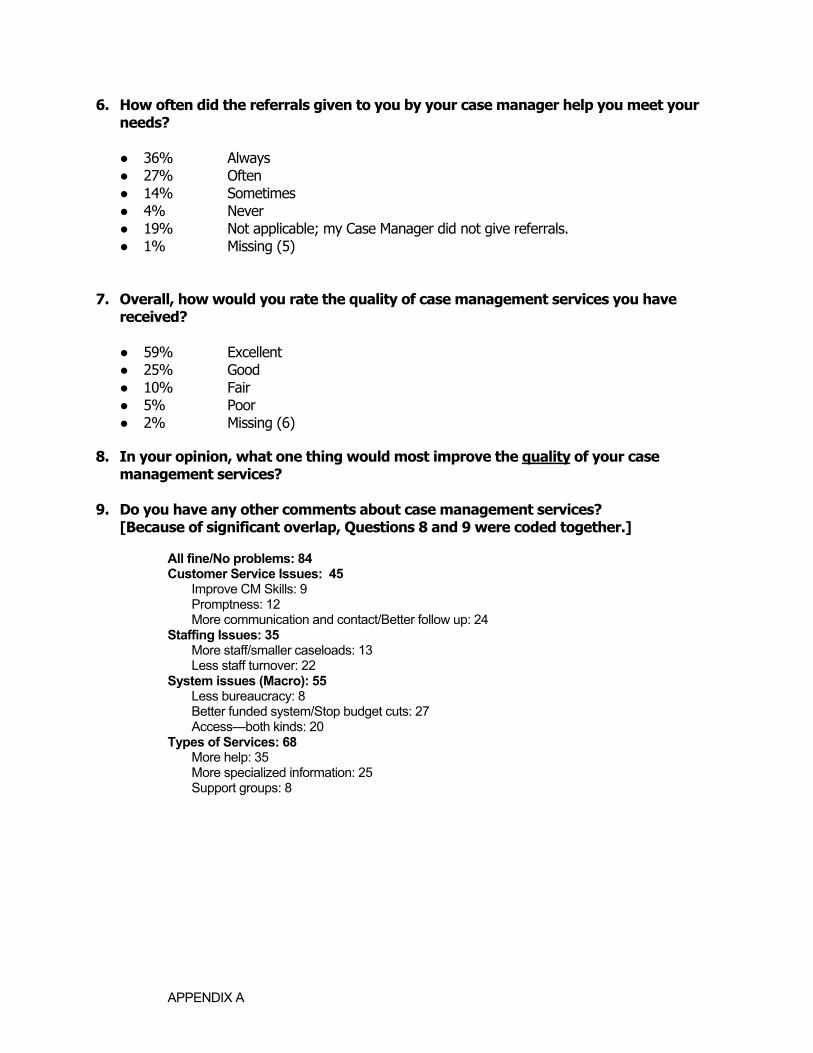
6. How often did the referrals given to you by your case manager help you meet your needs?
● 36% Always ● 27% Often ● 14% Sometimes ● 4% Never ● 19% Not applicable; my Case Manager did not give referrals. ● 1% Missing (5)
7. Overall, how would you rate the quality of case management services you have received?
● 59% Excellent ● 25% Good ● 10% Fair ● 5% Poor ● 2% Missing (6)
8. In your opinion, what one thing would most improve the quality of your case
management services? 9. Do you have any other comments about case management services?
[Because of significant overlap, Questions 8 and 9 were coded together.] All fine/No problems: 84 Customer Service Issues: 45 Improve CM Skills: 9 Promptness: 12 More communication and contact/Better follow up: 24 Staffing Issues: 35 More staff/smaller caseloads: 13 Less staff turnover: 22 System issues (Macro): 55 Less bureaucracy: 8 Better funded system/Stop budget cuts: 27 Access—both kinds: 20 Types of Services: 68 More help: 35 More specialized information: 25 Support groups: 8

APPENDIX A
Please tell us about yourself General information about you will help us learn more about people who need HIV services. It will be grouped with other people’s information, so no one will be able to identify you or your responses.
10. Overall, how is your general health? ● 15% Excellent ● 22% Very Good ● 27% Good ● 24% Fair ● 9% Poor ● 0.3% Don’t Know ● 3% Missing (11)
11. The next questions ask about how you have been feeling in the past 30 days. In
each row, please check the one answer that best describes how often you had this feeling:
In the past 30 days, about how often did you feel… a) so sad than nothing could cheer you up? b) nervous?
c) restless or fidgety? d) hopeless? e) everything was an effort? f) worthless? Frequencies reported elsewhere.
12. During the past 30 days, how many times did you see a doctor or other health
professional about these feelings? Frequencies reported elsewhere. 13. During the past 30 days, how often have the physical health problems been the
main cause of these feelings? Frequencies reported elsewhere. 14. What was the year you first tested positive for HIV?
● 19% Within the past 5 years ● 21% 6 to 10 years ago ● 24% 11 to 15 years ago ● 31% more than 15 years ago ● 5% Missing (18)
APPENDIX A
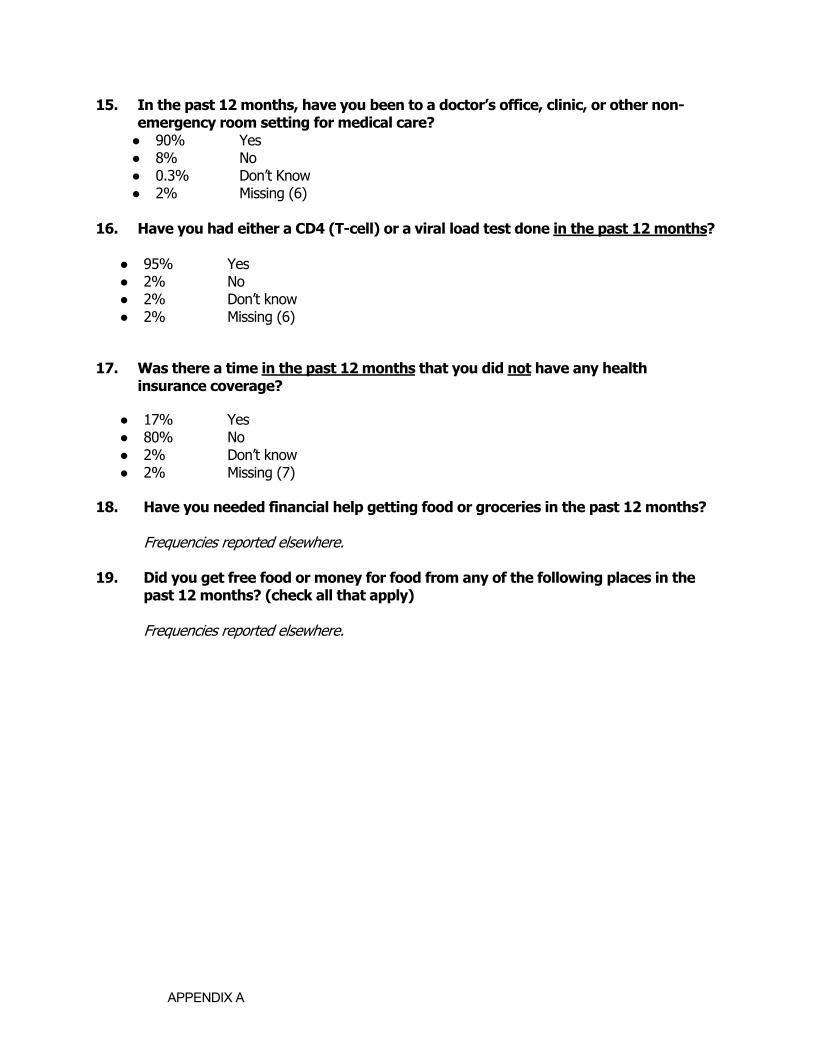
15. In the past 12 months, have you been to a doctor’s office, clinic, or other non-emergency room setting for medical care? ● 90% Yes ● 8% No ● 0.3% Don’t Know ● 2% Missing (6)
16. Have you had either a CD4 (T-cell) or a viral load test done in the past 12 months?
● 95% Yes ● 2% No ● 2% Don’t know ● 2% Missing (6)
17. Was there a time in the past 12 months that you did not have any health insurance coverage?
● 17% Yes ● 80% No ● 2% Don’t know ● 2% Missing (7)
18. Have you needed financial help getting food or groceries in the past 12 months?
Frequencies reported elsewhere. 19. Did you get free food or money for food from any of the following places in the
past 12 months? (check all that apply) Frequencies reported elsewhere.