Embed Size (px)
Citation preview

Client Conversations
The Power of Global Diversification
Past performance is no guarantee of future results. Estimates of future performance are based on assumptions that may not be realized. This material is not a solicitation of any offer to buy or sell any security or other financial instrument or to participate in any trading strategy. Please refer to important information, disclosures and qualifications at the end of this material.
WEALTH MANAGEMENT INVESTMENT RESOURCES | CHARTBOOK | GLOBAL DIVERSIFICATION
Now Is the Wrong Time to Abandon Global Equity Portfolios As of October 31, 2017
• Despite US relative outperformance in its eighth year, the “lost decade” (the 2000s) reminds us that over time, markets have reverted to the mean. In the long run, diversified portfolios have provided the most consistent and stable investment results over time.
• The Global Investment Committee thinks that now is exactly the wrong time to be abandoning globally diversified portfolios.
• 2015/2016 was the beginning of the “Great Rebalancing.” Regime shift from bonds to stocks has been catalyzed by: – Maturation of monetary policy globally
• US: Fed is tightening (forecasted for 3 hikes in 2017) • Europe: Draghi is tapering • Japan: Bank of Japan is yield curve targeting • China: Rates will likely stay high to prevent outflows
– Shift to fiscal policy • Trump will focus on pro-growth programs (tax reform, de-regulation, infrastructure spending)
– Commodity price recovery suggesting inflation is a concern
• We are already seeing encouraging signs from emerging markets, which the GIC recently upgraded to overweight.
• Going forward, we expect a convergence of global growth as the US slows and international markets pick up. A globally diversified portfolio should enable investors to focus on risk-adjusted returns in a challenging environment.
Source: Morgan Stanley Wealth Management GIC
Page 2 of 23
Past performance is no guarantee of future results. Estimates of future performance are based on assumptions that may not be realized. This material is not a solicitation of any offer to buy or sell any security or other financial instrument or to participate in any trading strategy. Please refer to important information, disclosures and qualifications at the end of this material.
WEALTH MANAGEMENT INVESTMENT RESOURCES | CHARTBOOK | GLOBAL DIVERSIFICATION
2007 2008 2009 2010 2011 2012 2013 2014 2015 2016 2017 YTD10-Years
('07-'16) Ann.
40.2% -28.0% 82.9% 26.9% 2.1% 24.1% 38.8% 13.7% 10.8% 21.3% 31.9% 7.1%
31.7% -33.8% 76.5% 20.2% 1.5% 20.9% 33.1% 13.2% 1.4% 12.1% 25.0% 7.1%
13.6% -37.0% 39.1% 18.5% -4.2% 19.1% 32.4% 4.9% 0.9% 12.0% 20.8% 6.9%
11.7% -37.6% 37.2% 16.2% -7.4% 17.0% 27.4% 4.4% -0.8% 10.3% 20.1% 4.4%
5.8% -42.0% 28.4% 16.1% -11.5% 16.4% 27.2% -1.2% -1.7% 9.0% 19.4% 3.9%
5.5% -46.8% 27.2% 15.1% -12.7% 16.3% 24.2% -1.4% -4.4% 8.0% 16.9% 2.4%
-1.6% -51.5% 26.5% 14.9% -13.7% 16.0% 4.8% -3.2% -8.4% 3.6% 16.8% 1.3%
-4.8% -53.6% 6.3% 6.2% -19.2% 7.7% -1.9% -5.7% -13.5% 0.0% 11.9% 1.2%
Japan
Global
Pacific ex Japan
US Large Cap
US Mid Cap
US Small Cap
Japan
Japan
Europe
EM Japan EMUS Small
Cap
US Mid Cap Global US Mid Cap US Mid Cap
Global US Mid Cap Global Japan
US Large Cap
US Large Cap
US Mid Cap
Pacific ex Japan
US Small Cap
EMUS Large
Cap
US Mid Cap JapanEurope
GlobalGlobal Global Europe
Pacific ex Japan
EM US Mid Cap Europe US Mid Cap
EuropeUS Large
CapEurope
Pacific ex Japan
US Small Cap
Pacific ex Japan
US Small Cap
US Large Cap
Europe
Pacific ex Japan
US Large Cap
JapanUS Small
CapGlobal
US Small Cap
US Large Cap
Japan EM Japan
US Small Cap
Pacific ex Japan
US Large Cap
GlobalPacific ex
Japan
Europe
JapanPacific ex
Japan
Europe EM Japan EM EM
Europe
Pacific ex Japan
US Small Cap
EM
US Mid CapUS Large
CapJapan
US Large Cap
US Mid Cap
Europe
Global
US Small Cap
US Small Cap
Pacific ex Japan
EM
Global
US Small Cap
US Mid Cap
US Large Cap
EM
Global
Pacific ex Japan
EM
Europe
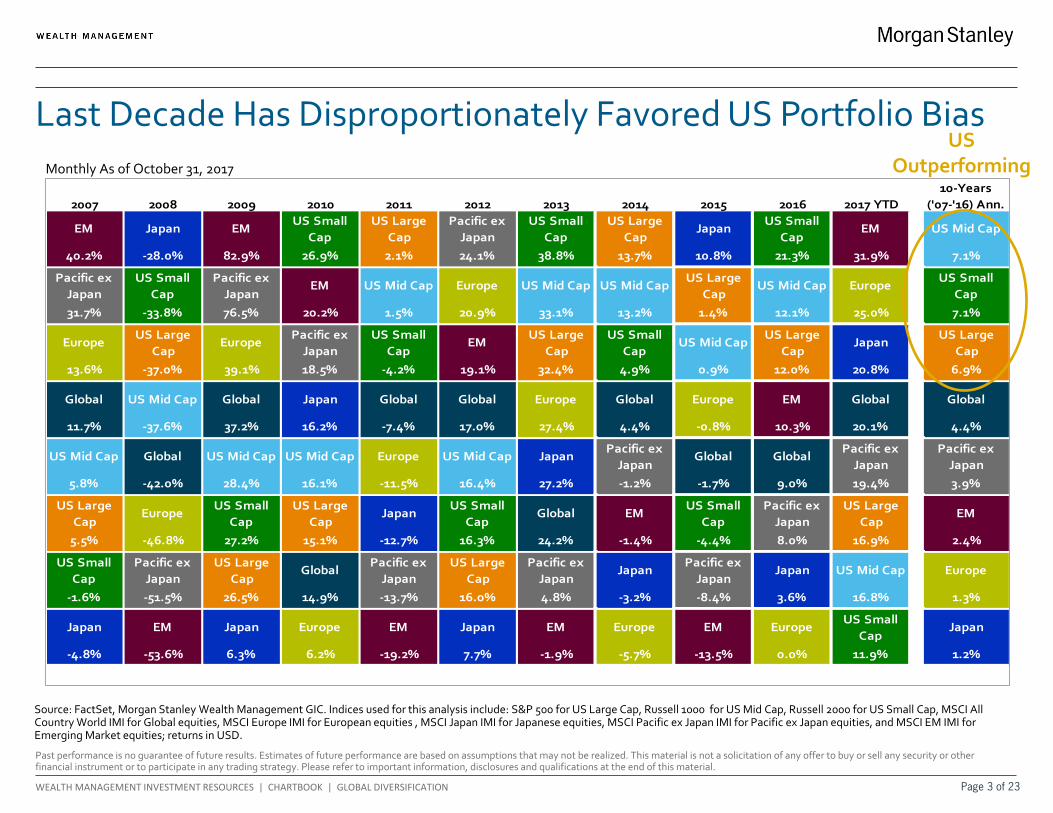
Last Decade Has Disproportionately Favored US Portfolio Bias
Source: FactSet, Morgan Stanley Wealth Management GIC. Indices used for this analysis include: S&P 500 for US Large Cap, Russell 1000 for US Mid Cap, Russell 2000 for US Small Cap, MSCI All Country World IMI for Global equities, MSCI Europe IMI for European equities , MSCI Japan IMI for Japanese equities, MSCI Pacific ex Japan IMI for Pacific ex Japan equities, and MSCI EM IMI for Emerging Market equities; returns in USD.
US Outperforming Monthly As of October 31, 2017
Page 3 of 23
Past performance is no guarantee of future results. Estimates of future performance are based on assumptions that may not be realized. This material is not a solicitation of any offer to buy or sell any security or other financial instrument or to participate in any trading strategy. Please refer to important information, disclosures and qualifications at the end of this material.
WEALTH MANAGEMENT INVESTMENT RESOURCES | CHARTBOOK | GLOBAL DIVERSIFICATION
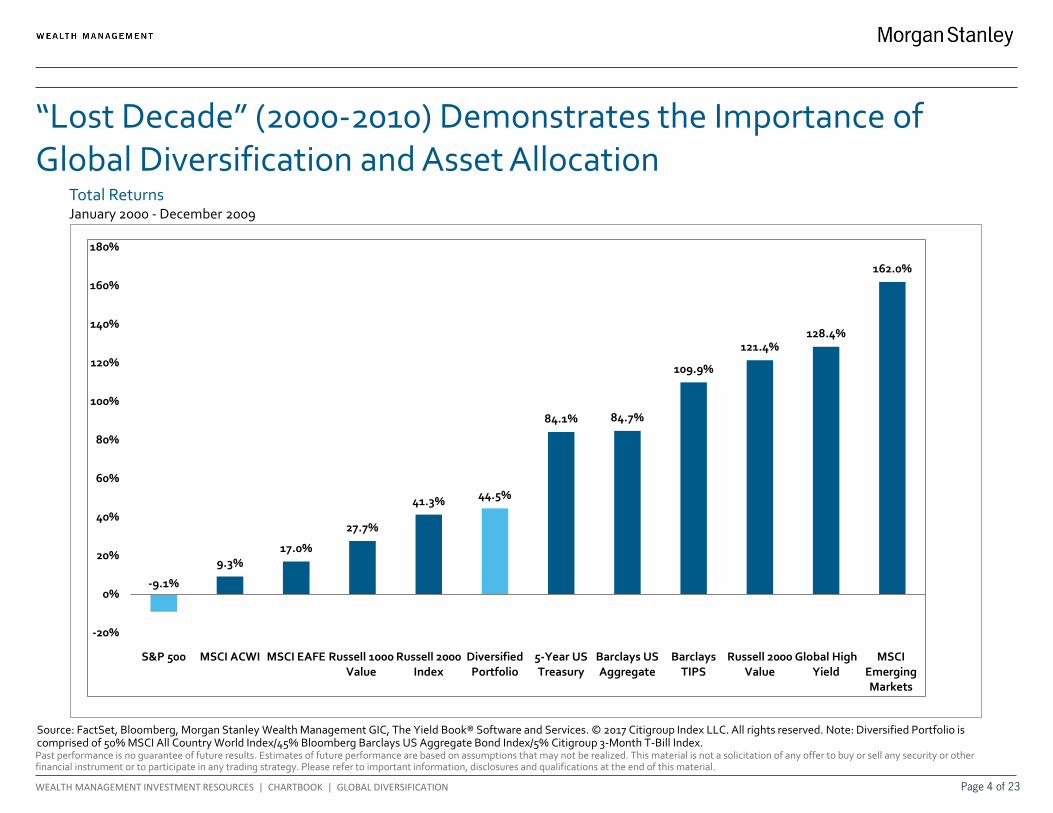
“Lost Decade” (2000-2010) Demonstrates the Importance of Global Diversification and Asset Allocation
Source: FactSet, Bloomberg, Morgan Stanley Wealth Management GIC, The Yield Book® Software and Services. © 2017 Citigroup Index LLC. All rights reserved. Note: Diversified Portfolio is comprised of 50% MSCI All Country World Index/45% Bloomberg Barclays US Aggregate Bond Index/5% Citigroup 3-Month T-Bill Index.
Total Returns January 2000 - December 2009
-9.1%
9.3%17.0%
27.7%
41.3% 44.5%
84.1% 84.7%
109.9%
121.4%128.4%
162.0%
-20%
0%
20%
40%
60%
80%
100%
120%
140%
160%
180%
S&P 500 MSCI ACWI MSCI EAFE Russell 1000Value
Russell 2000Index
DiversifiedPortfolio
5-Year USTreasury
Barclays USAggregate
BarclaysTIPS
Russell 2000Value
Global HighYield
MSCIEmergingMarkets
Page 4 of 23
Past performance is no guarantee of future results. Estimates of future performance are based on assumptions that may not be realized. This material is not a solicitation of any offer to buy or sell any security or other financial instrument or to participate in any trading strategy. Please refer to important information, disclosures and qualifications at the end of this material.
WEALTH MANAGEMENT INVESTMENT RESOURCES | CHARTBOOK | GLOBAL DIVERSIFICATION
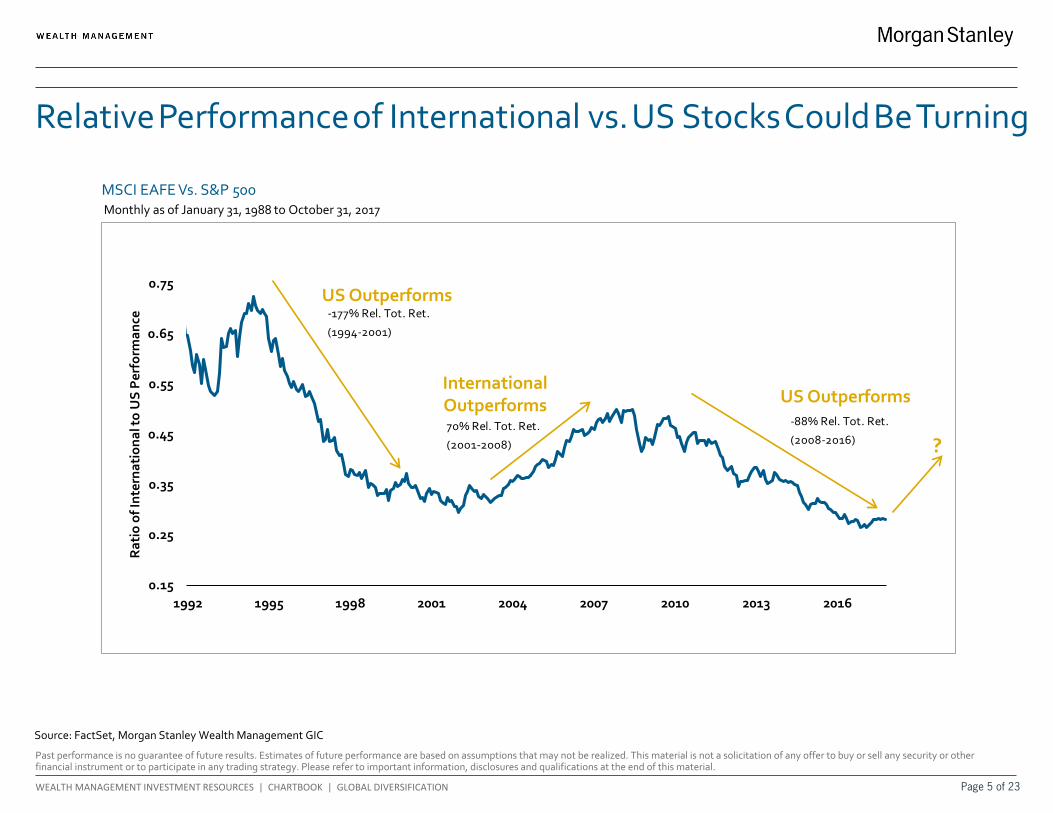
MSCI EAFE Vs. S&P 500
0.15
0.25
0.35
0.45
0.55
0.65
0.75
1992 1995 1998 2001 2004 2007 2010 2013 2016
Rat
io o
f Int
erna
tion
al to
US
Per
form
ance
Relative Performance of International vs. US Stocks Could Be Turning
Source: FactSet, Morgan Stanley Wealth Management GIC
US Outperforms
International Outperforms US Outperforms
?
-177% Rel. Tot. Ret.
(1994-2001)
70% Rel. Tot. Ret.
(2001-2008)
-88% Rel. Tot. Ret.
(2008-2016)
Monthly as of January 31, 1988 to October 31, 2017
Page 5 of 23
Past performance is no guarantee of future results. Estimates of future performance are based on assumptions that may not be realized. This material is not a solicitation of any offer to buy or sell any security or other financial instrument or to participate in any trading strategy. Please refer to important information, disclosures and qualifications at the end of this material.
WEALTH MANAGEMENT INVESTMENT RESOURCES | CHARTBOOK | GLOBAL DIVERSIFICATION
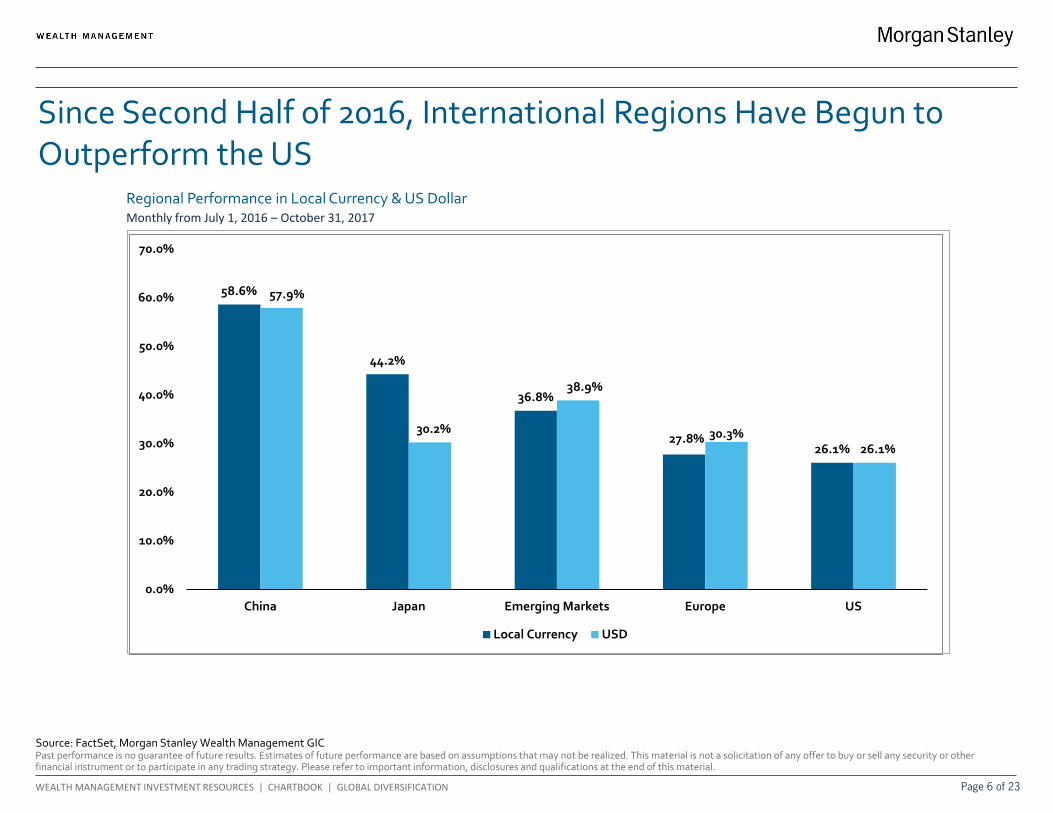
58.6%
44.2%
36.8%
27.8%26.1%
57.9%
30.2%
38.9%
30.3%26.1%
0.0%
10.0%
20.0%
30.0%
40.0%
50.0%
60.0%
70.0%
China Japan Emerging Markets Europe US
Local Currency USD
Since Second Half of 2016, International Regions Have Begun to Outperform the US
Source: FactSet, Morgan Stanley Wealth Management GIC
Regional Performance in Local Currency & US Dollar
Monthly from July 1, 2016 – October 31, 2017
Page 6 of 23
Past performance is no guarantee of future results. Estimates of future performance are based on assumptions that may not be realized. This material is not a solicitation of any offer to buy or sell any security or other financial instrument or to participate in any trading strategy. Please refer to important information, disclosures and qualifications at the end of this material.
WEALTH MANAGEMENT INVESTMENT RESOURCES | CHARTBOOK | GLOBAL DIVERSIFICATION
0.5
1.0
1.5
2.0
2.5
3.0
3.5
4.0
1988 1991 1994 1997 2000 2003 2006 2009 2012 2015
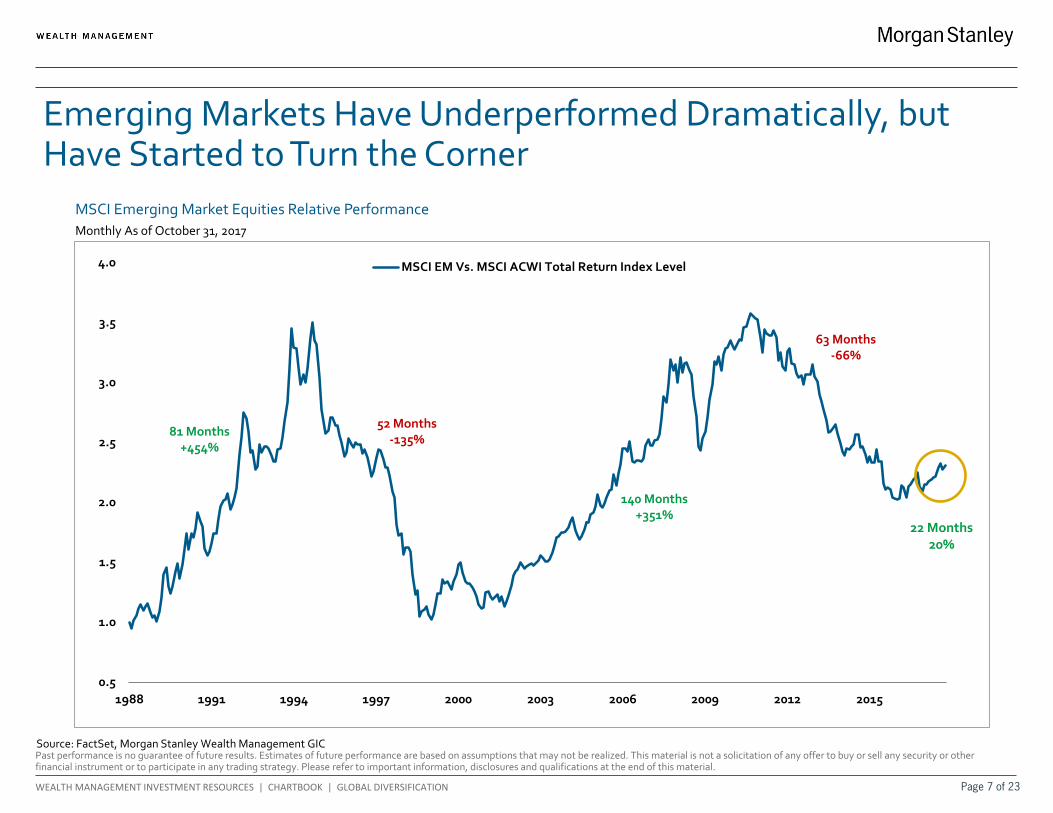
MSCI EM Vs. MSCI ACWI Total Return Index Level
MSCI Emerging Market Equities Relative Performance Monthly As of October 31, 2017
Emerging Markets Have Underperformed Dramatically, but Have Started to Turn the Corner
81 Months +454%
52 Months -135%
140 Months +351%
63 Months -66%
Source: FactSet, Morgan Stanley Wealth Management GIC
22 Months 20%
Page 7 of 23
Past performance is no guarantee of future results. Estimates of future performance are based on assumptions that may not be realized. This material is not a solicitation of any offer to buy or sell any security or other financial instrument or to participate in any trading strategy. Please refer to important information, disclosures and qualifications at the end of this material.
WEALTH MANAGEMENT INVESTMENT RESOURCES | CHARTBOOK | GLOBAL DIVERSIFICATION
300
800
1,300
1,800
2,300
2,800
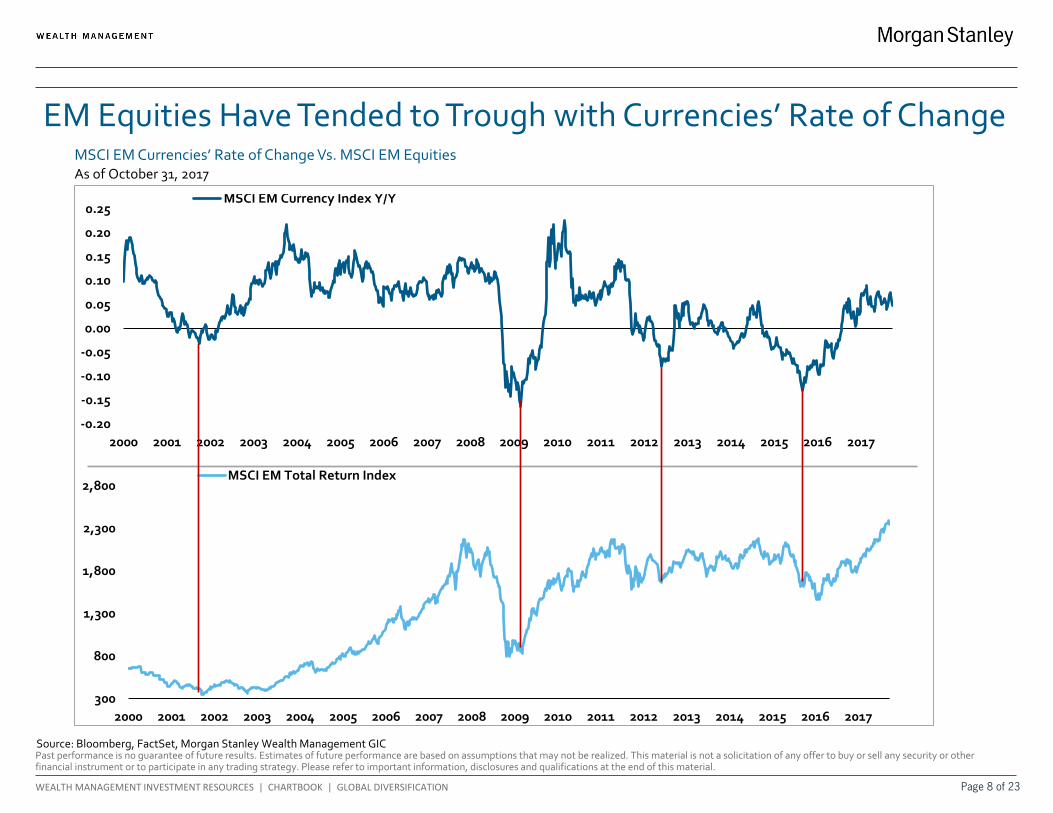
2000 2001 2002 2003 2004 2005 2006 2007 2008 2009 2010 2011 2012 2013 2014 2015 2016 2017
MSCI EM Total Return Index
-0.20
-0.15
-0.10
-0.05
0.00
0.05
0.10
0.15
0.20
0.25
2000 2001 2002 2003 2004 2005 2006 2007 2008 2009 2010 2011 2012 2013 2014 2015 2016 2017
MSCI EM Currency Index Y/Y
EM Equities Have Tended to Trough with Currencies’ Rate of Change
Source: Bloomberg, FactSet, Morgan Stanley Wealth Management GIC
MSCI EM Currencies’ Rate of Change Vs. MSCI EM Equities As of October 31, 2017
Page 8 of 23
Past performance is no guarantee of future results. Estimates of future performance are based on assumptions that may not be realized. This material is not a solicitation of any offer to buy or sell any security or other financial instrument or to participate in any trading strategy. Please refer to important information, disclosures and qualifications at the end of this material.
WEALTH MANAGEMENT INVESTMENT RESOURCES | CHARTBOOK | GLOBAL DIVERSIFICATION
0.7
0.8
0.9
1.0
1.1
1.2
1.3
1.4
1.5
1.6
1.7
1970 1973 1976 1979 1982 1985 1988 1991 1994 1997 2000 2003 2006 2009 2012 2015
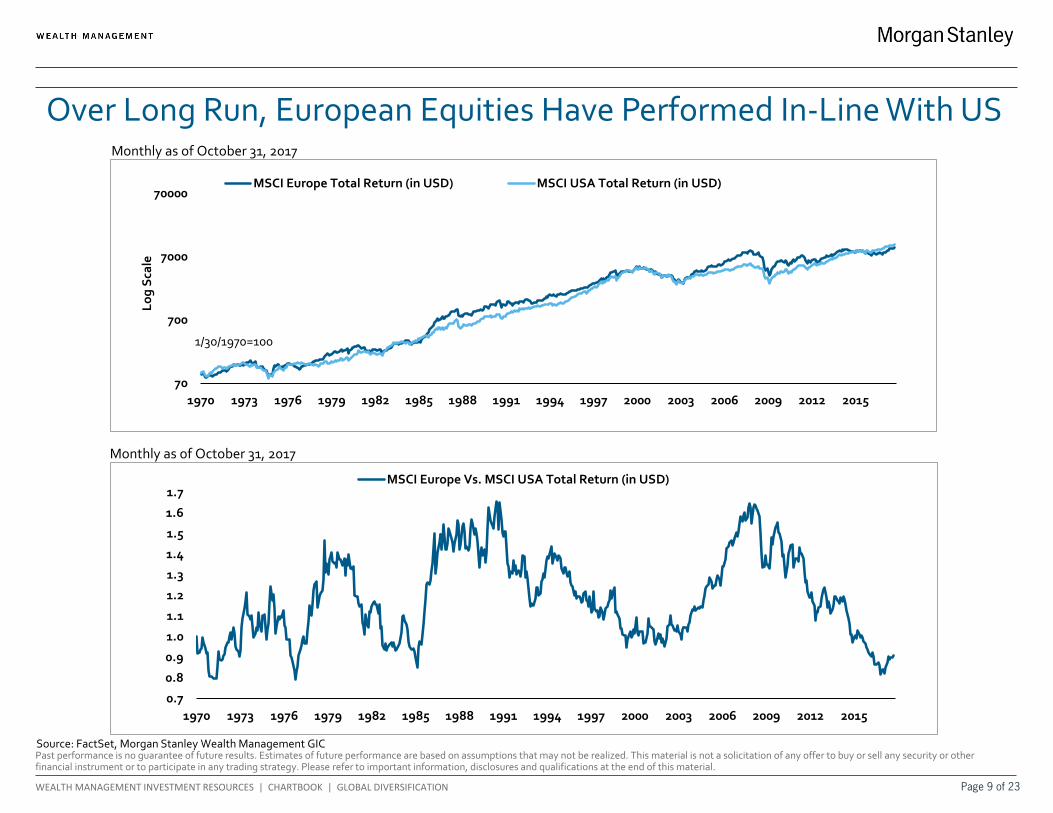
MSCI Europe Vs. MSCI USA Total Return (in USD)
70
700
7000
70000
1970 1973 1976 1979 1982 1985 1988 1991 1994 1997 2000 2003 2006 2009 2012 2015
Log
Scal
e
MSCI Europe Total Return (in USD) MSCI USA Total Return (in USD)
Over Long Run, European Equities Have Performed In-Line With US
Source: FactSet, Morgan Stanley Wealth Management GIC
1/30/1970=100
Monthly as of October 31, 2017
Monthly as of October 31, 2017
Page 9 of 23
Past performance is no guarantee of future results. Estimates of future performance are based on assumptions that may not be realized. This material is not a solicitation of any offer to buy or sell any security or other financial instrument or to participate in any trading strategy. Please refer to important information, disclosures and qualifications at the end of this material.
WEALTH MANAGEMENT INVESTMENT RESOURCES | CHARTBOOK | GLOBAL DIVERSIFICATION
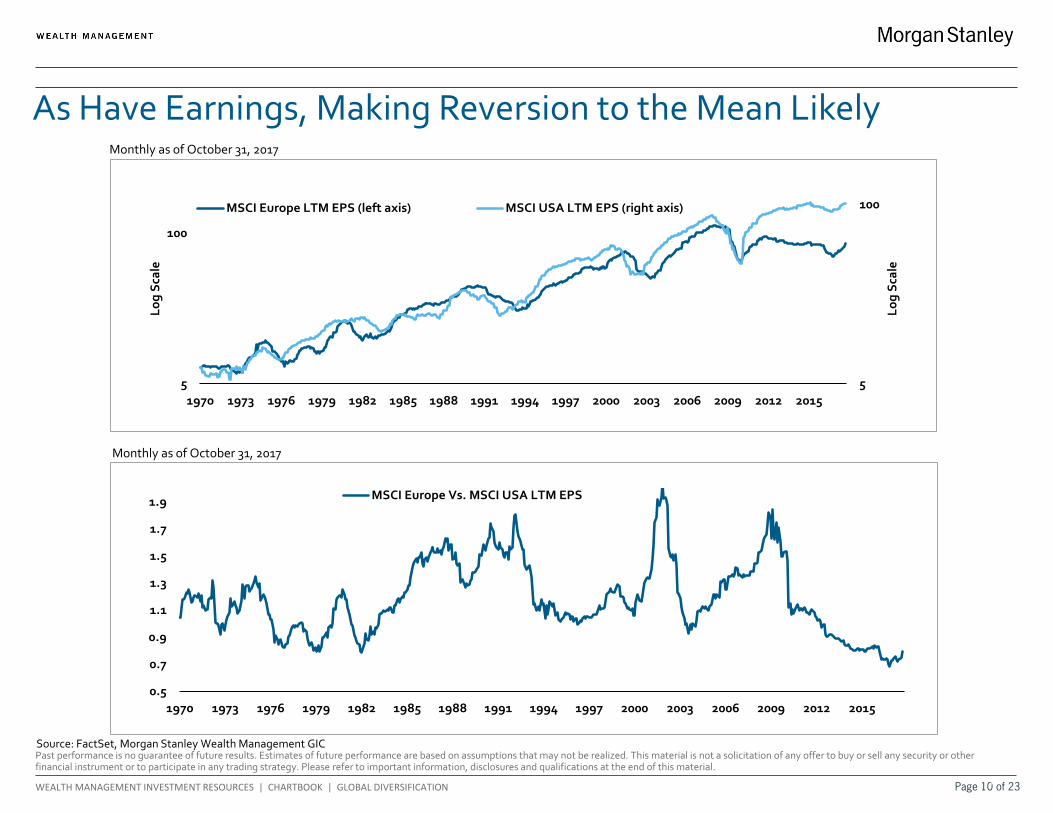
0.5
0.7
0.9
1.1
1.3
1.5
1.7
1.9
1970 1973 1976 1979 1982 1985 1988 1991 1994 1997 2000 2003 2006 2009 2012 2015
MSCI Europe Vs. MSCI USA LTM EPS
5
100
5
100
1970 1973 1976 1979 1982 1985 1988 1991 1994 1997 2000 2003 2006 2009 2012 2015
Log
Scal
e
Log
Scal
e
MSCI Europe LTM EPS (left axis) MSCI USA LTM EPS (right axis)
As Have Earnings, Making Reversion to the Mean Likely
Source: FactSet, Morgan Stanley Wealth Management GIC
Monthly as of October 31, 2017
Monthly as of October 31, 2017
Page 10 of 23
Past performance is no guarantee of future results. Estimates of future performance are based on assumptions that may not be realized. This material is not a solicitation of any offer to buy or sell any security or other financial instrument or to participate in any trading strategy. Please refer to important information, disclosures and qualifications at the end of this material.
WEALTH MANAGEMENT INVESTMENT RESOURCES | CHARTBOOK | GLOBAL DIVERSIFICATION
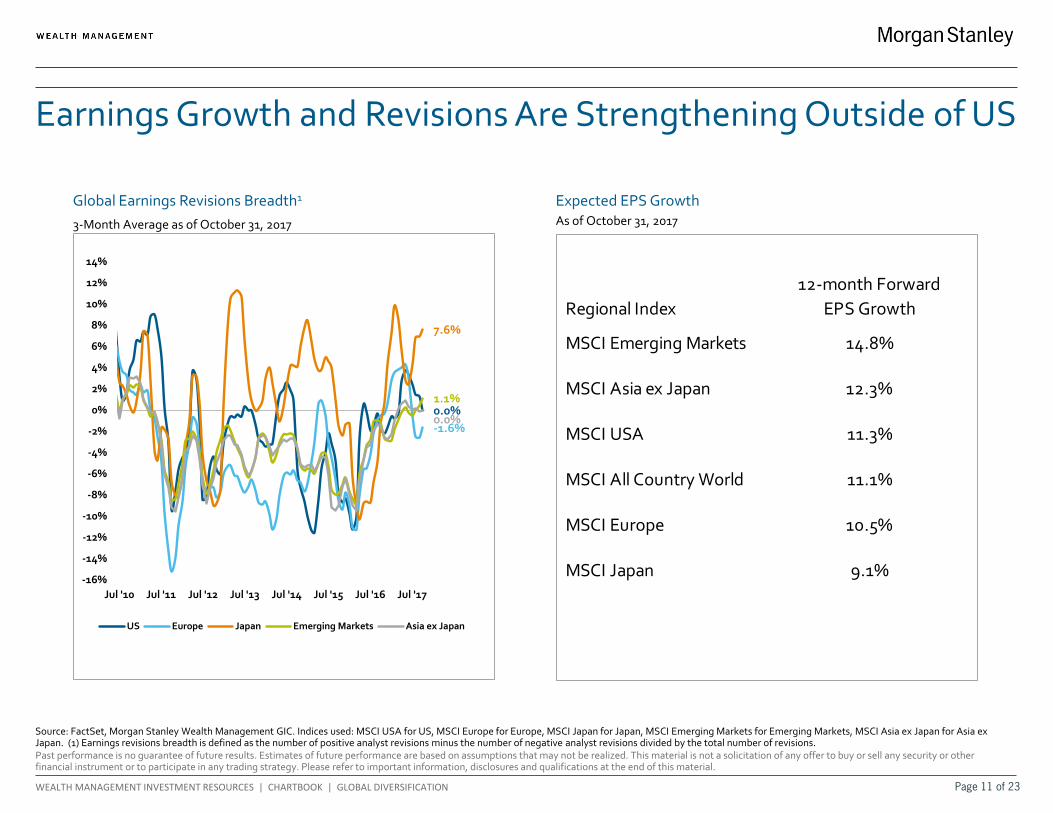
Regional Index12-month Forward
EPS Growth
MSCI Emerging Markets 14.8%
MSCI Asia ex Japan 12.3%
MSCI USA 11.3%
MSCI All Country World 11.1%
MSCI Europe 10.5%
MSCI Japan 9.1%
Earnings Growth and Revisions Are Strengthening Outside of US
Global Earnings Revisions Breadth1
Expected EPS Growth As of October 31, 2017
Source: FactSet, Morgan Stanley Wealth Management GIC. Indices used: MSCI USA for US, MSCI Europe for Europe, MSCI Japan for Japan, MSCI Emerging Markets for Emerging Markets, MSCI Asia ex Japan for Asia ex Japan. (1) Earnings revisions breadth is defined as the number of positive analyst revisions minus the number of negative analyst revisions divided by the total number of revisions.
0.0%-1.6%
7.6%
1.1%
0.0%
-16%
-14%
-12%
-10%
-8%
-6%
-4%
-2%
0%
2%
4%
6%
8%
10%
12%
14%
Jul '10 Jul '11 Jul '12 Jul '13 Jul '14 Jul '15 Jul '16 Jul '17
US Europe Japan Emerging Markets Asia ex Japan
3-Month Average as of October 31, 2017
Page 11 of 23
Past performance is no guarantee of future results. Estimates of future performance are based on assumptions that may not be realized. This material is not a solicitation of any offer to buy or sell any security or other financial instrument or to participate in any trading strategy. Please refer to important information, disclosures and qualifications at the end of this material.
WEALTH MANAGEMENT INVESTMENT RESOURCES | CHARTBOOK | GLOBAL DIVERSIFICATION
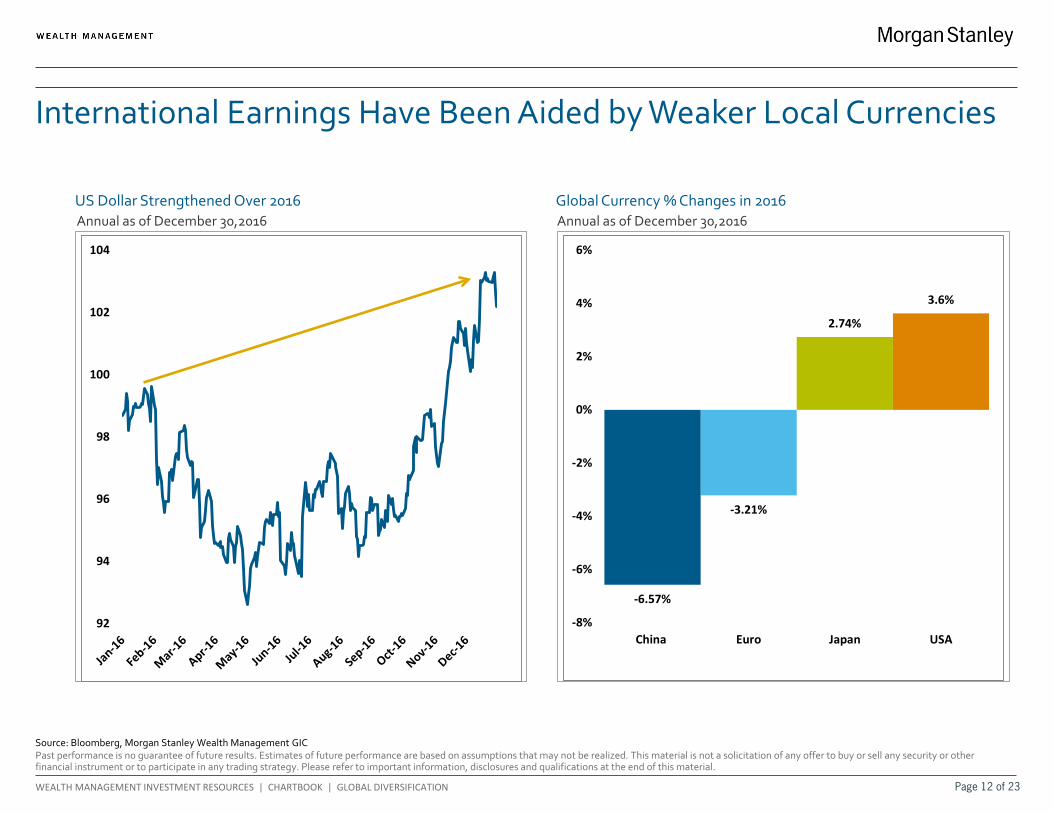
International Earnings Have Been Aided by Weaker Local Currencies
US Dollar Strengthened Over 2016
Global Currency % Changes in 2016
Source: Bloomberg, Morgan Stanley Wealth Management GIC
92
94
96
98
100
102
104
-6.57%
-3.21%
2.74%
3.6%
-8%
-6%
-4%
-2%
0%
2%
4%
6%
China Euro Japan USA
Annual as of December 30,2016 Annual as of December 30,2016
Page 12 of 23
Past performance is no guarantee of future results. Estimates of future performance are based on assumptions that may not be realized. This material is not a solicitation of any offer to buy or sell any security or other financial instrument or to participate in any trading strategy. Please refer to important information, disclosures and qualifications at the end of this material.
WEALTH MANAGEMENT INVESTMENT RESOURCES | CHARTBOOK | GLOBAL DIVERSIFICATION
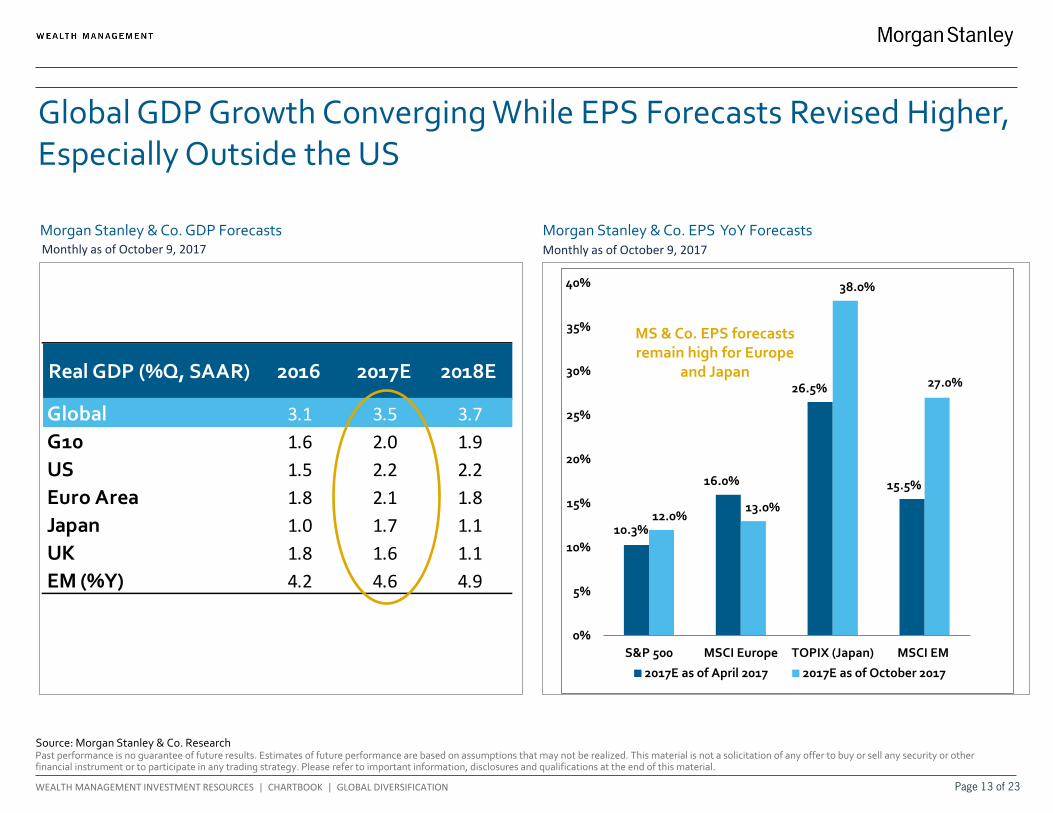
Real GDP (%Q, SAAR) 2016 2017E 2018E
Global 3.1 3.5 3.7G10 1.6 2.0 1.9US 1.5 2.2 2.2Euro Area 1.8 2.1 1.8Japan 1.0 1.7 1.1UK 1.8 1.6 1.1EM (%Y) 4.2 4.6 4.9
10.3%
16.0%
26.5%
15.5%
12.0%13.0%
38.0%
27.0%
0%
5%
10%
15%
20%
25%
30%
35%
40%
S&P 500 MSCI Europe TOPIX (Japan) MSCI EM
2017E as of April 2017 2017E as of October 2017
Global GDP Growth Converging While EPS Forecasts Revised Higher, Especially Outside the US
Source: Morgan Stanley & Co. Research
Morgan Stanley & Co. GDP Forecasts
Morgan Stanley & Co. EPS YoY Forecasts Monthly as of October 9, 2017
MS & Co. EPS forecasts remain high for Europe
and Japan
Monthly as of October 9, 2017
Page 13 of 23
Past performance is no guarantee of future results. Estimates of future performance are based on assumptions that may not be realized. This material is not a solicitation of any offer to buy or sell any security or other financial instrument or to participate in any trading strategy. Please refer to important information, disclosures and qualifications at the end of this material.
WEALTH MANAGEMENT INVESTMENT RESOURCES | CHARTBOOK | GLOBAL DIVERSIFICATION
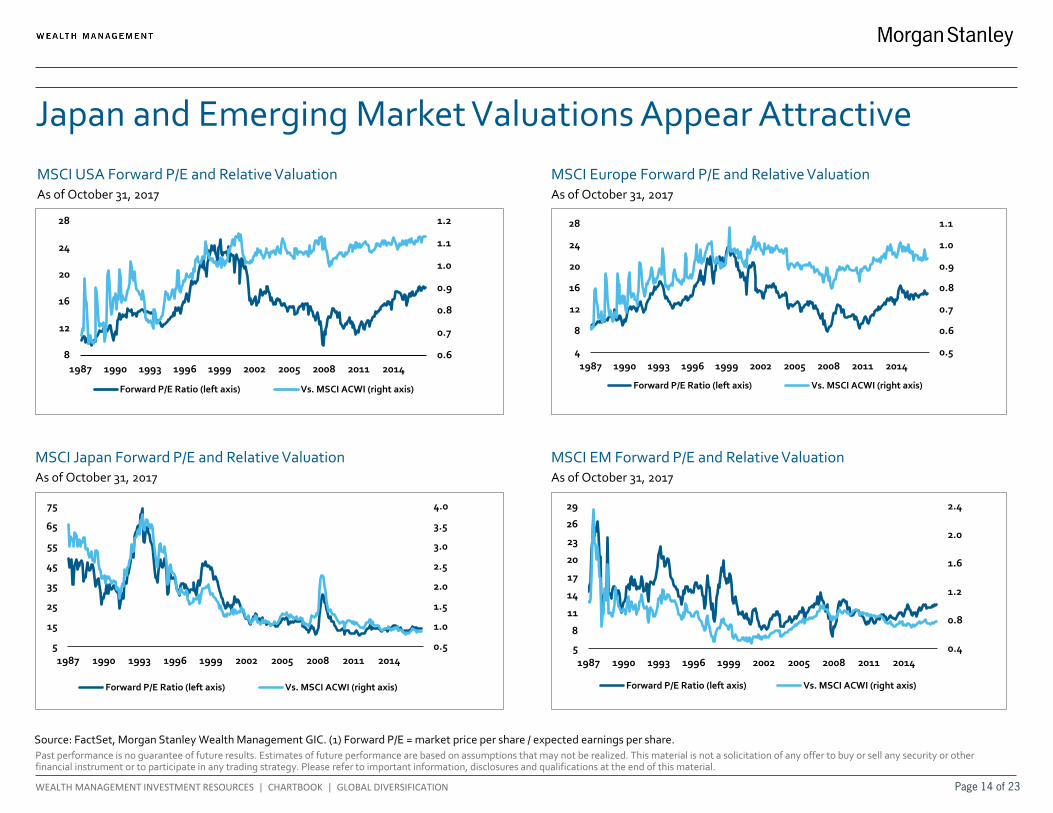
MSCI Japan Forward P/E and Relative Valuation As of October 31, 2017
MSCI Europe Forward P/E and Relative Valuation As of October 31, 2017
MSCI USA Forward P/E and Relative Valuation As of October 31, 2017
MSCI EM Forward P/E and Relative Valuation As of October 31, 2017
0.5
0.6
0.7
0.8
0.9
1.0
1.1
4
8
12
16
20
24
28
1987 1990 1993 1996 1999 2002 2005 2008 2011 2014
Forward P/E Ratio (left axis) Vs. MSCI ACWI (right axis)
0.5
1.0
1.5
2.0
2.5
3.0
3.5
4.0
5
15
25
35
45
55
65
75
1987 1990 1993 1996 1999 2002 2005 2008 2011 2014
Forward P/E Ratio (left axis) Vs. MSCI ACWI (right axis)
0.6
0.7
0.8
0.9
1.0
1.1
1.2
8
12
16
20
24
28
1987 1990 1993 1996 1999 2002 2005 2008 2011 2014
Forward P/E Ratio (left axis) Vs. MSCI ACWI (right axis)
Japan and Emerging Market Valuations Appear Attractive
Source: FactSet, Morgan Stanley Wealth Management GIC. (1) Forward P/E = market price per share / expected earnings per share.
0.4
0.8
1.2
1.6
2.0
2.4
5
8
11
14
17
20
23
26
29
1987 1990 1993 1996 1999 2002 2005 2008 2011 2014
Forward P/E Ratio (left axis) Vs. MSCI ACWI (right axis)
Page 14 of 23
Past performance is no guarantee of future results. Estimates of future performance are based on assumptions that may not be realized. This material is not a solicitation of any offer to buy or sell any security or other financial instrument or to participate in any trading strategy. Please refer to important information, disclosures and qualifications at the end of this material.
WEALTH MANAGEMENT INVESTMENT RESOURCES | CHARTBOOK | GLOBAL DIVERSIFICATION
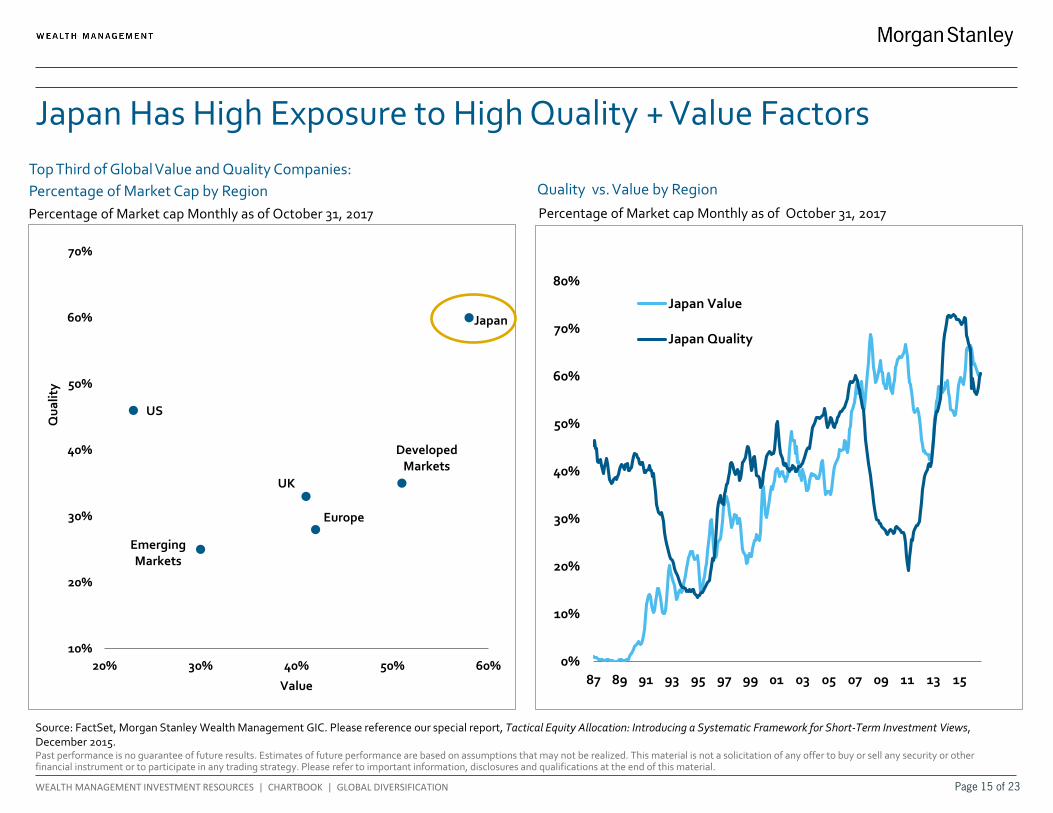
Top Third of Global Value and Quality Companies: Percentage of Market Cap by Region
Japan Has High Exposure to High Quality + Value Factors
Quality vs. Value by Region
Percentage of Market cap Monthly as of October 31, 2017
Source: FactSet, Morgan Stanley Wealth Management GIC. Please reference our special report, Tactical Equity Allocation: Introducing a Systematic Framework for Short-Term Investment Views, December 2015.
Percentage of Market cap Monthly as of October 31, 2017
Developed Markets
Emerging Markets
Europe
Japan
UK
US
10%
20%
30%
40%
50%
60%
70%
20% 30% 40% 50% 60%
Qua
lity
Value
`
0%
10%
20%
30%
40%
50%
60%
70%
80%
87 89 91 93 95 97 99 01 03 05 07 09 11 13 15
Japan Value
Japan Quality
Page 15 of 23

Past performance is no guarantee of future results. Estimates of future performance are based on assumptions that may not be realized. This material is not a solicitation of any offer to buy or sell any security or other financial instrument or to participate in any trading strategy. Please refer to important information, disclosures and qualifications at the end of this material.
WEALTH MANAGEMENT INVESTMENT RESOURCES | CHARTBOOK | GLOBAL DIVERSIFICATION
-5%
-3%
-1%
1%
3%
5%
7%
9%
11%
13%
15%
17%
19%
21%
23%0
5
10
15
20
25
30
35
40
451989 1993 1997 2001 2005 2009 2013 2017 2021 2025
MSC
I Eur
ope
10-y
ear T
otal
Ret
urn,
Ann
ual
Cycl
ical
ly A
djus
ted
P/E
Rat
io, i
nver
ted
CAPE Ratio for MSCI Europe, movedahead 10 years, left axis
MSCI Europe trailing 10-yearannualized return, right axis
0.58
0.4
0.5
0.6
0.7
0.8
0.9
1.0
1.1
1.2
1.3
1.4
1.5
1979 1983 1987 1991 1995 1999 2003 2007 2011 2015
+ 2 Std Dev
+ 1 Std Dev
Average
- 1 Std Dev
- 2 Std Dev
European Equities Appear Cheap
CAPE Ratio1: MSCI Europe Relative to S&P 500 CAPE Ratio Vs. MSCI Europe
Europe at a near-record discount to US
Source: FactSet, Morgan Stanley Wealth Management GIC. (1) The cyclically adjusted P/E ratio (CAPE), also known as the Shiller P/E ratio, uses a 10-year average of inflation-adjusted earnings to value the stock market. Historically, cyclically adjusted price-earnings ratios have led subsequent returns with a 10-year lag. Recent price earnings levels suggest equity returns could be better going forward than they have been over the recent past, assuming the statistical relationship holds. Standard deviation (volatility) is a measure of the dispersion of a set of data from its mean.
Implies a 13% annualized return
E E E
Monthly as of October 31, 2017 Monthly as of October 31, 2017
Page 16 of 23
Past performance is no guarantee of future results. Estimates of future performance are based on assumptions that may not be realized. This material is not a solicitation of any offer to buy or sell any security or other financial instrument or to participate in any trading strategy. Please refer to important information, disclosures and qualifications at the end of this material.
WEALTH MANAGEMENT INVESTMENT RESOURCES | CHARTBOOK | GLOBAL DIVERSIFICATION
-1.0%
0.0%
1.0%
2.0%
3.0%
4.0%
5.0%
6.0%
Australia UK France Canada Switzerland Germany US Japan
Dividend Yield Government 10-Year Bond Yield
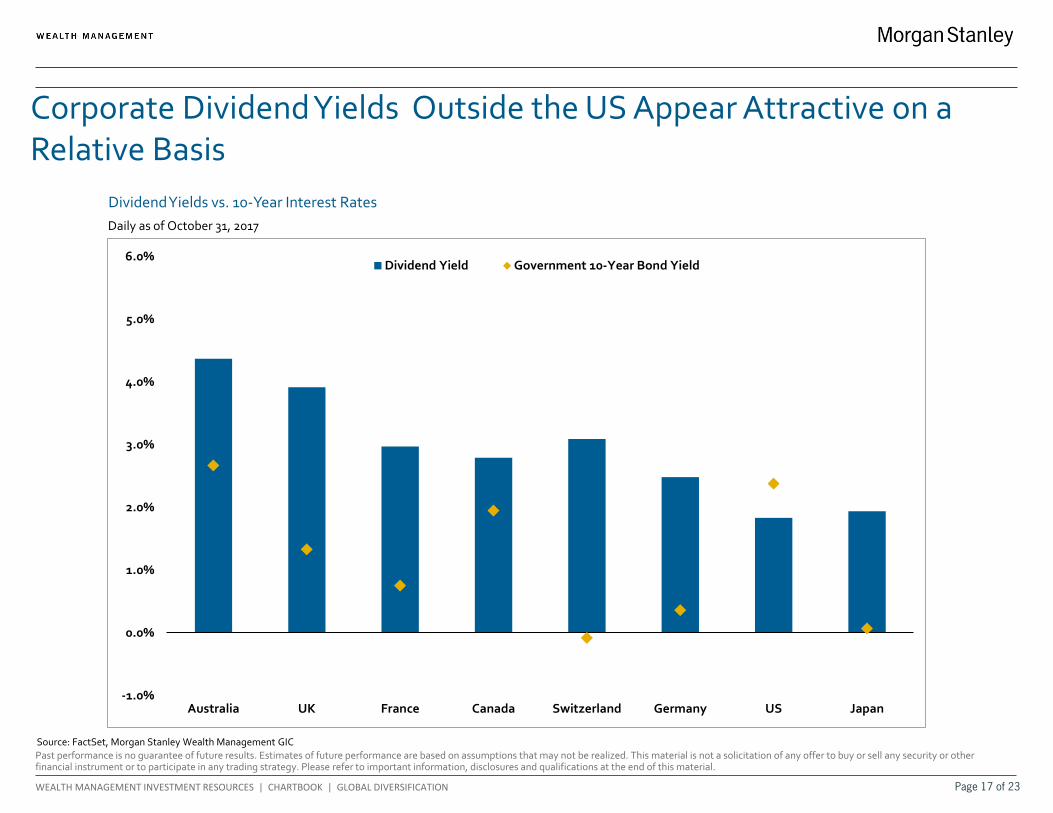
Dividend Yields vs. 10-Year Interest Rates
Corporate Dividend Yields Outside the US Appear Attractive on a Relative Basis
Source: FactSet, Morgan Stanley Wealth Management GIC
Daily as of October 31, 2017
Page 17 of 23
Morgan Stanley Wealth Management is the trade name of Morgan Stanley Smith Barney LLC, a registered broker-dealer in the United States. The sole purpose of this material is to inform, and it in no way is intended to be an offer or solicitation to purchase or sell any security, other investment or service, or to attract any funds or deposits . Investments mentioned may not be suitable for all clients. Any product discussed herein may be purchased only after a client has carefully reviewed the offering memorandum and executed the subscription documents. Morgan Stanley Wealth Management has not considered the actual or desired investment objectives, goals, strategies, guidelines, or factual circumstances of any investor in any fund(s). Before making any investment, each investor should carefully consider the risks associated with the investment, as discussed in the applicable offering memorandum, and make a determination based upon their own particular circumstances, that the investment is consistent with their investment objectives and risk tolerance . Morgan Stanley Smith Barney LLC offers investment program services through a variety of investment programs, which are opened pursuant to written client agreements. Each program offers investment managers, funds and features that are not available in other programs; conversely, some investment managers, funds or investment strategies may be available in more than one program.Morgan Stanley’s investment advisory programs may require a minimum asset level and, depending on your specific investment objectives and financial position, may not be suitable for you . Please see the Morgan Stanley Smith Barney LLC program disclosure brochure (the “Morgan Stanley ADV”) for more information in the investment advisory programs available. The Morgan Stanley ADV is available at www.morganstanley.com/ADV. Sources of Data. Information in this material in this report has been obtained from sources that we believe to be reliable, but we do not guarantee its accuracy, completeness or timeliness. Third-party data providers make no warranties or representations relating to the accuracy, completeness or timeliness of the data they provide and are not liable for any damages relating to this data. All opinions included in this material constitute the Firm’s judgment as of the date of this material and are subject to change without notice . This material was not prepared by the research departments of Morgan Stanley & Co. LLC or Morgan Stanley Smith Barney LLC. Some historical figures may be revised due to newly identified programs, firm restatements, etc.Global Investment Manager Analysis (GIMA) Focus List, Approved List and Tactical Opportunities List; Watch Policy. GIMA uses two methods to evaluate investment products in applicable advisory programs: Focus (and investment products meeting this standard are described as being on the Focus List) and Approved (and investment products meeting this standard are described as being on the Approved List). In general, Focus entails a more thorough evaluation of an investment product than Approved. Sometimes an investment product may be evaluated using the Focus List process but then placed on the Approved List instead of the Focus List. Investment products may move from the Focus List to the Approved List, or vice versa. GIMA may also determine that an investment product no longer meets the criteria under either process and will no longer be recommended in investment advisory programs (in which case the investment product is given a “Not Approved” status). GIMA has a ‘Watch” policy and may describe a Focus List or Approved List investment product as being on “Watch” if GIMA identifies specific areas that (a) merit further evaluation by GIMA and (b) may, but are not certain to, result in the investment product becoming “Not Approved.” The Watch period depends on the length of time needed for GIMA to conduct its evaluation and for the investment manager or fund to address any concerns. Certain investment products on either the Focus List or Approved List may also be recommended for the Tactical Opportunities List based in part on tactical opportunities existing at a given time. The investment products on the Tactical Opportunities List change over time. For more information on the Focus List, Approved List, Tactical Opportunities List and Watch processes, please see the applicable Form ADV Disclosure Document for Morgan Stanley Wealth Management . Your Financial Advisor or Private Wealth Advisor can also provide upon request a copy of a publication entitled “Manager Selection Process.”The Global Investment Committee is a group of seasoned investment professionals who meet regularly to discuss the global economy and markets. The committee determines the investment outlook that guides our advice to clients. They continually monitor developing economic and market conditions, review tactical outlooks and recommend model portfolio weightings, as well as produce a suite of strategy, analysis, commentary, portfolio positioning suggestions and other reports and broadcasts.The Global Investment Manager Analysis (GIMA) Services Only Apply to Certain Investment Advisory Programs GIMA evaluates certain investment products for the purposes of some – but not all – of Morgan Stanley Smith Barney LLC’s investment advisory programs (as described in more detail in the applicable Form ADV Disclosure Document for Morgan Stanley Wealth Management). If you do not invest through one of these investment advisory programs, Morgan Stanley Wealth Management is not obligated to provide you notice of any GIMA Status changes even though it may give notice to clients in other programs.Strategy May Be Available as a Separately Managed Account or Mutual Fund Strategies are sometimes available in Morgan Stanley Wealth Management investment advisory programs both in the form of a separately managed account (“SMA”) and a mutual fund. These may have different expenses and investment minimums. Your Financial Advisor or Private Wealth Advisor can provide more information on whether any particular strategy is available in more than one form in a particular investment advisory program. In most Morgan Stanley Wealth Management investment advisory accounts, fees are deducted quarterly and have a compounding effect on performance. For example, on an advisory account with a 3% annual fee, if the gross annual performance is 6.00%, the compounding effect of the fees will result in a net performance of approximately 3.93% after one year, 1 after three years, and 21.23% after five years. Conflicts of Interest: GIMA’s goal is to provide professional, objective evaluations in support of the Morgan Stanley Wealth Management investment advisory programs. We have policies and procedures to help us meet this goal. However, our business is subject to various conflicts of interest. For example, ideas and suggestions for which investment products should be evaluated by GIMA come from a variety of sources, including our Morgan Stanley Wealth Management Financial Advisors and their direct or indirect managers, and other business persons within Morgan Stanley Wealth Management or its affiliates . Such persons may have an ongoing business relationship with certain investment managers or mutual fund companies whereby they, Morgan Stanley Wealth Management or its affiliates receive compensation from, or otherwise related to, those investment managers or mutual funds. For example, a Financial Advisor may suggest that GIMA evaluates an investment manager or fund in which a portion of his or her clients’ assets are already invested. While such a recommendation is permissible, GIMA is responsible for the opinions expressed by GIMA. See the conflicts of interest section in the applicable Form ADV Disclosure Document for Morgan Stanley Wealth Management for a discussion of other types of conflicts that may be relevant to GIMA’s evaluation of managers and funds. In addition, Morgan Stanley Wealth Management, MS & Co., managers and their affiliates provide a variety of services (including research, brokerage, asset management, trading, lending and investment banking
DISCLOSURESPage 18 of 23

services) for each other and for various clients, including issuers of securities that may be recommended for purchase or sale by clients or are otherwise held in client accounts, and managers in various advisory programs. Morgan Stanley Wealth Management, managers, MS & Co., and their affiliates receive compensation and fees in connection with these services. Morgan Stanley Wealth Management believes that the nature and range of clients to which such services are rendered is such that it would be inadvisable to exclude categorically all of these companies from an account .Consider Your Own Investment Needs: The model portfolios and strategies discussed in the material are formulated based on general client characteristics including risk tolerance . This material is not intended to be a client-specific suitability analysis or recommendation, or offer to participate in any investment. Therefore, clients should not use this profile as the sole basis for investment decisions. They should consider all relevant information, including their existing portfolio, investment objectives, risk tolerance, liquidity needs and investment time horizon . Such a suitability determination may lead to asset allocation results that are materially different from the asset allocation shown in this profile. Talk to your Financial Advisor about what would be a suitable asset allocation for you, whether CGCM is a suitable program for you.No obligation to notify – Morgan Stanley Wealth Management has no obligation to notify you when the model portfolios, strategies, or any other information, in this material changes .Please consider the investment objectives, risks, fees, and charges and expenses of mutual funds, ETFs, closed end funds, unit investment trusts, and variable insurance products carefully before investing. The prospectus contains this and other information about each fund. To obtain a prospectus, contact your Financial Advisor or Private Wealth Advisor or visit the Morgan Stanley website at www.morganstanley.com. Please read it carefully before investing.An investment in a money market fund is not insured or guaranteed by the Federal Deposit Insurance Corporation or any other government agency. Although the Fund seeks to preserve the value of your investment at $1.00 per share, it is possible to lose money by investing in the fund.The type of mutual funds and ETFs discussed in this presentation utilizes nontraditional or complex investment strategies and /or derivatives. Examples of these types of funds include those that utilize one or more of the below noted investment strategies or categories or which seek exposure to the following markets: (1) commodities (e .g., agricultural, energy and metals), currency, precious metals; (2) managed futures; (3) leveraged, inverse or inverse leveraged; (4) bear market, hedging, long-short equity, market neutral; (5) real estate; (6) volatility (seeking exposure to the CBOE VIX Index). Investors should keep in mind that while mutual funds and ETFs may, at times, utilize nontraditional investment options and strategies, they should not be equated with unregistered privately offered alternative investments. Because of regulatory limitations, mutual funds and ETFs that seek alternative-like investment exposure must utilize a more limited investment universe. As a result, investment returns and portfolio characteristics of alternative mutual funds and ETFs may vary from traditional hedge funds pursuing similar investment objectives. Moreover, traditional hedge funds have limited liquidity with long “lock-up” periods allowing them to pursue investment strategies without having to factor in the need to meet client redemptions and ETFs trade on an exchange . On the other hand, mutual funds typically must meet daily client redemptions. This differing liquidity profile can have a material impact on the investment returns generated by a mutual or ETF pursuing an alternative investing strategy compared with a traditional hedge fund pursuing the same strategy.Nontraditional investment options and strategies are often employed by a portfolio manager to further a fund’s investment objective and to help offset market risks . However, these features may be complex, making it more difficult to understand the fund’s essential characteristics and risks, and how it will perform in different market environments and over various periods of time . They may also expose the fund to increased volatility and unanticipated risks particularly when used in complex combinations and/or accompanied by the use of borrowing or “leverage.”KEY ASSET CLASS CONSIDERATIONS AND OTHER RISKSInvesting in the markets entails the risk of market volatility. The value of all types of investments, including stocks, mutual funds, exchange-traded funds (“ETFs”), closed-end funds, and unit investment trusts, may increase or decrease over varying time periods. To the extent the investments depicted herein represent international securities, you should be aware that there may be additional risks associated with international investing, including foreign economic, political, monetary and/or legal factors, changing currency exchange rates, foreign taxes, and differences in financial and accounting standards. These risks may be magnified in emerging markets and frontier markets. Small- and mid-capitalization companies may lack the financial resources, product diversification and competitive strengths of larger companies. In addition, the securities of small- and mid-capitalization companies may not trade as readily as, and be subject to higher volatility than, those of larger, more established companies. The value of fixed income securities will fluctuate and, upon a sale, may be worth more or less than their original cost or maturity value. Bonds are subject to interest rate risk, call risk, reinvestment risk, liquidity risk, and credit risk of the issuer. High yield bonds are subject to additional risks such as increased risk of default and greater volatility because of the lower credit quality of the issues. In the case of municipal bonds, income is generally exempt from federal income taxes. Some income may be subject to state and local taxes and to the federal alternative minimum tax. Capital gains, if any, are subject to tax. Treasury Inflation Protection Securities’ (TIPS) coupon payments and underlying principal are automatically increased to compensate for inflation by tracking the consumer price index (CPI). While the real rate of return is guaranteed, TIPS tend to offer a low return . Because the return of TIPS is linked to inflation, TIPS may significantly underperform versus conventional U.S. Treasuries in times of low inflation. There is no guarantee that investors will receive par if TIPS are sold prior to maturity. The returns on a portfolio consisting primarily of environmental, social, and governance-aware investments (“ESG”) may be lower or higher than a portfolio that is more diversified or where decisions are based solely on investment considerations. Because ESG criteria exclude some investments, investors may not be able to take advantage of the same opportunities or market trends as investors that do not use such criteria. The companies identified and investment examples are for illustrative purposes only and should not be deemed a recommendation to purchase, hold or sell any securities or investment products. They are intended to demonstrate the approaches taken by managers who focus on ESG criteria in their investment strategy. There can be no guarantee that a client's account will be managed as described herein. Options and margin trading involve substantial risk and are not suitable for all investors. Besides the general investment risk of holding securities that may decline in value and the possible loss of principal invested, closed-end funds may have additional risks related to declining market prices relative to net asset values (NAVs), active manager underperformance and potential leverage. Closed-end funds, unlike open-end funds, are not continuously offered. There is a one-time public offering and once issued, shares of closed-end funds are sold in the open
DISCLOSURESPage 19 of 23

market through a stock exchange. NAV is total assets less total liabilities divided by the number of shares outstanding. At the time an investor purchases shares of a closed-end fund, shares may have a market price that is above or below NAV. Portfolios that invest a large percentage of assets in only one industry sector (or in only a few sectors) are more vulnerable to price fluctuation than those that diversify among a broad range of sectors. Alternative investments often are speculative and include a high degree of risk. Investors could lose all or a substantial amount of their investment. Alternative investments are suitable only for eligible, long-term investors who are willing to forgo liquidity and put capital at risk for an indefinite period of time. They may be highly illiquid and can engage in leverage and other speculative practices that may increase the volatility and risk of loss. Alternative Investments typically have higher fees than traditional investments. Investors should carefully review and consider potential risks before investing. Certain of these risks may include but are not limited to: Loss of all or a substantial portion of the investment due to leveraging, short-selling, or other speculative practices; Lack of liquidity in that there may be no secondary market for a fund; Volatility of returns; Restrictions on transferring interests in a fund; Potential lack of diversification and resulting higher risk due to concentration of trading authority when a single advisor is utilized; Absence of information regarding valuations and pricing; Complex tax structures and delays in tax reporting; Less regulation and higher fees than mutual funds; and Risks associated with the operations, personnel, and processes of the manager . As a diversified global financial services firm, Morgan Stanley Wealth Management engages in a broad spectrum of activities including financial advisory services, investment management activities, sponsoring and managing private investment funds, engaging in broker-dealer transactions and principal securities, commodities and foreign exchange transactions, research publication, and other activities . In the ordinary course of its business, Morgan Stanley Wealth Management therefore engages in activities where Morgan Stanley Wealth Management’s interests may conflict with the interests of its clients, including the private investment funds it manages. Morgan Stanley Wealth Management can give no assurance that conflicts of interest will be resolved in favor of its clients or any such fund. All expressions of opinion are subject to change without notice and are not intended to be a forecast of future events or results. Further, opinions regarding Alternative Investments expressed herein may differ from the opinions expressed by Morgan Stanley Wealth Management and/or other businesses/affiliates of Morgan Stanley Wealth Management. This is not a "research report" as defined by NASD Conduct Rule 2711 and was not prepared by the Research Departments of Morgan Stanley Smith Barney LLC or Morgan Stanley & Co. LLC or its affiliates. Certain information contained herein may constitute forward-looking statements. Due to various risks and uncertainties, actual events, results or the performance of a fund may differ materially from those reflected or contemplated in such forward-looking statements. Clients should carefully consider the investment objectives, risks, charges, and expenses of a fund before investing . While the HFRI indices are frequently used, they have limitations (some of which are typical of other widely used indices). These limitations include survivorship bias (the returns of the indices may not be representative of all the hedge funds in the universe because of the tendency of lower performing funds to leave the index); heterogeneity (not all hedge funds are alike or comparable to one another, and the index may not accurately reflect the performance of a described style); and limited data (many hedge funds do not report to indices, and the index may omit funds, the inclusion of which might significantly affect the performance shown . The HFRI indices are based on information self-reported by hedge fund managers that decide on their own, at any time, whether or not they want to provide, or continue to provide, information to HFR Asset Management, L.L.C. Results for funds that go out of business are included in the index until the date that they cease operations . Therefore, these indices may not be complete or accurate representations of the hedge fund universe, and may be biased in several ways. Composite index results are shown for illustrative purposes and do not represent the performance of a specific investment. Individual funds have specific tax risks related to their investment programs that will vary from fund to fund. Clients should consult their own tax and legal advisors as Morgan Stanley Wealth Management does not provide tax or legal advice. Interests in alternative investment products are offered pursuant to the terms of the applicable offering memorandum, are distributed by Morgan Stanley Smith Barney LLC and certain of its affiliates, and (1) are not FDIC-insured, (2) are not deposits or other obligations of Morgan Stanley or any of its affiliates, (3) are not guaranteed by Morgan Stanley and its affiliates, and (4) involve investment risks, including possible loss of principal. Morgan Stanley Smith Barney LLC is a registered broker-dealer, not a bank. This material is not to be reproduced or distributed to any other persons (other than professional advisors of the investors or prospective investors, as applicable, receiving this material) and is intended solely for the use of the persons to whom it has been delivered. This material is not for distribution to the general public. Past performance is no guarantee of future results. Actual results may vary. SIPC insurance does not apply to precious metals, other commodities, or traditional alternative investments. Interests in alternative investment products are offered pursuant to the terms of the applicable offering memorandum, are distributed by Morgan Stanley Smith Barney LLC and certain of its affiliates, and (1) are not FDIC-insured, (2) are not deposits or other obligations of Morgan Stanley or any of its affiliates, (3) are not guaranteed by Morgan Stanley and its affiliates, and (4) involve investment risks, including possible loss of principal . Morgan Stanley Smith Barney LLC is a registered broker-dealer, not a bank. In Consulting Group’s advisory programs, alternative investments are limited to US-registered mutual funds, separate account strategies and exchange-traded funds (ETFs) that seek to pursue alternative investment strategies or returns utilizing publicly traded securities. Investment products in this category may employ various investment strategies and techniques for both hedging and more speculative purposes such as short-selling, leverage, derivatives and options, which can increase volatility and the risk of investment loss. Alternative investments are not suitable for all investors. As a diversified global financial services firm, Morgan Stanley Wealth Management engages in a broad spectrum of activities including financial advisory services, investment management activities, sponsoring and managing private investment funds, engaging in broker-dealer transactions and principal securities, commodities and foreign exchange transactions, research publication, and other activities. In the ordinary course of its business, Morgan Stanley Wealth Management therefore engages in activities where Morgan Stanley Wealth Management’s interests may conflict with the interests of its clients, including the private investment funds it manages. Morgan Stanley Wealth Management can give no assurance that conflicts of interest will be resolved in favor of its clients or any such fund. Alternative investments involve complex tax structures, tax inefficient investing, and delays in distributing important tax information . Individual funds have specific risks related to their investment programs that will vary from fund to fund. Clients should consult their own tax and legal advisors as Morgan Stanley Wealth Management does not provide tax or legal advice.While the HFRI indices are frequently used, they have limitations (some of which are typical of other widely used indices). These limitations include survivorship bias (the returns of the indices may not be representative of all the hedge funds in the universe because of the tendency of lower performing funds to leave the index); heterogeneity (not all hedge funds are alike or comparable to one
DISCLOSURESPage 20 of 23
another, and the index may not accurately reflect the performance of a described style); and limited data (many hedge funds do not report to indices, and the index may omit funds, the inclusion of which might significantly affect the performance shown. The HFRI indices are based on information self-reported by hedge fund managers that decide on their own, at any time, whether or not they want to provide, or continue to provide, information to HFR Asset Management, L.L.C. Results for funds that go out of business are included in the index until the date that they cease operations . Therefore, these indices may not be complete or accurate representations of the hedge fund universe, and may be biased in several ways .It should be noted that the majority of hedge fund indexes are comprised of hedge fund manager returns. This is in contrast to traditional indexes, which are comprised of individual securities in the various market segments they represent and offer complete transparency as to membership and construction methodology. As such, some believe that hedge fund index returns have certain biases that are not present in traditional indexes. Some of these biases inflate index performance, while others may skew performance negatively. However, many studies indicate that overall hedge fund index performance has been biased to the upside. Some studies suggest performance has been inflated by up to 260 basis points or more annually depending on the types of biases included and the time period studied. Although there are numerous potential biases that could affect hedge fund returns, we identify some of the more common ones throughout this paper . Self-selection bias results when certain manager returns are not included in the index returns and may result in performance being skewed up or down. Because hedge funds are private placements, hedge fund managers are able to decide which fund returns they want to report and are able to opt out of reporting to the various databases. Certain hedge fund managers may choose only to report returns for funds with strong returns and opt out of reporting returns for weak performers. Other hedge funds that close may decide to stop reporting in order to retain secrecy, which may cause a downward bias in returns. Survivorship bias results when certain constituents are removed from an index. This often results from the closure of funds due to poor performance, “blow ups,” or other such events. As such, this bias typically results in performance being skewed higher. As noted, hedge fund index performance biases can result in positive or negative skew. However, it would appear that the skew is more often positive. While it is difficult to quantify the effects precisely, investors should be aware that idiosyncratic factors may be giving hedge fund index returns an artificial “lift” or upwards bias .Hedge Funds of Funds and many funds of funds are private investment vehicles restricted to certain qualified private and institutional investors. They are often speculative and include a high degree of risk. Investors can lose all or a substantial amount of their investment. They may be highly illiquid, can engage in leverage and other speculative practices that may increase volatility and the risk of loss, and may be subject to large investment minimums and initial lockups. They involve complex tax structures, tax-inefficient investing and delays in distributing important tax information. Categorically, hedge funds and funds of funds have higher fees and expenses than traditional investments, and such fees and expenses can lower the returns achieved by investors . Funds of funds have an additional layer of fees over and above hedge fund fees that will offset returns. An investment in an exchange-traded fund involves risks similar to those of investing in a broadly based portfolio of equity securities traded on an exchange in the relevant securities market, such as market fluctuations caused by such factors as economic and political developments, changes in interest rates and perceived trends in stock and bond prices. An investment in a target date portfolio is subject to the risks attendant to the underlying funds in which it invests, in these portfolios the funds are the Consulting Group Capital Market funds. A target date portfolio is geared to investors who will retire and/or require income at an approximate year. The portfolio is managed to meet the investor’s goals by the pre-established year or “target date.” A target date portfolio will transition its invested assets from a more aggressive portfolio to a more conservative portfolio as the target date draws closer . An investment in the target date portfolio is not guaranteed at any time, including, before or after the target date is reached . Managed futures investments are speculative, involve a high degree of risk, use significant leverage, are generally illiquid, have substantial charges, subject investors to conflicts of interest, and are suitable only for the risk capital portion of an investor’s portfolio . Managed futures investments do not replace equities or bonds but rather may act as a complement in a well diversified portfolio. Managed Futures are complex and not appropriate for all investors. Rebalancing does not protect against a loss in declining financial markets. There may be a potential tax implication with a rebalancing strategy. Asset allocation and diversification do not assure a profit or protect against loss in declining financial markets. Past performance is no guarantee of future results. Actual results may vary.Tax laws are complex and subject to change. Morgan Stanley Smith Barney LLC (“Morgan Stanley”), its affiliates and Morgan Stanley Financial Advisors and Private Wealth Advisors do not provide tax or legal advice and are not “fiduciaries” (under ERISA, the Internal Revenue Code or otherwise) with respect to the services or activities described herein except as otherwise provided in writing by Morgan Stanley and/or as described at www.morganstanley.com/disclosures/dol. Individuals are encouraged to consult their tax and legal advisors (a) before establishing a retirement plan or account, and (b) regarding any potential tax, ERISA and related consequences of any investments made under such plan or account.Insurance products are offered in conjunction with Morgan Stanley Smith Barney LLC’s licensed insurance agency affiliates.Indices are unmanaged. An investor cannot invest directly in an index. They are shown for illustration purposes only and do not show the performance of any specific investment. Reference to an index does not imply that the portfolio will achieve return, volatility or other results similar to the index. The composition of an index may not reflect the manner in which a portfolio is constructed in relation to expected or achieved returns, portfolio guidelines, restrictions, sectors, correlations, concentrations, volatility, or tracking error target, all of which are subject to change over time .This material is not a financial plan and does not create an investment advisory relationship between you and your Morgan Stanley Financial Advisor. We are not your fiduciary either under the Employee Retirement Income Security Act of 1974 (ERISA) or the Internal Revenue Code of 1986, and any information in this report is not intended to form the primary basis for any investment decision by you, or an investment advice or recommendation for either ERISA or Internal Revenue Code purposes. Morgan Stanley Private Wealth Management will only prepare a financial plan at your specific request using Private Wealth Management approved financial planning signature.We may act in the capacity of a broker or that of an advisor. As your broker, we are not your fiduciary and our interests may not always be identical to yours. Please consult with your Private Wealth Advisor to discuss our obligations to disclose to you any conflicts we may from time to time have and our duty to act in your best interest. We may be paid both by you and by others who compensate us based on what you buy. Our compensation, including that of your Private Wealth Advisor, may vary by product and over time.Investment and services offered through Morgan Stanley Private Wealth Management, a division of Morgan Stanley Smith Barney LLC, Member SIPC.
DISCLOSURESPage 21 of 23
Investment, insurance and annuity products offered through Morgan Stanley Smith Barney LLC are: NOT FDIC INSURED | MAY LOSE VALUE | NOT BANK GUARANTEED | NOT A BANK DEPOSIT | NOT INSURED BY ANY FEDERAL GOVERNMENT AGENCYFor index, indicator and survey definitions referenced in this report please visit the following: http://www.morganstanleyfa.com/public/projectfiles/id.pdf
Global Investment Committee (GIC) Asset Allocation Models: The Asset Allocation Models are created by Morgan Stanley Wealth Management’s GIC. HYPOTHETICAL MODEL PERFORMANCE (GROSS): Hypothetical model performance results do not reflect the investment or performance of an actual portfolio following a GIC Strategy, but simply reflect actual historical performance of selected indices on a real-time basis over the specified period of time representing the GIC’s strategic and tactical allocations as of the date of this report . The past performance shown here is simulated performance based on benchmark indices, not investment results from an actual portfolio or actual trading. There can be large differences between hypothetical and actual performance results achieved by a particular asset allocation or trading strategy. Hypothetical performance results do not represent actual trading and are generally designed with the benefit of hindsight . Actual performance results of accounts vary due to, for example, market factors (such as liquidity) and client-specific factors (such as investment vehicle selection, timing of contributions and withdrawals, restrictions and rebalancing schedules). Clients would not necessarily have obtained the performance results shown here if they had invested in accordance with any GIC Asset Allocation Model for the periods indicated. Despite the limitations of hypothetical performance, these hypothetical performance results allow clients and Financial Advisors to obtain a sense of the risk /return trade-off of different asset allocation constructs. The hypothetical performance results in this report are calculated using the returns of benchmark indices for the asset classes, and not the returns of securities, fund or other investment products. Models may contain allocations to Hedge Funds, Private Equity and Private Real Estate. The benchmark indices for these asset classes are not issued on a daily basis. When calculating model performance on a day for which no benchmark index data is issued, we have assumed straight line growth between the index levels issued before and after that date . FEES REDUCE THE PERFORMANCE OF ACTUAL ACCOUNTS: None of the fees or other expenses (e.g. commissions, mark-ups, mark-downs, fees) associated with actual trading or accounts are reflected in the GIC Asset Allocation Models. The GIC Asset Allocation Models and any model performance included in this presentation are intended as educational materials . Were a client to use these models in connection with investing, any investment decisions made would be subject to transaction and other costs which, when compounded over a period of years, would decrease returns . Information regarding Morgan Stanley’s standard advisory fees is available in the Form ADV Part 2, which is available at www.morganstanley.com/adv. The following hypothetical illustrates the compound effect fees have on investment returns: For example, if a portfolio’s annual rate of return is 15% for 5 years and the account pays 50 basis points in fees per annum, the gross cumulative five-year return would be 101.1% and the five-year return net of fees would be 96.8%. Fees and/or expenses would apply to clients who invest in investments in an account based on these asset allocations, and would reduce clients’ returns. The impact of fees and/or expenses can be material. insurance products disclosures: Variable annuities are long-term investments designed for retirement purposes and may be subject to market fluctuations, investment risk, and possible loss of principal. All guarantees, including optional benefits, are based on the financial strength and claims-paying ability of the issuing insurance company and do not apply to the underlying investment options. Optional riders may not be able to be purchased in combination and are available at an additional cost. Some optional riders must be elected at time of purchase. Optional riders may be subject to specific limitations, restrictions, holding periods, costs, and expenses as specified by the insurance company in the annuity contract. If you are investing in a variable annuity through a tax-advantaged retirement plan such as an IRA, you will get no additional tax advantage from the variable annuity. Under these circumstances, you should only consider buying a variable annuity because of its other features, such as lifetime income payments and death benefits protection . Taxable distributions (and certain deemed distributions) are subject to ordinary income tax and, if taken prior to age 59½, may be subject to a 10% federal income tax penalty. Early withdrawals will reduce the death benefit and cash surrender value. Equity securities may fluctuate in response to news on companies, industries, market conditions and general economic environment. Ultrashort-term fixed income asset class is comprised of fixed income securities with high quality, very short maturities. They are therefore subject to the risks associated with debt securities such as credit and interest rate risk . Master Limited Partnerships (MLPs) are limited partnerships or limited liability companies that are taxed as partnerships and whose interests (limited partnership units or limited liability company units) are traded on securities exchanges like shares of common stock. Currently, most MLPs operate in the energy, natural resources or real estate sectors. Investments in MLP interests are subject to the risks generally applicable to companies in the energy and natural resources sectors, including commodity pricing risk, supply and demand risk, depletion risk and exploration risk . Individual MLPs are publicly traded partnerships that have unique risks related to their structure. These include, but are not limited to, their reliance on the capital markets to fund growth, adverse ruling on the current tax treatment of distributions (typically mostly tax deferred), and commodity volume risk. The potential tax benefits from investing in MLPs depend on their being treated as partnerships for federal income tax purposes and, if the MLP is deemed to be a corporation, then its income would be subject to federal taxation at the entity level, reducing the amount of cash available for distribution to the fund which could result in a reduction of the fund’s value. MLPs carry interest rate risk and may underperform in a rising interest rate environment. MLP funds accrue deferred income taxes for future tax liabilities associated with the portion of MLP distributions considered to be a tax-deferred return of capital and for any net operating gains as well as capital appreciation of its investments; this deferred tax liability is reflected in the daily NAV, and, as a result, the MLP fund’s after-tax performance could differ significantly from the underlying assets even if the pre-tax performance is closely tracked. Investing in commodities entails significant risks. Commodity prices may be affected by a variety of factors at any time, including but not limited to, (i) changes in supply and demand relationships, (ii) governmental programs and policies, (iii) national and international political and economic events, war and terrorist events, (iv) changes in interest and exchange rates, (v) trading activities in commodities and related contracts, (vi) pestilence, technological change and weather, and (vii) the price volatility of a commodity . In addition, the commodities markets are subject to temporary distortions or other disruptions due to various factors, including lack of liquidity, participation of speculators and government intervention . Physical precious metals are non-regulated products. Precious metals are speculative investments, which may experience short-term and long term price volatility. The value of precious metals investments may fluctuate and may appreciate or decline, depending on market conditions. Unlike bonds and stocks, precious metals do not make interest or dividend payments. Therefore, precious metals may not be suitable for investors who require current
DISCLOSURESPage 22 of 23
income. Precious metals are commodities that should be safely stored, which may impose additional costs on the investor . REITs investing risks are similar to those associated with direct investments in real estate: property value fluctuations, lack of liquidity, limited diversification and sensitivity to economic factors such as interest rate changes and market recessions . Risks of private real estate include: illiquidity; a long-term investment horizon with a limited or nonexistent secondary market; lack of transparency; volatility (risk of loss); and leverage. Principal is returned on a monthly basis over the life of a mortgage-backed security. Principal prepayment can significantly affect the monthly income stream and the maturity of any type of MBS, including standard MBS, CMOs and Lottery Bonds. Asset-backed securities generally decrease in value as a result of interest rate increases, but may benefit less than other fixed-income securities from declining interest rates, principally because of prepayments. Yields are subject to change with economic conditions. Yield is only one factor that should be considered when making an investment decision. Credit ratings are subject to change. The majority of $25 and $1000 par preferred securities are “callable” meaning that the issuer may retire the securities at specific prices and dates prior to maturity. Interest/dividend payments on certain preferred issues may be deferred by the issuer for periods of up to 5 to 10 years, depending on the particular issue. The investor would still have income tax liability even though payments would not have been received. Price quoted is per $25 or $1,000 share, unless otherwise specified. Current yield is calculated by multiplying the coupon by par value divided by the market price. The initial interest rate on a floating-rate security may be lower than that of a fixed-rate security of the same maturity because investors expect to receive additional income due to future increases in the floating security’s underlying reference rate. The reference rate could be an index or an interest rate. However, there can be no assurance that the reference rate will increase. Some floating-rate securities may be subject to call risk. The market value of convertible bonds and the underlying common stock(s) will fluctuate and after purchase may be worth more or less than original cost. If sold prior to maturity, investors may receive more or less than their original purchase price or maturity value, depending on market conditions. Callable bonds may be redeemed by the issuer prior to maturity. Additional call features may exist that could affect yield. Some $25 or $1000 par preferred securities are QDI (Qualified Dividend Income) eligible. Information on QDI eligibility is obtained from third party sources. The dividend income on QDI eligible preferreds qualifies for a reduced tax rate. Many traditional ‘dividend paying’ perpetual preferred securities (traditional preferreds with no maturity date) are QDI eligible. In order to qualify for the preferential tax treatment all qualifying preferred securities must be held by investors for a minimum period – 91 days during a 180 day window period, beginning 90 days before the ex-dividend date. Companies paying dividends can reduce or cut payouts at any time. Nondiversification: For a portfolio that holds a concentrated or limited number of securities, a decline in the value of these investments would cause the portfolio’s overall value to decline to a greater degree than a less concentrated portfolio . The indices selected by Morgan Stanley Wealth Management to measure performance are representative of broad asset classes. Morgan Stanley Wealth Management retains the right to change representative indices at any time. Because of their narrow focus, sector investments tend to be more volatile than investments that diversify across many sectors and companies. Growth investing does not guarantee a profit or eliminate risk. The stocks of these companies can have relatively high valuations. Because of these high valuations, an investment in a growth stock can be more risky than an investment in a company with more modest growth expectations. Value investing does not guarantee a profit or eliminate risk. Not all companies whose stocks are considered to be value stocks are able to turn their business around or successfully employ corrective strategies which would result in stock prices that do not rise as initially expected . Any type of continuous or periodic investment plan does not assure a profit and does not protect against loss in declining markets. Since such a plan involves continuous investment in securities regardless of fluctuating price levels of such securities, the investor should consider his financial ability to continue his purchases through periods of low price levels. Duration, the most commonly used measure of bond risk, quantifies the effect of changes in interest rates on the price of a bond or bond portfolio. The longer the duration, the more sensitive the bond or portfolio would be to changes in interest rates . This material is disseminated in the United States of America by Morgan Stanley Smith Barney LLC. Morgan Stanley Wealth Management is not acting as a municipal advisor to any municipal entity or obligated person within the meaning of Section 15B of the Securities Exchange Act (the “Municipal Advisor Rule”) and the opinions or views contained herein are not intended to be, and do not constitute, advice within the meaning of the Municipal Advisor Rule. This material, or any portion thereof, may not be reprinted, sold or redistributed without the written consent of Morgan Stanley Smith Barney LLC . © 2017 Morgan Stanley Smith Barney LLC. Member SIPC.
DISCLOSURESPage 23 of 23