Embed Size (px)
Citation preview

Client-Based Control Channel Analysis forConnectivity Estimation in LTE Networks
Robert Falkenberg, Christoph Ide and Christian WietfeldCommunication Networks Institute
TU Dortmund University44227 Dortmund, Germany
Email: {Robert.Falkenberg, Christoph.Ide, Christian.Wietfeld}@tu-dortmund.de
Abstract—Advanced Cyber-Physical Systems aim for the bal-ancing of restricted local resources of deeply embedded systemswith cloud-based resources depending on the availability ofnetwork connectivity: in case of excellent connectivity, the off-loading of large amounts of data can be more efficient thanthe local processing on a resource-constraint platform, whilethis latter solution is preferred in case of limited connectivity.This paper proposes a Client-Based Control Channel Analysisfor Connectivity Estimation (C3ACE), a new passive probingmechanism to enable the client-side to estimate the connectionquality of 4G networks in range. The results show that byobserving and analyzing the control traffic in real-time, thenumber of active user equipment in a cell can be determined withsurprising accuracy (with errors well below 10−6). The specificchallenge addressed in this paper lies in a dedicated filteringand validation of the DCI (Downlink Control Information). In asubsequent step the data rates to be expected can be estimatedin order to enable decision about the choice of network andthe timing of the data offloading to the cloud. The proposedmethods have been implemented and validated leveraging theSDR OpenAirInterface, a real-life LTE network and a distributedload generator producing a scalable network traffic by a numberof LTE User Equipment.
I. INTRODUCTION
Forecasting the expected data rate of an LTE connectionmight be useful in many cases. For example, resource con-strained Cyber-Physical Systems could decide whether it isworthwhile to offload certain computations to a cloud serviceor to process them locally, if offloading would require more en-ergy or time. Moreover, this information would enable vehiclesto select the currently fastest link for transmitting telemetrydata or emergency messages, which might not always be themobile network but a locally available WiFi hotspot or a Car-to-Car link. Especially warnings about an upcoming hidden tailof a motorway traffic jam might be delayed by the high loadof the local LTE cells as a consequence of the high density ofdevices in this place.
Current LTE networks do not provide any passive indicatorsto reliably estimate the data rate for an ongoing transmission.Commercial off-the-shelf User Equipment (UE) can onlyobtain a data rate retrospectively after an actual transmission.Existing indicators like Received Signal Strength Indicator(RSSI), Reference Signal Received Power (RSRP) and Ref-erence Signal Received Quality (RSRQ) allow for a ratingof the current radio conditions and therefore an estimation ofthe highest achievable data rate. But this estimation suffers of
large uncertainties as the true data rate highly depends on thecurrent load of the associated evolved NodeB (eNodeB).
As LTE organizes resources in terms of Resource Blocks(RBs) in a resource grid with every RB consisting of mostly7 symbols and 12 subcarriers, one could measure the signalpower on each RB and obtain the utilization. This approachallows the identification of a slightly loaded cell with theexpectation of a high data rate for an ongoing transmissionas there still remain unused resources (see first column inFig. 1). However, in case of a fully loaded cell the numberof assigned resources highly depends on the total number ofactive participants (see second and third column in Fig. 1).With this approach that information stays ambiguous, asillustrated in the first row, because the participants cannotbe distinguished from signal power in downlink and uplinkutilization might be affected by hidden stations that cannot beperceived by the particular UE.
In an LTE network, the assignment of the resources foreach UE, designated as Downlink Control Information (DCI),is carried in the Physical Downlink Control Channel (PDCCH)at the beginning of each subframe every 1 ms. Unfortunately,the PDCCH is designed in a way that a UE can only decode
t
f t0
0 1
t
f t0
1 2
t
f t0
4 5
t
f t0
0 ?
t
f t0
? ?
t
f t0
? ?
C3ACE
SpectrumAnalyzer
No LoadNo User
High LoadSingle User
High LoadMany User
Fig. 1. Simplified illustration of resource occupations when an UE starts atransmission at time t0 for different cell load scenarios. The granted numberof RBs for that UE (crosshatched in blue) depends on the cell load andthe number of concurrently transferring UEs. The number of active UEs isunknown at UE side and cannot be derived from signal power using a spectrumanalyzer. C3ACE uncovers this number at UE side including the particularallocations of each active participant.
c©2017 IEEE. Personal use of this material is permitted. Permission from IEEE must be obtained for all other uses,including reprinting/republishing this material for advertising or promotional purposes, collecting new collected worksfor resale or redistribution to servers or lists, or reuse of any copyrighted component of this work in other works.

its own allocations and common allocations containing publicdata, e.g. system information.
In this paper we present a Client-based Control ChannelAnalysis for Connectivity Estimation (C3ACE), a method todecode and process the entire PDCCH obtaining the numberof active UEs and the individual resource allocations for bothdownlink and uplink. We implemented our approach using anopen source Software Defined Radio (SDR) UE allowing forreal-time passive probing. Furthermore, we show that a joiningUE can reliably estimate its expected data rate based on thedisclosed information.
II. RELATED WORK
For the evaluation of the current performance of mobilecommunication system, often active probing mechanisms areapplied [1]. For doing so, an active network connection anddedicated network load are required in order to evaluatethe performance. In contrast to that, the analysis of passiveindicators does not need this dedicated network connection.However, the analysis of passive indicators like the RSRP andRSRQ provide only a stochastic answer about the correlationbetween indicator and data rate [2]. Further measurement-based analyses (in public LTE networks) of the correlationbetween passive performance indicators (e.g., RSSI) and LTEdata rate are presented in [3]. In order to enhance the forecastquality of the data rate, several approaches that analyzethe spectrum can be found in the literature. A performanceanalysis of 2G mobile networks based on a crowdsourcedexamination of control traffic by a set of modified smartphonesis presented in [4]. In [5] the LTE radio performance isanalyzed to discover an inefficient spectrum utilization. Forthis purpose, the users are localized within a cell. However,the localization requires a rotating antenna to create a Syn-thetic Aperture Radar (SAR). In addition, this approach doesnot support a real-time analysis, since a file is periodicallywritten and the results are analyzed offline. An extension ofthat system can be found in [6]. They provide an adaptiveHypertext Transfer Protocol (HTTP) video streaming overLTE. In order to decrease the risk of stalling video, the basestations’ resource allocation is monitored to get informationabout the available bandwidth. Although this is a real-timeimplementation, it is not possible to capture the number ofactive users because only the RB allocation based on the signalpower within RBs is analyzed. In contrast to that, we willshow is this paper that this value is important for a reliableestimation and we can make it available. The knowledge ofthe cell occupancy and the number of active users can beleveraged for example to improve the resource efficiency ofLTE Machine-Type Communication (MTC) data transmissionsin vehicular environments [7] that consider the approximationof the mobile connectivity in the UE.
III. RESOURCE PARTITIONING IN LTEIn LTE the available radio resources, referred as RBs,
are shared among active participants and are allocated bythe eNodeB. This may happen in different ways, headingfor distinct objectives. The eNodeB might share the radio
resources in a manner that all active UEs achieve equal datarates. Although this approach seems fair, it has one maindisadvantage if few far-distant UEs demand for high datarates. These participants can only reach lower data rates as aconsequence of more robust Modulation and Coding Scheme(MCS). This limits the data rates of nearer UEs in a significantway compared to their highest achievable rate. As a resultthis would lower the User Experience counteracting marketingpromises of high data rates made by the network operators.
Another scheduling strategy is to share the available RBsequally or with respect to a particular priority class over thedemanding UEs. In case of similar priorities this leads to highdata rates for UEs near to the eNodeB and moderate ratesfor edge UEs at low cell loads. This kind of resource fairscheduling is utilized by the eNodeB of our dedicated networkwhich we will describe later in section V.
In a fully loaded cell with N UEs of equal priority andthe aforementioned scheduling the number of RBs allocatedto each UE can be estimated by
NRBUE =1
N·NRBTotal (1)
where NRBTotal is the eNodeB’s total number of available RBsper slot. This results in a data rate
rUE = NRBUE ·r0(MCSUE) (2)
where r0(MCSUE) stands for the achievable rate through asingle RB at given MCS. Based on this an idle UE can estimateits expected data rate as
rexpectedUE =
1
N + 1·NRBTotal ·r0(MCSUE). (3)
While NRBTotal is known by the UE and the MCS can be de-rived from already existing connectivity indicators like RSRPand RSRQ at the UE side, the number of active participants isonly known by the eNodeB. However, we present that N canbe determined by analyzing the eNodeB’s PDCCH, requiringmodifications of the UE’s decoding procedure.
IV. DOWNLINK CONTROL CHANNEL ANALYSIS
The proposed C3ACE approach requires several modifica-tions and additional validation steps within the UE’s controlchannel decoding procedure. To understand the upcomingchallenges we first introduce the structure of the PDCCH andthe containing data. Afterwards we briefly present the utilizedsoftware and hardware platform in which we implementeda passive probe. Finally we focus on the validation of thedecoded data which is the crucial part of C3ACE.
A. Structure of the Channel
The PDCCH bears information about the allocation ofuplink and downlink resources for particular UEs as well as forcommon system information about the cell. It is transmittedevery 1 ms allocating the RBs of the following LTE subframe.Fig. 2 illustrates the structure of the channel which is dividedin a set of Control Channel Elements (CCEs) containingthe actual resource allocations. To obtain a higher degree

of robustness against transmission errors the eNodeB mayaggregate 1, 2, 4, or 8 consecutive CCEs for one chunkof information using a higher code rate. Furthermore, eachchunk contains a Cyclic Redundancy Check (CRC) allowingan integrity check for the received data. This CRC is addition-ally scrambled with the Radio Network Temporary Identifier(RNTI) of the UE to which it is addressed to.
A usual UE obtains its allocation as follows: After attachingto the eNodeB and receiving its specific RNTI over anencrypted channel, the UE continuously decodes single CCEsand compares the resulting checksum to its assigned RNTI.In case of no match, or if the UE expects further information,it repeats this procedure decoding two consecutive CCEs atonce. This is also done for 4 and 8 aggregated CCEs.
Without the knowledge of valid RNTIs a receiver cannotvalidate the integrity of the decoded chunk. Furthermore, everydecoding process at all aggregation levels results in a possiblyrandom sequence of bits as a consequence of noise or amismatching aggregation (cf. red entries in Fig. 2).
In addition, the actual information carried by CCEs canconsist of data structures with different lengths as a result ofdifferent DCI formats [8]. These formats serve specific pur-poses, e.g., compact scheduling or multi-user MIMO schedul-ing. They are normalized by the eNodeB using rate adaptionto fit into whole CCEs thus making them indistinguishableon the channel and demanding the UE for a trial and errordecoding for all possible formats.
B. Implementation Platform
The proposed passive probe is based on OPENAIRIN-TERFACE’s (OAI) [9] application LTE-SOFTMODEM, an opensource SDR implementation of eNodeB and UE. It supportsseveral radio front ends, including the Ettus USRP B210platform, which we chose.
In order to build our probe, we modified the UE to keepsynchronized to a specified eNodeB without making any activeaccess (e.g. attach requests) and to continuously decode the
0
1
2
3
4
5
6
7. . .
N
for 0xFFFF
free
for 0xAAAA
free
free
for 0xAAAB
free
0xFFFF
0x3754
0xAD45
0xBB3E
0xB23E
0x98C4
0x2053
0x8967
0xF084
0x947D
0xAAAA
0xB123
0xAAAB
0x7769
ControlChannelElement(CCE)
Allocatedby eNB
DecodedUser-RNTI atAggregation 1
DecodedUser-RNTI atAggregation 2
CorrectInformation
(Black)
FalseInformation
(Red)
PD
CC
H
Fig. 2. Structure of the Physical Downlink Control Channel (PDCCH),consisting of numerous CCEs. The eNodeB may place control information atdifferent aggregation levels and leave some CCEs unused forcing the receiverto scan the entire PDCCH at all aggregation levels. Without the knowledge ofany valid RNTIs this results in a huge number of invalid information (red).
whole PDCCH. The results of the analysis are logged to a fileand printed on the screen in real time.
C. DCI validation
As each DCI’s checksum is scrambled with the RNTI towhich it is addressed, the probe cannot validate the integrityof the DCI without the knowledge of valid RNTIs (cf. Fig 2).Furthermore, the probe will receive a random bit sequencewhen decoding unused CCEs, mismatching aggregation levels,and incorrect DCI formats as explained in section IV-A.Hence, the blind analysis will result in a high number ofpossible DCI with the majority containing invalid information.
In order to remove these invalid DCI we applied a two-stepfiltering: First we removed impossible DCI, as the eNodeBmay place a DCI only in a specific subset of CCEs dependingon the current subframe index (0 . . . 9) and the RNTI it isaddressed to [8]. This feature is designed to reduce the searchcomplexity for a normal UE by approximately a fifth in a10 MHz cell and a tenth in a 20 MHz cell. In our approachwe use it to disqualify 80% at 10 MHz and 90% at 20 MHzof received DCI without dropping any valid information.
In the second step we removed all DCI with a highlikelihood of containing false information. At this step weevaluated two different approaches of rating the likelihood.The first method was inspired by [5] where each decodedinformation is being convolutionally re-encoded and comparedto the initially received encoded sequence. If the sequencesdiffer by more than few bits, the information is rated asfalse. Our experiments showed a reliable classification witha threshold of two bit errors per CCE under optimal radioconditions, placing the receiver next to our dedicated eNodeB.Under normal conditions, which is the synchronization to apublic eNodeB out of our office, a minimum threshold of abouttwelve bit errors per CCE was required to classify any validDCI1. With this threshold we observed at least one double-allocation collision of a resource block per subframe, whichresults in processing false DCI.
In the second approach we first determine valid RNTIs outof the entire value range of possible candidates. For this weassume true RNTIs appear more frequently in the recent periodof time while false RNTIs appear equally spread over the valuerange. The distinction is made by maintaining a histogram ofthe last n occurred RNTIs and classifying as true those RNTIswhich exceed a threshold value k in the histogram.
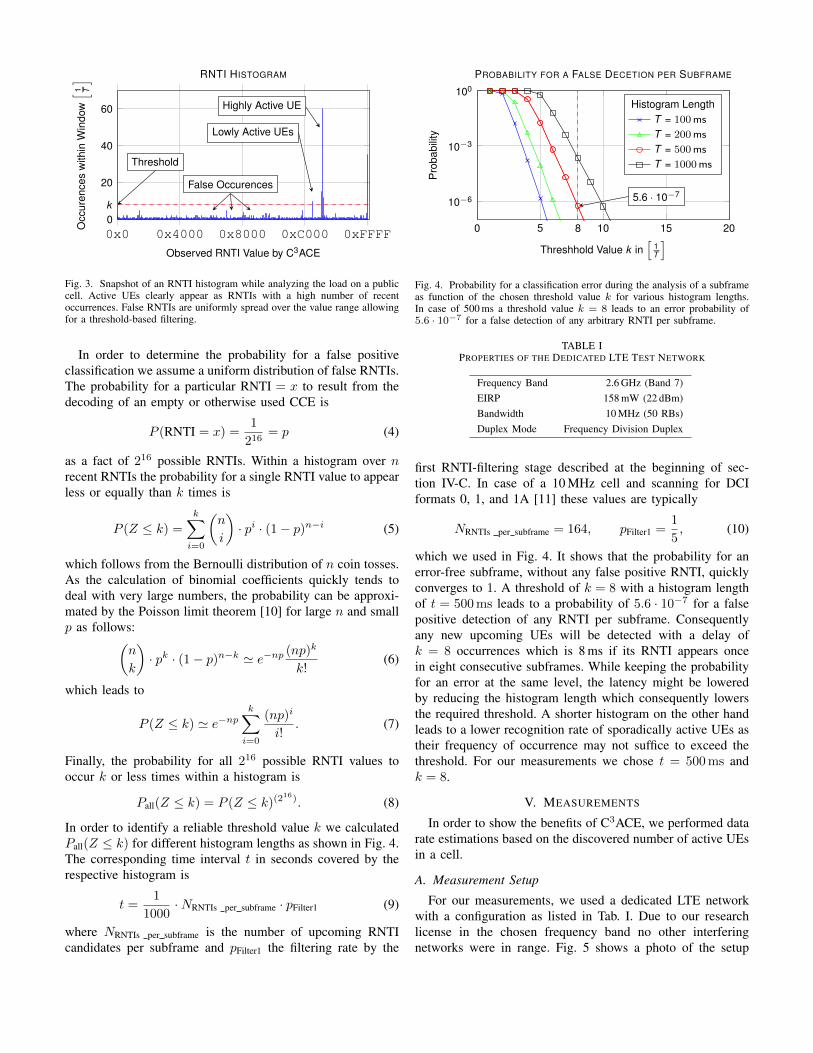
A snapshot of such a histogram is shown in Fig. 3 duringthe load analysis of a public cell. It clearly shows certainRNTIs appear more often as a consequence of the dedicatedtransmissions while arbitrary RNTIs are uniformly distributed,turning up as noise. Moreover, the figure clarifies that thedelay for detecting a true positive and the probability for afalse positive depend on the chosen threshold value k: A toolow threshold will result in a quick true positive detection butalso in a high amount of false positive classifications and viceversa.
1We evaluated this by exclusively decoding periodic system informationhaving a dedicated RNTI of 0xFFFF.
0x0 0x4000 0x8000 0xC000 0xFFFF0
20
40
60
k
Observed RNTI Value by C3ACE
Occ
uren
ces
with
inW
indo
w[ 1 T
] RNTI HISTOGRAM
Highly Active UE
Lowly Active UEs
Threshold
False Occurences
Fig. 3. Snapshot of an RNTI histogram while analyzing the load on a publiccell. Active UEs clearly appear as RNTIs with a high number of recentoccurrences. False RNTIs are uniformly spread over the value range allowingfor a threshold-based filtering.
In order to determine the probability for a false positiveclassification we assume a uniform distribution of false RNTIs.The probability for a particular RNTI = x to result from thedecoding of an empty or otherwise used CCE is
P (RNTI = x) =1
216= p (4)
as a fact of 216 possible RNTIs. Within a histogram over nrecent RNTIs the probability for a single RNTI value to appearless or equally than k times is
P (Z ≤ k) =
k∑
i=0
(n
i
)· pi · (1− p)n−i (5)
which follows from the Bernoulli distribution of n coin tosses.As the calculation of binomial coefficients quickly tends todeal with very large numbers, the probability can be approxi-mated by the Poisson limit theorem [10] for large n and smallp as follows:
(n
k
)· pk · (1− p)n−k ' e−np (np)
k
k!(6)
which leads to
P (Z ≤ k) ' e−npk∑
i=0
(np)i
i!. (7)
Finally, the probability for all 216 possible RNTI values tooccur k or less times within a histogram is
Pall(Z ≤ k) = P (Z ≤ k)(216). (8)
In order to identify a reliable threshold value k we calculatedPall(Z ≤ k) for different histogram lengths as shown in Fig. 4.The corresponding time interval t in seconds covered by therespective histogram is
t =1
1000·NRNTIs per subframe · pFilter1 (9)
where NRNTIs per subframe is the number of upcoming RNTIcandidates per subframe and pFilter1 the filtering rate by the
0 5 10 15 20
10−6
10−3
100
8
5.6 · 10−7
Threshhold Value k in[
1T
]
Pro
babi
lity
PROBABILITY FOR A FALSE DECETION PER SUBFRAME
Histogram LengthT = 100ms
T = 200ms
T = 500ms
T = 1000ms
Fig. 4. Probability for a classification error during the analysis of a subframeas function of the chosen threshold value k for various histogram lengths.In case of 500 ms a threshold value k = 8 leads to an error probability of5.6 · 10−7 for a false detection of any arbitrary RNTI per subframe.
TABLE IPROPERTIES OF THE DEDICATED LTE TEST NETWORK
Frequency Band 2.6 GHz (Band 7)EIRP 158 mW (22 dBm)Bandwidth 10 MHz (50 RBs)Duplex Mode Frequency Division Duplex
first RNTI-filtering stage described at the beginning of sec-tion IV-C. In case of a 10 MHz cell and scanning for DCIformats 0, 1, and 1A [11] these values are typically
NRNTIs per subframe = 164, pFilter1 =1
5, (10)
which we used in Fig. 4. It shows that the probability for anerror-free subframe, without any false positive RNTI, quicklyconverges to 1. A threshold of k = 8 with a histogram lengthof t = 500ms leads to a probability of 5.6 · 10−7 for a falsepositive detection of any RNTI per subframe. Consequentlyany new upcoming UEs will be detected with a delay ofk = 8 occurrences which is 8 ms if its RNTI appears oncein eight consecutive subframes. While keeping the probabilityfor an error at the same level, the latency might be loweredby reducing the histogram length which consequently lowersthe required threshold. A shorter histogram on the other handleads to a lower recognition rate of sporadically active UEs astheir frequency of occurrence may not suffice to exceed thethreshold. For our measurements we chose t = 500ms andk = 8.
V. MEASUREMENTS
In order to show the benefits of C3ACE, we performed datarate estimations based on the discovered number of active UEsin a cell.
A. Measurement Setup
For our measurements, we used a dedicated LTE networkwith a configuration as listed in Tab. I. Due to our researchlicense in the chosen frequency band no other interferingnetworks were in range. Fig. 5 shows a photo of the setup

Fig. 5. Left: Measurement setup of the near scenario using an USRP N210 aseNodeB and six STGs including the DUT. Right: LTE passive probe consistingof an USRP B210 and a compact PC executing the modified OAI-software.
HHH
HHH
H
P
Near
Far Basestation
H STG
H DUT
P Passive Probe
0m 10m
Fig. 6. Overview of the measurement setups for near and far scenario in ouroffice environment. The corresponding radio conditions are listed in Tab. II.
consisting of an eNodeB, several UEs denoted as SmartTraffic Generators (STGs) [12] including a Device Under Test(DUT), and the passive probe which continuously analyses thePDCCH. The STGs, consisting of an embedded computer andan LTE modem, are used to induce selected traffic load intothe cell. As the implementation of the OPENAIRINTERFACE’sUE was not fully completed during this work, we switchedto a dedicated DUT which is synchronized to the passiveprobe. The eNodeB is a commercial SDR implementation byAmarisoft using an USRP N210 as radio head.
For a measurement we instructed up to five STGs totransmit as much data as possible in one direction utilizingIPERF3 [13]. Then the passive probe logged the detectednumber of currently active users to a file emulating an UEevaluating its connectivity for its upcoming transmission. Af-terwards the DUT initiated an additional IPERF3-transmissionlogging the actually achieved data rate. We performed thismeasurement for a varying number of active STGs, and forpoor and good radio conditions by placing the DUT far awayor next to the eNodeB as shown in Fig 6. The correspondingconnectivity indicators of the DUT are listed in Tab. II. Eachsingle measurement was repeated 50 times.
B. Measurement Results
The achieved uplink data rates of the DUT depending onthe detected number of active users by the proposed passiveprobe are shown in Fig. 7 for both, good and poor radio
TABLE IIRADIO CONDITIONS MEASURED BY THE DUT
Indicator Near FarRSRP −86 dBm −129 dBmRSSI −65 dBm −100 dBmRSRQ −3 −15
0 1 2 3 4 50
5
10
Ach
ieve
dU
plin
kR
ate
[Mbit/s ]
NEAR (RSRP = -86dBm)
10Mbit/sN+1
0 1 2 3 4 50
5
10
FAR (RSRP = -129dBm)
7.7Mbit/sN+1
Number of active UEs detected by C3ACE
Fig. 7. Achieved uplink data rate of the DUT depending on the detectednumber of active participants by the passive probe in the moment just beforethe DUT initiated the transmission. The dashed line shows the expected datarate according to Eq. 3.
conditions, titled as near and far. In addition, the estimateddata rate according to a resource fair scheduling (cf. Eq. 3) isplotted as dashed graph. Due to space limitations and greaterclarity, we omitted the results for downlink data rates as theyshowed similar behaviors.
To highlight the estimation error, the difference betweenestimated and achieved data rate is plotted in Fig. 8. It showsthat the error never exceeds 1.7 Mbit/s during our measure-ments at good radio conditions. Evaluating the cumulativedistribution function of the estimation error in Fig. 9 showsthat 90% of estimations based on C3ACE have a lower orequal error than 0.7 Mbit/s at good radio conditions. At greaterdistances the connection suffers of higher packet loss rates and
0 1 2 3 4 5−4
−2
0
2
4
Est
imat
ion
Err
or[M
bit/s]
NEAR (RSRP = -86dBm)
0 1 2 3 4 5−4
−2
0
2
4
FAR (RSRP = -129dBm)
Number of active UEs detected by C3ACE
Fig. 8. Corresponding estimation error from expected data rate (c.f. Fig. 7).It shows that the expected data rate for an UE can be derived from the nowavailable number of active UEs with high accuracy. Poor radio conditionsresult in a higher error variance.

0 0.5 1 1.50
0.2
0.4
0.6
0.8
1
In 90%|Error| ≤0.7 Mbit/s
CD
FNEAR (RSRP = -86dBm)
0 1 2 3 40
0.2
0.4
0.6
0.8
1
In 90%|Error| ≤1.4 Mbit/s
FAR (RSRP = -129dBm)
|Error| in [Mbit/s]
Fig. 9. Cumulative distribution function of the error shown in Fig. 8. Atgood radio conditions 90% of estimations have an error smaller or equal than0.7 Mbit/s.
re-transmissions as a result of the poorer radio link and lead toa larger error deviation. As each participant uses a Transmis-sion Control Protocol (TCP) stream for its transmission, theparticular TCP congestion control significantly reduces its datarate in case of packet losses. This spares other UEs additionalresources and results in an oscillating data rate. With a largernumber of concurring streams, this effect decreases. Still, evenin those cases, the estimation stays accurate in average (cf.median in the right chart of Fig. 8) by having an error of lessor equal than 1.4 Mbit/s in 90% of estimations.
VI. CONCLUSION
In this paper we proposed a Client-based Control ChannelAnalysis for Connectivity Estimation (C3ACE) technique thatenables an UE for a passive determination of the numberof active participants within an LTE cell, although an LTEnetwork is not designated to provide this information toan UE. Based on this significant information, and with theknowledge of the eNodeB’s scheduling algorithm, the UE canestimate at any moment its expected data rate for an upcomingdown- and uplink transmission without the need of activeprobing. We implemented C3ACE into an open source SDRUE turning it into a passive probe which is capable of decodingthe entire Physical Downlink Control Channel (PDCCH) inreal-time. This uncovers the total resource allocations brokendown by individual participants. The crux of the matter isa reliable validation of blind decoded control informationwithout the knowledge of any assigned UE-identifier (RNTI)which prevents a checksum verification. We solved this bya histogram-based validation technique, which allows for anadjustable reliability. This approach has a low computationalcomplexity and therefore allows for an efficient integrationinto future commercial UE.
Afterwards, we performed measurements to evaluate thequality of data rate estimation based on the detected numberof active UEs within the cell. The promising results depict anestimation error of less or equal than 0.7 Mbit/s in 90% ofcases at good radio conditions within a 10 MHz cell.
Furthermore, the results bring forward the argument thatfuture mobile networks should implement an indicator for
the maximum number of currently assignable resources toan UE especially for energy and resource constrained Cyber-Physical Systems. From this, together with the individualradio conditions and the capabilities of the UE (i.e. multipleantennas), the mobile system could accurately evaluate itsexpected data rate and decide whether to offload data to thecloud or to perform the necessary computations locally.
In future works we will extend our data rate estimation tobe independent of the eNodeB’s scheduler in consideration ofthe individual resource demands by active UEs.
ACKNOWLEDGMENT
Part of the work on this paper has been supported byDeutsche Forschungsgemeinschaft (DFG) within the Collab-orative Research Center SFB 876 “Providing Information byResource-Constrained Analysis”, project A4.
REFERENCES
[1] J. Huang, F. Qian, Y. Guo, Y. Zhou, Q. Xu, Z. M. Mao, S. Sen, andO. Spatscheck, “An in-depth study of lte: Effect of network protocoland application behavior on performance,” in Proceedings of the ACMSIGCOMM 2013 Conference on SIGCOMM, ser. SIGCOMM ’13. NewYork, NY, USA: ACM, 2013, pp. 363–374.
[2] C. Ide, R. Falkenberg, D. Kaulbars, and C. Wietfeld, “Empirical analysisof the impact of lte downlink channel indicators on the uplink connectiv-ity,” in IEEE Vehicular Technology Conference (VTC-Spring). Nanjing,China: IEEE, may 2016, accepted for presentation.
[3] C.-P. Wu and K. R. Baker, “Comparison of LTE Performance Indicatorsand Throughput in Indoor and Outdoor Scenarios at 700 MHz,” in Proc.of IEEE Vehicular Technology Conference, Quebec City, Canada, Sep.2012.
[4] A. Achtzehn, J. Riihihjarvi, I. A. Barriıa Castillo, M. Petrova, andP. Mahonen, “Crowdrem: Harnessing the power of the mobile crowdfor flexible wireless network monitoring,” in Proceedings of the 16thInternational Workshop on Mobile Computing Systems and Applications,ser. HotMobile ’15. New York, NY, USA: ACM, 2015, pp. 63–68.
[5] S. Kumar, E. Hamed, D. Katabi, and L. Erran Li, “Lte radio analyticsmade easy and accessible,” in Proceedings of the 2014 ACM Conferenceon SIGCOMM, ser. SIGCOMM ’14. New York, NY, USA: ACM, 2014,pp. 211–222.
[6] X. Xie, X. Zhang, S. Kumar, and L. E. Li, “pistream: Physical layerinformed adaptive video streaming over lte,” in Proceedings of the 21stAnnual International Conference on Mobile Computing and Networking,ser. MobiCom ’15. New York, NY, USA: ACM, 2015, pp. 413–425.
[7] C. Ide, B. Dusza, and C. Wietfeld, “Client-based Control of the Inter-dependence between LTE MTC and Human Data Traffic in VehicularEnvironments,” IEEE Transactions on Vehicular Technology, vol. 64,no. 5, pp. 1856–1871, May 2015.
[8] 3GPP TS 36.213 - Physical layer procedures (Release13), 3rd Generation Partnership Project Technical Spec-ification, Rev. V13.0.1, Jan. 2016. [Online]. Available:http://www.3gpp.org/ftp/specs/archive/36 series/36.213/
[9] OpenAirInterface Software Alliance, “Open Air Interface,” 2016.[Online]. Available: http://www.openairinterface.org/
[10] A. Papoulis, Probability, Random Variables, and Stochastic Processes,4th ed., ser. McGraw-Hill series in electrical engineering. New York:McGraw-Hill, 2002.
[11] 3GPP TS 36.212 - Multiplexing and channel coding(Release 13), 3rd Generation Partnership Project TechnicalSpecification, Rev. V13.0.0, Dec. 2015. [Online]. Available:http://www.3gpp.org/ftp/specs/archive/36 series/36.212/
[12] D. Kaulbars, F. Schweikowski, and C. Wietfeld, “Spatially distributedtraffic generation for stress testing the robustness of mission-criticalsmart grid communication,” in IEEE GLOBECOM 2015 Workshop onSmartGrid Resilience, San Diego, USA, Dec. 2015.
[13] J. Dugan, S. Elliott, B. A. Mah, J. Poskanzer, and K. Prabhu, “iPerf3,”2015. [Online]. Available: https://iperf.fr