Embed Size (px)
Citation preview

Deutsche Bank
Client & Creditor Overview
November 2021
Deutsche BankInvestor Relations
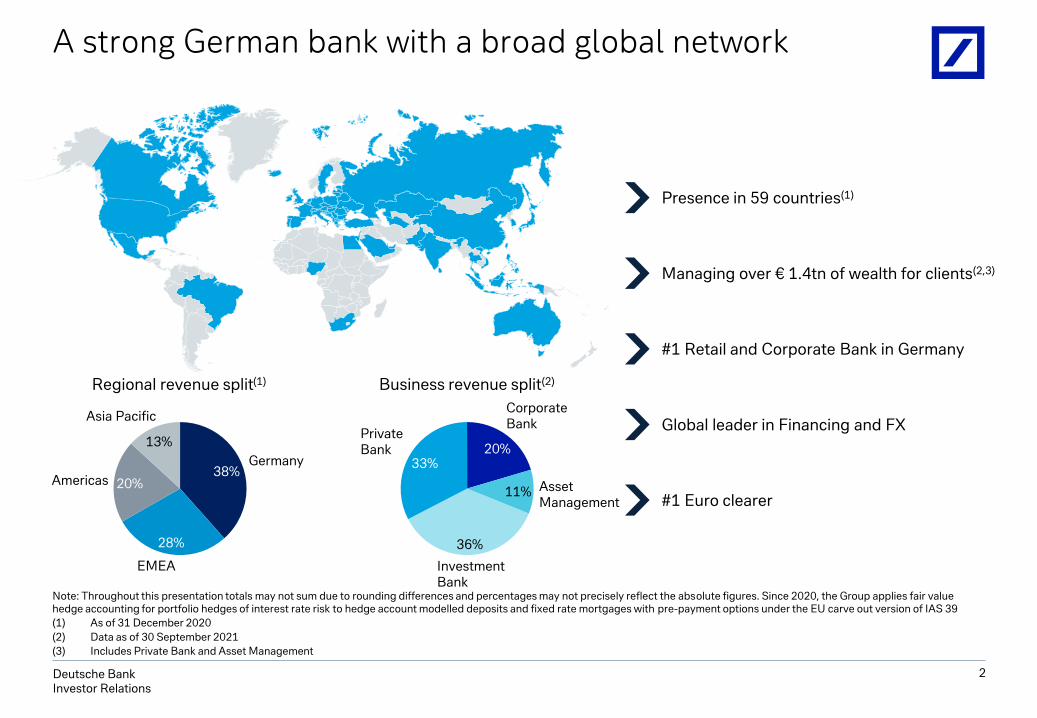
38%
28%
20%
13%
Germany
EMEA
Asia Pacific
Americas
36%
33%20%
11%
InvestmentBank
PrivateBank
CorporateBank
AssetManagement
Regional revenue split(1) Business revenue split(2)
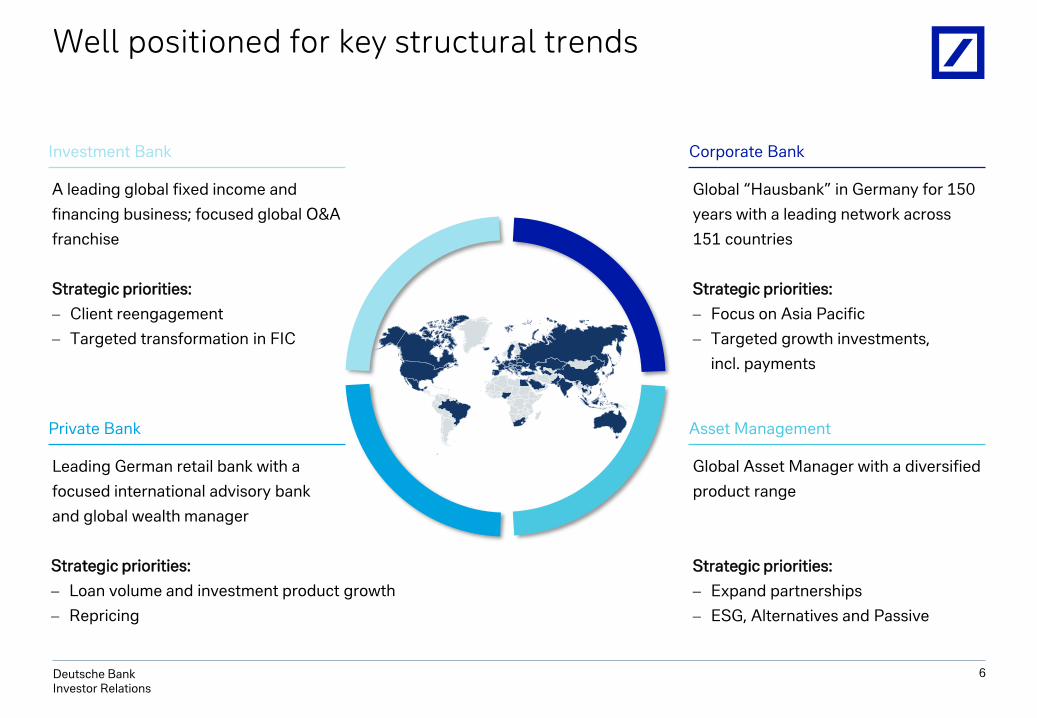
A strong German bank with a broad global network
2
Note: Throughout this presentation totals may not sum due to rounding differences and percentages may not precisely reflect the absolute figures. Since 2020, the Group applies fair value hedge accounting for portfolio hedges of interest rate risk to hedge account modelled deposits and fixed rate mortgages with pre-payment options under the EU carve out version of IAS 39
(1) As of 31 December 2020
(2) Data as of 30 September 2021
(3) Includes Private Bank and Asset Management
Presence in 59 countries(1)
Managing over € 1.4tn of wealth for clients(2,3)
#1 Retail and Corporate Bank in Germany
Global leader in Financing and FX
#1 Euro clearer
Deutsche BankInvestor Relations
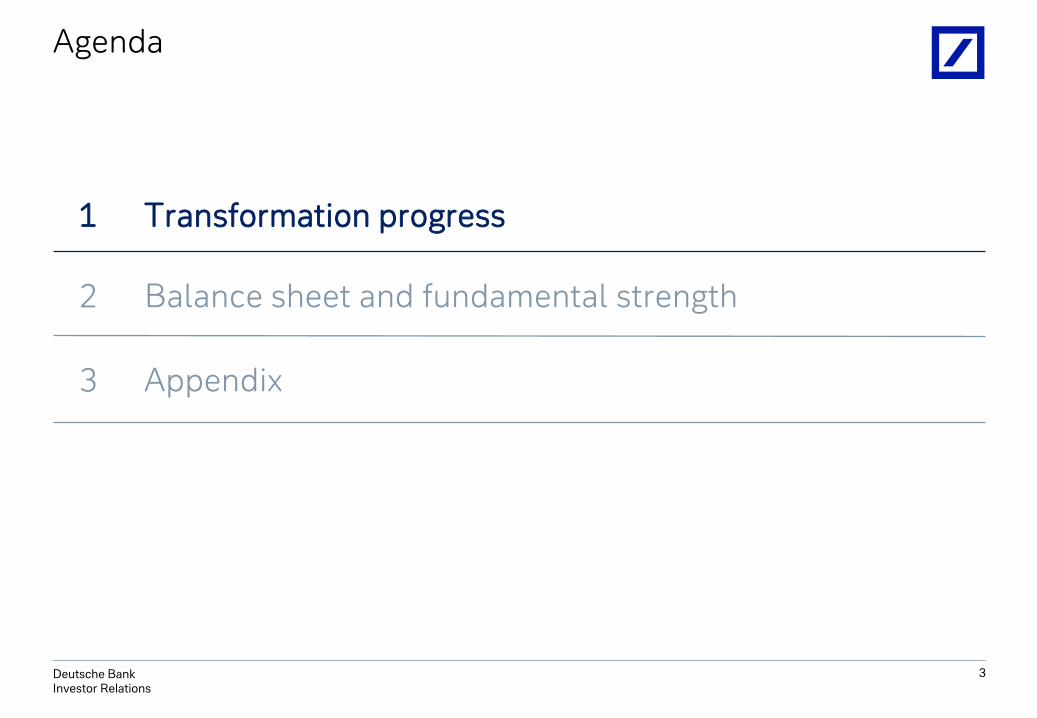
1 Transformation progress
Balance sheet and fundamental strength2
Appendix3
Agenda
3
Deutsche BankInvestor Relations
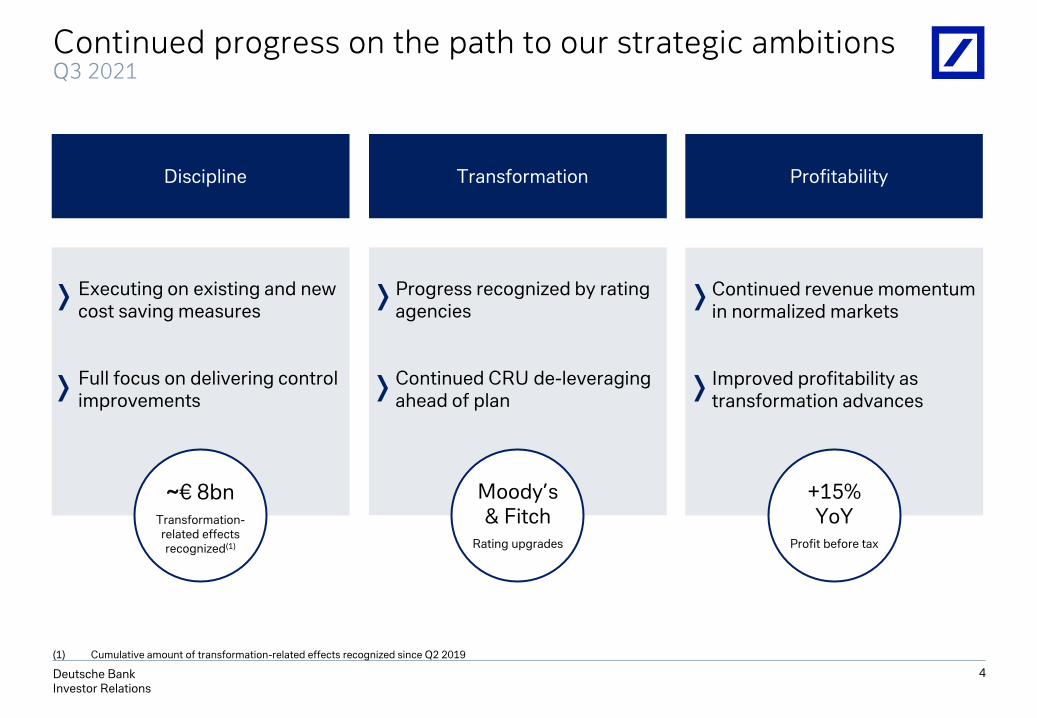
Progress recognized by rating agencies
Continued CRU de-leveraging ahead of plan
Continued progress on the path to our strategic ambitionsQ3 2021
4
Profitability
Continued revenue momentum in normalized markets
Improved profitability as transformation advances
Executing on existing and new cost saving measures
Full focus on delivering control improvements
Discipline
+15% YoY
Profit before tax
Transformation
~€ 8bnTransformation-related effects recognized(1)
Moody’s & Fitch
Rating upgrades
(1) Cumulative amount of transformation-related effects recognized since Q2 2019
Deutsche BankInvestor Relations
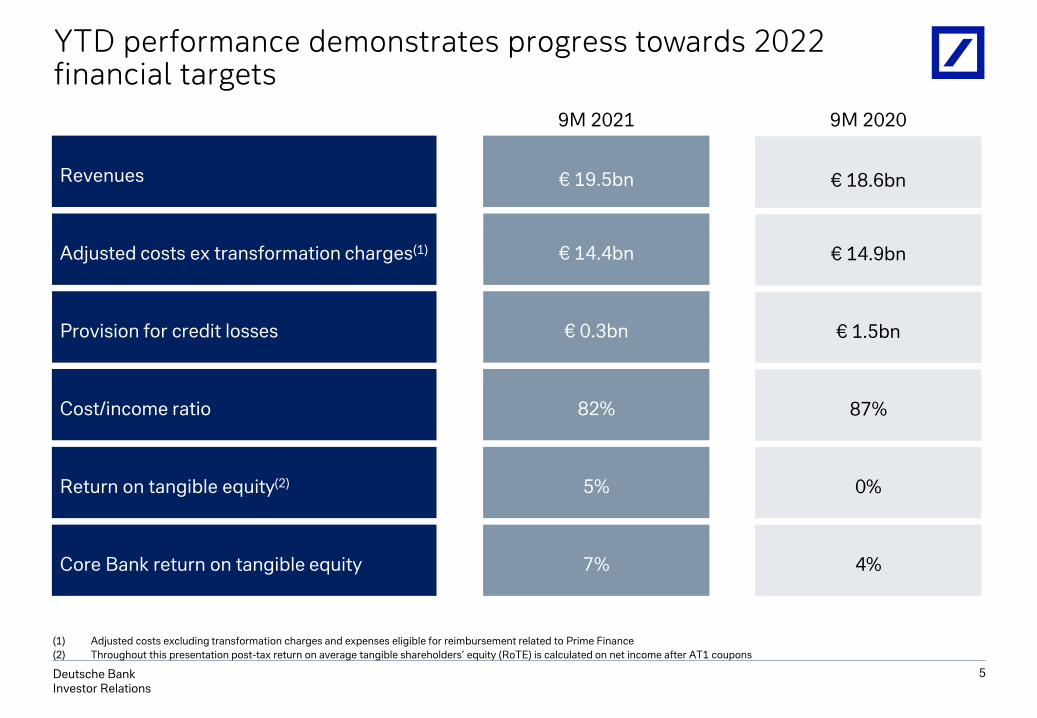
Revenues
YTD performance demonstrates progress towards 2022 financial targets
Return on tangible equity(2)
Provision for credit losses
5
Adjusted costs ex transformation charges(1)
Cost/income ratio
(1) Adjusted costs excluding transformation charges and expenses eligible for reimbursement related to Prime Finance
(2) Throughout this presentation post-tax return on average tangible shareholders’ equity (RoTE) is calculated on net income after AT1 coupons
Core Bank return on tangible equity
9M 2021
€ 19.5bn
€ 0.3bn
€ 14.4bn
82%
5%
9M 2020
€ 18.6bn
€ 1.5bn
€ 14.9bn
87%
0%
7% 4%
Deutsche BankInvestor Relations
Well positioned for key structural trends
6
Asset Management
Global Asset Manager with a diversified
product range
Strategic priorities:
− Expand partnerships
− ESG, Alternatives and Passive
Private Bank
Leading German retail bank with a
focused international advisory bank
and global wealth manager
Investment Bank
A leading global fixed income and
financing business; focused global O&A
franchise
Strategic priorities:
− Client reengagement
− Targeted transformation in FIC
Corporate Bank
Global “Hausbank” in Germany for 150
years with a leading network across
151 countries
Strategic priorities:
− Focus on Asia Pacific
− Targeted growth investments,
incl. payments
Strategic priorities:
− Loan volume and investment product growth
− Repricing
Deutsche BankInvestor Relations
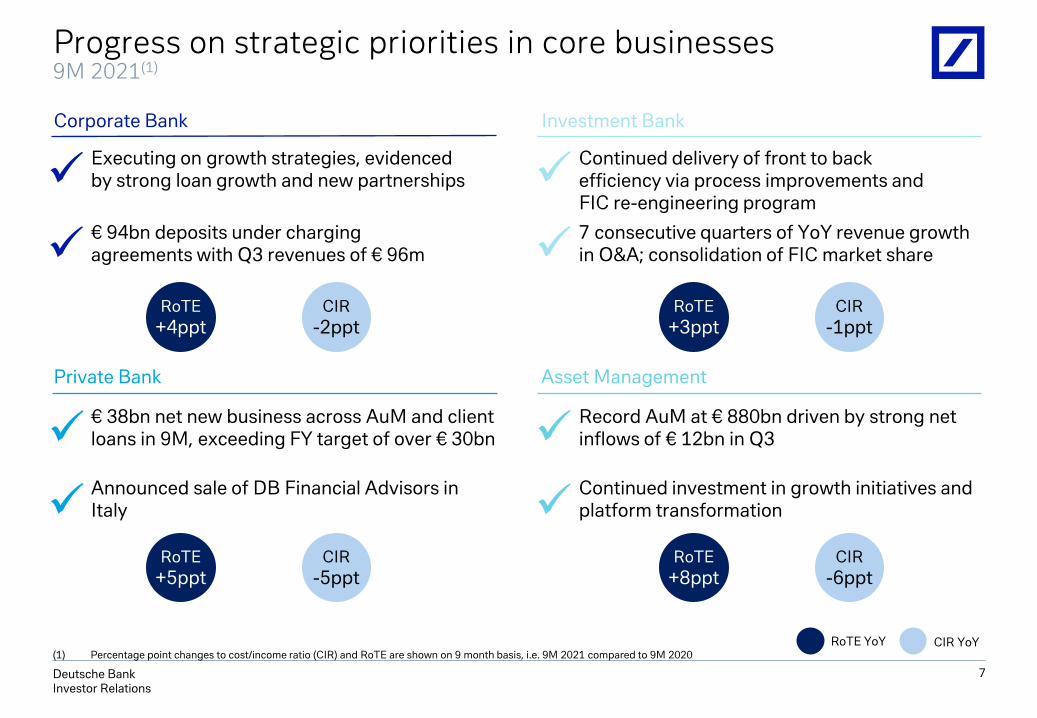
Progress on strategic priorities in core businesses9M 2021(1)
Private Bank Asset Management
Investment BankCorporate Bank
7
€ 94bn deposits under charging agreements with Q3 revenues of € 96m
✓
✓
✓
✓
✓
✓
✓
✓Announced sale of DB Financial Advisors in Italy
€ 38bn net new business across AuM and client loans in 9M, exceeding FY target of over € 30bn
RoTE
+4ppt
RoTE
+5pptRoTE
+8ppt
RoTE
+3ppt
RoTE YoY
CIR
-2pptCIR
-1ppt
CIR
-5pptCIR
-6ppt
(1) Percentage point changes to cost/income ratio (CIR) and RoTE are shown on 9 month basis, i.e. 9M 2021 compared to 9M 2020CIR YoY
7 consecutive quarters of YoY revenue growth in O&A; consolidation of FIC market share
Executing on growth strategies, evidenced by strong loan growth and new partnerships
Continued delivery of front to back efficiency via process improvements and FIC re-engineering program
Record AuM at € 880bn driven by strong net inflows of € 12bn in Q3
Continued investment in growth initiatives and platform transformation
Deutsche BankInvestor Relations
8
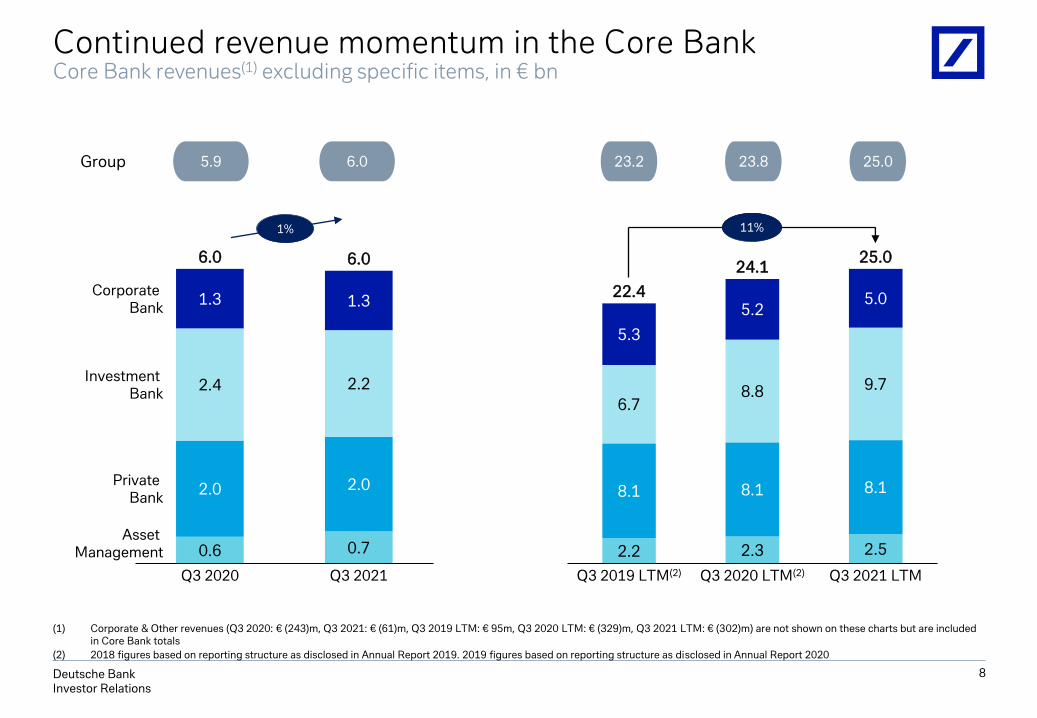
Continued revenue momentum in the Core BankCore Bank revenues(1) excluding specific items, in € bn
1.3
2.4
2.0
1.3
0.6
Q3 2020
2.2
2.0
0.7
Q3 2021
Corporate Bank
Investment Bank
Private Bank
Asset Management
6.0 6.0
5.9 6.0Group
5.2
8.1
5.3
6.7
2.2
Q3 2019 LTM(2)
22.4
8.8
8.1 8.1
2.3
Q3 2020 LTM(2)
5.0
9.7
2.5
Q3 2021 LTM
24.125.0
+13%
23.2 23.8 25.0
1%
(1) Corporate & Other revenues (Q3 2020: € (243)m, Q3 2021: € (61)m, Q3 2019 LTM: € 95m, Q3 2020 LTM: € (329)m, Q3 2021 LTM: € (302)m) are not shown on these charts but are included in Core Bank totals
(2) 2018 figures based on reporting structure as disclosed in Annual Report 2019. 2019 figures based on reporting structure as disclosed in Annual Report 2020
11%
Deutsche BankInvestor Relations
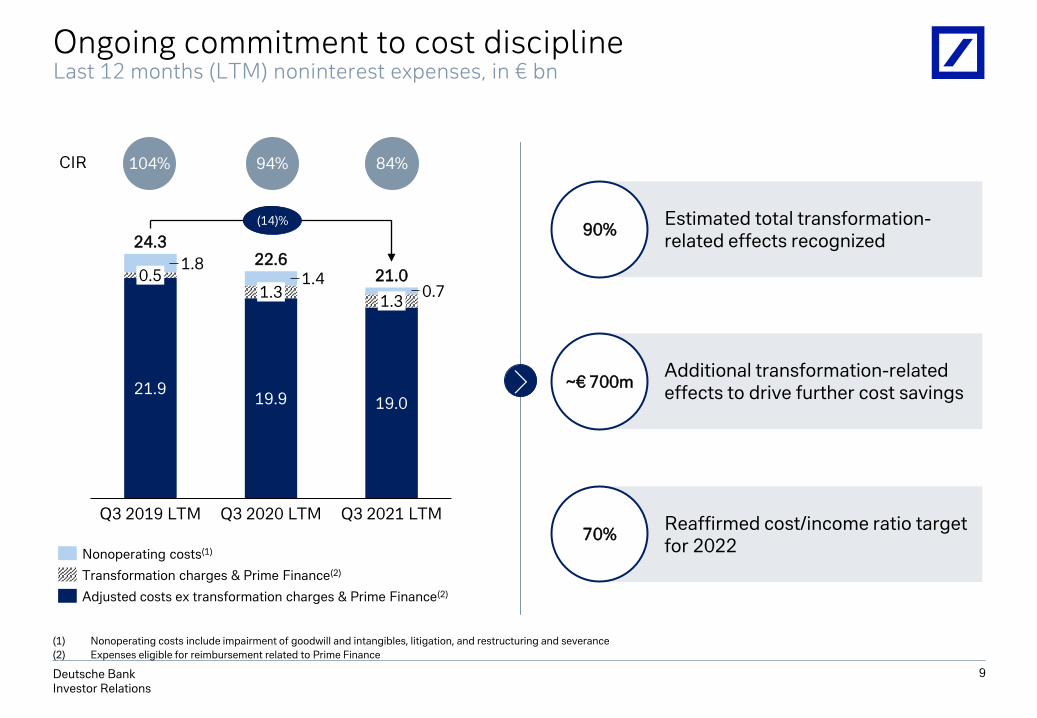
Reaffirmed cost/income ratio target for 2022
Additional transformation-related effects to drive further cost savings
Estimated total transformation-related effects recognized
Ongoing commitment to cost disciplineLast 12 months (LTM) noninterest expenses, in € bn
104% 84%94%
90%
~€ 700m
70%
CIR
0.71.3
1.8 22.61.4
Q3 2019 LTM
0.5
21.919.9
Q3 2020 LTM
1.3
19.0
Q3 2021 LTM
24.3
21.0
-14%
Nonoperating costs(1)
Transformation charges & Prime Finance(2)
Adjusted costs ex transformation charges & Prime Finance(2)
9
(1) Nonoperating costs include impairment of goodwill and intangibles, litigation, and restructuring and severance
(2) Expenses eligible for reimbursement related to Prime Finance
(14)%
Deutsche BankInvestor Relations
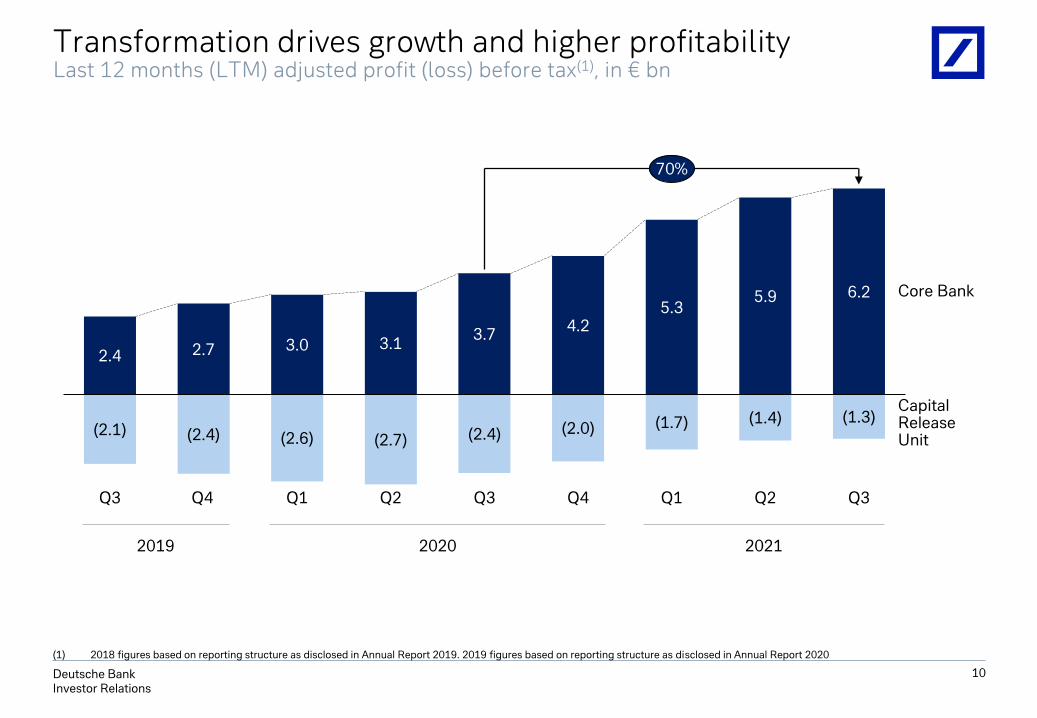
Transformation drives growth and higher profitabilityLast 12 months (LTM) adjusted profit (loss) before tax(1), in € bn
(1) 2018 figures based on reporting structure as disclosed in Annual Report 2019. 2019 figures based on reporting structure as disclosed in Annual Report 2020
10
Q1
Core Bank
(2.7)
3.1
Q2
(2.4)
Q3
(2.0)
4.2
2.4
(1.7)
5.3
Q1
3.7
5.9
Q2
(1.3)
Q3
CapitalRelease Unit(2.6)
(1.4)(2.1)
Q4
(2.4)
Q4Q3
6.2
2.7 3.0
70%
2019 2020 2021
Deutsche BankInvestor Relations
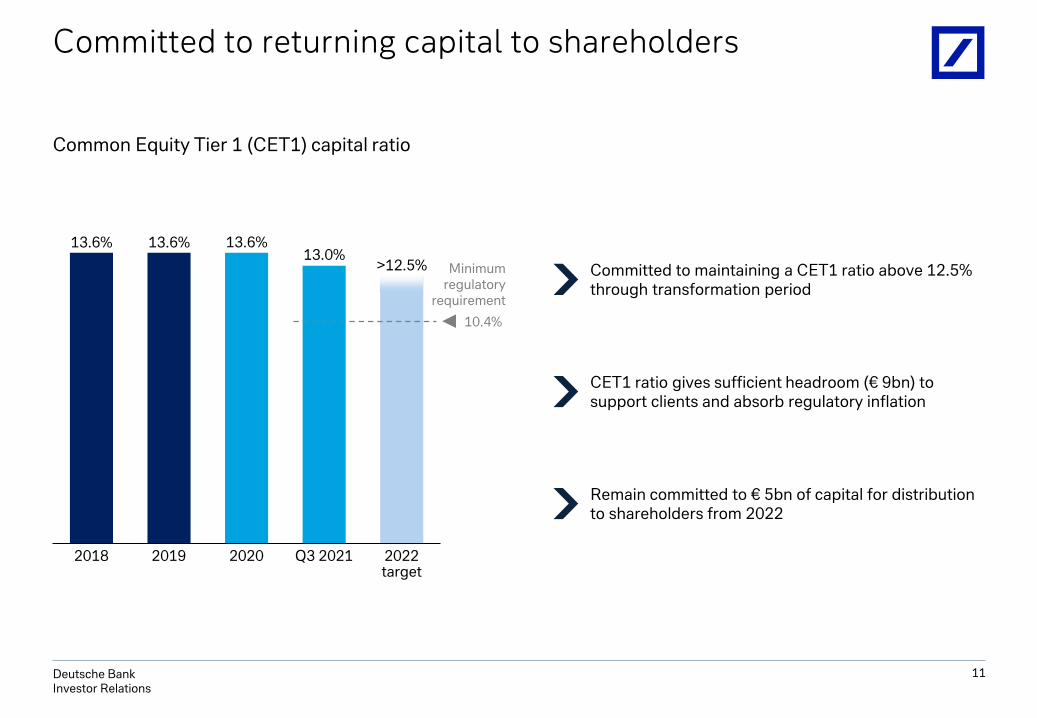
Committed to returning capital to shareholders
13.6% 13.6% 13.6%13.0%
>12.5%
2018 20202019 2022target
Q3 2021
Minimum regulatory
requirement
10.4%
11
Common Equity Tier 1 (CET1) capital ratio
Committed to maintaining a CET1 ratio above 12.5% through transformation period
CET1 ratio gives sufficient headroom (€ 9bn) to support clients and absorb regulatory inflation
Remain committed to € 5bn of capital for distribution to shareholders from 2022
Deutsche BankInvestor Relations
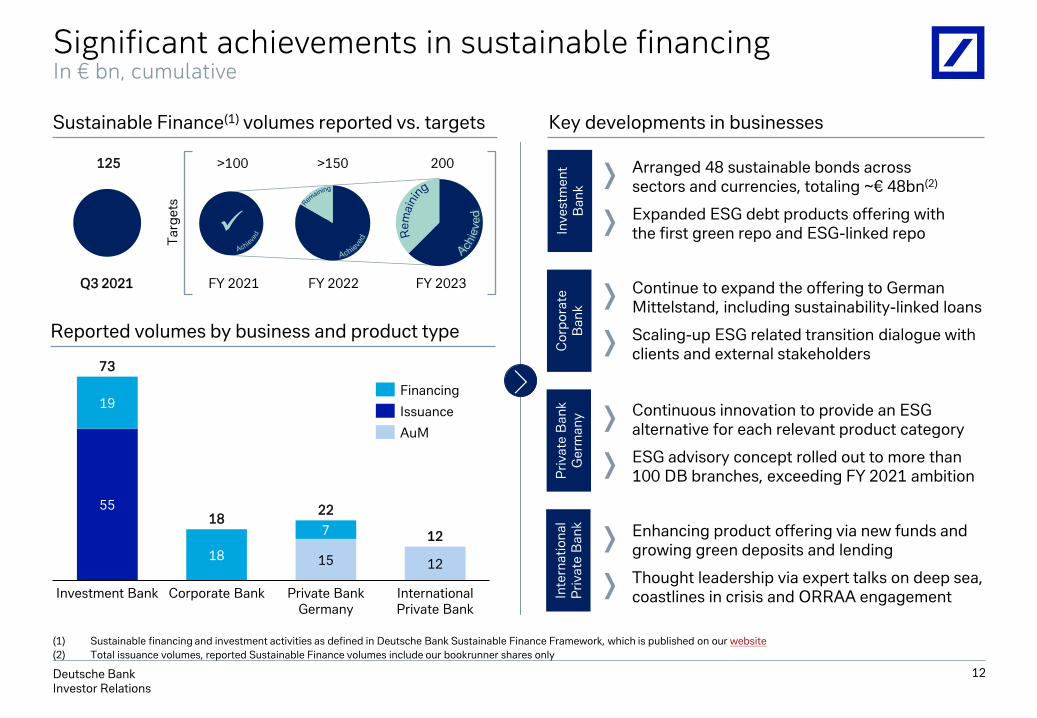
Significant achievements in sustainable financingIn € bn, cumulative
12
Sustainable Finance(1) volumes reported vs. targets Key developments in businesses
55
18 15 12
19
7
Private Bank Germany
Investment Bank International Private Bank
Corporate Bank
12
22
73
18
Financing
Issuance
AuM
(1) Sustainable financing and investment activities as defined in Deutsche Bank Sustainable Finance Framework, which is published on our website
(2) Total issuance volumes, reported Sustainable Finance volumes include our bookrunner shares only
Inv
est
me
nt
B
an
k
Pri
va
te B
an
k
Ge
rma
ny
Inte
rna
tio
na
l P
riv
ate
Ba
nk
Co
rpo
rate
Ba
nk
Continue to expand the offering to German Mittelstand, including sustainability-linked loans
Scaling-up ESG related transition dialogue with clients and external stakeholders
Continuous innovation to provide an ESG alternative for each relevant product category
ESG advisory concept rolled out to more than 100 DB branches, exceeding FY 2021 ambition
Enhancing product offering via new funds and growing green deposits and lending
✓ >150 >200
FY 2023
>100 >150
Reported volumes by business and product type
125
Q3 2021 FY 2021 FY 2022
200T
arg
ets
Expanded ESG debt products offering with the first green repo and ESG-linked repo
Thought leadership via expert talks on deep sea, coastlines in crisis and ORRAA engagement
Arranged 48 sustainable bonds across sectors and currencies, totaling ~€ 48bn(2)
Deutsche BankInvestor Relations
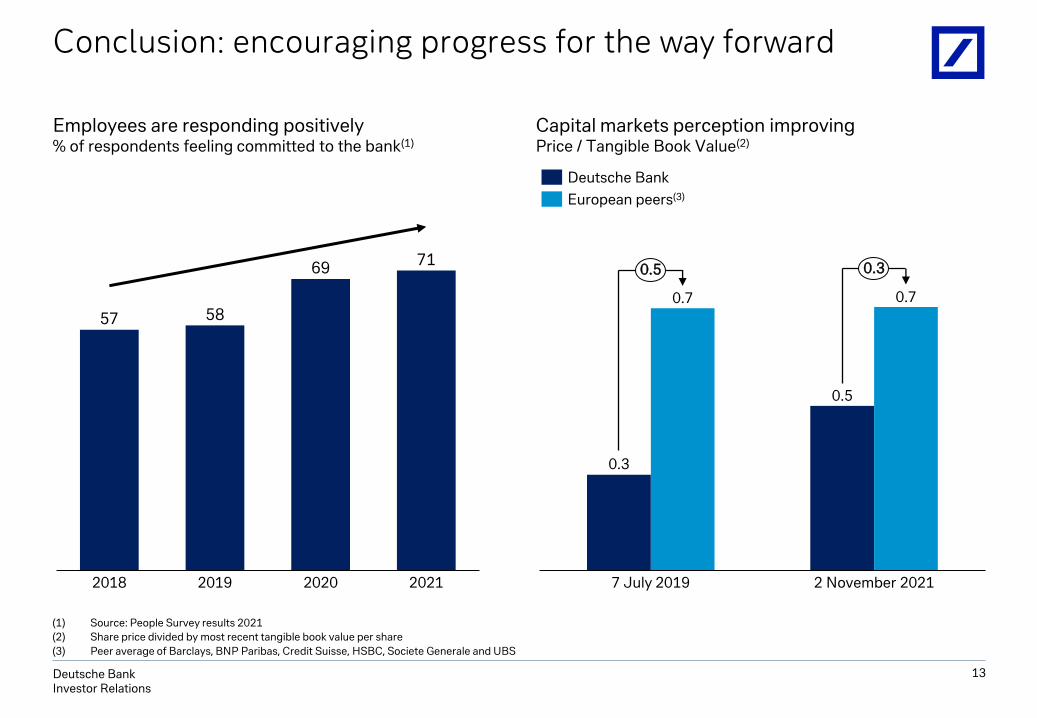
57 58
6971
2019 202120202018
0.3
0.5
0.7 0.7
7 July 2019 2 November 2021
0.5 0.3
Deutsche Bank
European peers(3)
13
Conclusion: encouraging progress for the way forward
Capital markets perception improvingPrice / Tangible Book Value(2)
Employees are responding positively% of respondents feeling committed to the bank(1)
(1) Source: People Survey results 2021
(2) Share price divided by most recent tangible book value per share
(3) Peer average of Barclays, BNP Paribas, Credit Suisse, HSBC, Societe Generale and UBS
Deutsche BankInvestor Relations
1 Transformation progress
Balance sheet and fundamental strength2
Appendix3
Agenda
14
Deutsche BankInvestor Relations
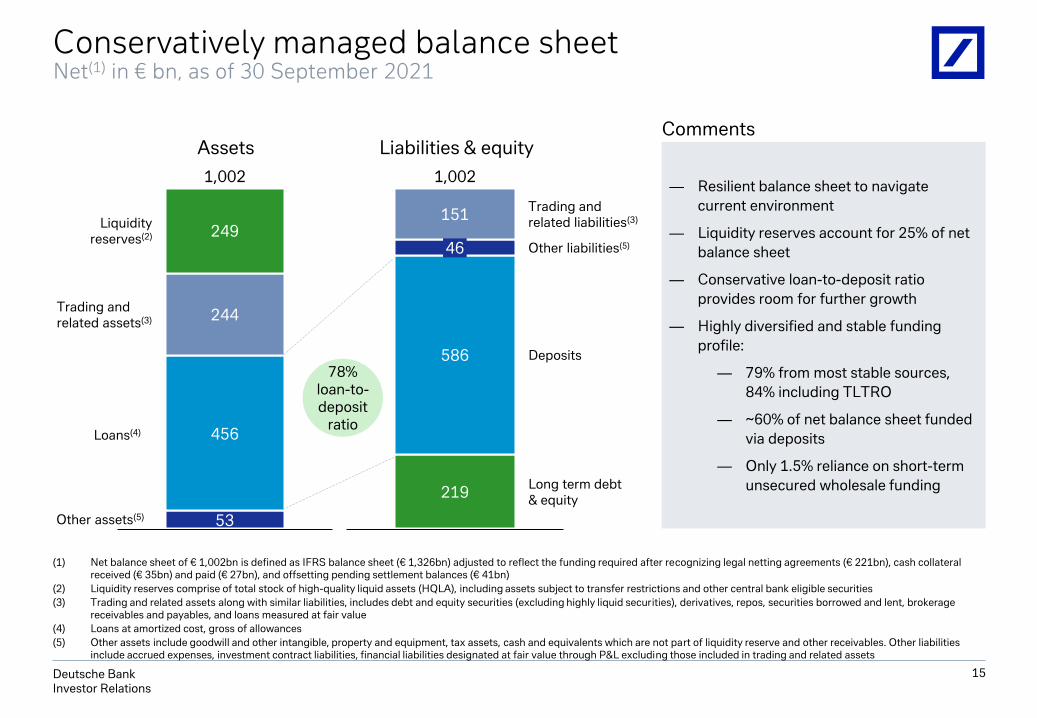
Conservatively managed balance sheetNet(1) in € bn, as of 30 September 2021
431
46
151
586
Other liabilities(5)
219
Trading andrelated liabilities(3)
Long term debt & equity
Deposits
1,002
431
Trading andrelated assets(3)
1,002
249Liquidity
reserves(2)
244
456
53
Assets Liabilities & equity
78% loan-to-deposit
ratioLoans(4)
Other assets(5)
— Resilient balance sheet to navigate
current environment
— Liquidity reserves account for 25% of net
balance sheet
— Conservative loan-to-deposit ratio
provides room for further growth
— Highly diversified and stable funding
profile:
— 79% from most stable sources,
84% including TLTRO
— ~60% of net balance sheet funded
via deposits
— Only 1.5% reliance on short-term
unsecured wholesale funding
15
Comments
(1) Net balance sheet of € 1,002bn is defined as IFRS balance sheet (€ 1,326bn) adjusted to reflect the funding required after recognizing legal netting agreements (€ 221bn), cash collateral received (€ 35bn) and paid (€ 27bn), and offsetting pending settlement balances (€ 41bn)
(2) Liquidity reserves comprise of total stock of high-quality liquid assets (HQLA), including assets subject to transfer restrictions and other central bank eligible securities
(3) Trading and related assets along with similar liabilities, includes debt and equity securities (excluding highly liquid securities), derivatives, repos, securities borrowed and lent, brokerage receivables and payables, and loans measured at fair value
(4) Loans at amortized cost, gross of allowances
(5) Other assets include goodwill and other intangible, property and equipment, tax assets, cash and equivalents which are not part of liquidity reserve and other receivables. Other liabilities include accrued expenses, investment contract liabilities, financial liabilities designated at fair value through P&L excluding those included in trading and related assets
Deutsche BankInvestor Relations
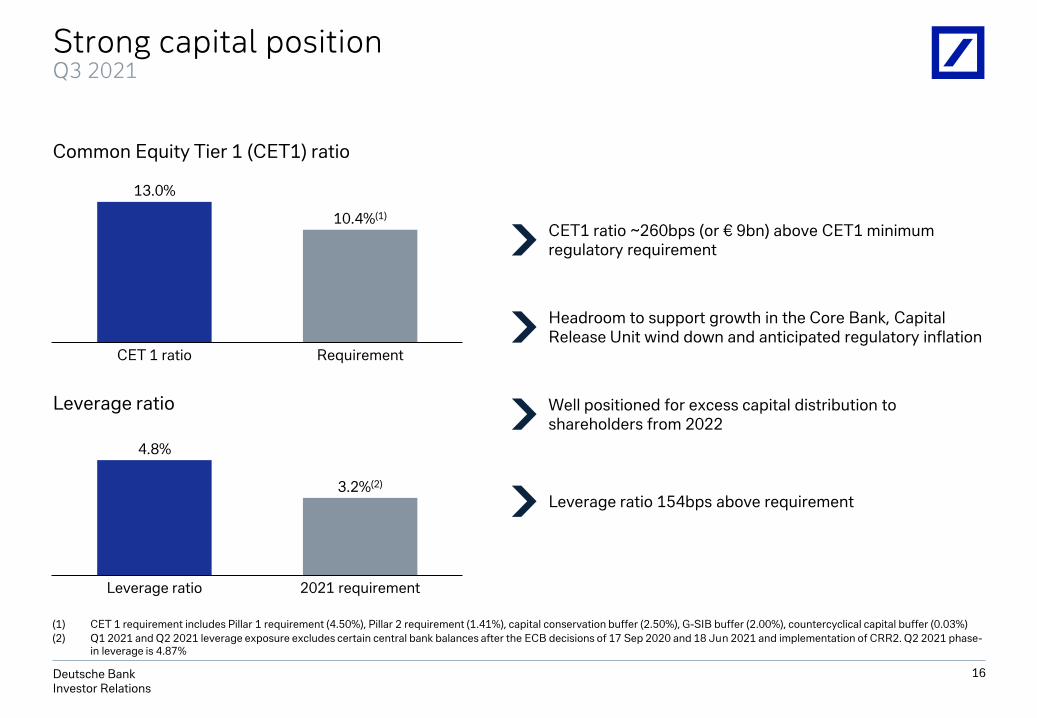
CET 1 ratio Requirement
13.0%
10.4%(1)
Strong capital position Q3 2021
16
Leverage ratio
Common Equity Tier 1 (CET1) ratio
(1) CET 1 requirement includes Pillar 1 requirement (4.50%), Pillar 2 requirement (1.41%), capital conservation buffer (2.50%), G-SIB buffer (2.00%), countercyclical capital buffer (0.03%)
(2) Q1 2021 and Q2 2021 leverage exposure excludes certain central bank balances after the ECB decisions of 17 Sep 2020 and 18 Jun 2021 and implementation of CRR2. Q2 2021 phase-in leverage is 4.87%
4.8%
3.2%(2)
Leverage ratio 2021 requirement
CET1 ratio ~260bps (or € 9bn) above CET1 minimum regulatory requirement
Headroom to support growth in the Core Bank, Capital Release Unit wind down and anticipated regulatory inflation
Well positioned for excess capital distribution to shareholders from 2022
Leverage ratio 154bps above requirement
Deutsche BankInvestor Relations
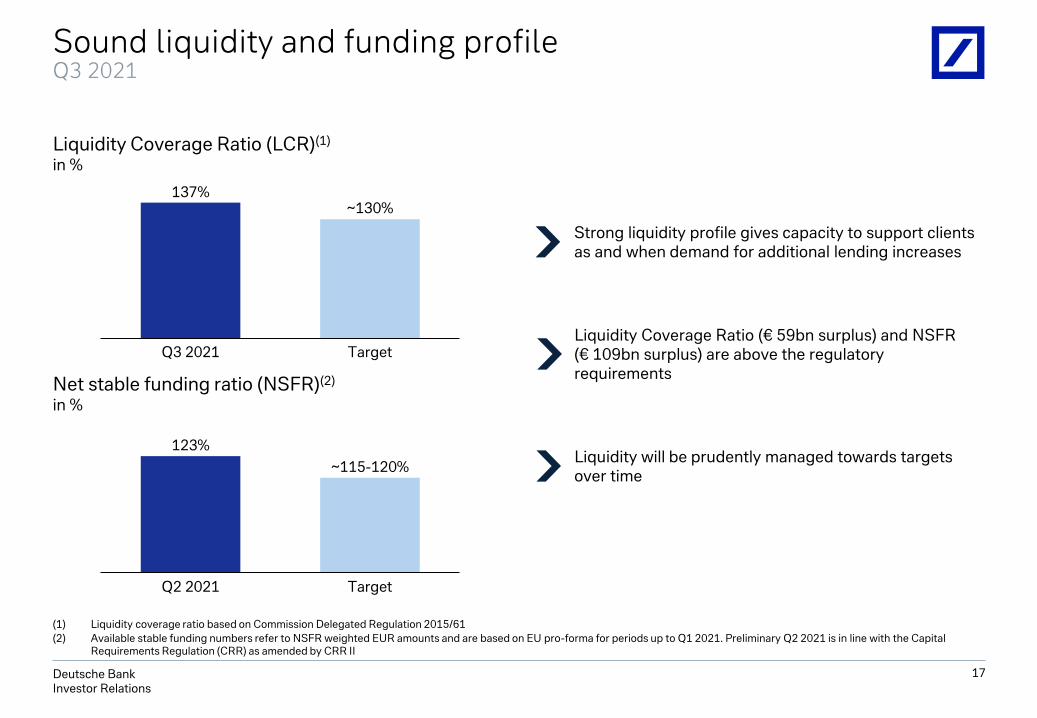
Net stable funding ratio (NSFR)(2)
in %
123%
Q2 2021 Target
~115-120%
17
Sound liquidity and funding profileQ3 2021
Liquidity Coverage Ratio (LCR)(1)
in %
Strong liquidity profile gives capacity to support clients as and when demand for additional lending increases
Liquidity Coverage Ratio (€ 59bn surplus) and NSFR (€ 109bn surplus) are above the regulatory requirements
Liquidity will be prudently managed towards targets over time
137%
Q3 2021 Target
~130%
(1) Liquidity coverage ratio based on Commission Delegated Regulation 2015/61
(2) Available stable funding numbers refer to NSFR weighted EUR amounts and are based on EU pro-forma for periods up to Q1 2021. Preliminary Q2 2021 is in line with the Capital Requirements Regulation (CRR) as amended by CRR II
Deutsche BankInvestor Relations
0.0%
1.0%
2.0%
3.0%
4.0%
0% 5% 10% 15% 20% 25% 30%
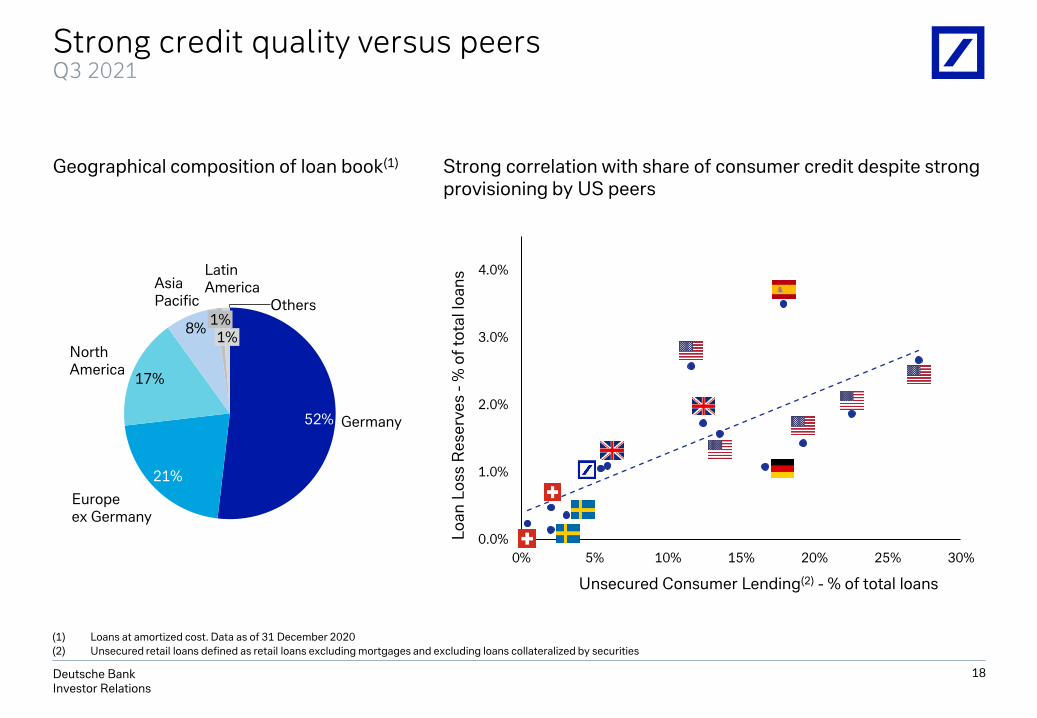
Strong credit quality versus peersQ3 2021
18
Unsecured Consumer Lending(2) - % of total loans
Lo
an
Lo
ss R
ese
rve
s -
% o
f to
tal l
oa
ns
52%
21%
17%
8%
Germany
1%
Europeex Germany
NorthAmerica
AsiaPacific
LatinAmerica
1%
Others
Strong correlation with share of consumer credit despite strong provisioning by US peers
Geographical composition of loan book(1)
(1) Loans at amortized cost. Data as of 31 December 2020
(2) Unsecured retail loans defined as retail loans excluding mortgages and excluding loans collateralized by securities
Deutsche BankInvestor Relations
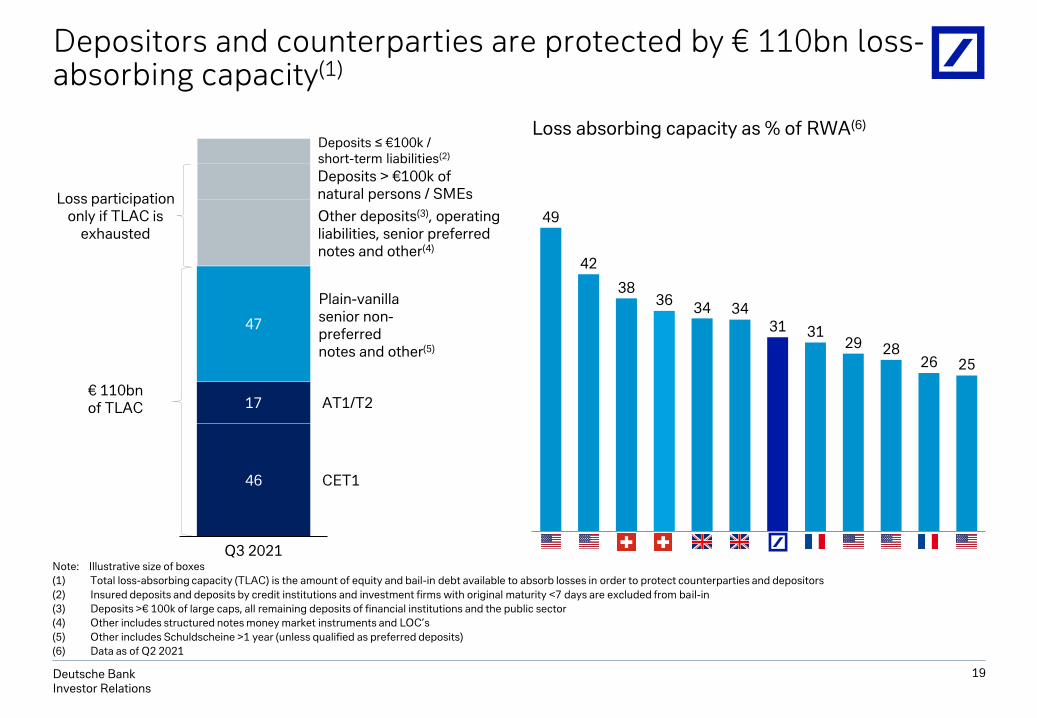
Note: Illustrative size of boxes
(1) Total loss-absorbing capacity (TLAC) is the amount of equity and bail-in debt available to absorb losses in order to protect counterparties and depositors
(2) Insured deposits and deposits by credit institutions and investment firms with original maturity <7 days are excluded from bail-in
(3) Deposits >€ 100k of large caps, all remaining deposits of financial institutions and the public sector
(4) Other includes structured notes money market instruments and LOC’s
(5) Other includes Schuldscheine >1 year (unless qualified as preferred deposits)
(6) Data as of Q2 2021
11
CET1
47
17
46
Q3 2021
AT1/T2
Depositors and counterparties are protected by € 110bn loss-absorbing capacity(1)
49
42
3836
34 3431 31
29 2826 25
Loss absorbing capacity as % of RWA(6)
Deposits ≤ €100k / short-term liabilities(2)
€ 110bn of TLAC
Loss participation only if TLAC is
exhausted
Plain-vanillasenior non-preferrednotes and other(5)
Other deposits(3), operating liabilities, senior preferred notes and other(4)
Deposits > €100k of natural persons / SMEs
19
Deutsche BankInvestor Relations
1 Transformation progress
Balance sheet and fundamental strength2
Appendix3
Agenda
20
Deutsche BankInvestor Relations
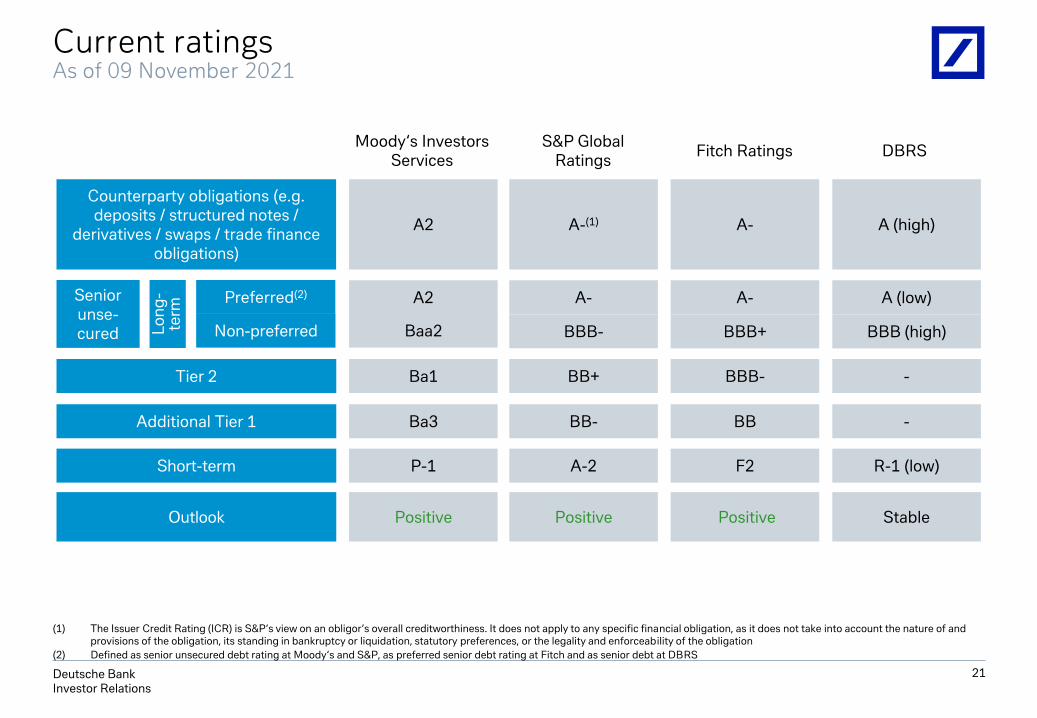
Tier 2
Counterparty obligations (e.g. deposits / structured notes /
derivatives / swaps / trade finance obligations)
Additional Tier 1
Senior unse-cured
Preferred(2)
Non-preferredLo
ng
-te
rm
A-(1) A-A2 A (high)
Ba1
A2
Ba3
BB+
A-
BB-
BBB-
A-
BB
-
A (low)
-
Baa2 BBB- BBB+ BBB (high)
Short-term P-1 A-2 F2 R-1 (low)
Outlook Positive Positive Positive Stable
Moody‘s Investors Services
S&P Global Ratings
Fitch Ratings DBRS
21
Current ratingsAs of 09 November 2021
(1) The Issuer Credit Rating (ICR) is S&P‘s view on an obligor‘s overall creditworthiness. It does not apply to any specific financial obligation, as it does not take into account the nature of and provisions of the obligation, its standing in bankruptcy or liquidation, statutory preferences, or the legality and enforceability of the obligation
(2) Defined as senior unsecured debt rating at Moody‘s and S&P, as preferred senior debt rating at Fitch and as senior debt at DBRS
Deutsche BankInvestor Relations
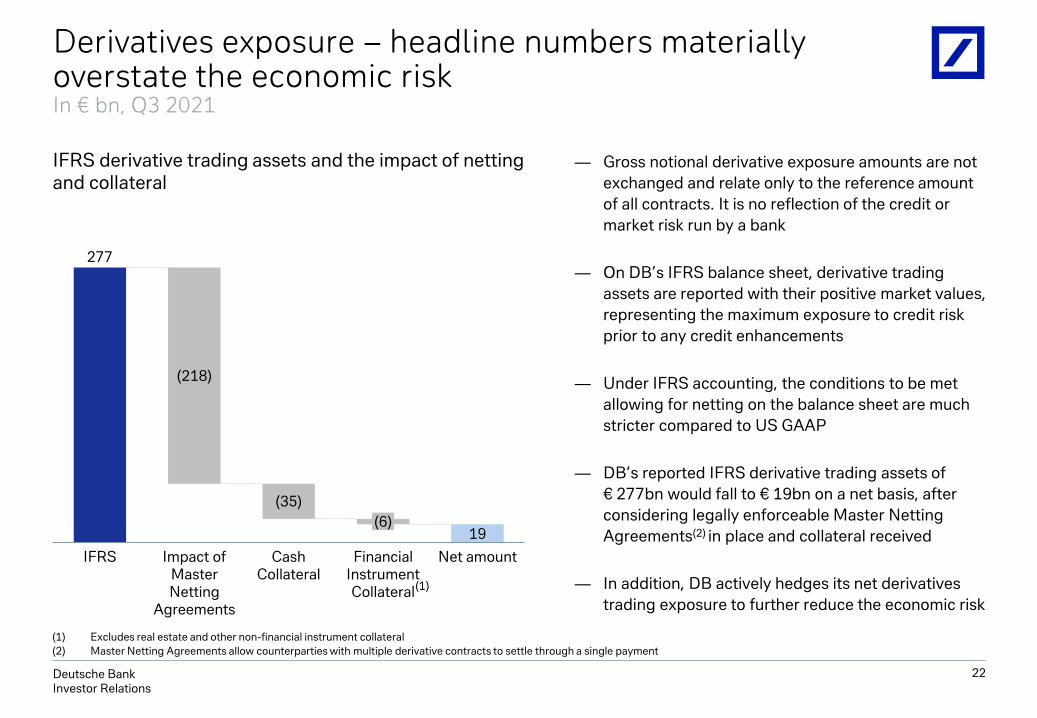
— Gross notional derivative exposure amounts are not
exchanged and relate only to the reference amount
of all contracts. It is no reflection of the credit or
market risk run by a bank
— On DB’s IFRS balance sheet, derivative trading
assets are reported with their positive market values,
representing the maximum exposure to credit risk
prior to any credit enhancements
— Under IFRS accounting, the conditions to be met
allowing for netting on the balance sheet are much
stricter compared to US GAAP
— DB’s reported IFRS derivative trading assets of
€ 277bn would fall to € 19bn on a net basis, after
considering legally enforceable Master Netting
Agreements(2) in place and collateral received
— In addition, DB actively hedges its net derivatives
trading exposure to further reduce the economic risk
(1) Excludes real estate and other non-financial instrument collateral
(2) Master Netting Agreements allow counterparties with multiple derivative contracts to settle through a single payment
277
IFRS Financial Instrument Collateral
(218)
19
Impact of Master Netting
Agreements
Cash Collateral
Net amount
(35)
(6)
(1)
Derivatives exposure – headline numbers materially overstate the economic riskIn € bn, Q3 2021
22
IFRS derivative trading assets and the impact of netting and collateral
Deutsche BankInvestor Relations
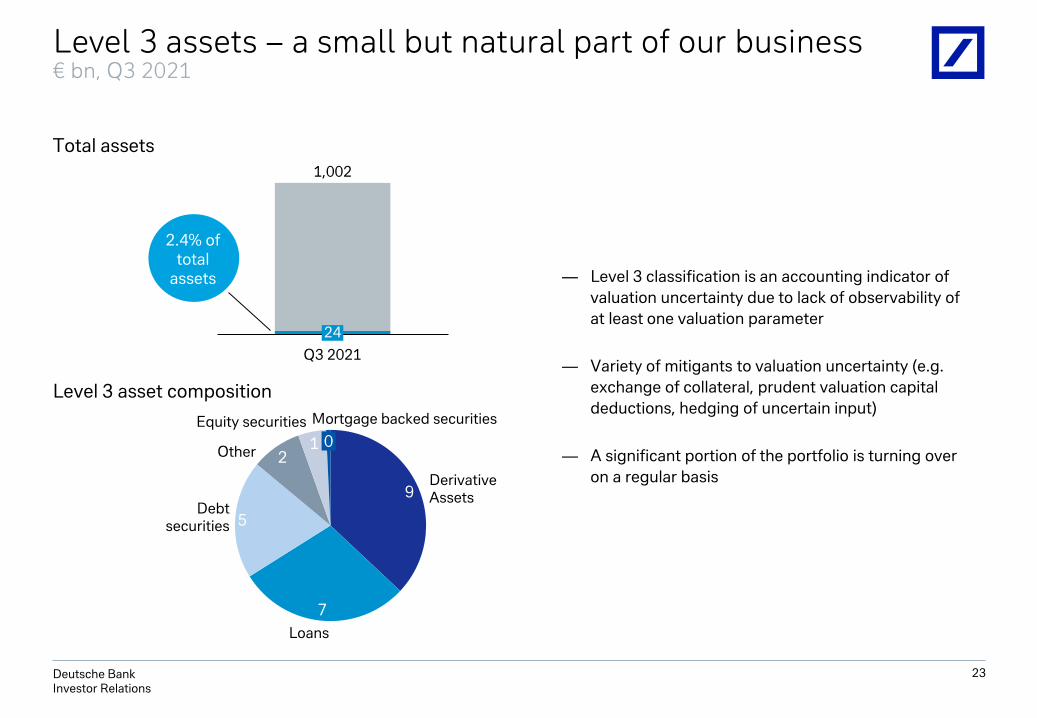
Level 3 asset composition
24
Q3 2021
1,002
2.4% of total
assets
23
Level 3 assets – a small but natural part of our business € bn, Q3 2021
Total assets
— Level 3 classification is an accounting indicator of
valuation uncertainty due to lack of observability of
at least one valuation parameter
— Variety of mitigants to valuation uncertainty (e.g.
exchange of collateral, prudent valuation capital
deductions, hedging of uncertain input)
— A significant portion of the portfolio is turning over
on a regular basis 9
DerivativeAssets
7
5
Loans
1
Debtsecurities
Other 2
Equity securities
0
Mortgage backed securities
Deutsche BankInvestor Relations
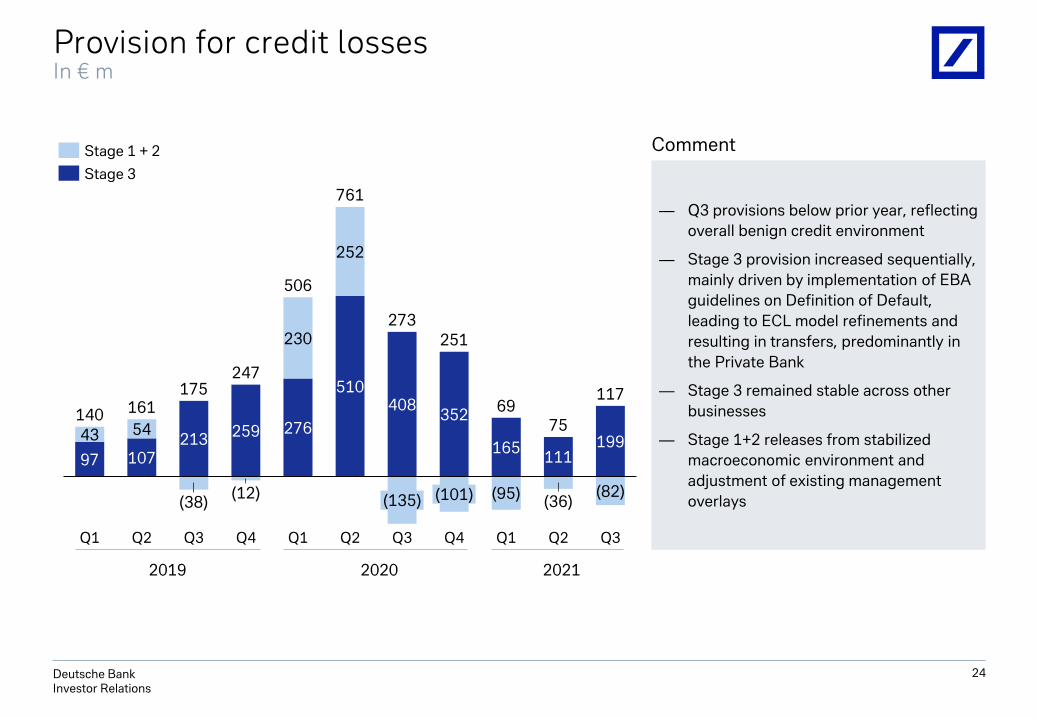
97 107213
259 276
510408
352
165 19943 54
230
252
(82)
Q3
75
Q4Q1 Q2 Q4Q3
(38)(12)
161
Q2
(135) (101) (95)
247
Q1
(36)
251
Q1
111
Q2 Q3
140
175
506
761
273
69117
24
Stage 1 + 2
Stage 3
Provision for credit lossesIn € m
— Q3 provisions below prior year, reflecting
overall benign credit environment
— Stage 3 provision increased sequentially,
mainly driven by implementation of EBA
guidelines on Definition of Default,
leading to ECL model refinements and
resulting in transfers, predominantly in
the Private Bank
— Stage 3 remained stable across other
businesses
— Stage 1+2 releases from stabilized
macroeconomic environment and
adjustment of existing management
overlays
2019 20212020
Comment
Deutsche BankInvestor Relations
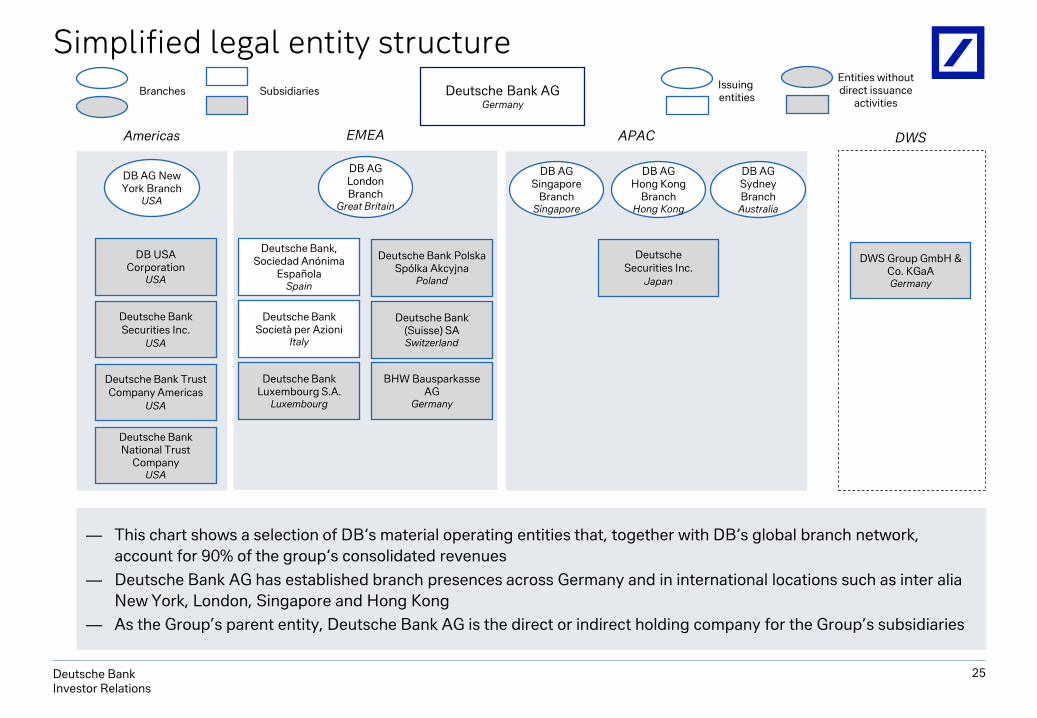
Simplified legal entity structure
Deutsche Bank Securities Inc.
USA
Deutsche Bank Trust Company Americas
USA
DB USACorporation
USA
Deutsche Bank AGGermany
Deutsche Bank (Suisse) SASwitzerland
Deutsche Bank, Sociedad Anónima
EspañolaSpain
Deutsche Bank PolskaSpólka Akcyjna
Poland
Deutsche BankSocietà per Azioni
Italy
Deutsche Bank Luxembourg S.A.
Luxembourg
Deutsche Securities Inc.
Japan
Americas EMEA APAC DWS
DWS Group GmbH & Co. KGaAGermany
Deutsche Bank National Trust
Company USA
DB AG New York Branch
USA
DB AG London Branch
Great Britain
DB AG Singapore
BranchSingapore
DB AG Hong Kong
BranchHong Kong
— This chart shows a selection of DB‘s material operating entities that, together with DB‘s global branch network,
account for 90% of the group‘s consolidated revenues
— Deutsche Bank AG has established branch presences across Germany and in international locations such as inter alia
New York, London, Singapore and Hong Kong
— As the Group’s parent entity, Deutsche Bank AG is the direct or indirect holding company for the Group’s subsidiaries
DB AG Sydney Branch
Australia
Issuingentities
BHW BausparkasseAG
Germany
Entities without direct issuance
activities
25
Branches Subsidiaries
Deutsche BankInvestor Relations
Cautionary statements
26
This presentation contains forward-looking statements. Forward-looking statements are statements that are not historical facts; they include statements about our
beliefs and expectations and the assumptions underlying them. These statements are based on plans, estimates and projections as they are currently available to
the management of Deutsche Bank. Forward-looking statements therefore speak only as of the date they are made, and we undertake no obligation to update
publicly any of them in light of new information or future events.
By their very nature, forward-looking statements involve risks and uncertainties. A number of important factors could therefore cause actual results to differ
materially from those contained in any forward-looking statement. Such factors include the conditions in the financial markets in Germany, in Europe, in the United
States and elsewhere from which we derive a substantial portion of our revenues and in which we hold a substantial portion of our assets, the development of asset
prices and market volatility, potential defaults of borrowers or trading counterparties, the implementation of our strategic initiatives, the reliability of our risk
management policies, procedures and methods, and other risks referenced in our filings with the U.S. Securities and Exchange Commission. Such factors are
described in detail in our SEC Form 20-F of 12 March 2021 under the heading “Risk Factors.” Copies of this document are readily available upon request or can be
downloaded from www.db.com/ir.
This presentation also contains non-IFRS financial measures. For a reconciliation to directly comparable figures reported under IFRS, to the extent such
reconciliation is not provided in this presentation, refer to the Q3 2021 Financial Data Supplement, which is accompanying this presentation and available at
www.db.com/ir.
Results are prepared in accordance with International Financial Reporting Standards (IFRS) as issued by the International Accounting Standards Board (“IASB”)
and endorsed by the European Union (“EU”), including, from 2020, application of portfolio fair value hedge accounting for non-maturing deposits and fixed rate
mortgages with pre-payment options (the “EU carve-out”). Fair value hedge accounting under the EU carve-out is employed to minimise the accounting exposure
to both positive and negative moves in interest rates in each tenor bucket thereby reducing the volatility of reported revenue from Treasury activities. For the
three-month period ended September 30, 2021, application of the EU carve out had a positive impact of € 45 million on profit before taxes and of € 28 million on
profit. For the same time period in 2020 the application of the EU carve out had a negative impact of € 12 million on profit before taxes and of € 9 million on profit.
For the nine-month period ended September 30, 2021, application of the EU carve out had a negative impact of € 276 million on profit before taxes and of € 187
million on profit. For the same time period in 2020 the application of the EU carve out had a positive impact of € 65 million on profit before taxes and of € 38 million
on profit. The Group’s regulatory capital and ratios thereof are also reported on the basis of the EU carve out version of IAS 39. For the nine-month period ended
September 30, 2021, application of the EU carve out had a negative impact on the CET1 capital ratio of about 5 basis points and a positive impact of about 1 basis
point for the nine-month period ended September 30, 2020. In any given period, the net effect of the EU carve-out can be positive or negative, depending on the
fair market value changes in the positions being hedged and the hedging instruments.