Embed Size (px)
Citation preview

Click to edit Master title styleHFA Holdings Limited
2015 Interim Financial Results19 February 2015
The numbers in this presentation have been presented in US dollars (USD), unless otherwise indicated as being presented in Australian dollars (AUD).
For
per
sona
l use
onl
y
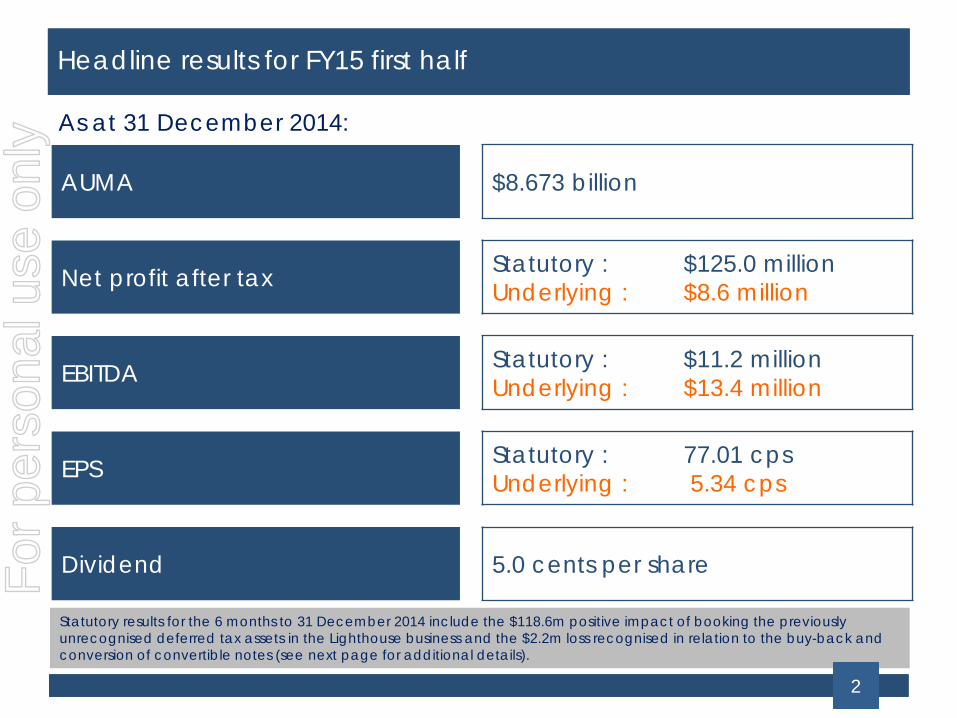
Click to edit Master title styleHeadline results for FY15 first half
AUMA $8.673 billion
Net profit after tax Statutory : $125.0 millionUnderlying : $8.6 million
EBITDA Statutory : $11.2 millionUnderlying : $13.4 million
EPS Statutory : 77.01 cpsUnderlying : 5.34 cps
Dividend 5.0 cents per share
As at 31 December 2014:
Statutory results for the 6 months to 31 December 2014 include the $118.6m positive impact of booking the previously unrecognised deferred tax assets in the Lighthouse business and the $2.2m loss recognised in relation to the buy-back and conversion of convertible notes (see next page for additional details).
2
For
per
sona
l use
onl
y
Click to edit Master title styleNon-recurring items impacting half-year results
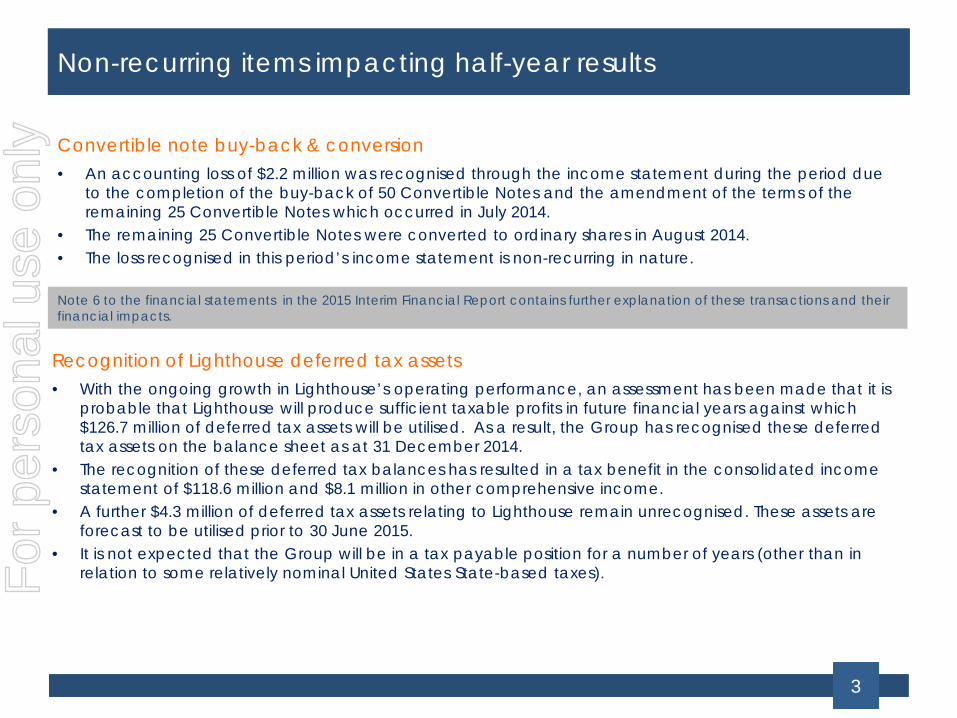
Convertible note buy-back & conversion
Note 6 to the financial statements in the 2015 Interim Financial Report contains further explanation of these transactions and their financial impacts.
• An accounting loss of $2.2 million was recognised through the income statement during the period due to the completion of the buy-back of 50 Convertible Notes and the amendment of the terms of the remaining 25 Convertible Notes which occurred in July 2014.
• The remaining 25 Convertible Notes were converted to ordinary shares in August 2014. • The loss recognised in this period’s income statement is non-recurring in nature.
Recognition of Lighthouse deferred tax assets• With the ongoing growth in Lighthouse’s operating performance, an assessment has been made that it is
probable that Lighthouse will produce sufficient taxable profits in future financial years against which $126.7 million of deferred tax assets will be utilised. As a result, the Group has recognised these deferred tax assets on the balance sheet as at 31 December 2014.
• The recognition of these deferred tax balances has resulted in a tax benefit in the consolidated income statement of $118.6 million and $8.1 million in other comprehensive income.
• A further $4.3 million of deferred tax assets relating to Lighthouse remain unrecognised. These assets are forecast to be utilised prior to 30 June 2015.
• It is not expected that the Group will be in a tax payable position for a number of years (other than in relation to some relatively nominal United States State-based taxes).
3
For
per
sona
l use
onl
y

Click to edit Master title style
4
Financial performance
For
per
sona
l use
onl
y
Click to edit Master title style
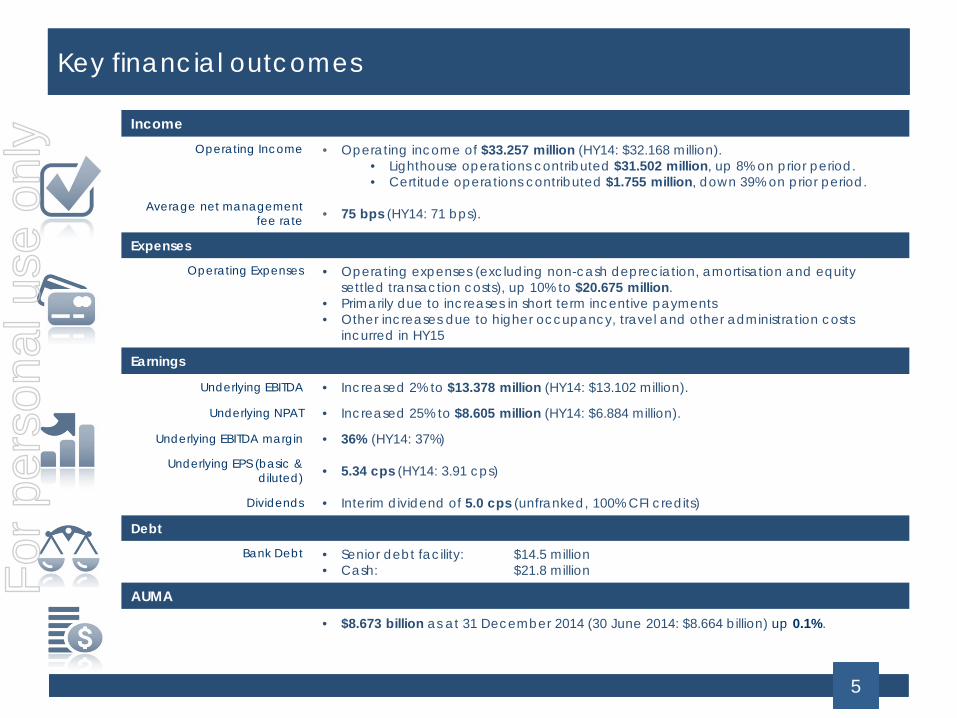
IncomeOperating Income • Operating income of $33.257 million (HY14: $32.168 million).
• Lighthouse operations contributed $31.502 million, up 8% on prior period.• Certitude operations contributed $1.755 million, down 39% on prior period.
Average net management fee rate • 75 bps (HY14: 71 bps).
Expenses
Operating Expenses • Operating expenses (excluding non-cash depreciation, amortisation and equity settled transaction costs), up 10% to $20.675 million.
• Primarily due to increases in short term incentive payments• Other increases due to higher occupancy, travel and other administration costs
incurred in HY15
Earnings
Underlying EBITDA • Increased 2% to $13.378 million (HY14: $13.102 million).
Underlying NPAT • Increased 25% to $8.605 million (HY14: $6.884 million).
Underlying EBITDA margin • 36% (HY14: 37%)
Underlying EPS (basic & diluted) • 5.34 cps (HY14: 3.91 cps)
Dividends • Interim dividend of 5.0 cps (unfranked, 100% CFI credits)
Debt
Bank Debt • Senior debt facility: $14.5 million • Cash: $21.8 million
AUMA
• $8.673 billion as at 31 December 2014 (30 June 2014: $8.664 billion) up 0.1%.
Key financial outcomes
5
For
per
sona
l use
onl
y
Click to edit Master title styleComparison of HY15 first half to prior period result
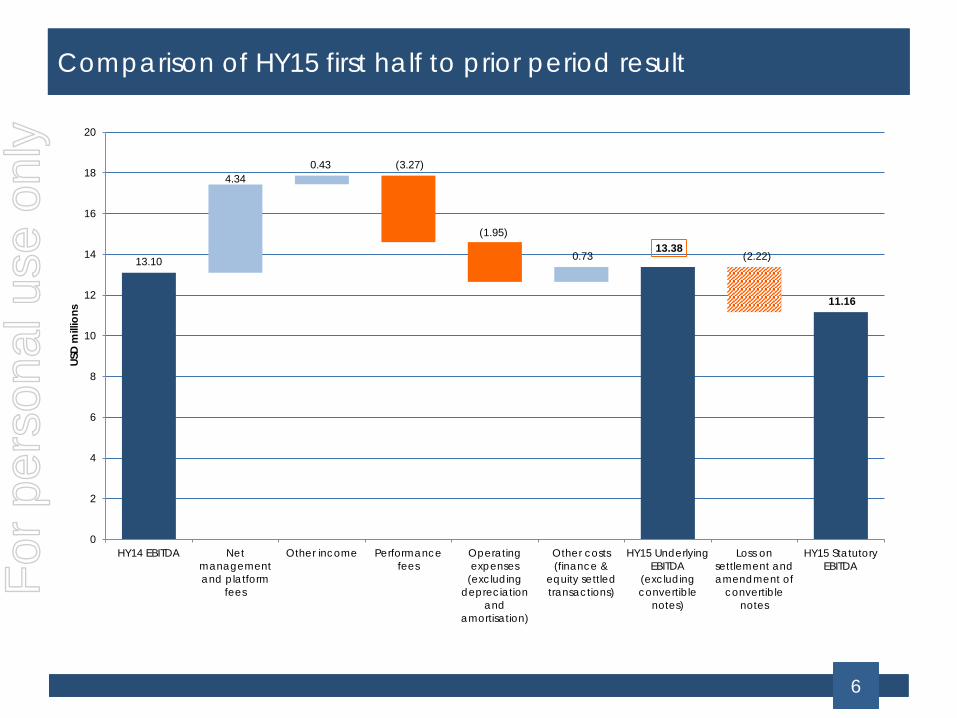
13.10
4.340.43 (3.27)
(1.95)
0.7313.38
(2.22)
11.16
0
2
4
6
8
10
12
14
16
18
20
HY14 EBITDA Netmanagementand platform
fees
Other income Performancefees
Operatingexpenses
(excludingdepreciation
andamortisation)
Other costs(finance &
equity settledtransactions)
HY15 UnderlyingEBITDA
(excludingconvertible
notes)
Loss onsettlement andamendment of
convertiblenotes
HY15 StatutoryEBITDA
USD
mill
ions
6
For
per
sona
l use
onl
y

Click to edit Master title styleKey drivers of the HY15 resultsM
ana
gem
enta
nd p
latfo
rm
fees
Management and platform fee income increased in HY15 by 15% to $36.1 million.
The increase was a result of:
a 9% increase in the average closing AUMA for the six month period; and
a 4 basis point increase in the average net management / platform fee rate which applied for the six months to 0.75%.
Perfo
rma
nce
fees
The Group earned $0.8 million in performance fees this period, down 81% on the prior period.
Performance fees are variable in nature, and it is difficult to forecast how much, if any, performance fee revenue will be earned by the Group in future periods.
Dist
ribut
ion
and
inve
stm
ent
ma
nage
men
t cos
ts 11% increase in distribution and investment management costs (‘DIMC’).
The increase was a result of:
an increase in Lighthouse’s AUMA to which DIMC is attached. This is consistent with the increase in management fee income earned by Lighthouse; and
an increase in Certitude’s external fee rebates, which increased in line with average AUMA.
Op
era
ting
exp
ense
s
The Group’s overall operating expenses were $20.7 million, up $2.0 million on the prior period. This is primarily due to increases in short term incentive payments, although there have been some other increases in relation to occupancy, travel and other administration costs as compared to the prior period.
HFA also incurred $0.2 million of one-off director and executive recruitment fees, and also had increased share registry costs due tohaving a higher number of shares on issue following the institutional share placement and conversion of the convertible notes (see slide 3).
Lighthouse continues to progress the appointment of an additional senior distribution executive, but has not yet identified the right candidate.
Continued development of key risk management software with an external third party has reached certain milestones, and an annual licensing cost to the US business of $1.25m to commence from February 2015.
Net
inte
rest
88% decrease in net interest expense:
Decrease in interest expense due to:
Reducing balance of the Westpac loan; and
Buy-back and redemption of the convertible notes during the period.
7
For
per
sona
l use
onl
y
Click to edit Master title style
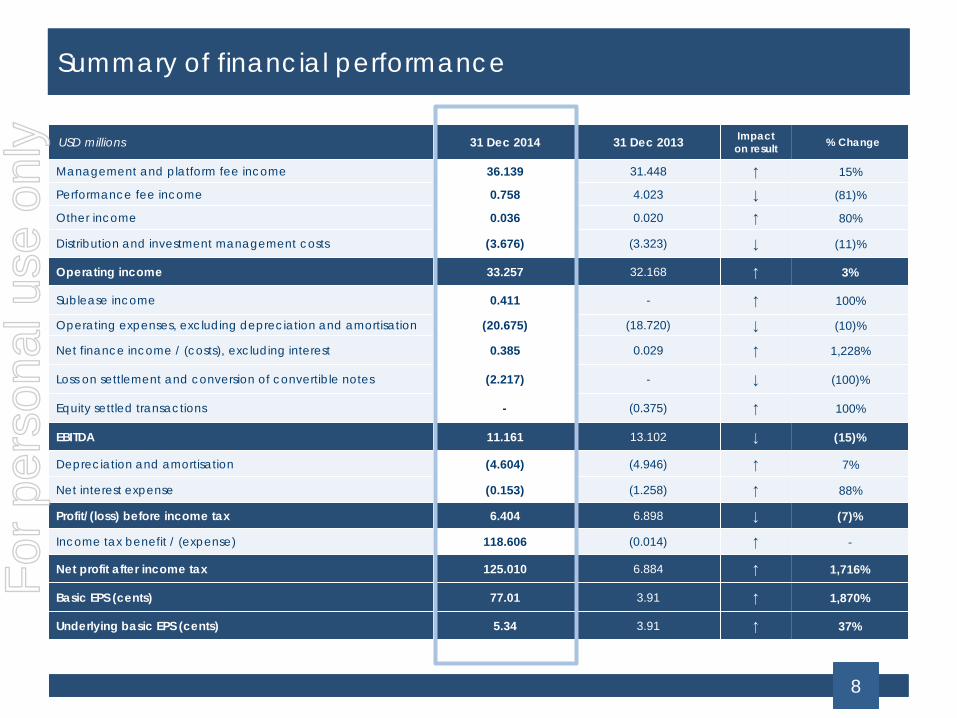
USD millions 31 Dec 2014 31 Dec 2013 Impact on result % Change
Management and platform fee income 36.139 31.448 ↑ 15%
Performance fee income 0.758 4.023 ↓ (81)%
Other income 0.036 0.020 ↑ 80%
Distribution and investment management costs (3.676) (3.323) ↓ (11)%
Operating income 33.257 32.168 ↑ 3%
Sublease income 0.411 - ↑ 100%
Operating expenses, excluding depreciation and amortisation (20.675) (18.720) ↓ (10)%
Net finance income / (costs), excluding interest 0.385 0.029 ↑ 1,228%
Loss on settlement and conversion of convertible notes (2.217) - ↓ (100)%
Equity settled transactions - (0.375) ↑ 100%
EBITDA 11.161 13.102 ↓ (15)%
Depreciation and amortisation (4.604) (4.946) ↑ 7%
Net interest expense (0.153) (1.258) ↑ 88%
Profit/(loss) before income tax 6.404 6.898 ↓ (7)%
Income tax benefit / (expense) 118.606 (0.014) ↑ -
Net profit after income tax 125.010 6.884 ↑ 1,716%
Basic EPS (cents) 77.01 3.91 ↑ 1,870%
Underlying basic EPS (cents) 5.34 3.91 ↑ 37%
Summary of financial performance
8
For
per
sona
l use
onl
y
Click to edit Master title styleHFA Group balance sheet
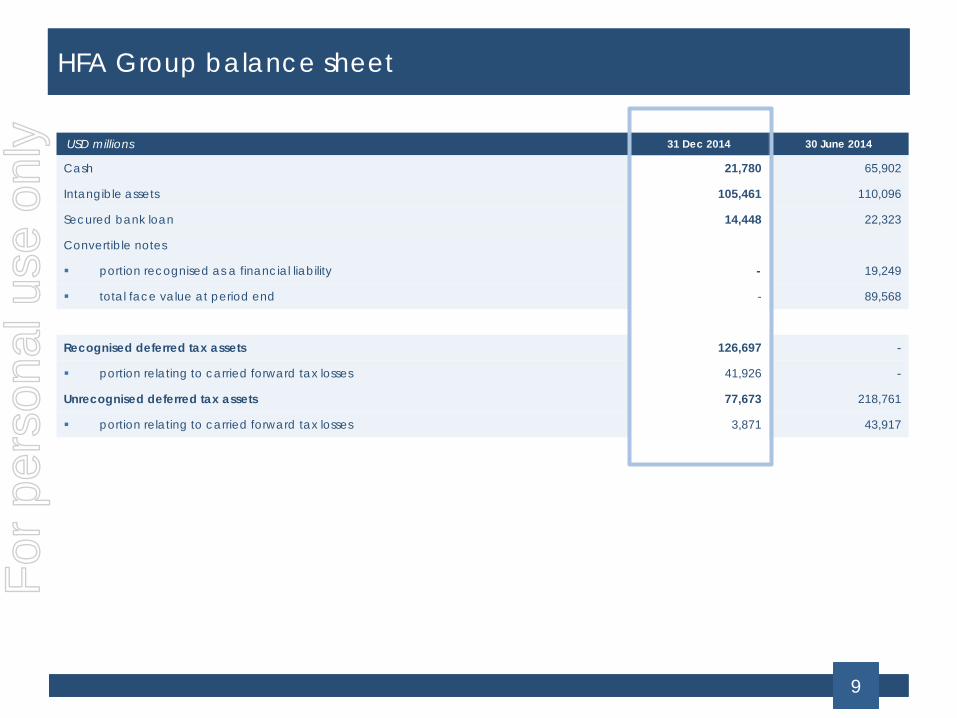
USD millions 31 Dec 2014 30 June 2014
Cash 21,780 65,902
Intangible assets 105,461 110,096
Secured bank loan 14,448 22,323
Convertible notes
portion recognised as a financial liability - 19,249
total face value at period end - 89,568
Recognised deferred tax assets 126,697 -
portion relating to carried forward tax losses 41,926 -
Unrecognised deferred tax assets 77,673 218,761
portion relating to carried forward tax losses 3,871 43,917
9
For
per
sona
l use
onl
y
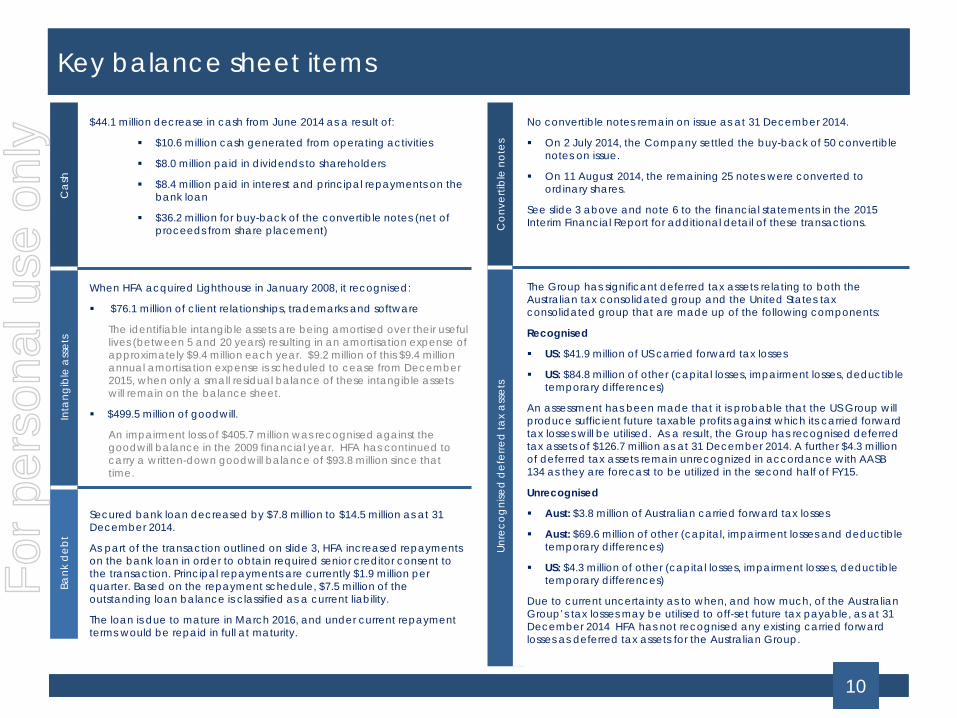
Click to edit Master title styleKey balance sheet itemsC
ash
$44.1 million decrease in cash from June 2014 as a result of:
$10.6 million cash generated from operating activities
$8.0 million paid in dividends to shareholders
$8.4 million paid in interest and principal repayments on the bank loan
$36.2 million for buy-back of the convertible notes (net of proceeds from share placement)
Inta
ngib
le a
sset
s
When HFA acquired Lighthouse in January 2008, it recognised:
$76.1 million of client relationships, trademarks and software
The identifiable intangible assets are being amortised over their useful lives (between 5 and 20 years) resulting in an amortisation expense of approximately $9.4 million each year. $9.2 million of this $9.4 million annual amortisation expense is scheduled to cease from December 2015, when only a small residual balance of these intangible assets will remain on the balance sheet.
$499.5 million of goodwill.
An impairment loss of $405.7 million was recognised against the goodwill balance in the 2009 financial year. HFA has continued to carry a written-down goodwill balance of $93.8 million since that time.
Bank
deb
t
Secured bank loan decreased by $7.8 million to $14.5 million as at 31 December 2014.
As part of the transaction outlined on slide 3, HFA increased repayments on the bank loan in order to obtain required senior creditor consent to the transaction. Principal repayments are currently $1.9 million per quarter. Based on the repayment schedule, $7.5 million of the outstanding loan balance is classified as a current liability.
The loan is due to mature in March 2016, and under current repayment terms would be repaid in full at maturity.
Con
verti
ble
not
es
No convertible notes remain on issue as at 31 December 2014.
On 2 July 2014, the Company settled the buy-back of 50 convertible notes on issue.
On 11 August 2014, the remaining 25 notes were converted to ordinary shares.
See slide 3 above and note 6 to the financial statements in the 2015 Interim Financial Report for additional detail of these transactions.
Unre
cogn
ised
def
erre
d ta
x a
sset
s
The Group has significant deferred tax assets relating to both the Australian tax consolidated group and the United States tax consolidated group that are made up of the following components:
Recognised
US: $41.9 million of US carried forward tax losses
US: $84.8 million of other (capital losses, impairment losses, deductible temporary differences)
An assessment has been made that it is probable that the US Group will produce sufficient future taxable profits against which its carried forward tax losses will be utilised. As a result, the Group has recognised deferred tax assets of $126.7 million as at 31 December 2014. A further $4.3 million of deferred tax assets remain unrecognized in accordance with AASB 134 as they are forecast to be utilized in the second half of FY15.
Unrecognised
Aust: $3.8 million of Australian carried forward tax losses
Aust: $69.6 million of other (capital, impairment losses and deductible temporary differences)
US: $4.3 million of other (capital losses, impairment losses, deductible temporary differences)
Due to current uncertainty as to when, and how much, of the Australian Group’s tax losses may be utilised to off-set future tax payable, as at 31 December 2014 HFA has not recognised any existing carried forward losses as deferred tax assets for the Australian Group.
10
For
per
sona
l use
onl
y

Click to edit Master title style
11
AUMA and investment performance
For
per
sona
l use
onl
y
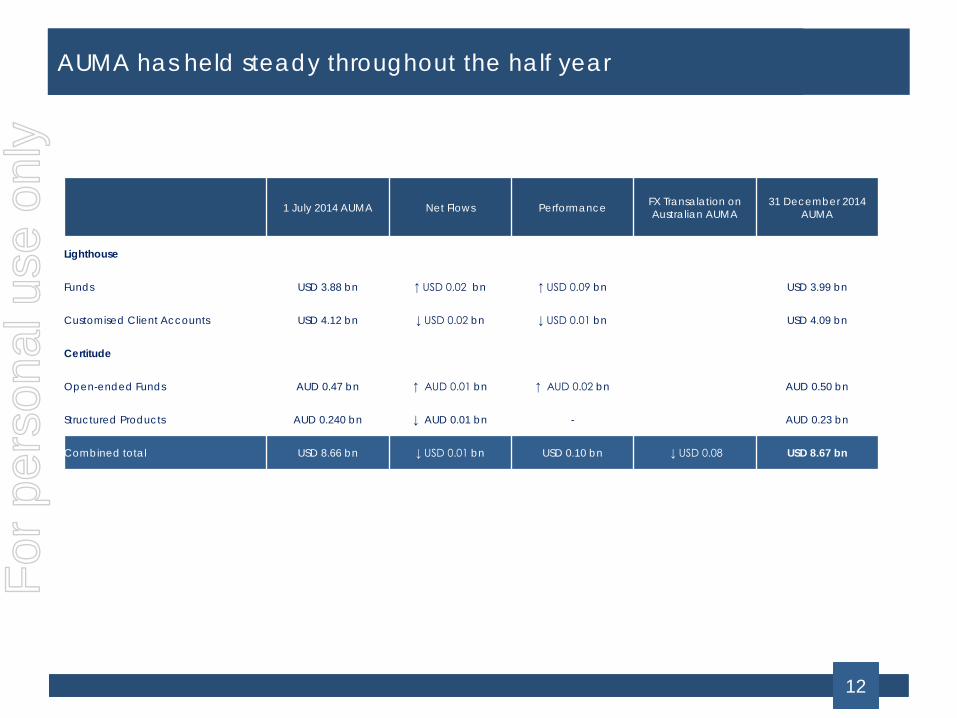
Click to edit Master title styleAUMA has held steady throughout the half year
1 July 2014 AUMA Net Flows Performance FX Transalation on Australian AUMA
31 December 2014 AUMA
Lighthouse
Funds USD 3.88 bn ↑ USD 0.02 bn ↑ USD 0.09 bn USD 3.99 bn
Customised Client Accounts USD 4.12 bn ↓ USD 0.02 bn ↓ USD 0.01 bn USD 4.09 bn
Certitude
Open-ended Funds AUD 0.47 bn ↑ AUD 0.01 bn ↑ AUD 0.02 bn AUD 0.50 bn
Structured Products AUD 0.240 bn ↓ AUD 0.01 bn - AUD 0.23 bn
Combined total USD 8.66 bn ↓ USD 0.01 bn USD 0.10 bn ↓ USD 0.08 USD 8.67 bn
12
For
per
sona
l use
onl
y

Click to edit Master title styleKey Lighthouse Funds – performanceDecember 2014 Performance
Lighthouse Multi-strategy Funds December YTD 3 year 5 year 10 year 3 yearvolatility
Lighthouse Diversified Fund LP 0.85% 7.39% 8.79% 6.28% 5.22% 2.75%
Lighthouse V Fund Ltd 0.37% 6.97% 7.78% 5.05% 4.45% 2.79%
Lighthouse Multi-Strategy Fund Ltd 0.57% 6.80% 7.91% 5.62% n/a 3.14%
Lighthouse Strategy-Focused Funds December YTD 3 year 5 year 10 year 3 yearvolatility
Lighthouse Global Long/Short Fund LP 0.61% 5.26% 10.59% 6.88% 6.48% 4.59%
Lighthouse Credit Opportunities Fund LP 0.40% 3.35% 9.17% 9.36% 5.74% 3.88%
Lighthouse Managed Futures Fund LLC 1.27% 10.42% 0.72% 1.88% n/a 8.44%
Lighthouse Healthcare Series 3.54% 12.26% 14.58% 8.99% n/a 7.24%
Benchmarks December YTD 3 year 5 year 10 year 3 yearvolatility
S&P 500 (with reinvested dividends) -0.25% 13.69% 20.41% 15.45% 7.67% 9.10%
MSCI AC World Index -1.89% 4.71% 14.71% 9.74% 6.64% 10.63%
Barclays Government / Credit Bond Index 0.08% 6.00% 2.76% 4.69% 4.70% 2.99%
91 Day US Treasury Bills 0.00% 0.03% 0.07% 0.09% 1.55% 0.02%
HFRX Global Hedge Fund Index -0.75% -0.57% 3.18% 1.04% 0.70% 3.13%
* Performance may vary among different share classes or series within a fund. Past performance is not indicative of future results.
13
For
per
sona
l use
onl
y

Click to edit Master title styleCertitude Funds – performance31 December 2014
Past performance is not an indicator of future performance.
1 year 3 year (pa) 5 year (pa) 10 year (pa) SinceInception (pa)
Since Inception Volatility
(pa)
Threadneedle Global Equity Income Fund (Unhedged) 5.46% n/a n/a n/a 23.77% (30-Nov-2012)
8.62%
Benchmark: MSCI ACWI Gross (AUD unhedged) 14.47% n/a n/a n/a 28.49% (30-Nov-2012)
8.83%
GaveKal Asian Opportunities Fund 12.64% 15.62% n/a n/a 10.32% (12-Oct-2010)
9.42%
Benchmark: MSCI AC Asia Pacific Index 9.64% 18.16% n/a n/a 9.11%(12-Oct-2010)
8.45%
LHP Global Long/Short Fund (Wholesale) 6.80% 11.92% 8.96% 8.03% 6.98%(31-Mar-2001)
4.85%
Benchmark: MSCI ACWI Net (100% hedged to AUD) 11.43% 19.13% 12.97% 8.24% 6.67%(31-Mar-2001)
14.69%
LHP Diversified Investments Fund 9.76% 11.23% 8.33% 5.20% 5.73% (31-Mar-2001)
6.18%
Benchmark: HFRX Global Hedge Fund Index (100% hedged to AUD)
0.95% 5.76% 4.06% 2.80% 4.60%(31-Mar-2001)
5.68%
14
For
per
sona
l use
onl
y

Click to edit Master title style
15
Business overview
For
per
sona
l use
onl
y

Click to edit Master title styleWho we are
Lighthouse Investment Partners, LLC Certitude Global Investments Limited
Based in the United States, with offices in New York, Chicago and Palm Beach Gardens in addition to offices in London and Hong Kong.
Lighthouse has been managing hedge funds since 1999. The business commenced by offering pooled investment vehicles to wholesale investors, and since 2011 has broadened its services to provide customised investment management solutions and services to large institutional clients.
One of Lighthouse’s key strengths is the proprietary managed accounts program, which is core to both its pooled managed funds and customised client services.
As at 31 December 2014, Lighthouse is managing USD8.4 billion of assets, including USD0.3 billion that it manages on behalf of Certitude products.
Based in Australia with offices in Sydney, Brisbane and Melbourne.
Certitude has been operating and distributing hedge funds to Australian retail and wholesale investors since 1998.
Since 2009, Certitude has broadened its investment product range through strategic partnerships with other off-shore investment managers. Since that time, Certitude has introduced new managed funds which invest into a broader range of asset classes, with a particular focus on global and Asian equities.
As at 31 December 2014, Certitude has assets under management of AUD0.7 billion.
The HFA group comprises two businesses delivering global investment products and services to a diverse range of investors andclients.
16
For
per
sona
l use
onl
y
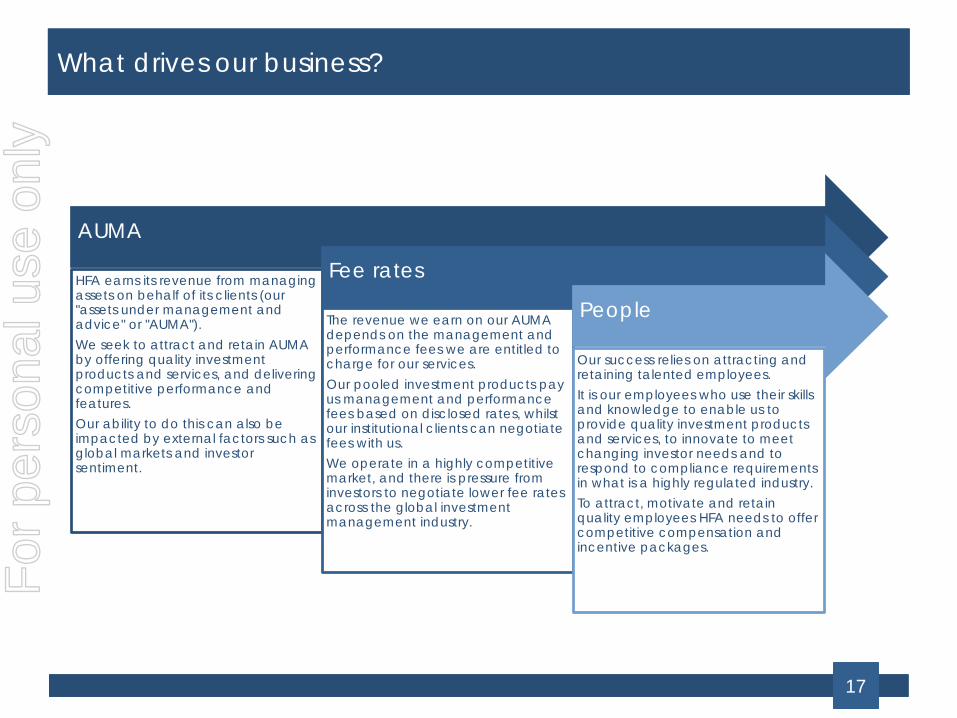
Click to edit Master title styleWhat drives our business?
AUMA
HFA earns its revenue from managing assets on behalf of its clients (our "assets under management and advice" or "AUMA").We seek to attract and retain AUMA by offering quality investment products and services, and delivering competitive performance and features. Our ability to do this can also be impacted by external factors such as global markets and investor sentiment.
Fee rates
The revenue we earn on our AUMA depends on the management and performance fees we are entitled to charge for our services.Our pooled investment products pay us management and performance fees based on disclosed rates, whilst our institutional clients can negotiate fees with us.We operate in a highly competitive market, and there is pressure from investors to negotiate lower fee rates across the global investment management industry.
People
Our success relies on attracting and retaining talented employees.It is our employees who use their skills and knowledge to enable us to provide quality investment products and services, to innovate to meet changing investor needs and to respond to compliance requirements in what is a highly regulated industry. To attract, motivate and retain quality employees HFA needs to offer competitive compensation and incentive packages.
17
For
per
sona
l use
onl
y
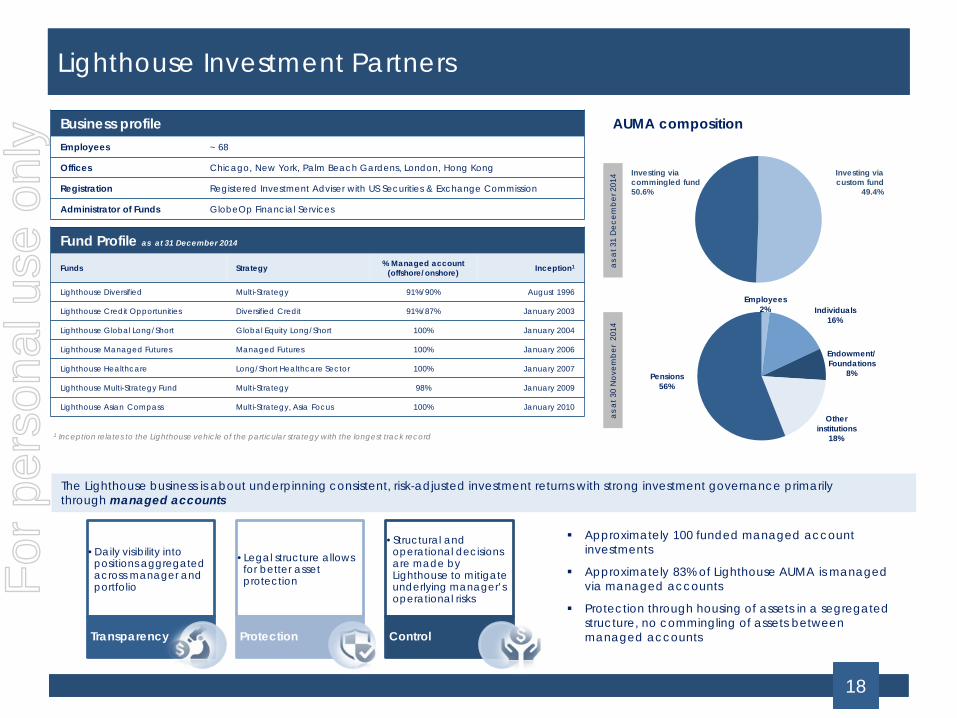
Click to edit Master title styleLighthouse Investment Partners
Business profileEmployees ~ 68
Offices Chicago, New York, Palm Beach Gardens, London, Hong Kong
Registration Registered Investment Adviser with US Securities & Exchange Commission
Administrator of Funds GlobeOp Financial Services
Fund Profile as at 31 December 2014
Funds Strategy % Managed account(offshore/onshore) Inception1
Lighthouse Diversified Multi-Strategy 91%/90% August 1996
Lighthouse Credit Opportunities Diversified Credit 91%/87% January 2003
Lighthouse Global Long/Short Global Equity Long/Short 100% January 2004
Lighthouse Managed Futures Managed Futures 100% January 2006
Lighthouse Healthcare Long/Short Healthcare Sector 100% January 2007
Lighthouse Multi-Strategy Fund Multi-Strategy 98% January 2009
Lighthouse Asian Compass Multi-Strategy, Asia Focus 100% January 2010
AUMA composition
1 Inception relates to the Lighthouse vehicle of the particular strategy with the longest track record
The Lighthouse business is about underpinning consistent, risk-adjusted investment returns with strong investment governance primarilythrough managed accounts
•Daily visibility into positions aggregated across manager and portfolio
Transparency
•Legal structure allows for better asset protection
Protection
•Structural and operational decisions are made by Lighthouse to mitigate underlying manager’s operational risks
Control
Approximately 100 funded managed account investments
Approximately 83% of Lighthouse AUMA is managed via managed accounts
Protection through housing of assets in a segregated structure, no commingling of assets between managed accounts
Investing viacommingled fund50.6%
Investing viacustom fund
49.4%
Employees2% Individuals
16%
Endowment/ Foundations
8%
Other institutions
18%
Pensions56%
as a
t 31
Dec
embe
r 201
4as
at 3
0 N
ovem
ber
2014
18
For
per
sona
l use
onl
y

Click to edit Master title styleLighthouseA full range of self-directed and managed hedge fund solutions
Customised hedge fund exposure, strategies and funds
Investment advisory services for experienced institutional investors
Evolution of current hedge fund program
Operational due diligence
Opportunistic investments
Strive to simplify, streamline and integrate existing hedge fund/fund of hedge fund portfolios
Approximately 100 funded managed account investments across all major hedge fund strategies
Can include Lighthouse managed accounts, investor-sourced hedge funds and Lighthouse Funds
Direct access to senior investment professionals
Hedge fund strategy development and implementation
Increase transparency, centralise risk management, seek to reduce fees
Core-satellite and completion program construction around current hedge fund investments
Strategy and regional specific investments to complement existing allocations
Lighthouse reviews an underlying manager to identify whether there is adequate internal control structures in place
Enables investors and consultants to focus on investing while Lighthouse focuses on confirming sound operational controls and procedures
Ability to implement certain opportunistic investments as they arise (eg – special situations, spread dislocations)
Centralising reporting, risk management and analytics (where daily position-level information is available)
19
For
per
sona
l use
onl
y
Click to edit Master title styleCertitude Global Investments
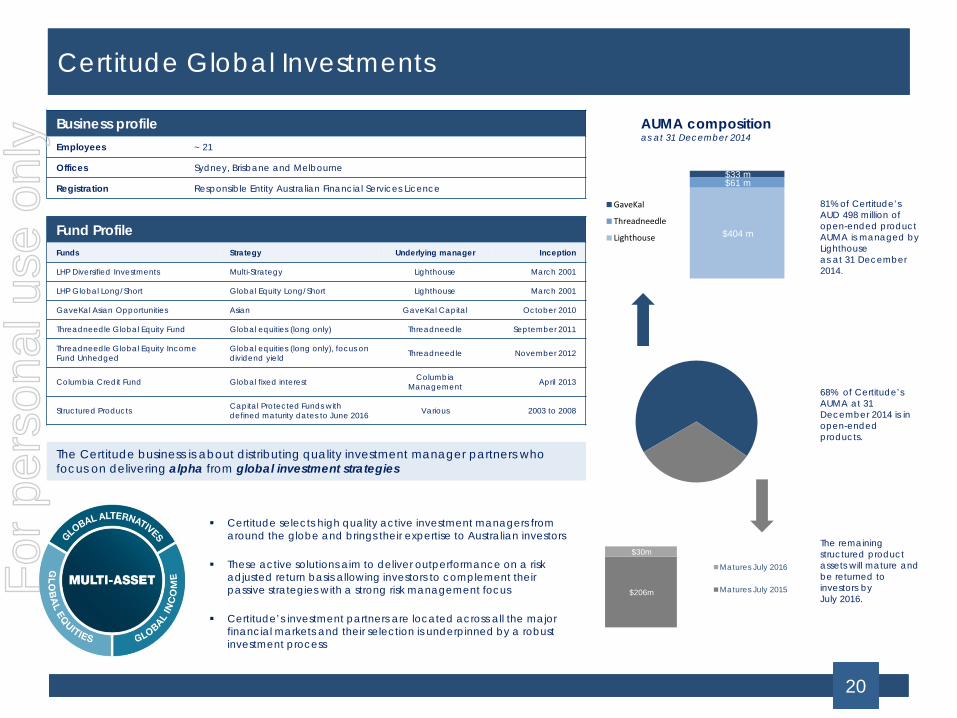
Business profileEmployees ~ 21
Offices Sydney, Brisbane and Melbourne
Registration Responsible Entity Australian Financial Services Licence
Fund ProfileFunds Strategy Underlying manager Inception
LHP Diversified Investments Multi-Strategy Lighthouse March 2001
LHP Global Long/Short Global Equity Long/Short Lighthouse March 2001
GaveKal Asian Opportunities Asian GaveKal Capital October 2010
Threadneedle Global Equity Fund Global equities (long only) Threadneedle September 2011
Threadneedle Global Equity Income Fund Unhedged
Global equities (long only), focus on dividend yield Threadneedle November 2012
Columbia Credit Fund Global fixed interest ColumbiaManagement April 2013
Structured Products Capital Protected Funds with defined maturity dates to June 2016 Various 2003 to 2008
AUMA compositionas at 31 December 2014
The Certitude business is about distributing quality investment manager partners who focus on delivering alpha from global investment strategies
Certitude selects high quality active investment managers from around the globe and brings their expertise to Australian investors
These active solutions aim to deliver outperformance on a risk adjusted return basis allowing investors to complement their passive strategies with a strong risk management focus
Certitude’s investment partners are located across all the major financial markets and their selection is underpinned by a robust investment process
The remaining structured product assets will mature and be returned to investors byJuly 2016.
68% of Certitude’s AUMA at 31 December 2014 is in open-ended products.
81% of Certitude’s AUD 498 million of open-ended product AUMA is managed by Lighthouse as at 31 December 2014.
$206m
$30m
Matures July 2016
Matures July 2015
$404 m
$61 m $33 m
GaveKal
Threadneedle
Lighthouse
20
For
per
sona
l use
onl
y

Click to edit Master title styleG
LOBA
LA
LTER
NA
TIVES
Lighthouse Investment Partners, LLC (‘Lighthouse’) is a US based investment manager dedicatedto managing funds of hedge funds for diversification and absolute return. Lighthouse managesfunds for a worldwide client base that includes corporations, university endowments, public andprivate foundations, pension plans, family offices, insurance companies and individual investors.
MUL
TI-A
SSET GaveKal Capital Limited (‘GaveKal’) is incorporated in Hong Kong and manages Asian long only
equity and fixed income strategies utilising their expertise in Asian macroeconomic research tocapitalise on the long-term growth prospects in the Asia-Pacific region. GaveKal acts as an advisorto several investment funds available to investors through funds which have combined assets overUS$1.7bn as at June 2014. These strategies are built on insights gained from GaveKal’s research,and in particular their expertise in Asia.
GLO
BAL
EQUI
TIES Columbia Threadneedle Investments is a leading international investment manager with a strong
track record of outperformance across asset classes. Columbia Threadneedle actively managesapproximately US$505bn of assets, investing on behalf of individuals, pension funds, insurers andcorporations. Threadneedle’s distinctive investment approach is based on creative thinking,sharing of ideas and rigorous debate.
Certitude... Global partners, global view
21
For
per
sona
l use
onl
y

Click to edit Master title style
22
Outlook
For
per
sona
l use
onl
y
Click to edit Master title styleOutlook
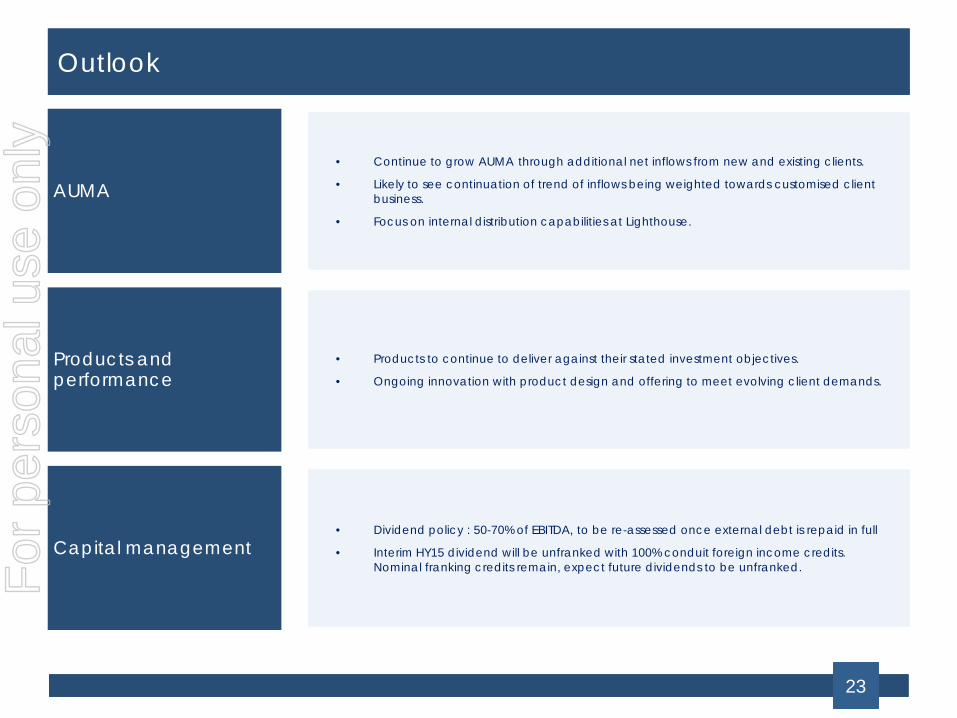
• Continue to grow AUMA through additional net inflows from new and existing clients.
• Likely to see continuation of trend of inflows being weighted towards customised client business.
• Focus on internal distribution capabilities at Lighthouse.
AUMA
• Products to continue to deliver against their stated investment objectives.
• Ongoing innovation with product design and offering to meet evolving client demands.Products and performance
• Dividend policy : 50-70% of EBITDA, to be re-assessed once external debt is repaid in full
• Interim HY15 dividend will be unfranked with 100% conduit foreign income credits. Nominal franking credits remain, expect future dividends to be unfranked.
Capital management
23
For
per
sona
l use
onl
y

Click to edit Master title style
This presentation has been prepared by HFA Holdings Limited (HFA) and provides information regarding HFA and its activities current as at19 February 2015. It is in summary form and is not necessarily complete. It should be read in conjunction with HFA’s 31 December 2014 InterimFinancial Report.
While the information in this presentation has been prepared in good faith and with reasonable care, no representation or warranty is made as tothe accuracy, adequacy or reliability of any statements, estimates, opinions or any other information contained in this presentation. To themaximum extent permitted by law, the HFA Group, its directors, officers, employees, agents and any other person disclaim all liability andresponsibility (including without limitation any liability arising from fault or negligence) for any direct or indirect loss or damage which may besuffered through use or reliance on anything contained in or omitted from this presentation. The information in this presentation is not intended tobe relied upon as advice to investors or potential investors, who should consider seeking independent professional advice depending upon theirspecific investment objectives, financial situation and particular needs.
Certain statements in this presentation may constitute “forward-looking” statements. Forward-looking statements are neither promises nor guarantees and involve known or unknown risks, uncertainties and other factors which may cause actual results to vary materially from any projection, future results or performance expressed or implied by such forward-looking statements. No assurance is given that future developments will be in accordance with HFA’s expectations. Actual results could differ materially from those expected by HFA.
Disclaimer
24
For
per
sona
l use
onl
y