Embed Size (px)
Citation preview

Click to edit Master title style
28/01/2014 1
CLEAR PRACTICAL EFFECTIVE
Investment Lunch
January 2014

2
CLEAR PRACTICAL EFFECTIVE
AGENDA
Nick Frank
Eric Clapton
Richard Miller
Ellie Clapton
• Introduction
• Proposition Update
• Macro Economic View
• Fund Selection and Analysis
January 2014
• Fund Selection and
Analysis

3
CLEAR PRACTICAL EFFECTIVE
Nick Frank Business
Development
January 2014

4
CLEAR PRACTICAL EFFECTIVE
Conservative Model 3 Year
Risk Return Graph Total Return Bid-Bid performance vs volatility scatter chart over 36 months (from 31 Dec 2010 to 31 Dec 2013) from UK IMA universe. Rebased in Pounds Sterling
5
CLEAR PRACTICAL EFFECTIVE
Income Model 3Year risk
Return Graph Total Return Bid-Bid performance vs volatility scatter chart over 36 months (from 31 Dec 2010 to 31 Dec 2013) from UK IMA universe. Rebased in Pounds Sterling
6
CLEAR PRACTICAL EFFECTIVE
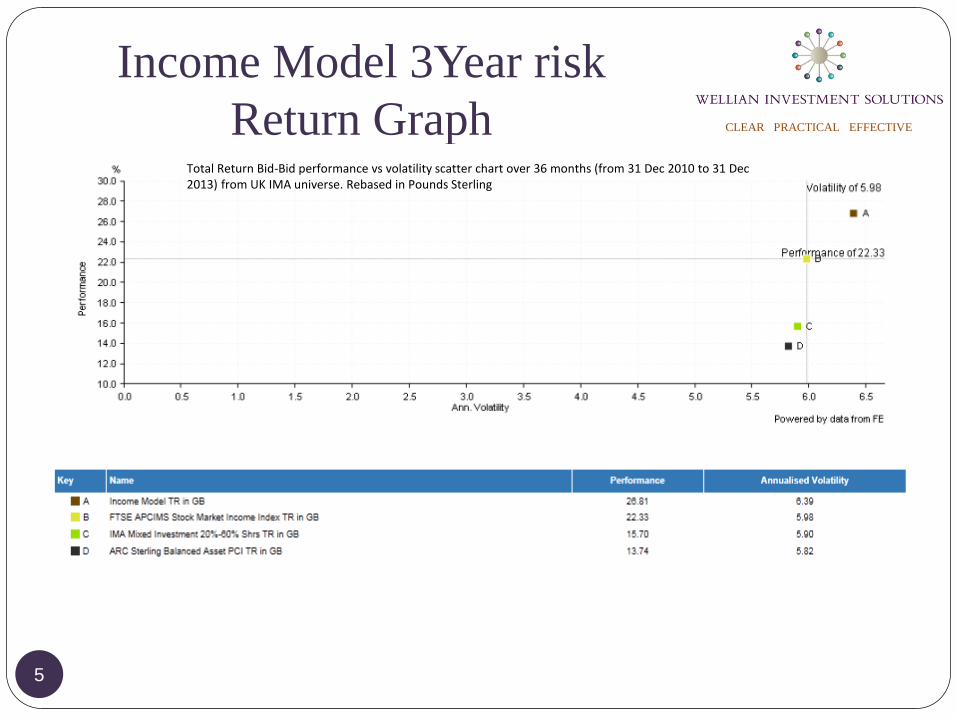
Balanced Model 3 Year Risk
Return Graph
Total Return Bid-Bid performance vs volatility scatter chart over 36 months (from 31 Dec 2010 to 31 Dec 2013) from UK IMA universe. Rebased in Pounds Sterling
7
CLEAR PRACTICAL EFFECTIVE
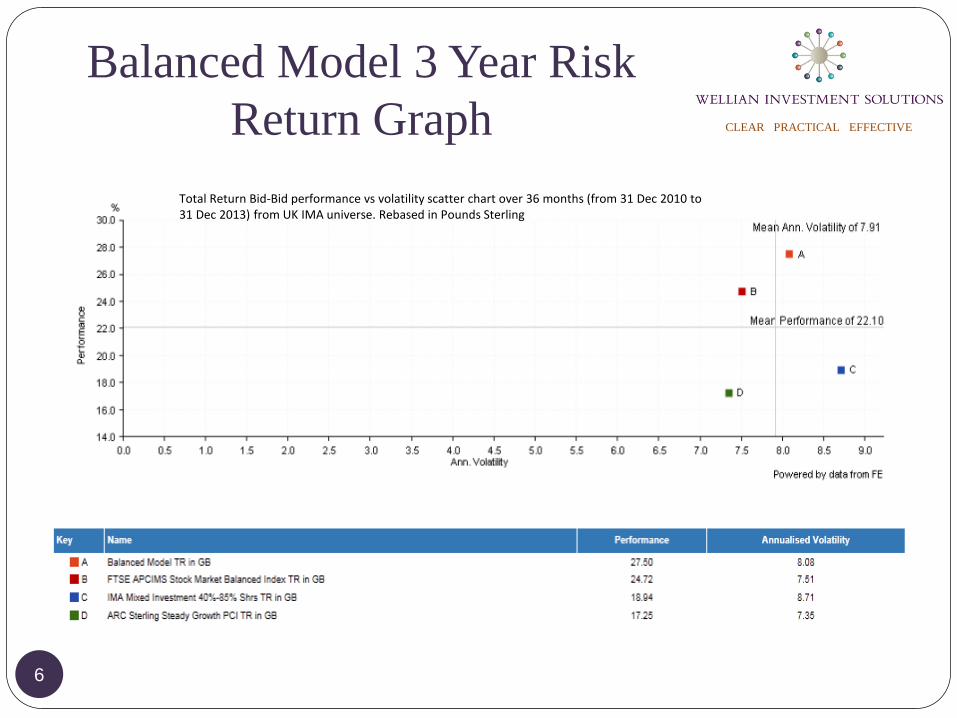
Growth Model 3 Year Risk
Return Graph
Total Return Bid-Bid performance vs volatility scatter chart over 36 months (from 31 Dec 2010 to 31 Dec 2013) from UK IMA universe. Rebased in Pounds Sterling

8
CLEAR PRACTICAL EFFECTIVE
Eric Clapton MD
January 2014

9
CLEAR PRACTICAL EFFECTIVE
Latest ICM Update
January 2014
January 2014

10
CLEAR PRACTICAL EFFECTIVE
Demand for Risk Assets
•
•
•
•
•
•
•
January 2014

11
CLEAR PRACTICAL EFFECTIVE
By Region (UK)
• Real wage falls helping job creation and unemployment
falls to 7.4%
• Increasing possibility of fine tune tightening of
monetary policy
• Government maintaining austerity strategy to reduce
public sector to 17% of economy by 2018
• UK economy median forecast growth at 2.4% for 2013
and 2.2% 2014
• UK inflation falls to target level 2.0% from 2.2%
January 2014

12
CLEAR PRACTICAL EFFECTIVE
By Region (UK) continued
• Increasing political uncertainties as the coalition parties
position for the next election
• Increasing concern regarding outcome of Scottish
devolution vote
• Debt/GDP percentage rising to 79.2% end 2013/2014 from
76.6% end 2012/2013, peaking at 85.6% in 2016/17
• Balanced budget forecast by 2018
January 2014
13
CLEAR PRACTICAL EFFECTIVE
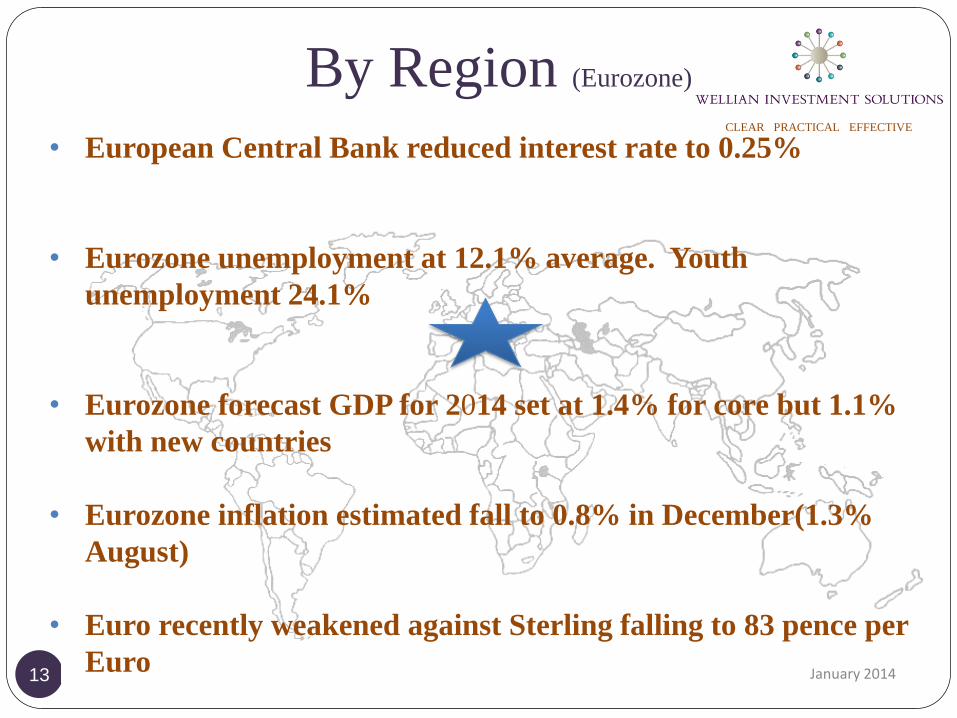
By Region (Eurozone)
• European Central Bank reduced interest rate to 0.25%
• Eurozone unemployment at 12.1% average. Youth
unemployment 24.1%
• Eurozone forecast GDP for 2014 set at 1.4% for core but 1.1%
with new countries
• Eurozone inflation estimated fall to 0.8% in December(1.3%
August)
• Euro recently weakened against Sterling falling to 83 pence per
Euro January 2014

14
CLEAR PRACTICAL EFFECTIVE
By Region (US)
• US growth revised up to 4.1% in Q3 from 2.5% in Q2
• Accommodative monetary policy still in place for now but
more tapering increasingly likely
• Unemployment rate 6.7% from 7.0% in November but
participation rate fallen to below 63%
• Cheap energy drives industrial repatriation. Increasing
reserves of shale oil and gas January 2014

15
CLEAR PRACTICAL EFFECTIVE
By Region (US) continued
• Savings rate reduced from 5.3% Q4 2012 to 2.3%
Q1 2013 but revised up to 5.0% in Q3
• Budget surplus of $53 billion in December
• Fall in deficit from $1.6 trillion to $1.2 trillion
since Q1 2011 – now fallen to $1.0 trillion Q2
2013 and $0.7 trillion initial for 2013
January 2014

By Region (China)
• Record trade surplus of $260 billion in 2013 ($230 billion 2012)
• But export growth slowed to 4.3% from 12.7% in November
• Chinese growth slowed to 7.8% for 2013 as budgeted
• Fear of bubbles in some markets after experience of 2008
• China to promote equality and reduce conspicuous
consumption(corruption); however, retail sales are still growing at
13.7% per annum which is above average run rate of 13.3%
January 2014 16

By Region (China) Continued
• Government allowing free market to increasingly allocate
resources
• Continue to purchase foreign strategic assets as evidenced in
Docklands and inclusion in UK NuGen Joint Venture
• London & Singapore approved as issuer of Qualifying Foreign
Investment
• Rules issued for market trading of certificates of deposit
January 2014 17

By Region (Japan)
• Government policy to weaken yen supported globally. Yen
weakened 34% cumulatively against US dollar since Oct
2012 (32% November 2013)
• Japanese GDP forecast at 3.8% for 2013 from initial estimate
of 2.6% but falling to 1.4% in 2014
• Japanese macro data still poor with aging workforce and
significant government borrowing
• Evidence that Japanese banks adequately
capitalised and able to lend to recovery
• Topix still ahead by 80% since October 2012 in local
currency terms (78% in November 2013) January 2014 18

Emerging Markets
• Better corporate governance
• PMI data flat but improving in Russia and Brazil
• Growth of middle class
• Countries are discovering increasing natural resources but
falling commodity prices have slowed economies
January 2014 19

Emerging Markets continued
• Brazil’s forecast growth decreased by 0.5% in Q3 with
forecast @ 1%
• Russian GDP equals 1.2% in Q3 and likely to miss 2014
forecast of 1.8%
• Indian growth forecast for 2013 reduced to 4.8% from
4.9% previously
January 2014 20

21
CLEAR PRACTICAL EFFECTIVE
Emerging Emerging
Markets!
January 2014
Mexico
Indonesia
Nigeria
Turkey
22
CLEAR PRACTICAL EFFECTIVE
Mexico
Annual growth forecast 1.8% in 2013
International Reserves $170 billion
Population 125 million
Labour Force 52 million
23
CLEAR PRACTICAL EFFECTIVE
Indonesia
• Annual growth forecast 2013 – 5%
• International Reserves $99 billion
• Population 250 million
• Labour Force 120 million
24
CLEAR PRACTICAL EFFECTIVE
Nigeria
• Annual growth forecast 2013 – 6.5%
• International Reserves $48 billion
• Population 170 million
• Labour Force 54 million

25
CLEAR PRACTICAL EFFECTIVE
Turkey
• Annual growth forecast – 1%
• International reserves 120 billion
• Population 76 million
• Labour force 27 million

26
CLEAR PRACTICAL EFFECTIVE
Asset Allocation
January 2014

27
CLEAR PRACTICAL EFFECTIVE Richard Miller &
Ellie Clapton
January 2014

28
CLEAR PRACTICAL EFFECTIVE
Standard Life Investments UK
Smaller Companies Fund
Investment
Philosophy
“Aiming to achieve capital growth over the longer term.’’
January 2014

29
CLEAR PRACTICAL EFFECTIVE
January 2014

30
CLEAR PRACTICAL EFFECTIVE

31
CLEAR PRACTICAL EFFECTIVE

32
CLEAR PRACTICAL EFFECTIVE

33
CLEAR PRACTICAL EFFECTIVE

34
CLEAR PRACTICAL EFFECTIVE
Total Return Bid-Bid line chart over 10 years (from 14 Jan 2004 to
14 Jan 2014) from UK IMA universe. Rebased in Pounds Sterling

35
CLEAR PRACTICAL EFFECTIVE
Total Return Bid-Bid performance vs volatility scatter chart over 60
months (from 31 Dec 2008 to 31 Dec 2013) from UK IMA universe.
Rebased in Pounds Sterling

36
CLEAR PRACTICAL EFFECTIVE

37
CLEAR PRACTICAL EFFECTIVE

38
CLEAR PRACTICAL EFFECTIVE
Newton Asian Income
Investment
Philosophy
“The Fund aims to achieve income and capital growth over the long term by investing primarily in companies located in the Asia Pacific region.”
January 2014

39
CLEAR PRACTICAL EFFECTIVE
Investment Process
Screening
Valuation based
research
Quality ranking model
Portfolio construction
Risk management

40
CLEAR PRACTICAL EFFECTIVE
Yield Discipline
• Strategy portfolios as a whole aim is to yield 35% above the
Index.
• Buy discipline: All new holdings must have a prospective
yield greater than the Index – FTSE AW Asia Pacific ex Japan.
• Sell discipline: Any holding where prospective yield falls
below a 15% discount to the Index.

41
CLEAR PRACTICAL EFFECTIVE
Our Concerns
Asian Income fund has slumped to the bottom of performance
tables
What is this underperformance being attributed to?

42
CLEAR PRACTICAL EFFECTIVE
Peer Group Analysis over 1yr

43
CLEAR PRACTICAL EFFECTIVE
Peer Group Analysis over 3yrs

44
CLEAR PRACTICAL EFFECTIVE
Peer Group Analysis over 5yrs

45
CLEAR PRACTICAL EFFECTIVE
What effect has this had on the
portfolio? (risk/reward graph 6 months)

46
CLEAR PRACTICAL EFFECTIVE
What effect has this had on the
portfolio? (risk/reward graph 5yrs)

47
CLEAR PRACTICAL EFFECTIVE
Performance – since inception
(30/11/2005 – 14/01/2014)

48
CLEAR PRACTICAL EFFECTIVE
Top 10 Holdings as at December 2013
Stock Name % Country Sector
1 Sands China 4.41% Hong Kong Travel & Leisure
2 Wesfarmers 3.43% Australia General Retailers
3 Telstra Corp. 3.37% Australia Fixed Line Telecomms
4 HSBC Holdings 3.26% UK Banks
5 Taiwan Semiconductor Manufacturing 3.10% Taiwan Technology Hardware & Equipment
6 Australia & NZ Banking Group 2.97% Australia Banks
7 Philippine Long Distance Telephone Co. 2.71% Philippines Mobile Telecomms
8 Transurban Group 2.71% Australia Industrial Transportation
9 Sydney Airport NPV Dfd 031213 (Ex-Stapled) 2.60% Australia Non-Classifed
10 Woodside Petroleum 2.49% Australia Oil & Gas Producers

49
CLEAR PRACTICAL EFFECTIVE
Fund positioning
Australia
New Zealand
Thailand
Taiwan
Philippines China Malaysia South Korea Indonesia
Hong
Kong
Singapore
UK
Property
Country Allocation

50
CLEAR PRACTICAL EFFECTIVE
The Garden Suite
77 Mount Ephraim
Tunbridge Wells
Kent
TN4 8BS
www.wellian-is.com
Wellian Investment Solutions Limited is authorised and regulated by the Financial Conduct Authority.
Slides are not intended to give personalised advice and you should contact us before taking any action based upon them. You should be aware that where
past performance is quoted it is not a guide to future performance.