Embed Size (px)
Citation preview

Click to edit Master title style
• Click to edit Master text styles
– Second level
• Third level – Fourth level
» Fifth level
6/12/2013 www.ren21.net
Renewables 2013 Global Status Report
Launch 12/06/2013
Click to edit Master title style
• Click to edit Master text styles
– Second level
• Third level – Fourth level
» Fifth level
6/12/2013 www.ren21.net
Industry Associations:
ACORE, ARE, CEC, CREIA, EREC, GWEC, IGA, IHA, WBA, WWEA
Science & Academia:
IIASA, ISES, SANEDI, TERI
NGOs: CURES, GFSE, Greenpeace, ICLEI, ISEP, JREF, WCRE, WRI, WWF
International Organisations:
ADB, EC, GEF, IEA, IRENA, UNDP, UNEP, UNIDO,
World Bank
National Governments: Brazil, Denmark
Germany, India, Norway,
Spain, Uganda, UAE, UK
A Multi-stakeholder Policy Network grouping
About REN21

Click to edit Master title style
• Click to edit Master text styles
– Second level
• Third level – Fourth level
» Fifth level
6/12/2013 www.ren21.net
REN21 Renewables Global Status Report
Launched along with UNEP’s Global trends in RE investment
Team of over 500 contributors, researchers & reviewers worldwide
The report features:
• Global Market Overview
• Industry Trends
• Policy Landscape
• Rural Renewable Energy
All renewable energy technologies
Sectors: power, heating/cooling, transport
New elements in 2013:
• Feature on system transformation www.ren21.net/gsr

Click to edit Master title style
• Click to edit Master text styles
– Second level
• Third level – Fourth level
» Fifth level
6/12/2013 www.ren21.net
Renewable Energy in the World
RE supplied an estimated 19% of global final energy consumption in 2011. UN Secretary General’s goal : doubling the share of renewable energy in the
global energy mix by 2030 (base year 2010).
Source: REN21 Renewables 2013 Global Status Report

Click to edit Master title style
• Click to edit Master text styles
– Second level
• Third level – Fourth level
» Fifth level
6/12/2013 www.ren21.net
Top 5 RE champions
Source: REN21 Renewables 2013 Global Status Report

Click to edit Master title style
• Click to edit Master text styles
– Second level
• Third level – Fourth level
» Fifth level
6/12/2013 www.ren21.net
Global Market Overview – Power Markets
Renewable energy comprises more than 26% of global power generation capacity. 21.7% of global electricity is produced from renewable energy. Renewables accounted for just over half of the estimated 280GW of new installed
electric capacity in 2012.
Source: REN21 Renewables 2013 Global Status Report
Click to edit Master title style
• Click to edit Master text styles
– Second level
• Third level – Fourth level
» Fifth level
6/12/2013 www.ren21.net
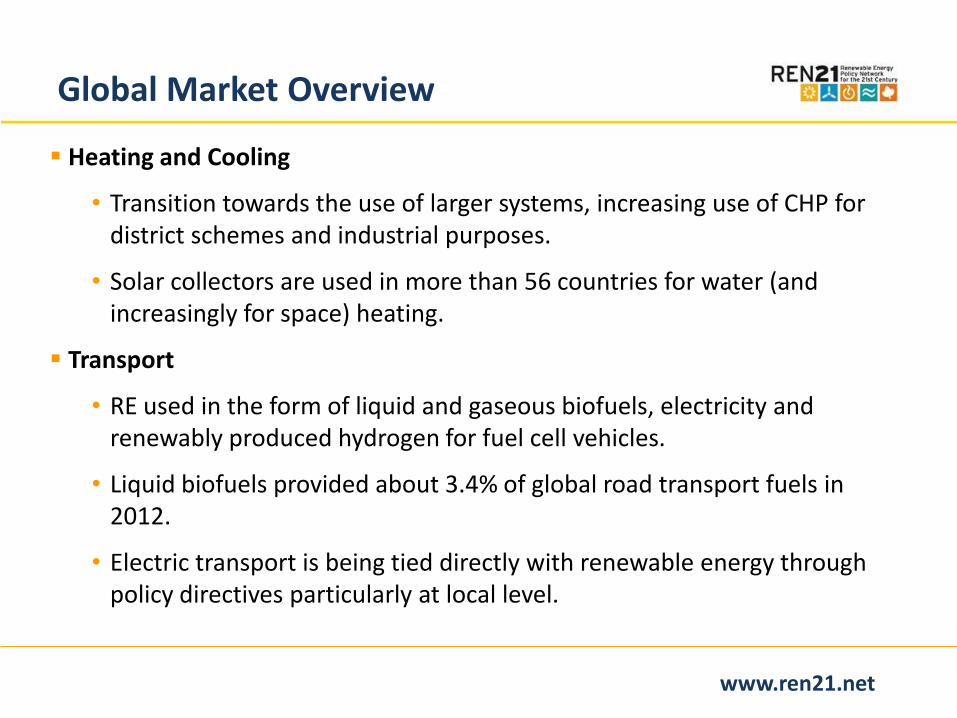
Global Market Overview
Heating and Cooling
• Transition towards the use of larger systems, increasing use of CHP for district schemes and industrial purposes.
• Solar collectors are used in more than 56 countries for water (and increasingly for space) heating.
Transport
• RE used in the form of liquid and gaseous biofuels, electricity and renewably produced hydrogen for fuel cell vehicles.
• Liquid biofuels provided about 3.4% of global road transport fuels in 2012.
• Electric transport is being tied directly with renewable energy through policy directives particularly at local level.

Click to edit Master title style
• Click to edit Master text styles
– Second level
• Third level – Fourth level
» Fifth level
6/12/2013 www.ren21.net
Hydropower
30GW of new hydropower was added in 2012, increasing capacity by nearly 3%, bringing installed capacity to 990GW.
Globally hydropower generated 3,700TWh of electricity in 2012. China alone produced 864 TWh followed by Brazil (441TWh).
Growing prominence of joint-venture business models involving local and international partnerships as the size of the projects increase.
Source: REN21 Renewables 2013 Global Status Report

Click to edit Master title style
• Click to edit Master text styles
– Second level
• Third level – Fourth level
» Fifth level
6/12/2013 www.ren21.net
Solar Photovoltaics (PV)
Total global operating capacity of solar PV reached the 100 GW milestone.
Prices of solar PV modules fell by more than 30 % in 2012.
www.ren21.net
Source: REN21 Renewables 2013 Global Status Report

Click to edit Master title style
• Click to edit Master text styles
– Second level
• Third level – Fourth level
» Fifth level
6/12/2013 www.ren21.net
Wind Power
Almost 45GW of wind power capacity came in operation in 2012, increasing global wind capacity 19% to 283GW.
Annual growth rate of cumulative wind power capacity between 2007-2012 averaged 25%.
Source: REN21 Renewables 2013 Global Status Report

Click to edit Master title style
• Click to edit Master text styles
– Second level
• Third level – Fourth level
» Fifth level
6/12/2013 www.ren21.net
Concentrating Solar Thermal Power (CSP)
Total global CSP capacity increased more than 60% to about 2,550 MW.
Interest in CSP is on the rise, particularly in developing countries, with investment spreading across Africa, the Middle East, Asia, and Latin America.
Source: REN21 Renewables 2013 Global Status Report

Click to edit Master title style
• Click to edit Master text styles
– Second level
• Third level – Fourth level
» Fifth level
6/12/2013 www.ren21.net
Solar Thermal Heating and Cooling
Source: REN21 Renewables 2013 Global Status Report
By the end of 2012, global solar thermal capacity reached an estimated of 255 GWth for glazed water collectors.
China an Europe account for about 90% of world market. Growing trend to use solar resources to generate process heat for industry.

Click to edit Master title style
• Click to edit Master text styles
– Second level
• Third level – Fourth level
» Fifth level
6/12/2013 www.ren21.net
Bioenergy
Use of biomass in the heat, power and transport sectors increased 2–3% to approximately 55 EJ. Bio-power capacity
was up 12% to nearly 83 GW, with notable increases in some BRICS countries. In 2012, around 350
TWh of electricity was generated world wide (bio-power).
Source: REN21 Renewables 2013 Global Status Report

Click to edit Master title style
• Click to edit Master text styles
– Second level
• Third level – Fourth level
» Fifth level
6/12/2013 www.ren21.net
Ethanol and Biodiesel
Source: REN21 Renewables 2013 Global Status Report
Liquid biofuels provided about 3.4% of global road transport fuels, with small but increasing use by the aviation and marine sectors. Global production of fuel ethanol was down about 1.3% by volume from
2011, while biodiesel production increased slightly. New ethanol and biodiesel production facilities opened, although many
ethanol plants operated below capacity.

Click to edit Master title style
• Click to edit Master text styles
– Second level
• Third level – Fourth level
» Fifth level
6/12/2013 www.ren21.net
Geothermal Energy
233 TWh (805PJ) of district heat and electricity was provided by geothermal resources in 2012.
The use of ground-source heat pumps is growing fast and reached an estimated 50 GWth of capacity in 2012.
Geothermal electric generating capacity grew by an estimated 300 MW during 2012, bringing the global total to 11.7 GW and generating at least 72 TWh. Palinpinon Geothermal Production Field. Copyright, Energy Development Corporation.

Click to edit Master title style
• Click to edit Master text styles
– Second level
• Third level – Fourth level
» Fifth level
6/12/2013 www.ren21.net
Industry Trends
RE industry saw continued growth in manufacturing, sales and installation.
Uncertain policy environments and declining policy support affected investment climates in a number of established markets, slowing momentum in Europe, China, and India.
Solar PV and onshore wind power experienced continued price reductions due to economies of scale and technology advances, and a production surplus of modules and turbines.
Trends:
• Industry consolidation.
• Renewable energy is now more affordable in both developed and developing countries.
• Markets, manufacturing, and investment shifted increasingly towards developing countries.

Click to edit Master title style
• Click to edit Master text styles
– Second level
• Third level – Fourth level
» Fifth level
6/12/2013 www.ren21.net
Renewable Energy and Jobs
Worldwide renewable energy employment continues to increase.
An estimated 5.7 million people work in the renewable energy sector.
The bulk of employment remains concentrated in Brazil, China, India, the EU, and the United States.
Data source: IRENA, Renewable Energy and Jobs 2013

Click to edit Master title style
• Click to edit Master text styles
– Second level
• Third level – Fourth level
» Fifth level
6/12/2013 www.ren21.net
Global New Investment in Renewable Energy
Global new investment in renewable power decreased 12% from the previous year’s record (still the second highest ever).
Installed capacity continued to grow due to falling technology costs.
2012 showed a continued shift in the balance of investment activity between developed and developing economies. Data Source: UNEP FS/ BNEF Global Trends in Renewable Energy Investment 2013

Click to edit Master title style
• Click to edit Master text styles
– Second level
• Third level – Fourth level
» Fifth level
6/12/2013 www.ren21.net
Investment Flows
Dramatic shift in the balance of new investment activity between developed and developing economies.
Developing countries reached USD 112 billion, representing 46% of the world total; this was up from 34% in 2011, and continued an unbroken eight-year growth trend.
Developed economies fell 29% to USD 132 billion, the lowest level since 2009.
Data Source: UNEP FS/ BNEF Global Trends in Renewable Energy Investment 2013

Click to edit Master title style
• Click to edit Master text styles
– Second level
• Third level – Fourth level
» Fifth level
6/12/2013 www.ren21.net
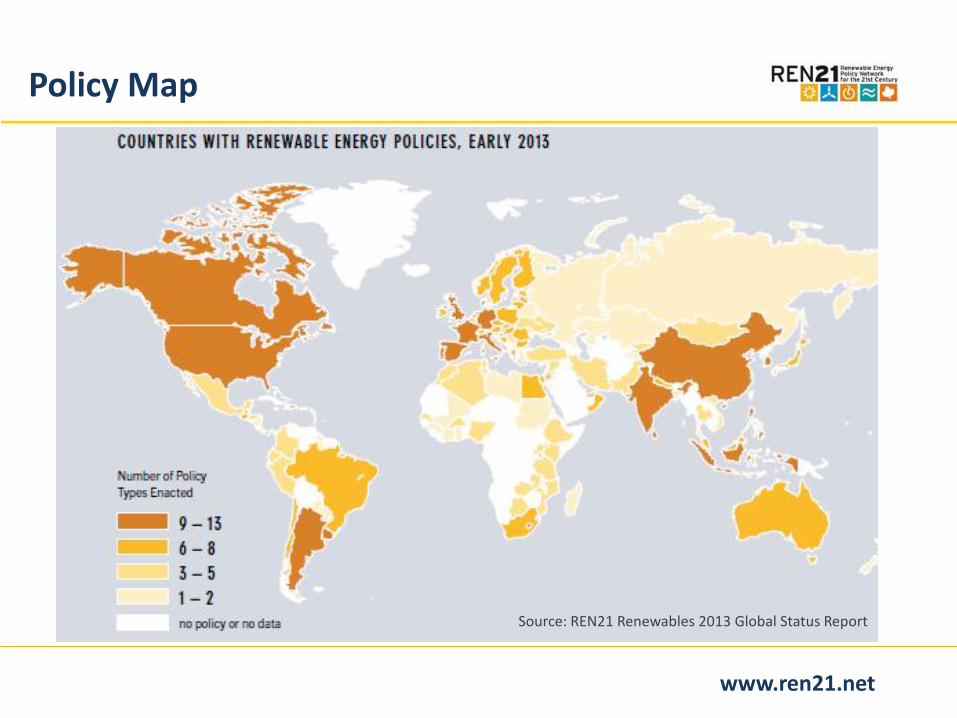
Policy Landscape
At least 138 countries had renewable energy targets by the end of 2012. Most policies to support renewable energy target the power sector, with feed-
in tariffs (FITs) and renewable portfolio standards (RPS) used most frequently. Policymakers are increasingly aware of the potential national development
impacts of renewable energy. GSR provides a comprehensive policy table giving an overview of applied
instruments worldwide on a country-by-country basis.
Click to edit Master title style
• Click to edit Master text styles
– Second level
• Third level – Fourth level
» Fifth level
6/12/2013 www.ren21.net
Policy Map
Source: REN21 Renewables 2013 Global Status Report

Click to edit Master title style
• Click to edit Master text styles
– Second level
• Third level – Fourth level
» Fifth level
6/12/2013 www.ren21.net
Energy Access
Rural use of renewable electricity has increased with greater affordability, improved knowledge about local renewable resources, and more sophisticated technology applications.
Attention to mini-grids has risen in parallel with price reductions in solar, wind, inverter, gasification, and metering technologies.
Trends:
• Increasing private sector involvement.
• Increasing technology innovation and reduce prices.
• Rise of social entrepreneurship.
Business models in rural energy:
• Dealers and fee-per-service.
• Public-Private partnerships.
• Leasing arrangements.

Click to edit Master title style
• Click to edit Master text styles
– Second level
• Third level – Fourth level
» Fifth level
6/12/2013 www.ren21.net
Keep informed: Subscribe to the REN21
Newsletter
www.ren21.net
REN21 Flagship Products & Activities