Embed Size (px)
Citation preview

<click here to insert picture. Set to "Behind text">
Dairy trade’s economic contribution to New Zealand
NZIER report to DCANZ
February 2017

L13 Grant Thornton House, 215 Lambton Quay | PO Box 3479, Wellington 6140 Tel +64 4 472 1880 | [email protected]
© NZ Institute of Economic Research (Inc) 2012. Cover image © Dreamstime.com NZIER’s standard terms of engagement for contract research can be found at www.nzier.org.nz.
While NZIER will use all reasonable endeavours in undertaking contract research and producing reports to ensure the
information is as accurate as practicable, the Institute, its contributors, employees, and Board shall not be liable (whether in
contract, tort (including negligence), equity or on any other basis) for any loss or damage sustained by any person relying on
such work whatever the cause of such loss or damage.
About NZIER
NZIER is a specialist consulting firm that uses applied economic research and analysis to provide a wide range of strategic advice to clients in the public and private sectors, throughout New Zealand and Australia, and further afield.
NZIER is also known for its long-established Quarterly Survey of Business Opinion and Quarterly Predictions.
Our aim is to be the premier centre of applied economic research in New Zealand. We pride ourselves on our reputation for independence and delivering quality analysis in the right form, and at the right time, for our clients. We ensure quality through teamwork on individual projects, critical review at internal seminars, and by peer review at various stages through a project by a senior staff member otherwise not involved in the project.
Each year NZIER devotes resources to undertake and make freely available economic research and thinking aimed at promoting a better understanding of New Zealand’s important economic challenges.
NZIER was established in 1958.
Authorship This paper was prepared at NZIER by John Ballingall and Daniel Pambudi.

NZIER report - Dairy trade’s economic contribution to New Zealand i
Key points This report shows that dairy continues to make a significant contribution to the New Zealand economy.
Dairy contributes $7.8 billion to New Zealand’s GDP…
The dairy sector contributes $7.8 billion (3.5%) to New Zealand’s total GDP.
This comprises dairy farming ($5.96 billion) and dairy processing ($1.88 billion).
…and remains New Zealand’s largest export sector
Despite the recent drop in global dairy prices, dairy remains New Zealand's largest goods export sector, at $13.6 billion in the year to March 2016. Over the past five years, average export revenue has been $14.4 billion.
It accounts for more than one in four goods export dollars coming into New Zealand (29% in 2016, down from a high of 35% in 2014).
Dairy export growth has averaged 7.2% per year over the past 26 years.
The dairy sector exports twice as much as the meat sector, almost four times as much as the wood and wood products sector and nine times as much as the wine sector. It generates almost four times as much export revenue as export education.
Dairy provides jobs and incomes for over 40,000 workers…
The dairy sector employs over 40,000 workers, with 27,500 on farm and a further 13,000 in dairy processing.
Dairy employment has grown more than twice as fast as total employment, at an average of 3.7% per year since 2000.
It has created jobs at a faster rate than the rest of the economy in all but 5 territorial authorities across New Zealand.
The sector paid $2.4 billion in wages to dairy farming and processing workers in 2016.
The dairy farming sector has the second highest average wage ($46,640) in the wider farming sector, behind deer farming ($48,320).
The average dairy processing wage is $72,910, well above all other forms of food product manufacturing. The average food manufacturing wage is $58,200.
…and plays a crucial role in supporting regional economic development
Dairy provides over 1 in 5 jobs in three territorial authority economies (Waimate, Otorohanga, Southland); and over 1 in 10 in a further eight (Matamata-Piako, South Taranaki, Hauraki, Waipa, South Waikato, Clutha and Kaipara).

NZIER report - Dairy trade’s economic contribution to New Zealand ii
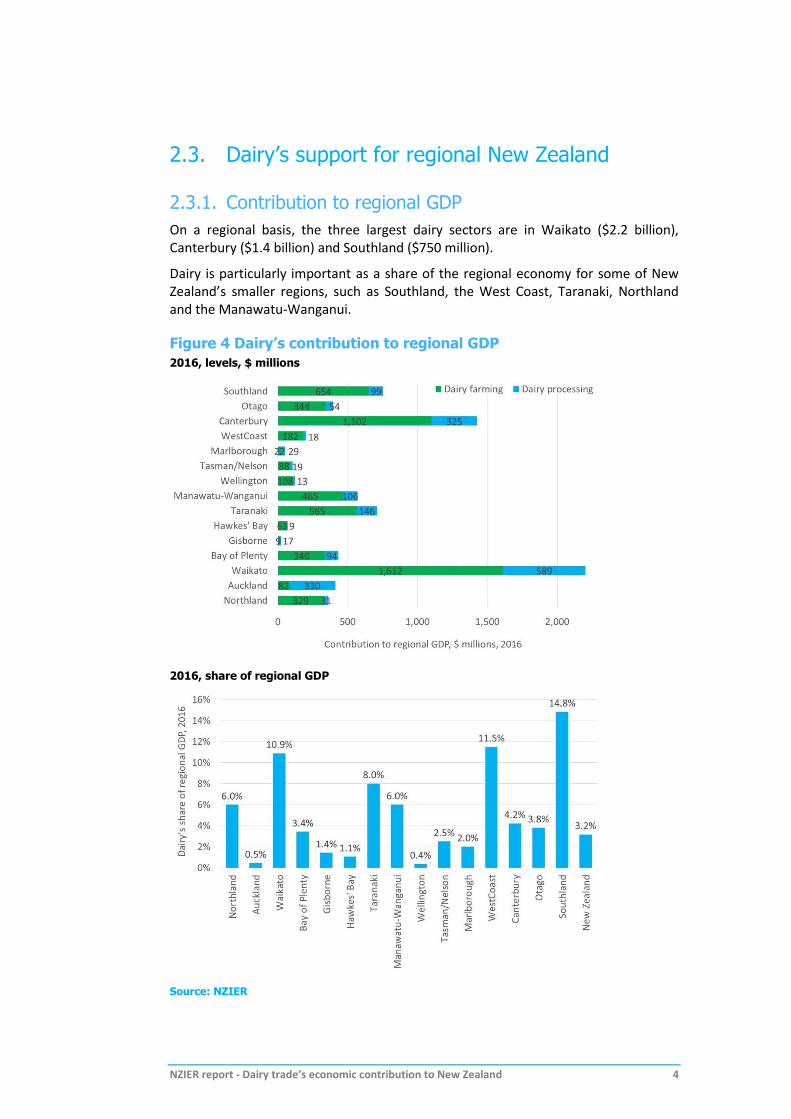
The dairy sector accounts for 14.8% of Southland’s economy, 11.5% of the West Coast economy, 10.9% of the Waikato economy, 8.0% of Taranaki’s economy and 6.0% of Northland’s economy.
Dairy’s impacts flow well beyond the farm gate and processing plant
Dairy farming supports a range of supplying industries: in 2016 farmers spent $711 million on fertilisers and agro chemicals, $393 million on forage crops and bought over $190 million of agricultural equipment.
Farmers also spent $914 million on agricultural services, $432 million on financial services and $197 million on accounting and tax services.
The dairy farming sector provides around $400 million of intermediates to the meat processing sector.
As well as taking farmers’ raw milk, the dairy processing sector also spends significant amounts on packaging ($288 million in 2016), hired equipment ($199 million) and plastics ($174 million).
DairyNZ estimates that farmers have spent over $1 billion in recent years on environmental management systems such as effluent systems, riparian plating and retiring sensitive land, or about $90,000 per dairy farm.
The processing sector has also made substantial capital investments in the past four years, adding over $2 billion to New Zealand’s capital stock.
Figure 1 Dairy processing investment
Source: DCANZ

NZIER report - Dairy trade’s economic contribution to New Zealand iii
Further global or regional trade liberalisation would enhance the sector’s ability to support the government’s ‘Export Double’ target
If all global dairy tariffs were eliminated, and New Zealand’s milk production is held constant, the value of New Zealand’s dairy exports would increase by $1.3 billion, generating a $1.03 billion increase in New Zealand’s nominal GDP.
Preventing a retreat to protectionism has considerable value to the New Zealand economy too
In a separate modelling scenario, if global dairy tariffs increased from their average applied rate to their average bound rate, New Zealand’s dairy exports would fall by $2.3 billion, leading to a $1.66 billion fall in New Zealand’s nominal GDP.
This provides an indication of the value of historical dairy tariff reductions due to multilateral, plurilateral and bilateral trade negotiations, or the benefits of preventing any backsliding towards trade protectionism.
NZIER report - Dairy trade’s economic contribution to New Zealand iv
Contents 1. Objectives and scope ...................................................................................... 1
2. Dairy’s contribution to GDP and jobs ............................................................. 2
2.1. Dairy’s contribution to GDP ..................................................... 2
2.2. Dairy’s contribution to employment ....................................... 2
2.3. Dairy’s support for regional New Zealand ............................... 4
3. Dairy’s contribution to exports .................................................................... 11
4. Dairy’s flow-on impacts ................................................................................ 14
5. Opportunities from elimination of dairy tariffs ............................................ 17
5.1. Global dairy demand outlook ................................................ 17
5.2. New Zealand’s current dairy markets .................................... 18
5.3. Potential gains from further tariff reductions ....................... 26
5.4. The benefits of preventing a slide back to protectionism in dairy ............................................................................................... 27
6. Opportunities from subsidy reform ............................................................. 29
7. Opportunities from reductions in non-tariff barriers................................... 30
8. Conclusion .................................................................................................... 32
Appendices
Appendix A African markets ........................................................................................ 33
Figures
Figure 1 Dairy processing investment ......................................................................................... ii Figure 2 Dairy sector employs over 40,000 people nationwide .................................................. 3 Figure 3 Dairy employment has grown strongly .......................................................................... 3 Figure 4 Dairy’s contribution to regional GDP ............................................................................. 4 Figure 5 Dairy is a crucial employer for many regions ................................................................. 5 Figure 6 Dairy employment has grown rapidly in many regions ................................................. 6 Figure 7 Largest dairy regions for jobs ........................................................................................ 6 Figure 8 Dairy jobs growth has outstripped total jobs growth in most regions across New
Zealand ........................................................................................................................................ 7 Figure 9 Dairy injects $2.4 billion in wages into Kiwi households ............................................... 8 Figure 10 Dairy wages stack up well ............................................................................................ 9 Figure 11 Dairy processing investment: more than $2 bn since 2014....................................... 10 Figure 12 Dairy is our biggest goods export by far .................................................................... 11 Figure 13 Composition of dairy sector exports.......................................................................... 11 Figure 14 Dairy’s contribution to goods exports has trended up .............................................. 12 Figure 15 Dairy exports have grown by 7.2% per year since 1990 ............................................ 13 Figure 16 Dairy farms draw on inputs from a wide range of supporting industries .................. 14
NZIER report - Dairy trade’s economic contribution to New Zealand v
Figure 17 Dairy farmers’ environmental systems investments ................................................. 15 Figure 18 Sustainable Dairying Water Accord year 2 achievements ......................................... 15 Figure 19 Dairy processing uses more than just raw milk ......................................................... 16 Figure 20 Per capita consumption growth of dairy products to 2025 ....................................... 17 Figure 21 Demand for dairy product imports to 2025............................................................... 18 Figure 22 Asia dominates NZ’s dairy exports; but Africa is second... ........................................ 19 Figure 23 The fastest growing 25 markets cover all continents ................................................ 20 Figure 24 Prohibitive tariffs still abound ................................................................................... 21 Figure 25 Dairy import maps show huge gaps in trade flows ................................................... 22 Figure 26 AVEs of NTMs and tariff rates in the APEC region ..................................................... 30 Figure 27 Costs of APEC NTMs on NZ’s primary sector exports ................................................ 31 Figure 28 African dairy tariffs, import levels and growth, by product ...................................... 33

NZIER report - Dairy trade’s economic contribution to New Zealand 1
1. Objectives and scope
We have been asked to provide an overview of the dairy sector’s economic contribution, focusing on:
GDP and exports contribution
Jobs and wages generated
Support for regional development
Opportunities from further trade reforms and export market development.
NZIER report - Dairy trade’s economic contribution to New Zealand 2
2. Dairy’s contribution to GDP and jobs
2.1. Dairy’s contribution to GDP
Based on NZIER’s proprietary database, the dairy sector accounts for $7.8 billion (3.5%) of New Zealand’s total GDP.
This is shared between dairy farming ($5.96 billion) and dairy processing ($1.88 billion).
2.2. Dairy’s contribution to employment
The government is currently placing a high priority on supporting regional economic development. Regional development cuts across all six themes1 of its Business Growth Agenda (BGA), and dairy is an important contributor to supporting ongoing regional growth.
The sector currently employs over 40,000 people, with 27,500 on farm and a further 13,000 in dairy processing (Figure 2).
The dairy sector’s contribution to national employment has steadily increased over time. Figure 2 shows that over the past 15 years, dairy sector employment has grown by an average of 3.7% per year, over twice as fast as the 1.7% recorded for total employment.
Dairy sector employment has also been growing faster than other parts of the land-based economy. Total agricultural sector employment has grown at 0.6% per year since 2000. When we include forestry and fishing, average annual jobs growth lifts to 1.0% per year.
1 Export markets, investment, innovation, skilled and safe workplaces, natural resources, infrastructure.

NZIER report - Dairy trade’s economic contribution to New Zealand 3
Figure 2 Dairy sector employs over 40,000 people nationwide
Number of jobs, November years
Source: NZIER, Statistics New Zealand
Figure 3 Dairy employment has grown strongly
CAGR in jobs filled, 2000-2015
Source: NZIER, Statistics New Zealand
-1.0%
-0.5%
0.0%
0.5%
1.0%
1.5%
2.0%
2.5%
3.0%
3.5%
4.0%
Total Primary sector Agriculture Manufacturing Dairy farming &processing
Ave
rage
gro
wth
rat
e, 2
00
0-20
15
NZIER report - Dairy trade’s economic contribution to New Zealand 4
2.3. Dairy’s support for regional New Zealand
2.3.1. Contribution to regional GDP
On a regional basis, the three largest dairy sectors are in Waikato ($2.2 billion), Canterbury ($1.4 billion) and Southland ($750 million).
Dairy is particularly important as a share of the regional economy for some of New Zealand’s smaller regions, such as Southland, the West Coast, Taranaki, Northland and the Manawatu-Wanganui.
Figure 4 Dairy’s contribution to regional GDP
2016, levels, $ millions
2016, share of regional GDP
Source: NZIER

NZIER report - Dairy trade’s economic contribution to New Zealand 5
2.3.2. Contribution to regional job opportunities
At a more detailed level of regional analysis, the dairy sector is vital to many territorial authority-level economies.
As shown in Figure 5, it provides over 1 in 5 jobs in three territorial authority economies (Waimate, Otorohanga, Southland); and over 1 in 10 in a further eight (Matamata-Piako, South Taranaki, Hauraki, Waipa, South Waikato, Clutha and Kaipara).
Figure 6 shows how dairy sector jobs growth has been very strong in local economies such as Invercargill City (19.2% average annual growth since 2000), Timaru (15.9%), Tauranga City (12.8%), Palmerston North (12.0%) and Southland (11.3%).
Figure 7 shows the top 20 territorial authorities where dairy provides the most jobs.
Figure 5 Dairy is a crucial employer for many regions
Dairy jobs as a proportion of total jobs; top 20 territorial authorities by proportion
Source: NZIER, Statistics New Zealand
22.4%21.5%
20.3%
18.5%
13.9%
11.4% 11.2% 10.6% 10.4% 10.2% 10.0% 9.5% 9.3% 9.2%8.5%
7.2% 7.2% 7.0% 6.8% 6.7%
0%
5%
10%
15%
20%
25%
Wai
mat
e D
istr
ict
Oto
roh
ang
a D
istr
ict
So
uth
lan
d D
istr
ict
Mat
amat
a-P
iako
Dis
tric
t
So
uth
Ta
ran
aki D
istr
ict
Hau
raki
Dis
tric
t
Wai
pa
Dis
tric
t
Ash
bu
rto
n D
istr
ict
So
uth
Wai
kato
Dis
tric
t
Clu
tha
Dis
tric
t
Kai
par
a D
istr
ict
Hu
run
ui D
istr
ict
Tar
aru
a D
istr
ict
Str
atfo
rd D
istr
ict
Wai
kato
Dis
tric
t
So
uth
Wai
rara
pa
Dis
tric
t
Bu
ller
Dis
tric
t
Wes
tlan
d D
istr
ict
Tim
aru
Dis
tric
t
Man
aw
atu
Dis
tric
t
Dai
ry s
ecto
r jo
bs
as %
of
tota
l

NZIER report - Dairy trade’s economic contribution to New Zealand 6
Figure 6 Dairy employment has grown rapidly in many regions
CAGR in jobs in dairy farming and processing, 2000-2015; levels in labels on bars
Source: NZIER, Statistics New Zealand
Figure 7 Largest dairy regions for jobs
Number of dairy jobs; 20 largest dairy territorial authorities
Source: NZIER, Statistics New Zealand
210
1550
110660
3230250
530 1770580 90 430 175
860 300 920110 380
30 1890 610
0%
2%
4%
6%
8%
10%
12%
14%
16%
18%
20%
In
verc
argi
ll C
ity
Tim
aru
Dis
tric
t
Tau
ran
ga C
ity
Pal
me
rsto
n N
ort
h C
ity
So
uth
lan
d D
istr
ict
Gre
y D
istr
ict
Wai
mat
e D
istr
ict
Ash
bu
rto
n D
istr
ict
Wai
taki
Dis
tric
t
Rua
peh
u D
istr
ict
Hu
run
ui D
istr
ict
Has
tin
gs D
istr
ict
Clu
tha
Dis
tric
t
Go
re D
istr
ict
Sel
wyn
Dis
tric
t
Wan
ganu
i Dis
tric
t
Wai
mak
arir
i Dis
tric
t
Wai
roa
Dis
tric
t
Wai
pa
Dis
tric
t
Tau
po
Dis
tric
t
Ave
rage
an
nu
al g
row
th, 2
000
-201
5
Data labels are levels of dairy employment
3230
2620
2140
18901770 1740
15501395
1160
920 860 820 770 760660 630 620 610 590 580
0
500
1000
1500
2000
2500
3000
3500
So
uth
lan
d D
istr
ict
Mat
amat
a-P
iako
Dis
tric
t
Au
ckla
nd
Wai
pa
Dis
tric
t
Ash
bu
rto
n D
istr
ict
So
uth
Ta
ran
aki D
istr
ict
Tim
aru
Dis
tric
t
Wai
kato
Dis
tric
t
Ham
ilto
n C
ity
Se
lwyn
Dis
tric
t
Clu
tha
Dis
tric
t
So
uth
Wai
kato
Dis
tric
t
Ro
toru
a D
istr
ict
Oto
roh
ang
a D
istr
ict
Pal
mer
sto
n N
ort
h C
ity
Hau
raki
Dis
tric
t
Wh
akat
ane
Dis
tric
t
Tau
po
Dis
tric
t
Ne
w P
lym
ou
th D
istr
ict
Wai
taki
Dis
tric
t
Nu
mb
er o
f d
airy
job
s, 2
01
5

NZIER report - Dairy trade’s economic contribution to New Zealand 7
Jobs growth since 2000 has been much stronger in the dairy sector than the economy as a whole in the vast majority of territorial authorities (see Figure 8). Total jobs growth has only been faster than dairy jobs growth in Nelson City, Upper Hutt City, Christchurch City and South Taranaki.2
Figure 8 Dairy jobs growth has outstripped total jobs growth in most regions across New Zealand
CAGR in filled jobs 2000-2015 by territorial authority
Source: NZIER, Statistics New Zealand
2 There is no registered dairy sector employment in five territorial authorities (Chatham Islands Territory, Kawerau, District,
Lower Hutt City, Napier City, Porirua City) and it was not possible to calculate annual average growth for the other four (Queenstown-Lakes District, Central Otago District, Mackenzie District, Wellington City) due to them each having zero dairy employment in 2000. The latter four local economies now employ 198 dairy workers.
-10%
-5%
0%
5%
10%
15%
20%
25%
Ash
bu
rto
n D
istr
ict
Au
ckla
nd
Bul
ler
Dis
tric
t
Car
tert
on
Dis
tric
t
Ce
ntra
l Haw
ke's
Bay
Dis
tric
t
Ce
ntra
l Ota
go D
istr
ict
Ch
ath
am Is
land
s Te
rrit
ory
Ch
rist
chu
rch
Cit
y
Clu
tha
Dis
tric
t
Du
ned
in C
ity
Far
No
rth
Dis
tric
t
Gis
bor
ne
Dis
tric
t
Go
re D
istr
ict
Gre
y D
istr
ict
Ham
ilto
n C
ity
Has
tin
gs D
istr
ict
Hau
raki
Dis
tric
t
Ho
row
hen
ua D
istr
ict
Hu
run
ui D
istr
ict
In
verc
argi
ll C
ity
Kai
kou
ra D
istr
ict
Kai
par
a D
istr
ict
Kap
iti C
oas
t D
istr
ict
Kaw
era
u D
istr
ict
Lo
we
r H
utt
Cit
y
Mac
ken
zie
Dis
tric
t
Man
awat
u D
istr
ict
Mar
lbo
rou
gh D
istr
ict
Mas
tert
on
Dis
tric
t
Mat
amat
a-P
iako
Dis
tric
t
Nap
ier
City
Ne
lso
n C
ity
Ne
w P
lym
outh
Dis
tric
t
Op
otik
i Dis
tric
t
Ave
rage
gro
wth
rat
e in
job
s, 2
00
0-2
01
5
Total jobs Dairy jobs
-5%
0%
5%
10%
15%
20%
Oto
roh
anga
Dis
tric
t
Pal
me
rsto
n N
ort
h C
ity
Po
riru
a C
ity
Qu
een
sto
wn
-Lak
es D
istr
ict
Ran
giti
kei D
istr
ict
Rot
oru
a D
istr
ict
Rua
peh
u D
istr
ict
Sel
wyn
Dis
tric
t
So
uth
Tar
anak
i Dis
tric
t
So
uth
Wai
kato
Dis
tric
t
So
uth
Wai
rara
pa D
istr
ict
So
uth
lan
d D
istr
ict
Str
atfo
rd D
istr
ict
Tar
aru
a D
istr
ict
Tas
man
Dis
tric
t
Tau
po
Dis
tric
t
Tau
ran
ga C
ity
Tha
mes
-Co
rom
and
el D
istr
ict
Tim
aru
Dis
tric
t
Up
per
Hut
t C
ity
Wai
kato
Dis
tric
t
Wai
mak
arir
i Dis
tric
t
Wai
mat
e D
istr
ict
Wai
pa
Dis
tric
t
Wai
roa
Dis
tric
t
Wai
taki
Dis
tric
t
Wai
tom
o D
istr
ict
Wan
ganu
i Dis
tric
t
Wel
lingt
on
Cit
y
Wes
tern
Bay
of
Ple
nty
Dis
tric
t
Wes
tlan
d D
istr
ict
Wh
akat
ane
Dis
tric
t
Wh
anga
rei D
istr
ict
Ave
rage
gro
wth
rat
e in
job
s, 2
00
0-2
01
5
Total jobs Dairy jobs

NZIER report - Dairy trade’s economic contribution to New Zealand 8
2.3.3. Contribution to regional household incomes
The dairy sector delivered $2.4 billion in wages to dairy farmers and processing workers in 2016. The regions receiving the largest wage injections are shown below in Figure 9.
Figure 9 Dairy injects $2.4 billion in wages into Kiwi households
Based on LEED average wages; Business Demographics jobs; top 20 regions by wage bill
Source: NZIER, Statistics New Zealand
Sustainable Dairying: Workplace Action Plan
The New Zealand dairy sector provides a high number of jobs on-farm across New Zealand and is committed to on-farm workplaces being safe, rewarding and productive for all. The Workplace Action Plan launched in 2015 by DairyNZ and Federated Farmers, builds on a foundation of legal compliance and promotes best practice employment on farms. With the aim of making dairying an attractive and rewarding career option, the Workplace Action Plan:
1. Promotes the five pillars of good people management: balanced and productive work time; fair remuneration; wellness, wellbeing health and safety; effective team culture and rewarding
2. Describes what a quality work environment in the dairy industry looks like and sets out coordinated actions and commitments of the industry to;
3. Provides practical advice and support to employers and employees.
The action plan can be found at:
https://www.dairynz.co.nz/about-us/dairy-industry-strategy/sustainable-dairying-workplace-action-plan/

NZIER report - Dairy trade’s economic contribution to New Zealand 9
Dairy farming and dairy processing average wages are high compared to other farming and food processing wages (Figure 10):
The dairy farming sector has the second highest average wage ($46,640) in the wider farming sector, behind deer farming ($48,320).3
The average dairy processing wage is $72,910, well above all other food product manufacturing. The average food manufacturing wage is $58,200.
Figure 10 Dairy wages stack up well
Annual average earnings, year to June 2015
Source: Statistics New Zealand, NZIER
3 Based on Statistics New Zealand’s LEED data, the latest of which is for the year to June 2015.

NZIER report - Dairy trade’s economic contribution to New Zealand 10
2.3.4. Dairy’s contribution to regional investment
The dairy processing sector is continually upgrading its plant to handle greater volumes of milk, produce a wider range of products for domestic use and export and improve efficiency.
As Figure 11 shows, this additional capital investment is substantial – over $2 billion since 2014, with much of it taking place in regional economies and drawing on local labour and intermediate inputs.
Figure 11 Dairy processing investment: more than $2 bn since 2014
Source: DCANZ members

NZIER report - Dairy trade’s economic contribution to New Zealand 11
3. Dairy’s contribution to exports
Despite the price downturn in recent years, the dairy sector remains New Zealand’s largest goods export sector by some margin.4 At $13.6 billion in the year to March 2016, it generates twice as much as the meat sector, almost four times as much as the wood sector and almost nine times as much as the wine sector (Figure 12).
Figure 12 Dairy is our biggest goods export by far
Year to March 2016
Source: NZIER, Statistics New Zealand
Figure 13 Composition of dairy sector exports
$ millions, year to March 2016; % of total dairy sector exports
Source: NZIER, Statistics New Zealand
4 While tourism continues to record very strong growth, international tourists’ expenditure in New Zealand has not yet
overtaken dairy exports, at $10.1 billion for the year ended September 2016.
NZIER report - Dairy trade’s economic contribution to New Zealand 12
As Figure 13 shows, the key products exported by the dairy sector in the year to March 2016 include concentrated milk and cream (skimmed and whole milk powder) ($6.0 billion), butter and spreads ($2.4 billion), cheese and curds ($1.7 billion), casein ($1.1 billion), whey ($625 million) and infant formula ($537 million).
Niche but rapidly-growing dairy export segments include hydrosolates ($58 million), ice cream ($41 million), ethanol (used for alcoholic beverages, $30 million).
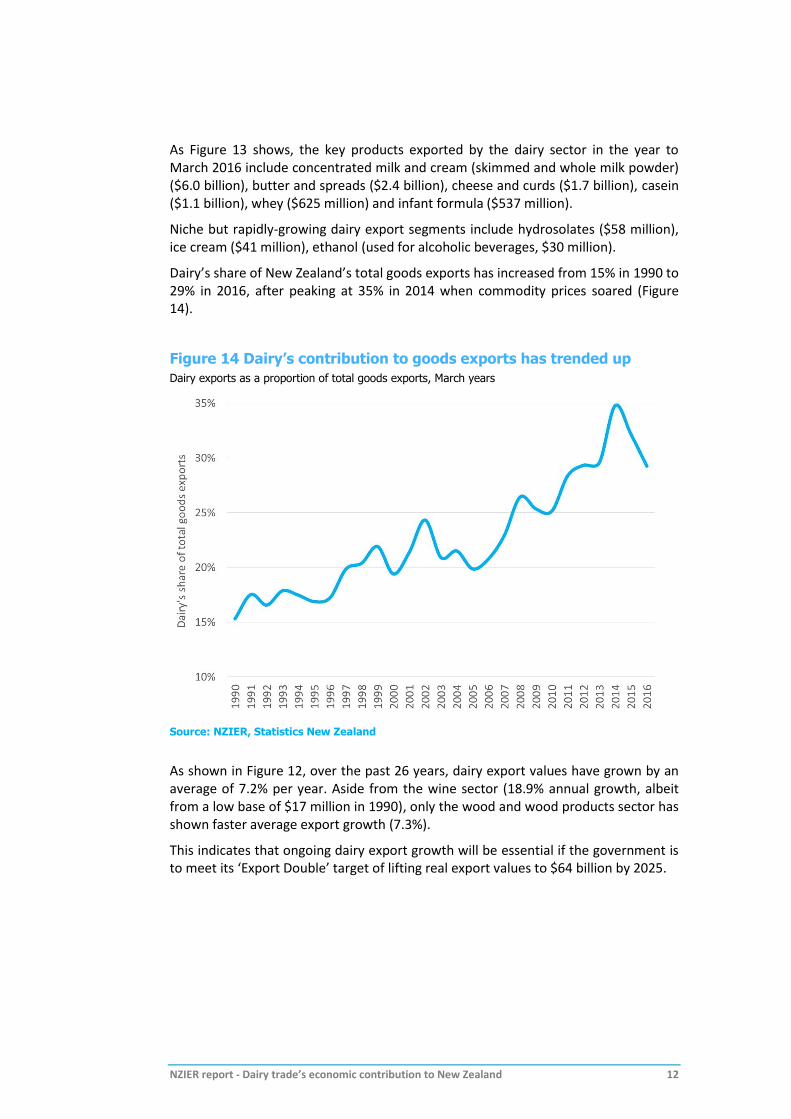
Dairy’s share of New Zealand’s total goods exports has increased from 15% in 1990 to 29% in 2016, after peaking at 35% in 2014 when commodity prices soared (Figure 14).
Figure 14 Dairy’s contribution to goods exports has trended up
Dairy exports as a proportion of total goods exports, March years
Source: NZIER, Statistics New Zealand
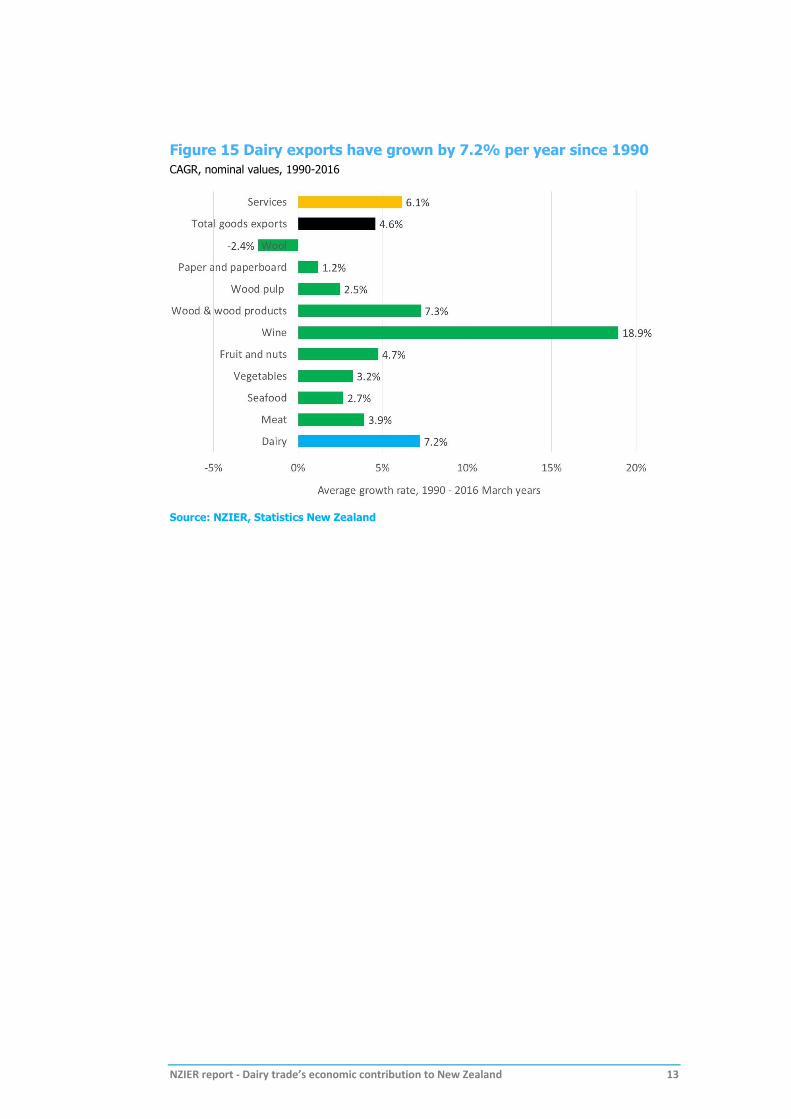
As shown in Figure 12, over the past 26 years, dairy export values have grown by an average of 7.2% per year. Aside from the wine sector (18.9% annual growth, albeit from a low base of $17 million in 1990), only the wood and wood products sector has shown faster average export growth (7.3%).
This indicates that ongoing dairy export growth will be essential if the government is to meet its ‘Export Double’ target of lifting real export values to $64 billion by 2025.
NZIER report - Dairy trade’s economic contribution to New Zealand 13
Figure 15 Dairy exports have grown by 7.2% per year since 1990
CAGR, nominal values, 1990-2016
Source: NZIER, Statistics New Zealand
NZIER report - Dairy trade’s economic contribution to New Zealand 14
4. Dairy’s flow-on impacts
As well as its direct impacts on export growth, employment and income generation, the dairy sector also plays an important role in supporting activity in other parts of the New Zealand economy.
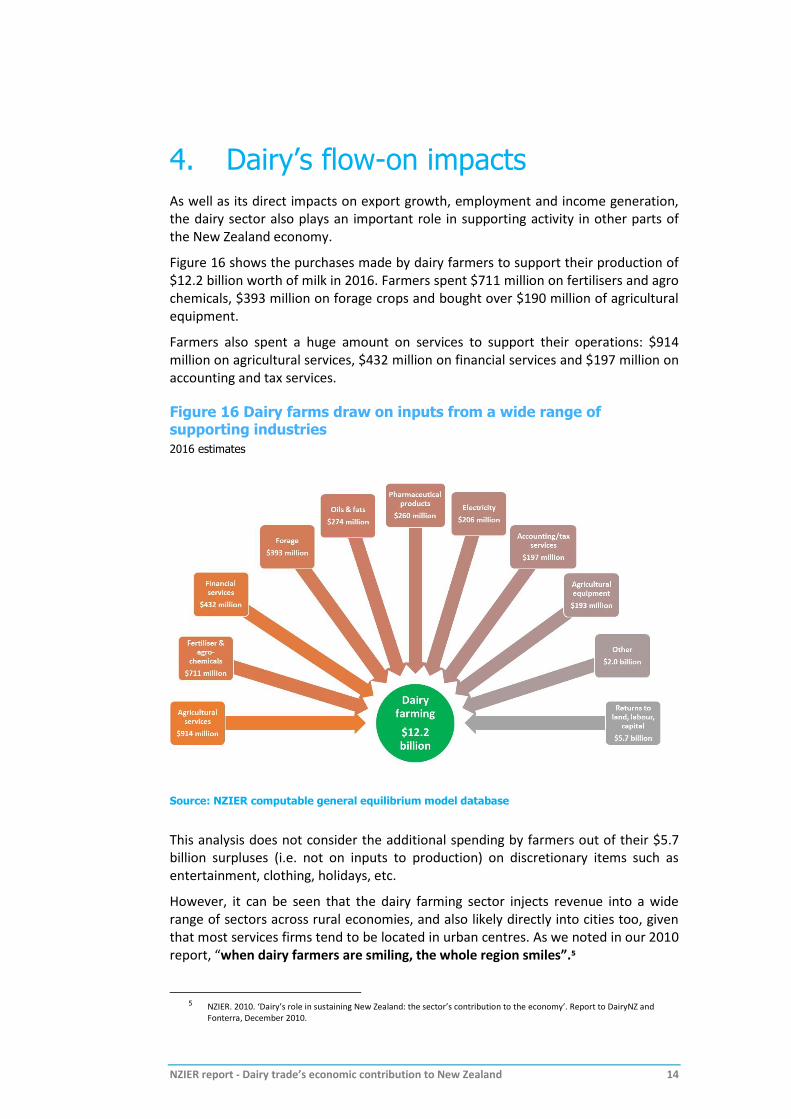
Figure 16 shows the purchases made by dairy farmers to support their production of $12.2 billion worth of milk in 2016. Farmers spent $711 million on fertilisers and agro chemicals, $393 million on forage crops and bought over $190 million of agricultural equipment.
Farmers also spent a huge amount on services to support their operations: $914 million on agricultural services, $432 million on financial services and $197 million on accounting and tax services.
Figure 16 Dairy farms draw on inputs from a wide range of supporting industries
2016 estimates
Source: NZIER computable general equilibrium model database
This analysis does not consider the additional spending by farmers out of their $5.7 billion surpluses (i.e. not on inputs to production) on discretionary items such as entertainment, clothing, holidays, etc.
However, it can be seen that the dairy farming sector injects revenue into a wide range of sectors across rural economies, and also likely directly into cities too, given that most services firms tend to be located in urban centres. As we noted in our 2010 report, “when dairy farmers are smiling, the whole region smiles”.5
5 NZIER. 2010. ‘Dairy’s role in sustaining New Zealand: the sector’s contribution to the economy’. Report to DairyNZ and
Fonterra, December 2010.

NZIER report - Dairy trade’s economic contribution to New Zealand 15
Dairy farmers have also made considerable investments in environmental systems in recent years. DairyNZ6 estimates that farmers spent over $1 billion between 2010 and 2014 on environmental management systems such as effluent systems, riparian plating and retiring sensitive land, or about $90,000 per dairy farm. This investment is ongoing as farmers continue implementing the Sustainable Dairying Water Accord commitments.
Figure 17 Dairy farmers’ environmental systems investments
2010 to 2014
Source: DairyNZ
Figure 18 Sustainable Dairying Water Accord year 2 achievements
Source: Sustainable Dairying Two Year Progress Report7
6 https://www.dairynz.co.nz/news/latest-news/dairy-farmers-focused-on-environmental-responsibilities/
7 https://www.dairynz.co.nz/environment/in-your-region/sustainable-dairying-water-accord/

NZIER report - Dairy trade’s economic contribution to New Zealand 16
Figure 19 shows the inputs used in the dairy processing sector. Clearly milk is the key input, but the processing sector also spends significant amounts on packaging ($288 million), hired equipment ($199 million), plastics ($174 million) and various other products and services.
Figure 19 Dairy processing uses more than just raw milk
2016 estimates
Source: NZIER computable general equilibrium model database

NZIER report - Dairy trade’s economic contribution to New Zealand 17
5. Opportunities from elimination of dairy tariffs
5.1. Global dairy demand outlook
Despite the recent cyclical price downturn, the medium term outlook for global demand for dairy products remains very positive for New Zealand. The OECD/FAO (2016, p. 110)8 expects strong growth in demand from developing countries in particular due to “a continued shift in dietary patterns away from staples and towards animal products… Strong [dairy] consumption growth is expected across several markets in the Middle East and Asia, including Saudi Arabia, Egypt, Iran and Indonesia”.
Nominal dairy prices are expected to rise by between 15% and 45% over the next decade for all key dairy products (namely butter, cheese, WMP, SMP). Real prices are expected to increase, albeit at a much lower rate. And New Zealand exports are expected to become more competitive in global dairy markets as the US dollar and Euro currencies appreciate on the back of strengthening economic growth.
As Figure 20 shows, per capita consumption of dairy exports is expected to grow most rapidly in Asia, as dietary requirements in emerging Asian economies such as China and Indonesia shift towards protein-based products. Solid growth is also expected across Europe, Latin America and the Caribbean and North Africa.
Figure 20 Per capita consumption growth of dairy products to 2025
Compound average growth rates, 2016-2025, in consumption per capita
Source: OECD/FAO, NZIER
8 OECD/FAO. 2016. OECD-FAO Agricultural Outlook 2016-2025. Paris: OECD.

NZIER report - Dairy trade’s economic contribution to New Zealand 18
Some of this additional demand will be met by increased domestic production, especially in developing economies seeking to lift their self-sufficiency, but the vast majority of this domestic expansion will come from China, India and Pakistan. In other regions such as North Africa and Sub-Saharan African in particular, there is limited capacity for more production, so increased demand will be met through increased imports (Figure 21).
Figure 21 Demand for dairy product imports to 2025
Compound average growth rates, 2016-2025, in import volumes
Source: OECD/FAO, NZIER
5.2. New Zealand’s current dairy markets
New Zealand exported dairy products to 160 markets in the year to June 2016, with 72 markets taking more than $10 million. While Asian markets accounted for well over half of these dairy exports, Africa now accounts for 12% and the Gulf Cooperation Countries (GCC) a further 9%.
To provide a sense of the importance of these dairy markets to New Zealand, our dairy exports to Africa and the GCC were around $2.5 billion in the year to June 2016. This is greater than New Zealand’s exports to all markets of fruit and nuts ($2.4 billion), wine ($1.5 billion) or seafood ($1.5 billion).
NZIER report - Dairy trade’s economic contribution to New Zealand 19
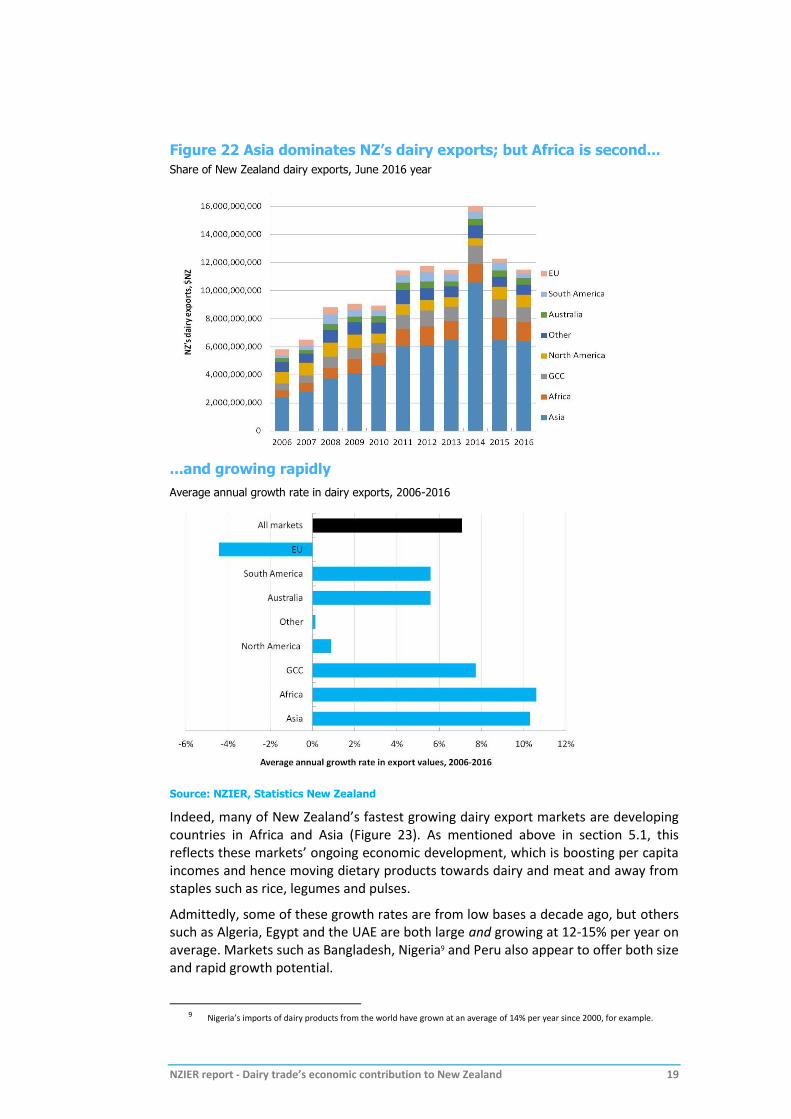
Figure 22 Asia dominates NZ’s dairy exports; but Africa is second...
Share of New Zealand dairy exports, June 2016 year
...and growing rapidly
Average annual growth rate in dairy exports, 2006-2016
Source: NZIER, Statistics New Zealand
Indeed, many of New Zealand’s fastest growing dairy export markets are developing countries in Africa and Asia (Figure 23). As mentioned above in section 5.1, this reflects these markets’ ongoing economic development, which is boosting per capita incomes and hence moving dietary products towards dairy and meat and away from staples such as rice, legumes and pulses.
Admittedly, some of these growth rates are from low bases a decade ago, but others such as Algeria, Egypt and the UAE are both large and growing at 12-15% per year on average. Markets such as Bangladesh, Nigeria9 and Peru also appear to offer both size and rapid growth potential.
9 Nigeria’s imports of dairy products from the world have grown at an average of 14% per year since 2000, for example.

NZIER report - Dairy trade’s economic contribution to New Zealand 20
Figure 23 The fastest growing 25 markets cover all continents
CAGR in New Zealand dairy exports, 2006-2016 for any market over $10 million in 2016
Note: Excludes China, which has a CAGR of 22% over this period and $2.7 billion of exports in 2016.
Source: NZIER, Statistics New Zealand
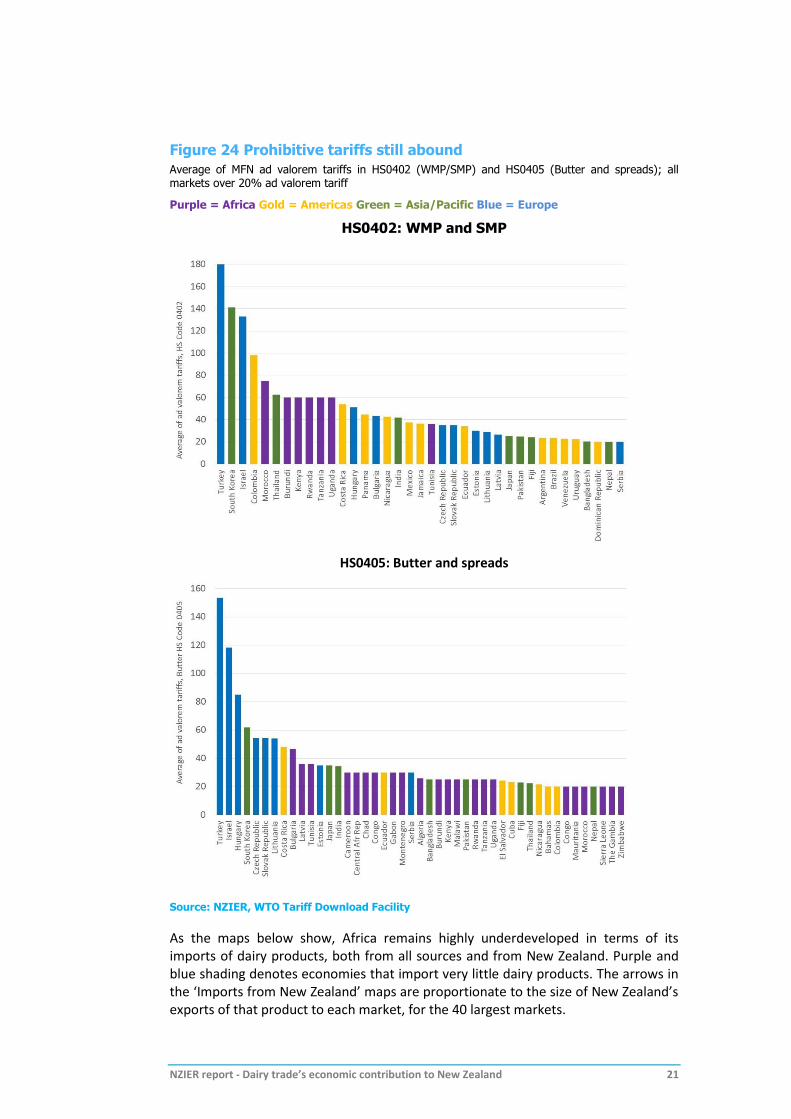
The scale and growth of New Zealand’s exports to these markets is particularly impressive when you consider the extent of tariff barriers in play.
Figure 24 overleaf shows the average MFN tariffs on imports of HS0402 (largely WMP and SMP) and HS0405 (butter and spreads) from all sources, including New Zealand, going into these markets.
There are 37 markets which have MFN tariffs over 20% on HS0402 and 45 with tariffs over 20% on HS0405.
NZIER report - Dairy trade’s economic contribution to New Zealand 21
Figure 24 Prohibitive tariffs still abound
Average of MFN ad valorem tariffs in HS0402 (WMP/SMP) and HS0405 (Butter and spreads); all markets over 20% ad valorem tariff
Purple = Africa Gold = Americas Green = Asia/Pacific Blue = Europe
HS0402: WMP and SMP
HS0405: Butter and spreads
Source: NZIER, WTO Tariff Download Facility
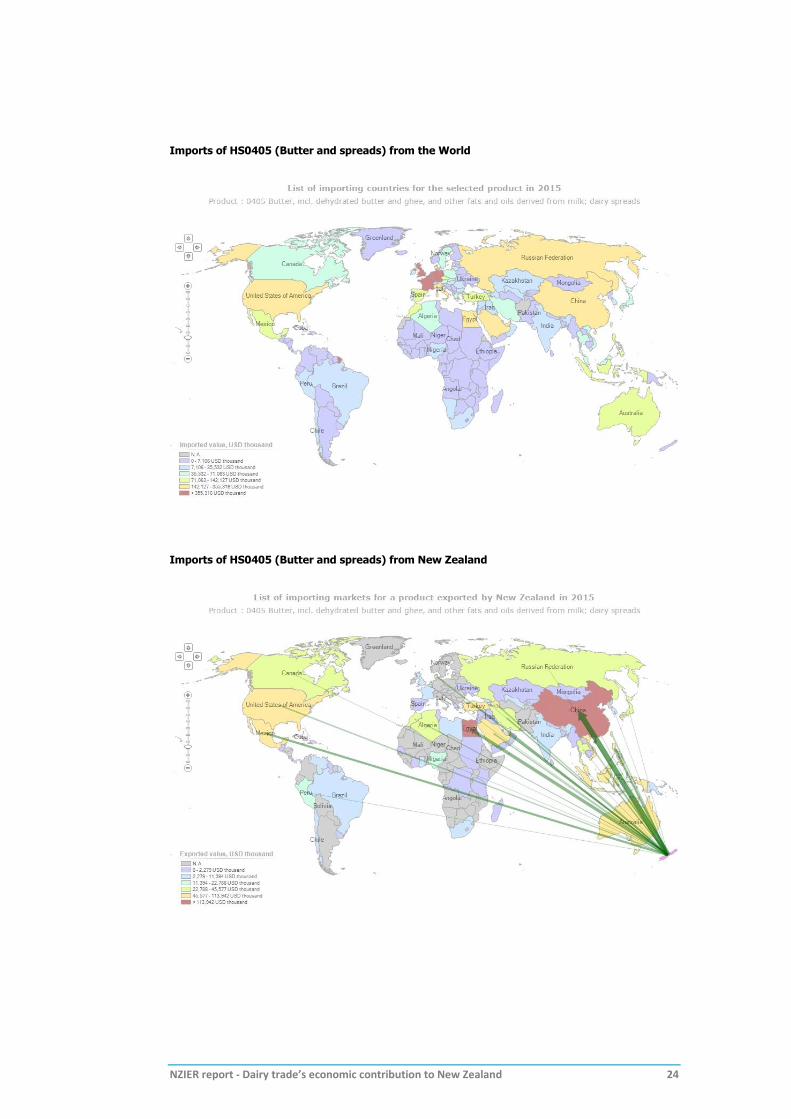
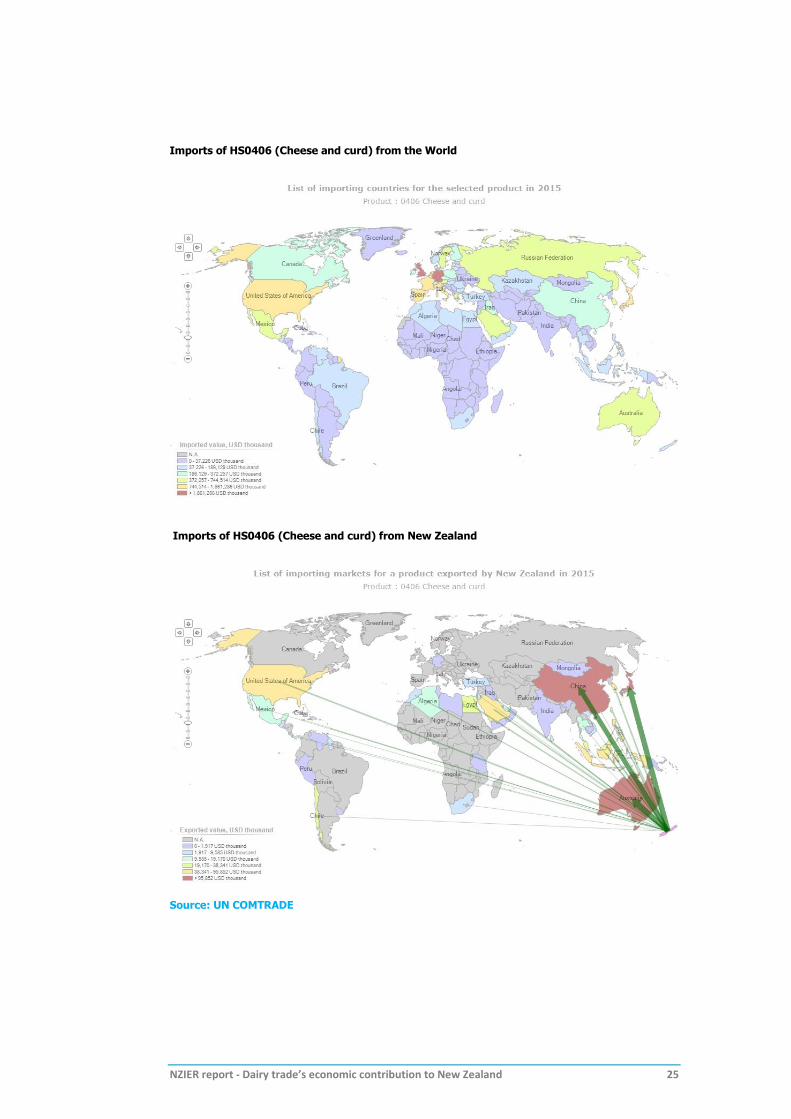
As the maps below show, Africa remains highly underdeveloped in terms of its imports of dairy products, both from all sources and from New Zealand. Purple and blue shading denotes economies that import very little dairy products. The arrows in the ‘Imports from New Zealand’ maps are proportionate to the size of New Zealand’s exports of that product to each market, for the 40 largest markets.

NZIER report - Dairy trade’s economic contribution to New Zealand 22
Figure 25 Dairy import maps show huge gaps in trade flows
Imports of HS0402 (WMP and SMP) from the World
Imports of HS0402 (WMP and SMP) from New Zealand

NZIER report - Dairy trade’s economic contribution to New Zealand 23
Imports of HS0404 (Whey) from the World
Imports of HS0404 (Whey) from New Zealand
NZIER report - Dairy trade’s economic contribution to New Zealand 24
Imports of HS0405 (Butter and spreads) from the World
Imports of HS0405 (Butter and spreads) from New Zealand
NZIER report - Dairy trade’s economic contribution to New Zealand 25
Imports of HS0406 (Cheese and curd) from the World
Imports of HS0406 (Cheese and curd) from New Zealand
Source: UN COMTRADE

NZIER report - Dairy trade’s economic contribution to New Zealand 26
5.3. Potential gains from further tariff reductions
The section above has shown that there are numerous trade expansion opportunities for the New Zealand dairy sector, and that punitive tariffs remain in place in many markets.
To highlight the potential benefits to New Zealand from ongoing tariff liberalisation, we use the GTAP computable general equilibrium (CGE) model of the global economy10 to run a simple hypothetical scenario where we eliminate all dairy tariffs and tariff equivalents of dairy quotas. We then link the GTAP model’s results with our domestic model of the New Zealand economy, ORANI-G-NZ, via changes in export prices and volumes.
We hold milk production constant at baseline levels, fixing it so that it cannot expand in response to trade liberalisation. We do this because there are natural limits as to how much further dairy production can expand in the future.
GTAP is a model of the global economy, comprising 140 regions/countries and 57 sectors. The GTAP version 9 database that the model uses is benchmarked to 2011.
The GTAP model we use is a ‘static’ model. This means we simply compare the world before and after the tariff reductions. We make no judgement about the precise timing of any reductions or the adjustment path of economies and sectors, or about the likelihood of such tariff reductions occurring.
As such, this modelling is best seen as an indicative, long-run, way of answering a “what if…?” type question. It is not a forecast or prediction.
The key results are summarised below.
Table 1 Gains to New Zealand from global dairy tariff removal
Compared to 2015 baseline; assuming dairy production does not change
Measure Change
Nominal GDP $1.04 billion
Nominal exports $533 million
Nominal household consumption $598 million
Change in volume of dairy exports 2.1%
Change in value of dairy exports $1.29 billion
Change in dairy products export price 7.8%
Change in terms of trade 1.85%
Source: NZIER GTAP modelling
The removal of all dairy tariffs would push down the global price of dairy products slightly. This induces additional global demand, and New Zealand benefits accordingly. The volume of dairy exports would lift by 2.1%. The export price for New Zealand’s dairy products increases by 7.8%.
10 For more information on GTAP, see https://www.gtap.agecon.purdue.edu/

NZIER report - Dairy trade’s economic contribution to New Zealand 27
While dairy cattle output (i.e. raw milk) is held fixed, the additional demand for dairy products in overseas markets results in more demand for capital and labour in milk processing, which generates productivity gains – essentially allowing more processing per unit of raw milk.
Because of the increase in dairy export prices and the terms of trade benefits associated with the tariff removal, dairy export values rise by $1.29 billion.
The New Zealand economy benefits considerably under this scenario. Nominal GDP rises by $1.04 billion, and household incomes rise by almost $600 million as the terms of trade increase increases their purchasing power.
Nominal total exports rise by $533 million, with the gain in dairy exports partly offset by decreases in other export sectors as additional resources are directed towards the dairy sector as it expands.
5.4. The benefits of preventing a slide back to
protectionism in dairy
In the current global trading system, the tide of protectionism is rising. Brexit and the initial trade policy proclamations by Donald Trump both point to a challenging environment for further trade liberalisation, at least in the short term. There is an increasing risk that tariffs could be lifted rather than reduced.
In this environment, just maintaining the status quo in terms of agricultural market access is likely to be a good outcome for New Zealand. Even if there is no additional market access for New Zealand exporters through multilateral, plurilateral or bilateral trade agreements in the short term, just resisting a backslide where tariffs start to rise is important.
To get an indication of the value of preventing such a backslide in dairy trade, we use the GTAP and ORANI-G-NZ models to explore what would happen if average global dairy tariffs increased from their current applied rates to their potential bound rates.11 This equates to a 28 percentage point increase in average global dairy tariffs.
In this scenario, we do not hold milk production fixed, as increased dairy protection would lead to a drop in domestic supply (i.e. there is no reason to impose fixed production in this scenario as any natural limits would not bite).
The key results are summarised overleaf in Table 2.
In this scenario, increased tariffs push up the global dairy price by around 0.5%. This makes dairy products relatively less attractive to global consumers. Global demand falls accordingly.
The demand for New Zealand’s dairy exports drops sharply, which pushes export prices down. The result is a 7.4% decrease in dairy export volumes and a 10.2% drop in export prices, leading to an overall drop in dairy export revenue of $2.3 billion. Milk production falls by 4.4%.
11 We used data on bound and applied tariffs from the WTO’s Tariff Database to inform this calculation.
NZIER report - Dairy trade’s economic contribution to New Zealand 28
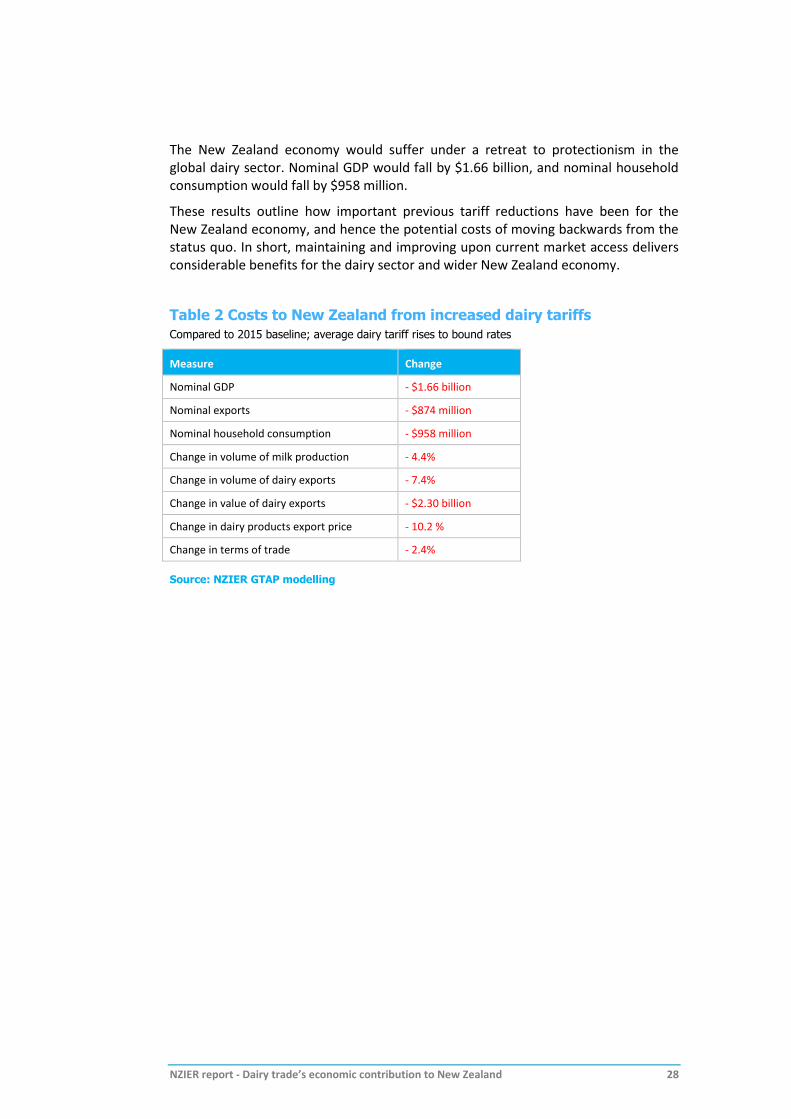
The New Zealand economy would suffer under a retreat to protectionism in the global dairy sector. Nominal GDP would fall by $1.66 billion, and nominal household consumption would fall by $958 million.
These results outline how important previous tariff reductions have been for the New Zealand economy, and hence the potential costs of moving backwards from the status quo. In short, maintaining and improving upon current market access delivers considerable benefits for the dairy sector and wider New Zealand economy.
Table 2 Costs to New Zealand from increased dairy tariffs
Compared to 2015 baseline; average dairy tariff rises to bound rates
Measure Change
Nominal GDP - $1.66 billion
Nominal exports - $874 million
Nominal household consumption - $958 million
Change in volume of milk production - 4.4%
Change in volume of dairy exports - 7.4%
Change in value of dairy exports - $2.30 billion
Change in dairy products export price - 10.2 %
Change in terms of trade - 2.4%
Source: NZIER GTAP modelling

NZIER report - Dairy trade’s economic contribution to New Zealand 29
6. Opportunities from subsidy reform
While the WTO continues to struggle to keep the Doha Development Agenda round alive, the 2015 ‘Nairobi Package’ that included the elimination of agricultural export subsidies is evidence that it’s still relevant and capable – over time – of tackling the big multilateral issues that FTAs simply can’t, in addition to its highly valuable disputes settlement role.
Since subsidies are not generally covered in FTA negotiations, it is easy to forget that global agricultural markets remain heavily distorted by such measures. While commodity price cycles cannot be eliminated altogether, there is little doubt that the muting of dairy price signals at the farm gate due to subsidies, tariffs and non-tariff barriers is exacerbating price fluctuations. Global dairy farmers are slow to respond to market signals such as the recent price drop because they are subsidised to keep producing, when the market needs less supply, not more.
To give a sense of how significant these distortions are in the global agricultural market, Banga (2014)12 explores the impact of cutting green box subsidies by 50% in the EU and 40% in the US. The results show a major restructuring of agricultural production and trade as farmers respond better to price signals and competitive forces:
Developed country production falls by 5%, and imports rise by 22% as developing countries become more competitive
Developing countries see a 12% increase in export volumes and a 17% increase in export revenue.
Banga (2014) also looks at a scenario where green box subsidies are held at 2001 levels in the US and EU. Under this scenario, global agricultural production grows by 3%, export volumes grow by 17% and export revenue is boosted by 25%.
There are few recent studies on dairy-specific liberalisation, but OECD (2004)13 found that if dairy tariffs, quotas, support prices (but not direct payments) and consumer subsidies were eliminated on a multilateral basis, global dairy prices would rise significantly: by 57% for butter, 35% for cheese, 17% for WMP and 22% for SMP.
FAO (2005)14 find similar outcomes when comparing the results from various economic models of full dairy trade liberalisation. They note that world butter prices would rise by 46-60%, cheese prices by 20-35%, and SMP prices by 10-22%, depending on the model used and precise scenario modelled.
The message from these studies is clear: distortions in the global dairy market, and especially subsidies, are keeping global prices lower than they would otherwise be, and preventing global dairy producers from adjusting efficiently to relative price signals.
12 See http://www.oecd-ilibrary.org/docserver/download/5jxswbjhkszx-
en.pdf?expires=1487627379&id=id&accname=guest&checksum=BA1BC0D297E0BCA35584DF237F1B42B2
13 OECD. 2004. ‘An analysis of dairy policy reform and trade liberalisation’. Joint Working Party on Agriculture and Trade. COM/AGR/TD/WP(2004)20/FINAL. Paris: OECD.
14 FAO. 2005. ‘Dairy – measuring the impact of reform’. FAO Trade Policy Technical Notes no. 11.
NZIER report - Dairy trade’s economic contribution to New Zealand 30
7. Opportunities from reductions in non-tariff barriers
The impact of non-tariff barriers on agricultural trade is growing in importance, both domestically and offshore (for example at the Peru APEC Leaders’ meeting in November 2016).
A recent NZIER Working Paper has estimated the potential cost of non-tariff measures on New Zealand’s exports, and on APEC trade more widely.15 While this analysis did not split out the more trade-distorting and inefficient non-trade barriers from the wider set of non-tariff measures (some of which are imposed for legitimate public policy purposes), we made the point that all such measures (NTMs) impose costs on businesses and consumers.
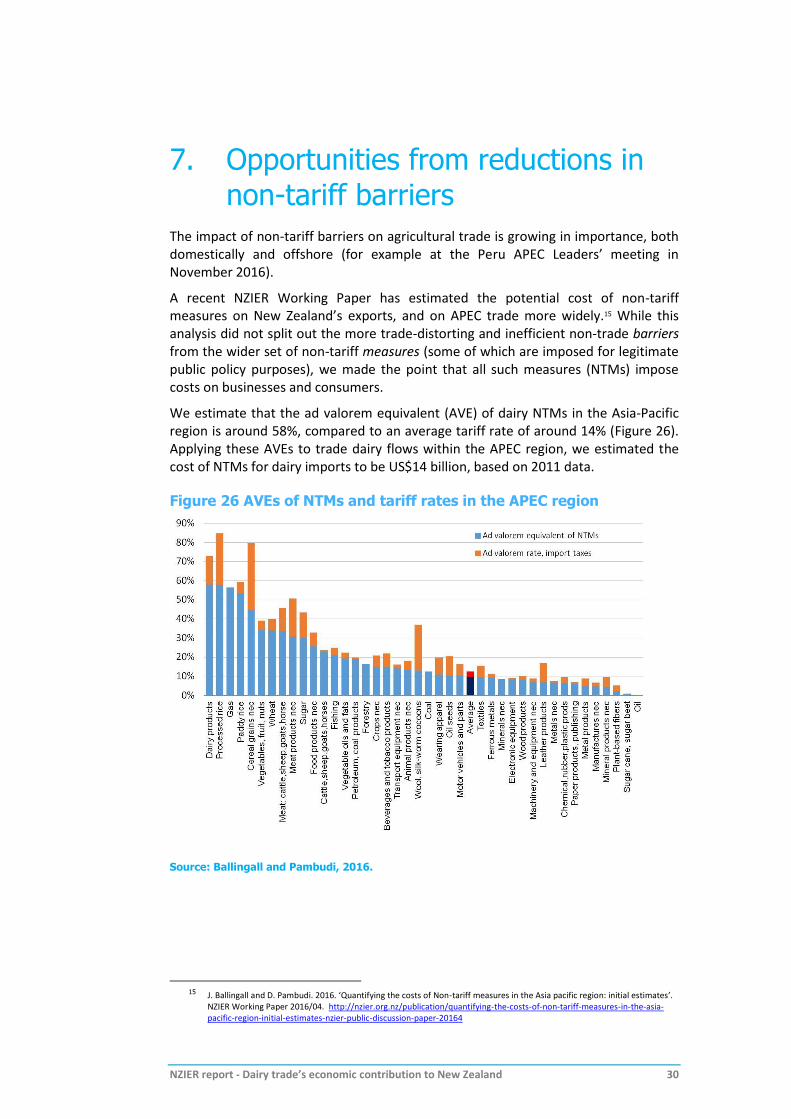
We estimate that the ad valorem equivalent (AVE) of dairy NTMs in the Asia-Pacific region is around 58%, compared to an average tariff rate of around 14% (Figure 26). Applying these AVEs to trade dairy flows within the APEC region, we estimated the cost of NTMs for dairy imports to be US$14 billion, based on 2011 data.
Figure 26 AVEs of NTMs and tariff rates in the APEC region
Source: Ballingall and Pambudi, 2016.
15 J. Ballingall and D. Pambudi. 2016. ‘Quantifying the costs of Non-tariff measures in the Asia pacific region: initial estimates’.
NZIER Working Paper 2016/04. http://nzier.org.nz/publication/quantifying-the-costs-of-non-tariff-measures-in-the-asia-pacific-region-initial-estimates-nzier-public-discussion-paper-20164
NZIER report - Dairy trade’s economic contribution to New Zealand 31
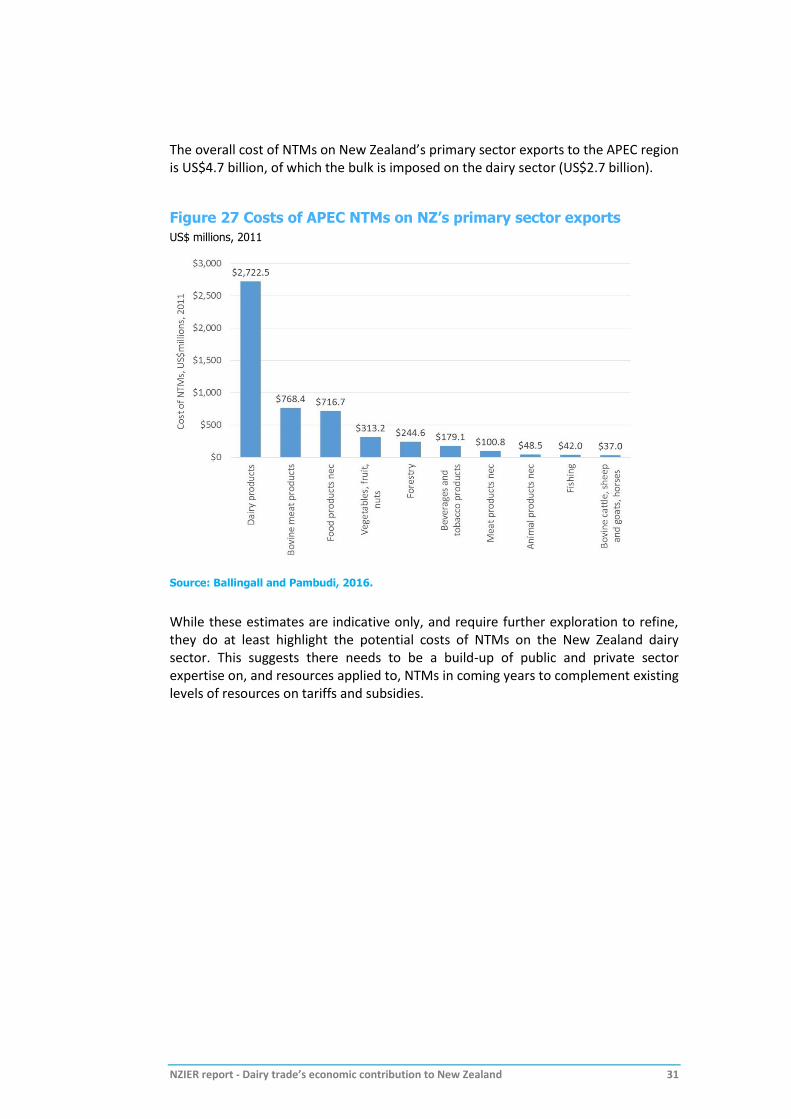
The overall cost of NTMs on New Zealand’s primary sector exports to the APEC region is US$4.7 billion, of which the bulk is imposed on the dairy sector (US$2.7 billion).
Figure 27 Costs of APEC NTMs on NZ’s primary sector exports
US$ millions, 2011
Source: Ballingall and Pambudi, 2016.
While these estimates are indicative only, and require further exploration to refine, they do at least highlight the potential costs of NTMs on the New Zealand dairy sector. This suggests there needs to be a build-up of public and private sector expertise on, and resources applied to, NTMs in coming years to complement existing levels of resources on tariffs and subsidies.

NZIER report - Dairy trade’s economic contribution to New Zealand 32
8. Conclusion Dairy continues to make a significant contribution to the New Zealand economy. It:
Contributes $7.8 billion (3.5%) to New Zealand’s total GDP: comprising dairy farming ($5.96 billion) and dairy processing ($1.88 billion).
Supports rural New Zealand, with the sector accounting for 14.8% of Southland’s economy, 11.5% of the West Coast, 10.9% of the Waikato, 8.0% of Taranaki and 6.0% of Northland.
Remains New Zealand's largest goods export sector, at $13.6 billion in the year to March 2016. Export growth has averaged 7.2% per year over the past 26 years, faster than any primary industry apart from wine and wood and wood products.
Exports twice as much as the meat sector, almost four times as much as the wood and wood products sector and nine times as much as the wine sector.
Accounts for more than one in four goods export dollars coming into New Zealand, despite the recent price downturn.
Employs over 40,000 workers, with dairy employment growing more than twice as fast as total jobs, at an average of 3.7% per year since 2000.
Creates jobs at a faster rate than the rest of the economy in all but 5 territorial authorities across New Zealand.
Provides over 1 in 5 jobs in three territorial authority economies (Waimate, Otorohanga, Southland); and over 1 in 10 in a further eight (Matamata-Piako, South Taranaki, Hauraki, Waipa, South Waikato, Clutha and Kaipara).
Delivered $2.4 billion in wages to farmers and processing workers in 2016.
Supports a range of supplying industries: in 2016 farmers spent $711 million on fertilisers and agro chemicals, $393 million on forage crops and bought over $190 million of agricultural equipment. Farmers also spent $914 million on agricultural services, $432 million on financial services and $197 million on accounting and tax services.
As well as taking farmers’ raw milk, the dairy processing sector also spends significant amounts on packaging ($288 million in 2016), hired equipment ($199 million) and plastics ($174 million).
We have also explored the potential for additional gains to the dairy sector from further trade liberalisation:
If all global dairy tariffs were eliminated, and New Zealand’s milk production is held constant, the value of New Zealand’s dairy exports would increase by $1.3 billion, generating a $1.03 billion increase in New Zealand’s nominal GDP.
In a separate modelling scenario, if global dairy tariffs increased from their average applied rate to their average bound rate, New Zealand’s dairy exports would fall by $2.3 billion, leading to a $1.66 billion fall in New Zealand’s nominal GDP. This provides an indication of the value of historical dairy tariff reductions due to multilateral, plurilateral and bilateral trade negotiations, or the benefits of preventing any backsliding towards trade protectionism.

NZIER report - Dairy trade’s economic contribution to New Zealand 33
Appendix A African markets
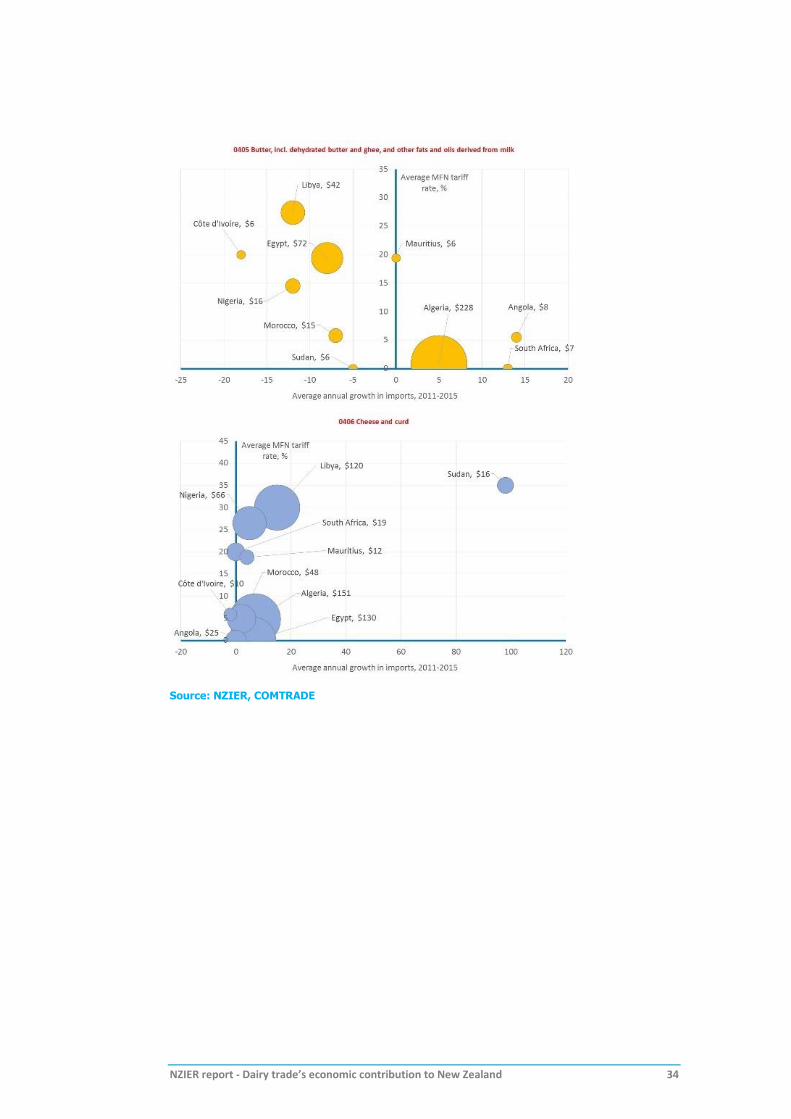
Figure 28 African dairy tariffs, import levels and growth, by product
Average MFN tariff rate (vertical axis); average growth in value of imports from the world 2011-2015 (horizontal axis); value of imports from the world in 2015, US$ millions (size of bubble)
NZIER report - Dairy trade’s economic contribution to New Zealand 34
Source: NZIER, COMTRADE


![Benjamin Silliman: The Gift Planner Behind the First Modern … · 2014-04-24 · Behind the First Modern Charitable Annuity, Part 3, retrieved on [insert date] so fully pledged that](https://img.pdfslide.us/doc/110x75/5e68d4a583a57b298d5d7fa7/benjamin-silliman-the-gift-planner-behind-the-first-modern-2014-04-24-behind.jpg)


![Facilitator: [Insert name] Date: [Insert] Venue: [Insert] Wellcome !](https://img.pdfslide.us/doc/110x75/56649dd05503460f94ac59be/facilitator-insert-name-date-insert-venue-insert-wellcome-.jpg)


![[INSERT SPEAKER’S NAME] [INSERT TITLE] [INSERT DATE]](https://img.pdfslide.us/doc/110x75/56812c68550346895d90fff9/insert-speakers-name-insert-title-insert-date-5685c9ae3d2da.jpg)

![Welcome [] · 2019. 7. 31. · Shipper ID: 00000000 Insert #1 Insert #2 Shipping Method: 2ND DAY Insert #3 Insert #4 CARRIER: UPS Insert #5 Insert #6 Address: Insert #7 Insert #8](https://img.pdfslide.us/doc/110x75/606af0d80d38412add396492/welcome-2019-7-31-shipper-id-00000000-insert-1-insert-2-shipping-method.jpg)