Embed Size (px)
Citation preview

Predicting organic floc transport dynamics in shallow aquatic
ecosystems: Insights from the field, the laboratory, and numerical
modeling
Laurel G. Larsen,1,2 Judson W. Harvey,2 Gregory B. Noe,2 and John P. Crimaldi1
Received 13 June 2008; revised 10 September 2008; accepted 15 October 2008; published 14 January 2009.
[1] Transport of particulate organic material can impact watershed sediment and nutrientbudgets and can alter the geomorphologic evolution of shallow aquatic environments.Prediction of organic aggregate (‘‘floc’’) transport in these environments requiresknowledge of how hydraulics and biota affect the entrainment, settling, and aggregation ofparticles. This study evaluated the aggregation and field transport dynamics of organicfloc from a low-gradient floodplain wetland with flow-parallel ridges and sloughs in theFlorida Everglades. Floc dynamics were evaluated in a rotating annular flume and insitu in the field. Under present managed conditions in the Everglades, floc is not entrainedby mean flows but is suspended via biological production in the water column andbioturbation. Aggregation was a significant process affecting Everglades floc at highflume flow velocities (7.0 cm s�1) and during recovery from high flow; disaggregationwas not significant for the tested flows. During moderate flows when floc dynamics arehydrodynamically controlled, it is possible to model floc transport using a single‘‘operative floc diameter’’ that accurately predicts fluxes downstream and to the bed. Incontrast, during high flows and recovery from high flows, aggregation dynamics should besimulated. When entrained by flow in open-water sloughs, Everglades floc will betransported downstream in multiple deposition and reentrainment events but will undergonet settling when transported onto ridges of emergent vegetation. We hypothesize thatnet transport of material from open to vegetated areas during high flows is criticalfor forming and maintaining distinctive topographic patterning in the Everglades and otherlow-gradient floodplains.
Citation: Larsen, L. G., J. W. Harvey, G. B. Noe, and J. P. Crimaldi (2009), Predicting organic floc transport dynamics in shallow
aquatic ecosystems: Insights from the field, the laboratory, and numerical modeling, Water Resour. Res., 45, W01411,
doi:10.1029/2008WR007221.
1. Introduction
[2] Predicting the transport of particulate matter in flood-plains, wetlands, and slowly flowing streams is oftennecessary in planning wastewater treatment wetlands, res-toration projects, or in determining total maximum dailyloads (TMDLs). However, transport predictions are com-plicated by the tendency of particulate matter to formaggregates, or ‘‘flocs,’’ which may be largely organic.Because of the dynamics of aggregation and disaggregation,and the variable porosity, internal structure, and shape offlocs, floc transport differs substantially from that of theconstituent unflocculated material [Walling and Moorehead,1989; Droppo, 2003; 2004]. Although the transport ofinorganic floc is fairly well understood [Lick et al., 1992;Sterling et al., 2005], highly organic floc (hereafter referredto as simply ‘‘organic floc’’), common in wetlands, has been
less studied. Because of structural differences betweenorganic and inorganic floc (e.g., differences in intraparticleand interparticle cohesion and in the composition andavailability of biologically produced exopolymeric substan-ces, or ‘‘EPS’’), a greater understanding of the dynamics oforganic floc is needed to improve the prediction of itstransport.[3] Wetland and floodplain environments pose particular
challenges for the prediction of floc transport because oftheir hydraulics. In contrast to the turbulent flows present inrivers, estuaries, and on the near-bed continental shelf,wetland flows are typically laminar to transitional [Leonardand Luther, 1995; Christiansen et al., 2000; Harvey et al.,2005]. Thus, while turbulence regulates floc size distribu-tions and aggregation-disaggregation processes in the latterenvironments [Spicer and Pratsinis, 1996; Hill et al., 2001],entrainment/settling fluxes may exert the dominant controlover suspended floc size distributions in low-shear environ-ments. Also, while limited, aggregation by turbulent mixingmay be more significant than disaggregation in wetland andfloodplain environments.[4] This study is the second in a sequence of experiments
designed to improve predictions of organic floc transport inwetlands and shallow, slowly flowing floodplains such as
1Department of Civil, Environmental, and Architectural Engineering,University of Colorado, Boulder, Colorado, USA.
2U.S. Geological Survey, Reston, Virginia, USA.
Copyright 2009 by the American Geophysical Union.0043-1397/09/2008WR007221$09.00
W01411
WATER RESOURCES RESEARCH, VOL. 45, W01411, doi:10.1029/2008WR007221, 2009ClickHere
for
FullArticle
1 of 13

the Florida Everglades. In the first study [Larsen et al.,2009], we performed entrainment and settling experimentson Everglades floc, with the finding that this highly organicfloc was entrained at lower bed shear stresses (1.0 � 10�2
Pa) than less organic floc and settled more slowly. Mor-phodynamic differences between floc from sites within theEverglades with different periphyton abundances weresmall compared to differences between Everglades flocand inorganic floc. In this study we experimentally analyzeaggregation dynamics and apply the findings from thepresent experiment and those of Larsen et al. [2009] tonumerical models of organic floc transport in wetlands andother slowly flowing shallow aquatic environments. On thebasis of these experiments and on a comparison of sus-pended floc characteristics predicted from laboratory andnumerical experiments to those observed in situ, we developa conceptual model of floc transport in the ridge and sloughlandscape of the Everglades. To develop the conceptualmodel and improve predictive numerical modeling of or-ganic floc transport, our experimental and numerical objec-tives were (1) to determine the flow conditions within theexpected range of high flows in the Everglades in whichfloc aggregation and/or disaggregation becomes significant,(2) to evaluate mechanisms of organic floc aggregation-disaggregation and effects on floc size distributions andfractal dimensions on rising and falling limbs of flowpulses, (3) to evaluate the role of flow-driven entrainmentand advection of floc relative to biological productionand entrainment of particles in the present-day managedEverglades, and (4) to numerically determine a singleoperative floc diameter that minimizes error in settlingfluxes and downstream transport fluxes and that can beused in simplified models of organic floc transport insteadof tracking multiple size classes of floc.[5] The specific application of this work is to gain a
greater understanding of how floc transport dynamics in-fluence the evolution of topography and vegetation pattern-ing in the Everglades. The ridge and slough landscape is apatterned peatland that promotes heterogeneity in vegetationcommunities and relatively high biodiversity of fish andwildlife [National Research Council, 2003]. For 2700 years,a landscape patterned by elongated (300–1000 m), elevated(60–90 cm historically, 15–20 cm presently) ridges of peatand deeper, open water sloughs (140–360 m wide) alignedparallel to the direction of flow [National Research Council,2003; Wu et al., 2006] persisted in dynamic equilibriumwith the climate [Willard et al., 2001; Bernhardt et al.,2004]. Ridges sustained dense stands of Cladium jamai-cense (sawgrass), while sloughs were populated by a morediverse vegetation assemblage, dominated by floating matsof Utricularia spp. (bladderwort), floating and epiphyticperiphyton, Nymphaea odorata (water lily), Nymphoidesaquatica (bleeding heart) and emergent Eleocharis spp.(spikerush) [Gunderson and Loftus, 1993; Gunderson,1994; Lodge, 1994]. Relatively well preserved portions ofthe ridge and slough landscape persist, but more than 25%of the landscape has deteriorated over the past century,undergoing topographic flattening and conversion of coex-isting ridge and slough vegetation communities to Cladiummonocultures [Bernhardt et al., 2004; Ogden, 2005]. Onehypothesis of landscape degradation links ridge spreadingand the loss of slough communities to diminished flows,
caused by impoundment and drainage of the Everglades[National Research Council, 2003; Larsen et al., 2007].According to this hypothesis, historic flows were sufficientto entrain floc from sloughs and ridge margins and redepositit within ridge interiors, where it would be incorporated intoridge peat and contribute to the corrugation of the landscape(Figure 1a). However, present-day flows are too low toentrain significant quantities of bed floc [Larsen et al.,2009, Figure 7]. To evaluate whether hindered entrainmentof floc has contributed to landscape degradation, improvednumerical models that better predict sources, sinks, andtransport dynamics of floc are needed.[6] In the Everglades this information is particularly
relevant to implementation of the Comprehensive Ever-glades Restoration Plan [U.S. Army Corps of Engineers,1999]. Part of this plan will remove levees and canals thatimpede flow through Everglades marshes with a goal ofrestoring ridge and slough topography. Establishment of atarget flow velocity that redistributes floc and prediction oflandscape restoration timescales will be possible with animproved knowledge of floc transport dynamics and incor-poration of empirical floc transport results into numericalmodels. In addition, a greater understanding of the inter-actions between organic floc and flow could inform pre-dictions of carbon export from floodplains and othershallow, organic-rich aquatic ecosystems that are experienc-ing changes the in carbon balance or flow.[7] Many of the advances in the prediction of organic floc
transport presented here are based on the results of labora-tory experiments performed on floc collected from the field.Because of structural disruption (i.e., breakup of large flocs,changes in configuration) that occurs in the process of floccollection [Alldredge and Gotschalk, 1988; Eisma et al.,1990; Winterwerp and van Kesteren, 2004] and differencesin the biological and chemical composition of the watercolumn and benthos between the field and the laboratory[Grant and Gust, 1987], results of laboratory experimentsshould be extended to the field with caution. However,through the use of an in situ digital floc camera (DFC) tomonitor floc characteristics without structural disruption inlaboratory flumes and through comparison of floc character-istics in the laboratory to those in the field, we tookmeasures to both minimize and assess structural disruptionto flocs. We therefore view these experiments as a usefulfirst step in predicting the transport of floc under differentEverglades restoration scenarios.
2. Site Description
[8] We experimented on floc from two sites within WaterConservation Area (WCA) -3A, which contains the bestpreserved portion of the ridge and slough landscape. Fieldexperiments were performed at siteWCA-3A-5 (26�03023.700N,80�42019.200W), a long-term research site established by theU.S. Geological Survey for the purpose of investigatingflow and transport dynamics in the Everglades. The site isequipped with observation platforms, three in situ flumesaligned parallel to the flow, and meteorological and hydro-logical monitoring instrumentation. The DFC was deployedfrom one of the platforms at this site in November 2006,when the water depth in the slough was 33.5 cm. At thistime, the floc bed was not well developed because of thepassage of Hurricane Wilma in October 2005, followed by a
2 of 13
W01411 LARSEN ET AL.: PREDICTING ORGANIC FLOC TRANSPORT W01411

complete drydown in May–July 2006, in which the watertable dropped beneath the surface of the peat and the floclayer was incorporated into the peat and/or mineralized.Hurricane Wilma also eliminated the highly productivefloating mats of Utricularia and periphyton, which mightplay a substantial role in floc and suspended particleformation [Noe et al., 2007].[9] Flocculated surface sediment for the aggregation
flume experiment was collected from another site inWCA-3A that was more representative of typical conditionsin the historic Everglades. In contrast to WCA-3A-5, the‘‘Utricularia site,’’ (26�01017.900N, 80�34045.500W), main-
tained surface water during the summer of 2006, and floc,Utricularia, and periphyton were abundant.
3. Methods
3.1. Experiments
3.1.1. Floc Collection for Laboratory FlumeExperiments[10] As described by Larsen et al. [2009], we collected
and concentrated flocculated surface sediment from theEverglades using a modified wet/dry shop vacuum. Thisconcentrated sediment was shipped in carboys on ice to the
Figure 1. Conceptual model of suspended particle dynamics during (a) high-flow events (associatedwith a mean bed shear stress above the floc entrainment threshold) and (b) low-flow events in a crosssection of the Everglades ridge and slough landscape. Note that the dominant flow direction is orthogonalto the page and that the topography is not to scale. Thick arrows denote dominant transport processes;thin arrows denote less important processes. Differential settling and particle-particle collisions are theprocesses most directly associated with aggregation of particulate matter to form floc. Gray text describesprocesses that are beyond the scope of our experimental analysis. Some additional processes affectingsuspended particle concentration and ridge and slough landscape evolution are not shown on the diagram,including the size sorting of settling flocs along the ridge-slough transition, biological consumption ordecomposition of suspended flocs, resuspension of incompletely deposited flocs (section 4.1),entrainment of epiphyton particles attached to vegetation stems, and photodissolution [Mayer et al.,2006]. Figure 1b also depicts present-day dimensions of landscape cross sections [Wu et al., 2006].
W01411 LARSEN ET AL.: PREDICTING ORGANIC FLOC TRANSPORT
3 of 13
W01411
laboratory, refrigerated upon arrival, and used in the aggre-gation flume experiments within 1.5 weeks of collection. Tojudge the likeness between the collected laboratory aggre-gates and floc in the field, we determined the bulk density ofboth floc bed populations in quiescent water by collecting4.8 cm diameter cores containing the flocculated sediment,a small amount of underlying substratum (more compactedpeat), and enough of the overlying surface water to allowthe floc within the cores to settle to a thickness that could bevisually determined through the clear core sleeve. We thendecanted and freeze dried the floc to determine its dry mass.3.1.2. DFC Configuration[11] Floc was imaged in situ in the laboratory flume and
in the field using a silhouette imaging technique with adigital single-lens reflex camera controlled remotely by alaptop computer [Larsen et al., 2009]. In the laboratory, thecamera was placed outside the clear flume wall, facing asynchronized light source in a watertight housing on theinside of the flume. In the field, both the light source and thecamera were deployed in watertight housings. Image reso-lution in both configurations was 14.50 mm per pixel, with a4.13 cm � 6.22 cm field of view and a 2.5 cm depth of field.Since flocs were defined by a minimum of three pixels, theDFC resolved flocs with a minimum size of 43.50 mm.3.1.3. Aggregation-Disaggregation Experiments[12] Aggregation-disaggregation experiments took place
in a rotating annular flume at the Institute of Marine andCoastal Sciences, Rutgers University. The annular flume iswell suited for aggregation experiments because of its smallbed area (which can be completely covered with sediment)and its ability to recirculate floc without pumps (whichcause structural disruption to aggregates). Rotation of theflume lid drives the flow, permitting entrained flocs tocirculate without structural disruption, whereas counterro-tation of the sidewalls and the bed minimizes centrifugaleffects and produces the bed shear stresses that are nearlyuniform across the radius of the flume [Krishnappan, 1991,1993; Petersen and Krishnappan, 1994].[13] Experiments occurred at three different mean veloc-
ities that exceeded the 90th percentile for present-day flowsin the Everglades [Harvey et al., 2008]: 2.5 cm s�1, 4.0 cms�1, and 7.0 cm s�1. For each experiment, the water depthwas 45 cm, and the homogeneous floc bed was allowed tosettle for 24 h prior to experimentation. In all runs, the 3 cmthickness of the floc bed was sufficient to prevent completeerosion. After experimental runs (but with all instrumentsand floc present in the flume), we used a two-componentDantec laser Doppler velocimeter (LDV) to acquire centrallylocated velocity profiles at 20 logarithmically spaced points
(see auxiliary material), each of which was sampled for 17min to ensure convergence of flow statistics [Larsen,2008].1 Abbreviated velocity profiles (8 points) acquiredduring experimental runs confirmed that the completeprofiles were representative of flow during all runs (seeauxiliary material).[14] The DFC was mounted to a profiler outside the
flume that was attached to a planar, Plexiglas observationport. A second profiler mounted inside the flume to the topof the observation port supported the flash. For the durationof each experiment, which consisted of five consecutiveintervals (Table 1), images were acquired at 0.1 Hz. In thefirst three intervals (‘‘increasing velocity intervals’’), theflow velocity was increased at the start of the run and heldconstant for 1 h, exceeding the 25 min required to attain anequilibrium suspended floc size distribution at the fastestflow speed. In the last two intervals (‘‘decreasing velocityintervals’’), the velocity was initially decreased and thenmaintained at a constant level for 1.5 h, since disaggregationtimescales (maximum of 67 min) exceeded aggregationtimescales [Larsen, 2008]. Since it was necessary to stopthe flume and raise the lid to change the vertical position ofthe flash housing, three experiments (each consisting of theaforementioned 5 intervals) were conducted to image floc atthree levels: 11.7 cm, 16.2 cm, and 26.7 cm above the bed.Between runs, the floc bed settled for 24 h.3.1.4. Field Observations[15] We observed flow velocities and suspended floc size
distributions in situ at the WCA-3A-5 field site during ashort-term diel experiment on 28–29 November 2006,between 1530 and 1000 local time. The purpose was tocompare suspended floc characteristics under the controlledhydraulic conditions of the laboratory to actual floc dynam-ics in the measured hydraulics of the field and to evaluatewhether physical forcing by mean flow or other processes(e.g., thermal overturn, biological processes) exerts thedominant control over suspended sediment dynamics inthe Everglades.[16] Both the DFC and the flash were deployed from an
aluminum profiler supported above the water by the side-walls of an open flume within the ridge-slough transitionzone. For most of the monitoring period, the center of theimages was 10 cm above the peat bed, and an image wasacquired every 10 min (to conserve equipment battery life).Mounted to a profiler attached to the flume 3 m upstream, aSon Tek Acoustic Doppler Velocimeter monitored theambient flow velocity. Velocity statistics were obtained
Table 1. Summary of Flume Experiment Settings and Mean Floc Concentrations
Depth-AveragedVelocity (cm s�1)
Mean Steady State Floc Concentration
Lower Point Middle Point Upper Point
MassConcentration(mg L�1)
VolumeConcentration(mL L�1)
MassConcentration(mg L�1)
VolumeConcentration(mL L�1)
MassConcentration(mg L�1)
VolumeConcentration(mL L�1)
2.5 0.048 1.5 0.045 3.3 0.031 0.504.0 0.23 7.2 0.033 0.81 0.096 3.37.0 20 760 13 500 12 4004.0 2.9 77 1.8 46 1.9 432.5 0.31 6.5 0.18 3.4 0.22 3.7
1Auxiliary materials are available in the HTML. doi:10.1029/2008WR007221.
4 of 13
W01411 LARSEN ET AL.: PREDICTING ORGANIC FLOC TRANSPORT W01411

19 cm above the floc bed. Using a thermistor array, wemonitored the vertical stratification in surface water tem-perature throughout the night. When we observed the initi-ation of thermal overturn, a nightly occurring convectiveprocess hypothesized to cause floc entrainment [Schaffranekand Jenter, 2001], we conducted a six-point vertical profileof suspended floc concentrations and water velocity. Afterslowly raising the instruments to each new profile point, wewaited 2 min before resuming data collection to allowdisturbed flocs to settle. Flocs generally settling at speedsof between 0.4 and 1 mm s�1 [Larsen et al., 2009] wouldclear the 4.1 cm–high field of view within this lag time. Ateach point, images were acquired for 2 min at 1/6 Hz.
3.2. Analysis
3.2.1. General Image Processing[17] Projected flocs were delineated from image back-
grounds by binarization, which first involved subtraction ofa dark current image and a background image from eachraw gray-scale image. In the laboratory, the backgroundimage was averaged from 10 images acquired in quiescentwater with no suspended floc. In the field it was not possibleto acquire a controlled background image, so a dynamicbackground that was computed by averaging up to 15images before and after each image in the sequence wassubtracted from the gray-scale image. The semiprocessedimages were then binarized by thresholding [Larsen et al.,2009]. Postbinarization, each image was checked by anoperator to ensure that lighting conditions had a consistenteffect on thresholding, and masks were created to removebubbles, large nekton (from the field images), and particlesthat adhered to the imaging equipment. Finally, aggregateequivalent diameter (computed as the diameter of a circlewith area equivalent to the area of the digitized floc),perimeter (p), area (A), assumed spherical volume (comput-ed from equivalent diameter), and fractal dimension (D)were computed from the binarized images. Assumed spher-ical volumes were converted to floc concentration bydividing by a control volume delineated by the imaginghardware and the known camera field of view. In the fieldthe thickness of the control volume was bounded by thevertical faces of the flash and camera housings, whereas inthe laboratory flume, the face of the flash housing and theflume wall provided the vertical bounds. Finally, a fractaldimension for projected flocs [de Boer, 1997; Stone andKrishnappan, 2003] was defined by
p � AD=2: ð1Þ
3.2.2. Aggregation-Disaggregation Experiments[18] An aggregation parameter (a, L mL�1) was deter-
mined through a transient, one-dimensional, reactive trans-port model describing mass transfer in the annular flumeexperiment. Using the aggregation model of Winterwerpand van Kesteren [2004] to formulate a reaction term thatdescribes the effects of aggregation (third term on the right-hand side below), we derived the relevant transport equationas follows, assuming uniform flow:
@Ci
@t¼ K
@2Ci
@z2þ ws
@Ci
@zþ aa2C2
i G; ð2Þ
where Ci is the volumetric floc concentration in size class i(mL L�1), K is turbulent eddy diffusivity (cm2 s�1), z is the
vertical coordinate (cm), ws is the floc settling velocity insize class i (cm s�1), a is a constant of proportionality thatconverts the concentration within the size class to the totalfloc concentration, and G is the shear rate parameter (s�1).Ci and a were determined from the annular flume DFCimages, while ws was determined from the companionexperiments of Larsen et al. [2009]. Vertical profiles of Kwere computed from LDV data as described by Larsen et al.[2009]. G, a measure of turbulent shear at the smallestlength scales of the flow, was calculated from the equationG =
ffiffiffiffiffiffiffiffie=n
p[Winterwerp and van Kesteren, 2004], where n
is the kinematic viscosity and e is the turbulent kineticenergy dissipation rate. We approximated e using therelation given by Nezu and Nakagawa [1993]
e u3*ð1� z=hÞkhðz=hÞ ð3Þ
where h is water depth and k is the von Karman constant(0.41). Shear velocity, u*, was estimated as 0.05h�ui.[19] The third term on the right-hand side of equation (2)
is a reaction term that describes aggregation. If a isnegative, floc is lost from size class i via aggregation toform larger flocs. In contrast, positive values of a occurwhen concentrations of floc in size class i are augmented byaggregation of particles from a different size class. Whenaggregation occurs, a for smaller size classes is negative,while a for larger size classes is positive. Typically, floccu-lation models also include a term for disaggregation,d1aCiG
d2, where d1 and d2 are both constants [Winterwerpand van Kesteren, 2004]. However, when we attempted toinclude a disaggregation term in our model, we could notresolve unique values of the fitting parameters because of anunderconstrained system. Since results (section 4.1) indi-cated a clear dominance of aggregation processes overdisaggregation processes, we retained only aa2Ci
2G, whichserved as a net aggregation term.[20] Boundary conditions for equation (2) are zero flux at
the water surface and a flux of (Je � wsCi,zmin) at the bed,where Je is entrainment flux (g cm�2 s�1), assumed constantwithin each size class and each run, and Ci,zmin is the flocconcentration in the bottom cell of the model domain. Sincethe configuration of the flume prevented measurement offlow statistics within 3 cm of the bed, Je was treated as afitting parameter in the model and numerically optimizedfrom the transport model and the time series of observedsuspended floc concentrations.[21] We used equation (2) to solve for Je and a in each of
the five intervals of the aggregation-disaggregation experi-ments (Table 1). Predicted concentrations at each DFCimage acquisition time were spatially averaged over therange of z coordinates imaged by the DFC at the upper,middle, and lower locations and compared to imagedconcentrations. Using a Levenberg-Marquardt algorithm,Je was fit for each size class at each flume speed tominimize the total error between predicted and observedfloc concentrations over all three image locations and allsampling times. We then used the fitted Je to initialize asecond Levenberg-Marquardt procedure in which both Jeand a were adjusted. Since a was fit for each size classindependently, this procedure did not ensure conservation ofmass across all size classes.
W01411 LARSEN ET AL.: PREDICTING ORGANIC FLOC TRANSPORT
5 of 13
W01411
[22] Finally, to assess the relative importance of flocaggregation processes, we defined an instantaneous Dam-koehler number (Da) as the ratio of the settling timescale tothe aggregation timescale [Sterling et al., 2005], equivalentto the ratio of the rate of change in Ci due to aggregation tothe rate of change in Ci due to settling:
Da ¼ aa2C2i G
ws@Ci=@z: ð4Þ
We preserved signs so that a negative Da occurred when theeffect of aggregation countered the net effect of settling. Apositive Da occurred for small size classes when aggrega-tion converted small flocs to large flocs, removing themfrom the small size classes.
4. Results and Discussion
4.1. Aggregation Processes Affecting Organic Floc
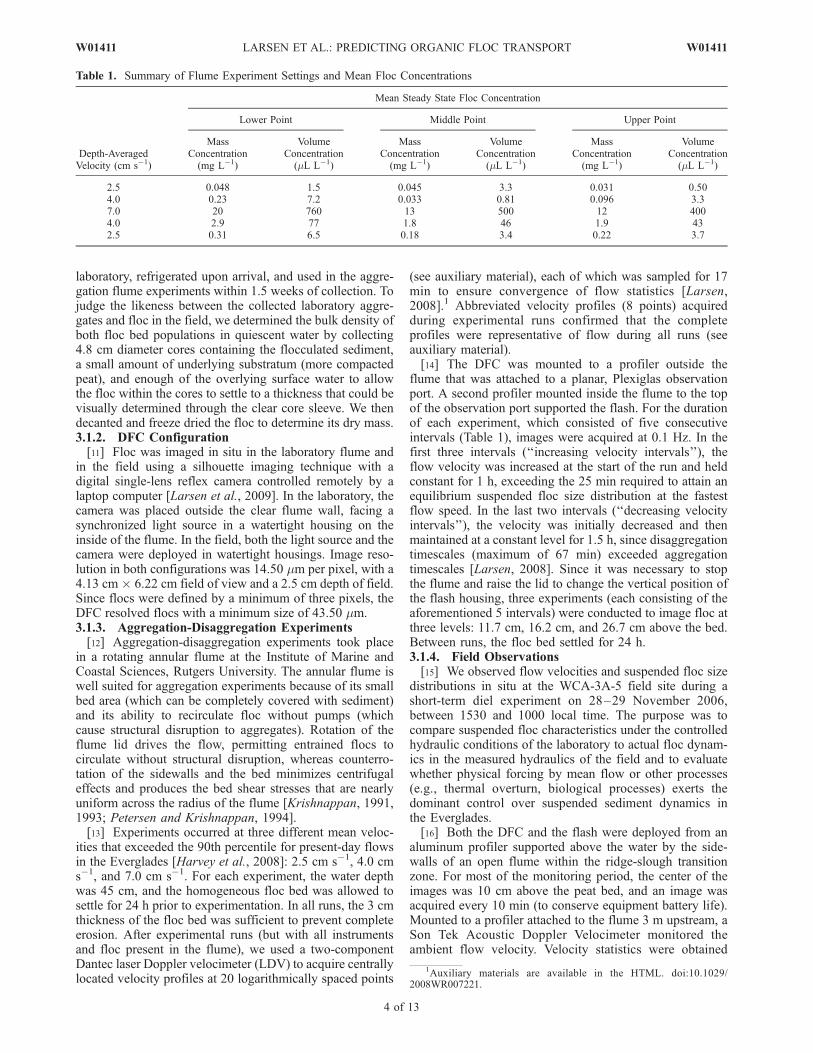
[23] The shape of the curve describing suspended flocconcentration over time in the annular flume experiments(Figure 2) is informative of floc aggregation dynamics.Following an increase in velocity (Figures 2a and 2b), flocconcentrations rise steeply as a result of enhanced entrain-ment. Later (within 8–17 min in our experiments), sus-pended floc concentrations stabilize at a steady value thatreflects a balance between entrainment, settling, and netaggregation. When aggregation dominates over disaggrega-tion, floc is removed from smaller size classes (decreasingthe steady state concentration of these size classes) andadded to larger size classes (increasing their steady stateconcentration).[24] Since both the entrainment flux and aggregation
parameter for each size class in the annular flume areunknown a priori, multiple combinations of entrainmentand aggregation can produce the observed steady stateconcentration. However, unique values of the aggregationparameter a and the size class-specific entrainment flux Jecan be optimized from equation (2) because the aggregationflux, aa2Ci
2G, is proportional to the square of floc concen-tration. For increasing velocity intervals, aggregation isrelatively unimportant on the rising limb of the curve,before concentrations are high. The rising limb is thereforedominated by Je. Its shape enables Je to be determineduniquely, and a can then be solved from the steady state partof the curve. In contrast, for decreasing velocity intervals(Figures 2c and 2d), the low-concentration, steady stateportion of the transient curve is dominated by Je, whileaggregation is only important on the falling limb of thecurve. For these intervals, the shape of the falling limb isimportant in optimization of a, though the statistical confi-dence in the optimized value is less than that for theincreasing velocity intervals because of the relatively shortperiod of time occupied by the falling limb and thedecreasing importance of aggregation along this portion ofthe curve.[25] Results of parameter optimization for the transport
model (equation (2)) showed that aggregation was signifi-cant (95% confidence intervals surrounding a did notintercept zero) only for size classes 0–1750 mm of the7 cm s�1 increasing velocity interval and for size classes 0–1500 mm of the 4 cm s�1 decreasing velocity interval(Table 2). Only within the 0–250 mm size class was anegative, indicating that these flocs aggregate to form largerflocs. For these experimental runs, our transport model withan a of zero could not reproduce the shape of the sensitiverising and falling limb portions of the transient concentrationcurves (Figure 2), though for the remaining runs (2.5 cm s�1
increasing and decreasing, 4 cm s�1 increasing), a reasonablefit was obtained in the absence of an aggregation parameter.Because of aggregation and an increase in Je during thedecreasing velocity intervals (Table 3), equilibrium floc sizes
Figure 2. Sample floc transport model results (solid lines)compared with experimental data (points) for annular flumeruns. Gray lines are simulation results using the optimizedaggregation parameter, and black lines were generated usingan aggregation parameter of zero. The blue, yellow, and redpoints represent data for the lower (11.7 cm above bed),middle (16.2 cm above bed), and upper (26.7 cm above bed)imaging locations, respectively. Shown are (a) 0–250 mmsize class, 7 cm s�1 flume interval; (b) 500–750 mm sizeclass, 7 cm s�1 flume interval; (c) 0–250 mm size class,4 cm s�1 decreasing velocity flume interval; and (d) 500–750 mm size class, 4 cm s�1 decreasing velocity flumeinterval.
6 of 13
W01411 LARSEN ET AL.: PREDICTING ORGANIC FLOC TRANSPORT W01411
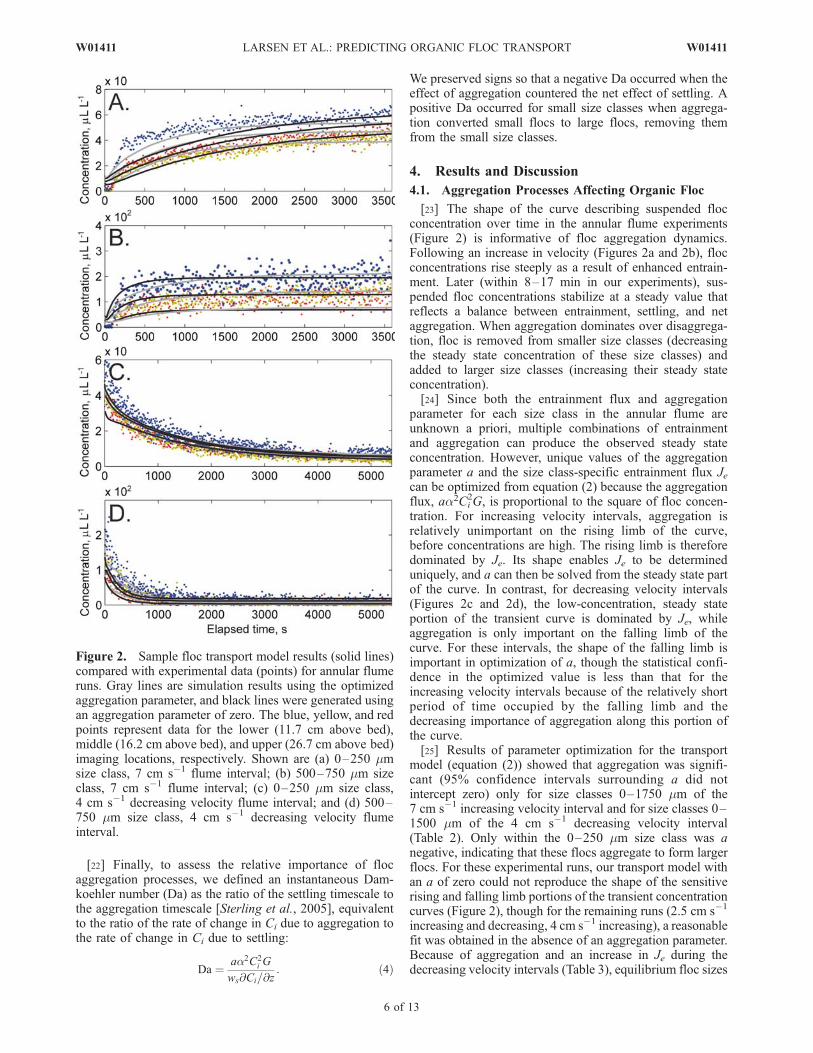
were larger in the decreasing velocity intervals than in thecorresponding increasing velocity intervals (Figure 3a).Although a was not statistically significant for large sizeclasses (1750–3500 mm) within the 7 cm s�1 increasingvelocity and 4 cm s�1 decreasing velocity intervals, it islikely that aggregation augmented these size classes as well,though the relative rarity of these large flocs resulted in anill-constrained transport model. Additional noise in themodel fit to observed concentration curves could haveresulted from changes in mean bed floc size between runs,sorting of the floc bed during previous deposition events[Lau et al., 2001], and changes in sediment stability as aresult of previous erosion/deposition cycles [Droppo et al.,2001].[26] While floc aggregation was significant during both
the 7 cm s�1 increasing velocity interval and 4 cm s�1
decreasing velocity interval, the large difference in theoptimized value of a for each size class between thesetwo runs (Table 2), together with the difference in the steadystate fractal dimension D across intervals (Figure 3b),suggests that aggregation occurred via different mechanisms[Winterwerp and van Kesteren, 2004]. A decrease in D (e.g.,from the 4 cm s�1 increasing velocity interval to the 7 cm s�1
interval) typically indicates the existence of floc shear-ing [Logan and Wilkinson, 1990; Huang, 1994; Dyer andManning, 1999], which begins at shear stresses near 0.1 Pa[Hill et al., 2001]. Thus, relatively low values of both D(Figure 3b) and a (Table 2) during the 7 cm s�1 runevidence particle-particle collisions that resulted in flocerosion and disaggregation as well as aggregation [Burbanet al., 1989; Lick et al., 1992; Spicer and Pratsinis, 1996].Since in the absence of a disaggregation term, aa2Ci
2Gdescribed net aggregation, a would have absorbed theinfluence of floc disaggregation. In contrast, an increase in
D (e.g., from the 7 cm s�1 interval to the 4 cm s�1
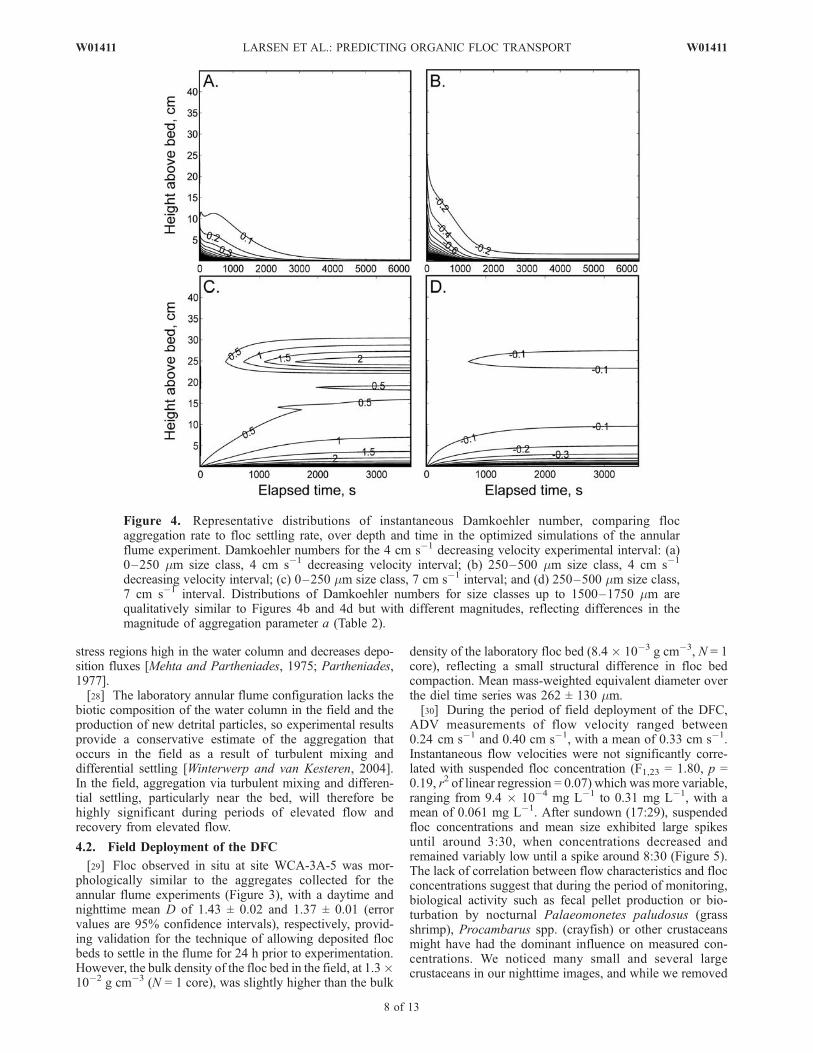
decreasing velocity interval) often indicates aggregationby differential settling [Huang, 1994; Chen and Eisma,1995], a process in which rapidly settling large particlesintercept and capture more slowly settling small particles[Logan and Wilkinson, 1990; Huang, 1994; Thomas et al.,1999]. During the 4 cm s�1 run, a net flux of sediment to thebed occurred, and differential settling may have become theprimary mechanism of aggregation, while disaggregation byshear was minimal.[27] Simulated Damkoehler numbers (Figure 4) show that
the aggregation flux was most significant relative to thesettling flux in high-shear, high-concentration portions ofthe water column, particularly near the bed, where Daranged between order 0.1 and order 10. In these locations,both turbulent mixing and differential settling bring par-ticles in contact and cause aggregation. Large aggregationfluxes near the bed during periods of elevated flow will thusenhance sediment deposition in wetlands and slowly flow-ing floodplains. In contrast, in estuaries and other turbulentenvironments, net disaggregation in the high-stress regionnear the bed counters net aggregation in relatively low-
Table 2. Significant Fitted Values of Floc Aggregation Term aa
Size Class(mm)
Aggregation Term aWith 4 cm s�1
Decreasing VelocityInterval (L mL�1 � 10�5)
Aggregation Term aWith 7 cm s�1
Increasing VelocityInterval (L mL�1 � 10�5)
0–250 �0.6 ± 0.5 �0.7 ± 0.1250–500 26.6 ± 0.9 1.2 ± 0.3500–750 25.3 ± 0.7 3.2 ± 0.3750–1000 15.9 ± 0.4 2.4 ± 0.41000–1250 7.8 ± 0.4 1.8 ± 0.11250–1500 4.8 ± 0.4 0.6 ± 0.61500–1750 0.4 ± 0.2
aSee equation (2). The aggregation term is significant when its 95%confidence intervals (the given range) do not intercept zero.
Table 3. Average Entrainment Flux Across All Size Classes
During Annular Flume Runs
Mean FlowVelocity (cm s�1)
Je, IncreasingVelocity Interval(cm3 cm�2 s�1)
Je, IncreasingVelocity Interval(cm3 cm�2 s�1)
2.5 2.6 � 10�7 2.9 � 10�6
4 8.3 � 10�7 4.1 � 10�6
7 5.0 � 10�5
Figure 3. Hysteresis in (a) equivalent diameter and(b) fractal dimension D for the upper, middle, and lowerimage locations during the annular flume aggregationexperiments. Volume-weighted mean equivalent diameterand mean fractal dimension were computed for the steadystate portion of the concentration curves after 500 s in theincreasing velocity experimental intervals and after 1000 sin the decreasing velocity intervals. Arrows indicate thedirection in which equivalent diameter and D progressthrough the experiment, and error bars are 95% confidenceintervals around the mean values.
W01411 LARSEN ET AL.: PREDICTING ORGANIC FLOC TRANSPORT
7 of 13
W01411
stress regions high in the water column and decreases depo-sition fluxes [Mehta and Partheniades, 1975; Partheniades,1977].[28] The laboratory annular flume configuration lacks the
biotic composition of the water column in the field and theproduction of new detrital particles, so experimental resultsprovide a conservative estimate of the aggregation thatoccurs in the field as a result of turbulent mixing anddifferential settling [Winterwerp and van Kesteren, 2004].In the field, aggregation via turbulent mixing and differen-tial settling, particularly near the bed, will therefore behighly significant during periods of elevated flow andrecovery from elevated flow.
4.2. Field Deployment of the DFC
[29] Floc observed in situ at site WCA-3A-5 was mor-phologically similar to the aggregates collected for theannular flume experiments (Figure 3), with a daytime andnighttime mean D of 1.43 ± 0.02 and 1.37 ± 0.01 (errorvalues are 95% confidence intervals), respectively, provid-ing validation for the technique of allowing deposited flocbeds to settle in the flume for 24 h prior to experimentation.However, the bulk density of the floc bed in the field, at 1.3�10�2 g cm�3 (N = 1 core), was slightly higher than the bulk
density of the laboratory floc bed (8.4 � 10�3 g cm�3, N = 1core), reflecting a small structural difference in floc bedcompaction. Mean mass-weighted equivalent diameter overthe diel time series was 262 ± 130 mm.[30] During the period of field deployment of the DFC,
ADV measurements of flow velocity ranged between0.24 cm s�1 and 0.40 cm s�1, with a mean of 0.33 cm s�1.Instantaneous flow velocities were not significantly corre-lated with suspended floc concentration (F1,23 = 1.80, p =0.19, r2 of linear regression = 0.07) which was more variable,ranging from 9.4 � 10�4 mg L�1 to 0.31 mg L�1, with amean of 0.061 mg L�1. After sundown (17:29), suspendedfloc concentrations and mean size exhibited large spikesuntil around 3:30, when concentrations decreased andremained variably low until a spike around 8:30 (Figure 5).The lack of correlation between flow characteristics and flocconcentrations suggest that during the period of monitoring,biological activity such as fecal pellet production or bio-turbation by nocturnal Palaeomonetes paludosus (grassshrimp), Procambarus spp. (crayfish) or other crustaceansmight have had the dominant influence on measured con-centrations. We noticed many small and several largecrustaceans in our nighttime images, and while we removed
Figure 4. Representative distributions of instantaneous Damkoehler number, comparing flocaggregation rate to floc settling rate, over depth and time in the optimized simulations of the annularflume experiment. Damkoehler numbers for the 4 cm s�1 decreasing velocity experimental interval: (a)0–250 mm size class, 4 cm s�1 decreasing velocity interval; (b) 250–500 mm size class, 4 cm s�1
decreasing velocity interval; (c) 0–250 mm size class, 7 cm s�1 interval; and (d) 250–500 mm size class,7 cm s�1 interval. Distributions of Damkoehler numbers for size classes up to 1500–1750 mm arequalitatively similar to Figures 4b and 4d but with different magnitudes, reflecting differences in themagnitude of aggregation parameter a (Table 2).
8 of 13
W01411 LARSEN ET AL.: PREDICTING ORGANIC FLOC TRANSPORT W01411

the most obvious organisms by masking, smaller zooplank-ton were doubtlessly binarized as floc. Other data sets fromWCA-3A-5 show that temporal variation in the concentra-tions of small particles (1.25–250 mm) is also likelydominated by biological activity, with spikes in concentra-tion throughout the night and a sustained and significantincrease in bacteria-sized particles (1.44–2.31 mm) that areenriched in microbially bound phosphorus after sunrise[Noe et al., 2008]. We did not observe a sustained daytimeincrease in floc concentrations, but the 30-min long spike inconcentration at 8:30 is consistent with a hypothesis of flocentrainment via bioturbation [National Research Council,2003] from temporary Gambusia holbrooki (mosquito fish)activity, which tends to be highly localized.[31] Suspended floc concentrations during the period of
thermal overturn were among the lowest for the night(Figure 5), which fails to support a hypothesis of enhancedentrainment by turbulence associated with thermal convec-tion [Schaffranek and Jenter, 2001] and may reflect advec-tive delivery of floc to the bed. At points higher than the dielmonitoring location (10 cm above bed) during the thermaloverturn, floc mass concentrations were nearly equivalent toor lower than concentrations near the bed (not shown).Within the vertical profile, pairwise correlations betweenconcentrations of floc in the different size classes wereinsignificant (Spearman’s r, all p > 0.07, N = 6 depths),supporting a hypothesis of biological rather than fluidmechanical dominance over the floc concentration profilesunder present flow conditions. The highest correlate tooverall floc concentration at a given level in the watercolumn was concentration of floc within the 200–400 mmsize class (Spearman’s r = 0.83, p = 0.04), which encom-passes the size range of many zooplankton [Masson et al.,2004] that may not have been excluded by masking.[32] Suspended floc concentrations observed in the field
with the DFC were higher than those observed in acompanion racetrack flume entrainment experiment forcomparable flow velocities (7.6 � 10�3 � 1.2 � 10�2 mgL�1 for velocities of 0.6–1.4 cm s�1 [Larsen et al., 2009]).The reason is that while concentrations of suspended floc
are governed by physical processes in the laboratory flume,floc concentrations in the field are enhanced by bioturbationand the continual production of new particles (e.g., fecalmaterial, EPS) by biota in the water column (Figure 1).Nevertheless, the concentrations of floc that we measured insuspension in the Everglades (0.001–0.3 mg L�1) and alsoin the laboratory flumes at moderately high velocities(0.003–0.3 mg L�1) were substantially lower than concen-trations of fine suspended particles (0.2–100 mm) measuredin a study that used sequential filtration to assess particleconcentrations in samples collected from across the Ever-glades (0.7–2.7 mg L�1 [Noe et al., 2007]) and over twowet seasons at site WCA-3A-5 (mean = 0.94 mg L�1 [Noeet al., 2008]) under normal flow conditions. Thus, it appearsthat even during high-flow events, fine particles contributesubstantially to the suspended particle load in the Everglades.
4.3. Modeling Wetland Suspended Floc Dynamics
[33] The low shear present within the Everglades andother wetlands and floodplains permits the coexistence of awide range of floc sizes, settling velocities, and entrainmentfluxes. Such variability presents challenges for modeling,often creating the need to simultaneously track multiple sizeclasses of floc [Thomas et al., 1999]. Exchange betweensize classes via aggregation and disaggregation processes, achange in the dominant mechanism of aggregation betweenrising and falling limbs of suspended floc concentrationcurves, and the importance of biological processes presentadditional modeling challenges. Unfortunately, full massbalance modeling of multiple size classes of suspended flocmay be computationally prohibitive in large-scale, coupledmodels. However, there are reasonable simplifications thatcan be made to floc transport equations that preserve theessence of the physical dynamics.[34] We introduce the concept of an ‘‘operative floc
diameter’’ (OFD) to use in simplified advection-dispersionequations. The OFD differs from the equivalent diameterused earlier (i.e., the diameter based on digitized floc area).OFD, which can be either lower or higher than the meanequivalent diameter, is the diameter at which settling andentrainment fluxes are equal to actual bed fluxes across allparticle size classes at steady state and in which error in thevertically averaged floc concentration is minimized. Be-cause of nonlinearities in vertical profiles of suspended flocconcentration, use of the mean equivalent diameter ratherthan the OFD can introduce large errors in computed fluxes.In a simplified modeling scheme, an overall entrainmentflux that is independent of floc size and is a function of bedshear stress and the critical shear stress for floc entrainment[e.g., Larsen et al., 2009] can be used in tandem with asettling velocity determined from the OFD to accuratelycapture the balance between entrainment and depositionfluxes to the bed and the rate of mass transfer downstream.[35] To determine the OFD for the Everglades, we
employed a logarithmic velocity profile, which approxi-mates flow in sloughs [Harvey et al., 2008]. Steady statesuspended sediment concentration profiles in flow with alogarithmic boundary layer velocity profile follow theRouse equation [Middleton and Southard, 1984]:
CðzÞCa
¼ za
z
� � wssT ku* ; ð5Þ
Figure 5. Distribution of floc size class concentrationsthrough the 28–29 November 2006 sampling period at siteWCA-3A-5. The asterisk denotes the period during whichthermal overturn occurred in the water column.
W01411 LARSEN ET AL.: PREDICTING ORGANIC FLOC TRANSPORT
9 of 13
W01411

where Ca is the concentration at reference location z = za,sT is the turbulent Schmidt number (assumed unity), and u*is equal to
ffiffiffiffiffiffiffiffiffiffit0=r
p. In this analysis, we assumed that za is
located just above the bed (0.05 mm in our discretizedsolution). For each point on a measured floc entrainmentcurve [Larsen et al., 2009], we set Cai (the value of Ca
within each size class i) equal to Jei/wsi, which assumessteady state at the bed. Solving equation (5) for size class iand a 40 cm water column and then summing over all sizeclasses, we obtained the total concentration profile at eachbed shear stress. Using a Levenburg-Marquardt algorithm,we then selected the single value ofws that satisfiedCa = Je/ws
(where Je is the overall entrainment flux as a function of bedshear stress) and minimized the overall error in depth-averaged floc concentration, computed from the profile inequation (5). Finally, from the calibrated ws and a regressionequation for measured ws as a function of floc equivalentdiameter [Larsen et al., 2009], we determined the OFD.[36] OFDs were accordingly calculated from 32 runs of a
flume entrainment experiment for Everglades floc, reportedby Larsen et al. [2009]. For each of these runs, use of asingle OFD resulted in an error in depth-averaged concen-tration ranging from 0.01% to 0.2%. The curve of OFD as afunction of bed shear stress (Figure 6) increased rapidlywith bed shear stress near the entrainment threshold andthen increased more slowly with further increases in bed
shear stress. The standard error of a power law regression(147 mm) was slightly worse than the standard error oflinear regression (143 mm) on the OFD at bed shear stressesin the asymptotic portion of the curve (t0 � 2.0 � 10�2 Pa),advocating use of the simplest OFD relationship. Althoughthe standard error of linear regression was slightly betterthan the error (151 mm) of approximating the OFD curve asthe mean OFD above bed shear stresses of 2.0 � 10�2 Pa,the slope of the linear regression was insignificant (tdf = 13 =1.24, p = 0.24). Thus, in modeling suspended floc dynamicsin the Everglades and other environments with a near-logarithmic velocity profile and floc populations with com-parable entrainment and settling relationships (i.e., mostorganic floc populations [Larsen et al., 2009]), it is reason-able to adopt a single OFD that preserves fluxes down-stream and to the bed.[37] Use of an OFD in transport models disregards
aggregation dynamics. Nevertheless, for many wetland floctransport models, disregarding aggregation dynamics willnot introduce unacceptable error. On the rising limb ofconcentration curves, optimized aggregation parametersare not significantly different from zero for flow speedsbelow 7 cm s�1. Aggregation is significant on the fallinglimb of the concentration curves, but the effects of enhancedsettling to the bed via aggregation may be offset byhysteresis in entrainment rate that results in Je values thatare higher than expected. While disregarding aggregation-disaggregation dynamics in wetland floc transport modelsmay only introduce small error, doing so in streams andother highly turbulent environments could produce unac-ceptable error in mass flux predictions [Wotton, 2007].
4.4. Implications for Floc Transport ThroughVegetated Aquatic Environments
[38] Since bed shear stress in floodplains and wetlands isoften near the critical bed shear stress for floc entrainment,spatial heterogeneity in shear stress as a result of micro-topography and vegetation patchiness can lead to heteroge-neity in floc erosion and deposition patterns, contributing tothe topographic evolution of the wetland landscape and/orrates of nutrient cycling. In Everglades WCA-3A typicalbed shear stresses lie orders of magnitude below the 1.0 �10�2 Pa threshold for floc entrainment [Larsen et al., 2009],so widespread bed floc entrainment events are rare in thepresent system. Instead, water column particle dynamics aremost commonly characterized by low concentrations ofsmall particles (mass- and volume-weighted mean diametersof 73 mm and 9 mm, respectively) dominated by localprocesses [Noe et al., 2007]: biological production, biotur-bation, and particle settling (Figure 1b). These fine particleshave long immobilization times by single-particle settling[Larsen et al., 2009] and are more reactive than the largerflocs, dominating phosphorus cycling in the water column[Noe et al., 2003] and containing a higher nutrient densitythan larger flocs [Noe et al., 2007]. Because of theirreactivity and long residence times in the water column,fine particle transport alone may not contribute significantlyto the topographic differentiation of the ridge and sloughlandscape. However, our annular flume experiments implythat differential settling is a significant process impactingEverglades floc. Given the larger mass per unit volume offine particles [Larsen et al., 2009] and their substantialcontribution to total particle mass (section 4.2), incorpora-
Figure 6. Operative floc diameter (OFD) computed forfloc populations in the racetrack flume entrainmentexperiments at different values of the normalized excessbed shear stress (t0* = (t0 � 1.0� 10�2 Pa)/1.0� 10�2 Pa).The OFD is that at which errors in vertically averaged flocconcentration are minimized and the settling and entrain-ment fluxes at the bed are exactly equal to those of actualfloc with a distribution of equivalent diameters. In thiscomputation, the OFD is based on a logarithmic velocityprofile and a steady state floc concentration profile. OFDvalues computed with data from the racetrack flumeexperiment for bed shear stresses greater than the entrain-ment threshold are fit with three regression lines: (1) apower law regression (thick line); (2) a linear regression(thin line); and (3) a constant, equal to the mean value ofOFD for bed shear stresses above 2.0 � 10�2 Pa (dashedline).
10 of 13
W01411 LARSEN ET AL.: PREDICTING ORGANIC FLOC TRANSPORT W01411

tion of small particles into floc could significantly increasethe magnitude of advective sediment and nutrient redistri-bution in the Everglades. Efficient interception of fineparticles by periphyton and emergent vegetation stems, aprocess termed filtration (Figure 1), may serve as anadditional mass redistribution process in the Everglades[Saiers et al., 2003; Huang et al., 2008] and other wetlands[Palmer et al., 2004; D’Alpaos et al., 2007].[39] In contrast to typical conditions in the present-day
Everglades, during transient high-flow events such as hur-ricanes or engineered releases of impounded water, watercolumn particle dynamics would be dominated by thehydraulic processes of floc entrainment and transport.During these high flows bed shear stresses within sloughscould increase beyond the entrainment threshold, causingfloc to become suspended. As in streams [Cushing et al.,1993; Battin et al., 2008], floc will be transported down-stream in a series of distinct settling and reentrainmentevents. Reentrainment events are facilitated by hystereticenhancement of Je on the falling limb of the floc concen-tration curve (e.g., Table 3), which could result fromdisruption of the EPS that contributed to floc bed cohesionat the initiation of entrainment [Winterwerp and van Kesteren,2004; Newbold et al., 2005] or from the looser pore structureof the more recently deposited bed, permitting greaterpenetration of eddies that could generate lift.[40] In most densely vegetated canopies, drag from mac-
rophyte stems decreases flow velocities relative to openwater areas [Kadlec, 1990; Nepf, 1999], promoting sedi-mentation [e.g., Furukawa et al., 1997; Leonard and Reed,2002; Pasternack and Brush, 2002]. Likewise, upon enter-ing the dense emergent vegetation of ridges, flow carryingsuspended floc from the sloughs will decrease in velocity,and the dominant vertical flux will become a settling flux(Figure 1a). This process is analogous to the deposition offloc on floodplains during periods of overbank flow [Nich-olas and Walling, 1996]. Deposited flocs will undergo sizesorting by distance. Assuming an OFD of 250 mm andnegligible aggregation, the characteristic transport distancefor suspended floc within the ridge at a mean water depth of40 cm and mean water velocity of 1 cm s�1 would beapproximately 10 m before settling to the bed occurred[Larsen et al., 2009], which is consistent with a hypothesisof deposition in the vicinity of the ridge-slough transition[Larsen et al., 2007]. Aggregation by differential settlingwithin the ridge, particularly near the bed (Figure 4) willincrease floc size and further decrease the characteristictransport distance for floc within the ridge. In contrast tosloughs, where hysteresis in Je may compensate for aggre-gation-enhanced settling, in ridges the litter layer above thebed could shelter settling flocs from near-bed shear stressesor bind flocs in interstitial biofilm, resulting in permanentdeposition.[41] Two other studies within the greater Everglades that
have characterized floc distribution and origin are consistentwith the findings of this study. Using biochemical markers,Neto et al. [2006] found that (1) floc composition is largelydetrital and related to local vegetation community compo-sition and that (2) some decoupling in source-specificchemical markers between the floc and underlying peatimplies limited hydrodynamic transport of floc, perhapsduring episodic high-velocity events. While their study took
place along Taylor Slough, which has a marl substratum andfloc with a larger inorganic (CaCO3) content than floc fromwithin the ridge and slough landscape, we expect theseresults to apply throughout the greater Everglades becauseof similar hydrodynamics and the relative ease of entrainingfloc with a high organic content. Similarly, using organiccarbon quality as a tracer at site WCA-3A-5, Larsen [2008]found limited decoupling between the origin of surface peatand local vegetation community composition, whichimplies some allochthonous transport of organic material,possibly in the form of floc.
5. Conclusions
[42] In organoclastic slowly flowing environments wheresuspended particle concentrations are transport limited rath-er than supply limited, floc transport may dominate thesurface water advective mass transfer of carbon andnutrients and contribute to the evolution of microtopogra-phy. Downstream transport of floc in areas where bed shearstress exceeds the entrainment threshold will be character-ized by multiple deposition and reentrainment events,facilitated by the higher entrainment flux of recently depos-ited floc beds relative to more established beds. In regionswhere settling is the dominant flux, aggregation of floc bydifferential settling further enhances sedimentation, while atthe highest flow speeds, aggregation occurs as a result ofparticle-particle collisions but competes with disaggrega-tion. However, over a range of typical flow velocities forinland wetlands and floodplains, floc aggregation processesdominate over disaggregation. Differences in flow velocitiesand shear stresses within different vegetation communitiesmay result in the transfer of organic matter and nutrientsfrom relatively open areas to more densely vegetated partsof the aquatic ecosystem.[43] Floc dynamics within wetlands, floodplains, and
shallow streams are complex because of a wide range offloc sizes, hysteresis in entrainment rates and fractal dimen-sion, differences in microbial communities and the organiccharacter of floc, diel patterns of biological activity, andmultiple mechanisms of particle aggregation. During peri-ods when bed shear stresses are below the floc entrainmentthreshold, biological processes such as bioturbation andnew particle production are dominantly responsible forwater column floc dynamics. Nightly occurring thermaloverturn, in contrast, does not cause significant floc en-trainment in the Everglades. Despite the complexity of flocdynamics in shallow, slowly flowing environments, whenmean flow controls water column floc dynamics (i.e., whenbed shear stresses are above the floc entrainment threshold),it is viable to predict the essential dynamics of floc transportthrough simplified numerical modeling. The proposed mod-eling scheme tracks the balance between entrainment,settling, and advective transport for multiple size classesor for a single size class using an OFD that results in acorrect settling flux to the bed while minimizing error in thevertically averaged concentration of floc transported down-stream. Models can ignore floc aggregation dynamics withminimal error at flows associated with bed shear stressesjust above the floc entrainment threshold, but at the highestflows (e.g., 7.0 cm s�1 in the annular flume experiments) orat moderate flows that follow periods of high flow, aggre-
W01411 LARSEN ET AL.: PREDICTING ORGANIC FLOC TRANSPORT
11 of 13
W01411
gation becomes significant and models should simulatemultiple size classes.[44] Water management decisions in the Everglades
would need to define a target flow velocity that optimizesthe transfer of organic sediment from sloughs to ridges. Onthe basis of our experiments and conceptual model, atarget velocity should result in shear stresses above the1.0 � 10�2 Pa entrainment threshold in sloughs and justbelow the entrainment threshold within ridges. Simulationsof differential flow velocities and shear stresses throughheterogeneous vegetation communities under different com-binations of water depths and energy slopes would providethe remaining piece of information needed to propose targetvelocities and durations of elevated flow that are most likelyto sustain an Everglades that redistributes suspended floc inways that maintain landscape structure and biodiversity.
[45] Acknowledgments. We thank Daniel Nowacki for field andanalytical assistance and Kevin Brett for image processing work. CharlotteFuller provided access to the flumes at the Rutgers IMCS seawater lab andgenerous laboratory assistance. This work was funded by NSF award EAR-0636079, the USGS Priority Ecosystems Studies Program, the USGSNational Research Program, the Canon National Parks Science ScholarsProgram, an NSF graduate research fellowship to LGL, and a HertzFoundation fellowship to LGL. This manuscript benefited from the helpfulreviews of Jeffrey King, Jonathan Nelson, Roger Wotton, and two anony-mous reviewers. Any use of trade, firm, or product names is for descriptivepurposes only and does not imply endorsement by the U.S. government.
ReferencesAlldredge, A. L., and C. Gotschalk (1988), In situ settling behavior ofmarine snow, Limnol. Oceanogr., 33, 339–351.
Battin, T. J., L. A. Kaplan, S. Findlay, C. S. Hopkinson, E. Marti, A. I.Packman, J. D. Newbold, and F. Sabater (2008), Biophysical controls onorganic carbon fluxes in fluvial networks, Nat. Geosci., 1, 95–100,doi:10.1038/ngeo101.
Bernhardt, C. E., D. A. Willard, M. Marot, and C. W. Holmes (2004),Anthropogenic and natural variation in ridge and slough pollen assem-blages, U.S. Geol. Surv. Open File Rep., 2004-1448, 47 pp.
Burban, P. Y., W. Lick, and J. Lick (1989), The flocculation of fine-grainedsediments in estuarine waters, J. Geophys. Res., 94, 8323 – 8330,doi:10.1029/JC094iC06p08323.
Chen, S., and D. Eisma (1995), Fractal geometry of in situ flocs in theestuarine and coastal environments, Neth. J. Sea Res., 33, 173–182,doi:10.1016/0077-7579(95)90004-7.
Christiansen, T., P. L. Wiberg, and T. G. Milligan (2000), Flow and sedi-ment transport on a tidal salt marsh surface, Estuarine Coastal Shelf Sci.,50, 315–331, doi:10.1006/ecss.2000.0548.
Cushing, C. E., G. W. Minshall, and J. D. Newbold (1993), Transportdynamics of fine particulate organic matter in two Idaho streams, Limnol.Oceanogr., 38, 1101–1115.
D’Alpaos, A., S. Lanzoni, M. Marani, and A. Rinaldo (2007), Landscapeevolution in tidal embayments: Modeling the interplay of erosion, sedi-mentation, and vegetation dynamics, J. Geophys. Res., 112, F01008,doi:10.1029/2006JF000537.
de Boer, D. H. (1997), An evaluation of fractal dimensions to quantifychanges in the morphology of fluvial suspended sediment particles dur-ing baseflow conditions, Hydrol. Processes, 11, 415–426, doi:10.1002/(SICI)1099-1085(19970330)11:4<415::AID-HYP450>3.0.CO;2-W.
Droppo, I. G. (2003), A new definition of suspended sediment: Implicationsfor the measurement and prediction of sediment transport, in Erosion andSediment Transport Measurement in Rivers: Technological and Metho-dological Advances, edited by J. Bogen, T. Fergus, and D. E. Walling,IAHS Publ., 283, 3–12.
Droppo, I. G. (2004), Structural controls on floc strength and transport,Can. J. Civ. Eng., 31, 569–578, doi:10.1139/l04-015.
Droppo, I. G., Y. L. Lau, and C. Mitchell (2001), The effect of depositionalhistory on contaminated bed sediment stability, Sci. Total Environ., 266,7–13, doi:10.1016/S0048-9697(00)00748-8.
Dyer, K. R., and A. J. Manning (1999), Observation of the size, settlingvelocity and effective density of flocs, and their fractal dimensions, J. SeaRes., 41, 87–95, doi:10.1016/S1385-1101(98)00036-7.
Eisma, D., T. Schuhmacher, H. Boekel, J. VanHeerwaarden, H. Franken,M. Laan, A. Vaars, F. Eijgenraam, and J. Kalf (1990), A camera andimage-analysis system for in situ observation of flocs in natural waters,Neth. J. Sea Res., 27, 43–56, doi:10.1016/0077-7579(90)90033-D.
Furukawa, K., E. Wolanski, and H. Mueller (1997), Currents and sedimenttransport in mangrove forests, Estuarine Coastal Shelf Sci., 44, 301–310, doi:10.1006/ecss.1996.0120.
Grant, J., and G. Gust (1987), Prediction of coastal sediment stability fromphotopigment content of mats of purple sulphur bacteria, Nature, 330,244–246, doi:10.1038/330244a0.
Gunderson, L. H. (1994), Vegetation of the Everglades: Determinants ofcommunity composition, in Everglades: The Ecosystem and Its Restora-tion, edited by S. M. Davis and J. C. Ogden, pp. 323–340, St. Lucie,Delray Beach, Fla.
Gunderson, L. H., and W. F. Loftus (1993), The Everglades, in Biodiversityof the Southeastern United States: Terrestrial Communities, edited byW. H. Martin, S. G. Boyce, and A. C. Echternacht, chap. 6, pp. 199–256,John Wiley, New York.
Harvey, J. W., J. E. Saiers, and J. T. Newlin (2005), Solute transport andstorage mechanisms in wetlands of the Everglades, south Florida, WaterResour. Res., 41, W05009, doi:10.1029/2004WR003507.
Harvey, J. W., R. W. Schaffranek, L. G. Larsen, D. Nowacki, G. B. Noe,and B. L. O’Connor (2008), Controls on flow velocity and flow resis-tance in the patterned floodplain landscape of the Everglades, paperpresented at Ocean Sciences Meeting, Am. Soc. of Limnol. andOceangr., Orlando, Fla., 2–7 March.
Hill, P. S., G. Voulgaris, and J. H. Trowbridge (2001), Controls on floc sizein a continental shelf bottom boundary layer, J. Geophys. Res., 106,9543–9549, doi:10.1029/2000JC900102.
Huang, H. (1994), Fractal properties of flocs formed by fluid shear anddifferential settling, Phys. Fluids, 6, 3229–3234, doi:10.1063/1.868055.
Huang, Y. H., J. E. Saiers, J. W. Harvey, G. B. Noe, and S. Mylon (2008),Advection, dispersion, and filtration of fine particles within emergentvegetation of the Florida Everglades, Water Resour. Res., 44, W04408,doi:10.1029/2007WR006290.
Kadlec, R. H. (1990), Overland flow in wetlands-vegetation resistance,J. Hydraul. Eng., 116, 691–706, doi:10.1061/(ASCE)0733-9429(1990)116:5(691).
Krishnappan, B. G. (1991), A rotating flume for cohesive sediment trans-port research, Contrib. 91-82, Natl. Water Res. Inst., Burlington, Ont.,Canada.
Krishnappan, B. G. (1993), Rotating circular flume, J. Hydraul. Eng., 119,758–767, doi:10.1061/(ASCE)0733-9429(1993)119:6(758).
Larsen, L. G. (2008), Hydroecological feedback processes governing self-organization of the Everglades ridge and slough landscape, Ph.D. thesis,Univ. of Colo., Boulder.
Larsen, L. G., J. W. Harvey, and J. P. Crimaldi (2007), A delicate balance:Ecohydrological feedbacks governing landscape morphology in a loticpeatland, Ecol. Monogr., 77, 591–614, doi:10.1890/06-1267.1.
Larsen, L. G., J. W. Harvey, and J. P. Crimaldi (2009), Morphologic,settling, and entrainment characteristics of organic wetland floc, Ever-glades, Florida, doi:10.1029/2008WR006990, in press.
Lau, Y. L., I. G. Droppo, and B. G. Krishnappan (2001), Sequential erosion/deposition experiments—Demonstrating the effects of depositional his-tory on sediment erosion, Water Res., 35, 2767–2773, doi:10.1016/S0043-1354(00)00559-5.
Leonard, L. A., and M. E. Luther (1995), Flow hydrodynamics in tidalmarsh canopies, Limnol. Oceanogr., 40, 1474–1484.
Leonard, L. A., and D. J. Reed (2002), Hydrodynamics and sedimenttransport through tidal marsh canopies, J. Coastal Res., 36, 459–469.
Lick, W., J. Lick, and K. Ziegler (1992), Flocculation and its effect on thevertical transport of fine-grained sediments, Hydrobiologia, 235–236,1–16, doi:10.1007/BF00026196.
Lodge, T. (1994), The Everglades Handbook: Understanding the Ecosys-tem, St. Lucie, Delray Beach, Fla.
Logan, B. E., and D. B. Wilkinson (1990), Fractal geometry of marine snowand other biological aggregates, Limnol. Oceanogr., 35, 130–136.
Masson, S., B. Pinel-Alloul, and P. Dutilleul (2004), Spatial heterogene-ity of zooplankton biomass and size structure in southern Quebec lakes:Variation among lakes and within lake among epi-, meta- and hypolimnionstrata, J. Plankton Res., 26, 1441–1458, doi:10.1093/plankt/fbh138.
Mayer, L. M., L. L. Schick, K. Skorko, and E. Boss (2006), Photodissolu-tion of particulate organic matter from sediments, Limnol. Oceanogr., 51,1064–1071.
Mehta, A. J., and E. Partheniades (1975), An investigation of the deposi-tional properties of flocculated fine sediments, J. Hydraul. Res., 13,361–381.
12 of 13
W01411 LARSEN ET AL.: PREDICTING ORGANIC FLOC TRANSPORT W01411

Middleton, G. V., and J. B. Southard (1984), Mechanics of Sediment Move-ment, SEPM Short Course 3, Soc. for Sediment. Geol., Tulsa, Okla.
National Research Council (2003), Does Water Flow Influence EvergladesLandscape Patterns?, 41 pp., Natl. Acad., Washington, D. C.
Nepf, H. M. (1999), Drag, turbulence, and diffusion in flow through emer-gent vegetation, Water Resour. Res., 35, 479 – 489, doi:10.1029/1998WR900069.
Neto, R. R., R. N. Mead, J. W. Louda, and R. Jaffe (2006), Organicbiogeochemistry of detrital flocculent material (floc) in a subtropical,coastal wetland, Biogeochemistry, 77, 283–304, doi:10.1007/s10533-005-5042-1.
Newbold, J. D., S. A. Thomas, G. W. Minshall, C. E. Cushing, andT. Georgian (2005), Deposition, benthic residence, and resuspension offine organic particles in a mountain stream, Limnol. Oceanogr., 50,1571–1580.
Nezu, I., and H. Nakagawa (1993), Turbulence in Open-Channel Flows,A.A. Balkema, Rotterdam, Netherlands.
Nicholas, A. P., and D. E. Walling (1996), The significance of particleaggregation in the overbank deposition of suspended sediment on riverfloodplains, J. Hydrol., 186, 275–293, doi:10.1016/S0022-1694(96)03023-5.
Noe, G. B., L. J. Scinto, J. Taylor, D. L. Childers, and R. D. Jones (2003),Phosphorus cycling and partitioning in an oligotrophic Everglades wet-land ecosystem: A radioisotope tracing study, Freshwater Biol., 48,1993–2008, doi:10.1046/j.1365-2427.2003.01143.x.
Noe, G. B., J. Harvey, and J. Saiers (2007), Characterization of suspendedparticles in Everglades wetlands, Limnol. Oceanogr., 52, 1166–1178.
Noe, G. B., J. W. Harvey, and L. G. Larsen (2008), Biogeochemical trans-formations and transport related to flow in the ridge and slough land-scape, paper presented at Greater Everglades Ecosystem RestorationConference, U.S. Geol. Surv., Naples, Fla., 28 July to 1 Aug.
Ogden, J. C. (2005), Everglades ridge and slough conceptual ecologicalmodel, Wetlands, 25, 810 – 820, doi:10.1672/0277-5212(2005)025[0810:ERASCE]2.0.CO;2.
Palmer, M. R., H. M. Nepf, T. J. R. Pettersson, and J. D. Ackerman (2004),Observations of particle capture on a cylindrical collector: Implicationsfor particle accumulation and removal in aquatic systems, Limnol. Ocea-nogr., 49, 76–85.
Partheniades, E. (1977), Unified view of wash load and bed material load,J. Hydraul. Div. Am. Soc. Civ. Eng., 103, 1037–1057.
Pasternack, G. B., and G. S. Brush (2002), Biogeomorphic controls onsedimentation and substrate on a vegetated tidal freshwater delta in upperChesapeake Bay, Geomorphology, 43, 293–311, doi:10.1016/S0169-555X(01)00139-8.
Petersen, O., and B. G. Krishnappan (1994), Measurement and analysis offlow characteristics in a rotating circular flume, J. Hydraul. Res., 32,483–494.
Saiers, J. E., J. W. Harvey, and S. E. Mylon (2003), Surface-water transportof suspended matter through wetland vegetation of the Florida ever-glades, Geophys. Res. Lett., 30(19), 1987, doi:10.1029/2003GL018132.
Schaffranek, R. W., and H. L. Jenter (2001), Observations of daily tem-perature patterns in the southern Florida Everglades, paper presented atWetlands Engineering and River Restoration Conference, Am. Soc. ofCiv. Eng., Reno, Nev., 27–31 Aug.
Spicer, P. T., and S. E. Pratsinis (1996), Shear-induced flocculation: Theevolution of floc structure and the shape of the size distribution at steadystate, Water Res., 30, 1049–1056, doi:10.1016/0043-1354(95)00253-7.
Sterling, M. C., Jr., J. S. Bonner, A. N. S. Ernest, C. A. Page, and R. L.Autenrieth (2005), Application of fractal flocculation and vertical trans-port model to aquatic soil-sediment systems,Water Res., 39, 1818–1830,doi:10.1016/j.watres.2005.02.007.
Stone, M., and B. G. Krishnappan (2003), Floc morphology and size dis-tributions of cohesive sediment in steady-state flow, Water Res., 37,2739–2747, doi:10.1016/S0043-1354(03)00082-4.
Thomas, D. N., S. J. Judd, and N. Fawcett (1999), Flocculation modelling:A review, Water Res., 33, 1579–1592, doi:10.1016/S0043-1354(98)00392-3.
U.S. Army Corps of Engineers (1999), Central and southern Florida project,Comprehensive review study, final integrated feasibility report and pro-grammatic environmental impact statement, Washington, D. C.
Walling, D. E., and P. W. Moorehead (1989), The particle size character-istics of fluvial suspended sediment: An overview, Hydrobiologia, 176–179, 125–149, doi:10.1007/BF00026549.
Willard, D. A., L. M. Weimer, and W. L. Riegel (2001), Pollen assemblagesas paleoenvironmental proxies in the Florida Everglades, Rev. Palaeobot.Palynol., 113, 213–235, doi:10.1016/S0034-6667(00)00042-7.
Winterwerp, J. C., and W. G. M. van Kesteren (2004), Introduction to thePhysics of Cohesive Sediment in the Marine Environment, Elsevier,Amsterdam.
Wotton, R. S. (2007), Do benthic biologists pay enough attention to aggre-gates formed in the water column of streams and rivers?, J.N. Am. Benthol.Soc., 26, 1–11, doi:10.1899/0887-3593(2007)26[1:DBBPEA]2.0.CO;2.
Wu, Y., N. Wang, and K. Rutchey (2006), An analysis of spatial complexityof ridge and slough patterns in the Everglades ecosystem, Ecol. Complex-ity, 3, 183–192, doi:10.1016/j.ecocom.2005.12.002.
����������������������������J. P. Crimaldi, Department of Civil, Environmental, and Architectural
Engineering, University of Colorado, 428 UCB, Boulder, CO 80309, USA.
J. W. Harvey, L. G. Larsen, and G. B. Noe, U.S. Geological Survey, 430National Center, Reston, VA 20192, USA. ([email protected])
W01411 LARSEN ET AL.: PREDICTING ORGANIC FLOC TRANSPORT
13 of 13
W01411