Embed Size (px)
Citation preview

CLIz'
0 A
**.so02
0 -%0900*0 0-h
.0 *1*@
*0
00 0
00
0 l
0
oj

1-4
ISODATA, A NOVEL METHOD
OF DATA ANALYSISAND PATTERN CLASSIFICATION
By-: GEOFFREY H. BALL AND DAVID J. HALL
TechnicalReportApril 1965
S TAN FoRD RESEARCH INs TITUTE
MENLO PARK, CALIFORNIA
Reproduced by the Prepared forCLEARINGHOUSE Peae ofor Federal Scientific & Technical Information Sciences Branch
I ion Springfiold Va. 22151 Office of Naval ResearchContract Nonr 4918(00)SRI Project 5533
L..*sR
I
ISODATA, A NOVEL METHODOF DATA ANALYSISAND PATTERN CLASSIFICATION
By: GEOFFREY H. BALL AND DAVID J. HALL
TechnicalReport
April 1965
Prepared forInformation Sciences BranchOffice of Naval ResearchContract Nonr 4918(00)
SRI Project 5533
p
I
CONTENTS
LIST OF ILLUSTRATIONS .. . .. IABSTRACT . . . . . . . . . . . . . . . . . . . . . . ..
T I .•TRODUCTION .................. ..................... 2
II PATTERN RECOGNITION PREPROCESSINGAND CLASSIFICATION .............. .................. 2
III THE TECHNIQUE ................. .................... 5
IV DETAILED DESCRIPTION OF ISODATA-POINTS ...... ........ 6
A. Verbal Description .......... .............. 6B. Pactorial Flow Diagram ........ ............ 6
C. Two-Dimension Illustrative Example ....... S
D. Mathematical Description ........... .... 32
3. Analysis of the Height vs. Weight Data
Using Principal Components Analysis 42
V EXPERIMENTAL RESULTS FROM COMPUTER IMPLEMENTATIONOF IBSOATA-POINTS. ...... .......... ............ 46
VI HOW THE OUTPUT FROM AN ISODATA-POINTS ANALYSISCAN BE USED ....... ........................ 50
VII SUOOESTIONS FOR FURTHER RESEARCH ............ ... 51
VIII ACKNOWLEDGMENTS ................................. 61
APPENDIX A ...................... ........................ A-i
A. ISODATA-LINES ................ A-4B. ISODATA-PLANES ..... ................ ... A-9
REFERENCES
r ! ,i
kI

LIST OF ILLUSTRATIONS
Fig. I A Pictorial Description of ISODATA-POINTS . . . 7
V4. 2 C-1vLiv,, vi The raztern set ......... 14
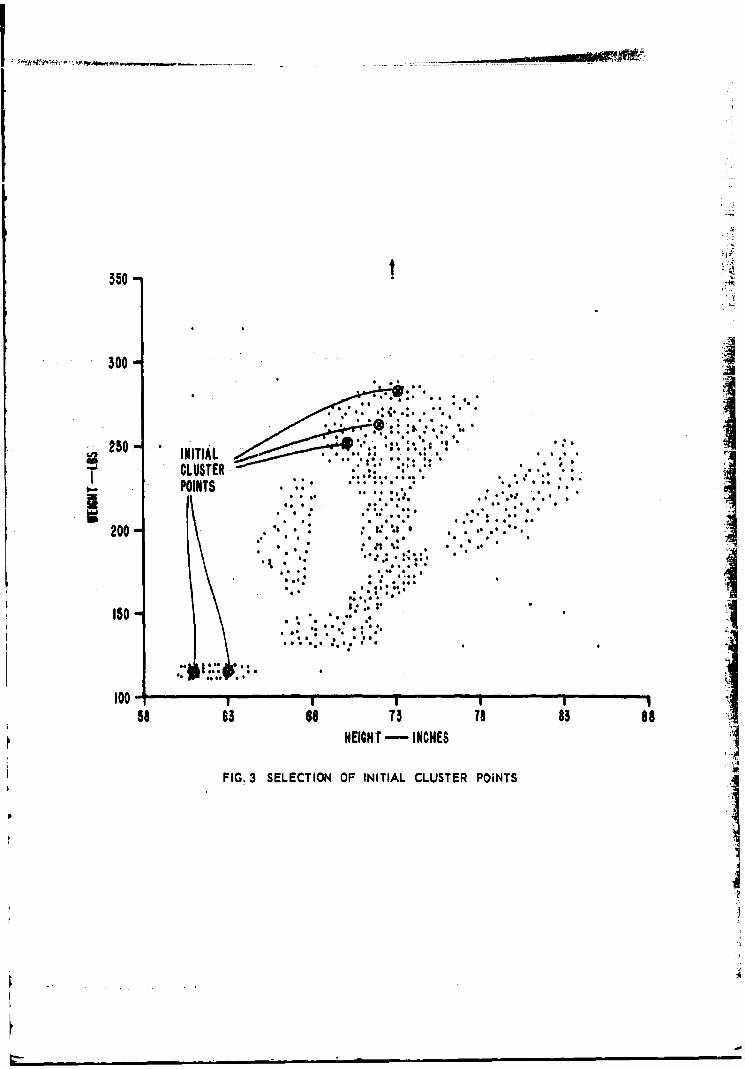
Fig. 3 Selection of Initial Cluster Points ...... 15
Fig. 4 Partitioning of the Pattern Space
as Defined Implicitly by the Cluster Points . 16
Fig. 5 Sorting of the Patterns for Iteration 1Using the Initial Partition .......... ... 17
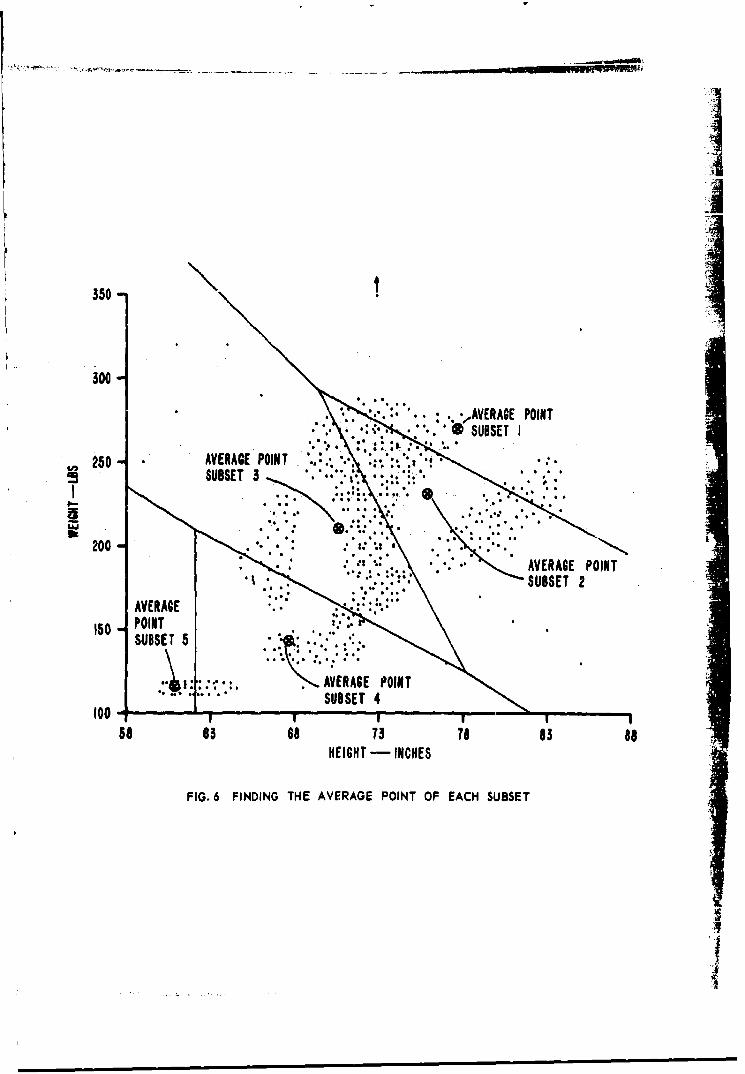
Fig. 6 Finding the Avarage Point of FAcb Subset . . . is
Fig. 7 Splitting of the Average Points ........ .. 19
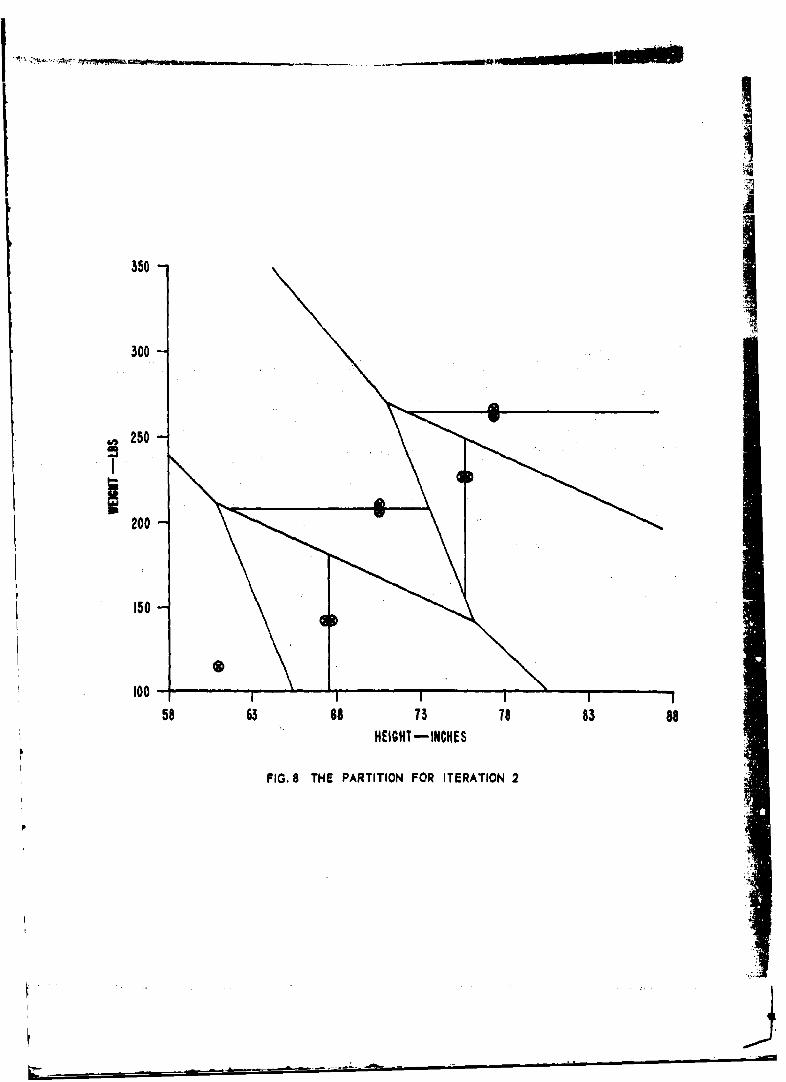
Fig. 8 The Partition for Iteration 2 .............. 20
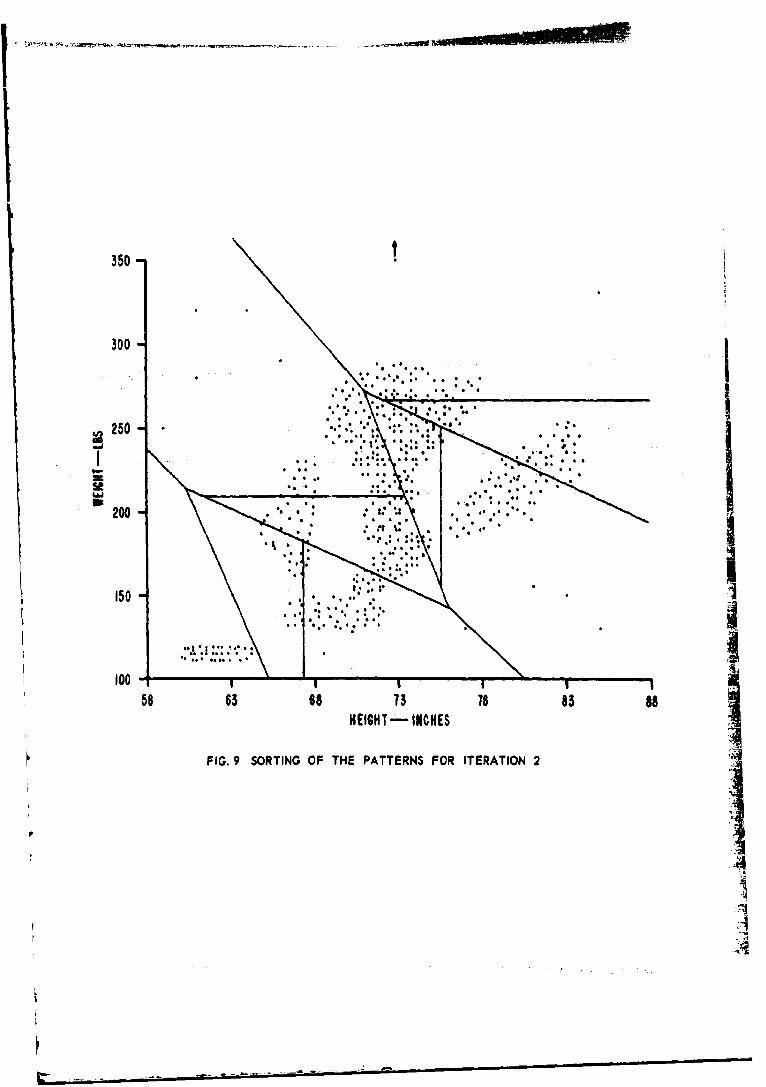
Fig. 9 Sorting of the Patterns for Iteration 2 . . 21
Fig. 10 Finding the Average Points of Iteration 2 . 22
Fig. 11 The Average Points Found in Iteration 3 . 23
Fig. 12 The Average Points of Iteration.3 adr Splitin the Manner Described Under Fig. 7 Above . . 24
Fig. 13 The Sorting of the Patterns in Iteration 4 . . 25
Pig. 14 The Finding of Average Pointsfor Iteration 4 . . . ......... . . .. 26
Fig. 15 The Lumping Together of Close Average Points . 27
Fig. 18 The Partition for Iteration 5 ......... ... 28
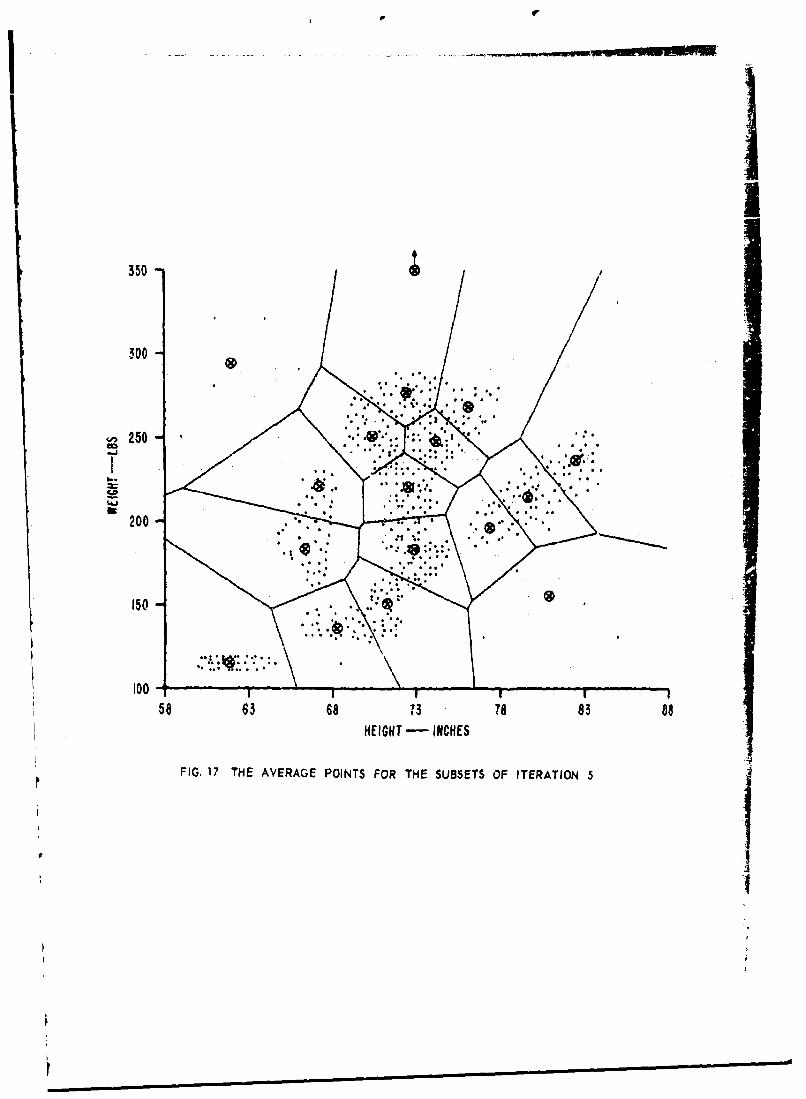
Fig. 17 The Average Points for the Subsetsof Iteration 5 . . . . . . . . . . 29
Fig. 18 The Average Points for Iteration 6 ...... 30
Fig. 19 The Final Average PointsAfter Several Iterations ........... ... 31
Fig. 20 A Flow Diagram Showing the Computational Cyoleof ISODATA-POINTS .... .............. ... 33
Fig. 21 The Principal Components of the Weight vs. HeightData of the Two-Dimensional Illustrative Example 43
Fig. 22(a) Ten Waveforms Representing the Ten-Dimensional
Prototype Patterns
Fig. 22(b) Two Nearly Identical Prototype Waveforms . . . 47
Fig. 23 The Average Distance of a Patternfrom its Closest Cluster Point vs. the Numberof Clusters for Iterations 1-7 ........ 52
rzp

LIST OF XLLUSTRATIONS (continued)
Fig. 24 Classiflca, on of Patterns Based on Distancefrom Piecewime-Linpar r.,,vae ......... !; ,1
Fig. 25(a) Implementation for Finding Euclidean Distanceof a Pattern from a Point 57
Fig. 25(b) Implementation for Finding Euclidean Distanceof a Pattern from a Line . . . . . . . . . .. 58
Fig. 25(c) Implementation for Finding Euclidean Distance
of a Pattern from a Plane .......... .. 59
Fig. 26 An Optical Panel for Inputting a High-DimensionalPattern into an ISODATA System ........ 6u
Fig. A-1 An ISODATA-LINES Curve Fitted to a gotof Hypothetical Data (The Trajectory
of the Word "seroe) . . . ...... .. .A-
Fig. A-2 An ISODATA-PIANRS Surface Giving Z as aFunction of X1 and X. ...... ............ . . A-3
Fig. A-3 Considerations Affecting the Adjustmentof ISODATA-LINES Curves ........... A-$
Fig. A-4(a) rhe Subset of Patterns Associatedwith Two Line Segments
Fig. A-4(b) The Cluster Points Affected by Particular
Patterns
Pig. A-4(c) The Proportion of Cluster Point ModificationCaused by a Single Pattern .......... ... A-7
Fig, A-5(a) Splitting by Creating New Line Segments
Fig. A-8(b) Splitting by Creating a New Cluster Point , A-S
i
' ~iv .
Sm* " • m m m m m i m -.4
I
ABSTRACT
ISODATA, a novel method of data analysis and pattern classification,
is described in verbal and pictorial terms, in terms of a two-dimensional
example, and by giving the mathematical calculations that the method uses.
The technique clusters iany,-variable data around points in the data'@
original high-dimensional space and by doing so provides a useful descrip-
tion of the data. A brief summary of results from analyzing alphanumeric,
gaussian, sociological and meteorological data is given.
In the appendix, generalizations of the existing technique to cluster-
ing around lines and planes are discussed and a tentative algorithm for
clustering around lines is given.'P',
p 1
1I
SJ~.,

. ,, • , i T - . . .
.4
ISODATA, A NOVEL METHODOF DATA ANALYSIS AND PATTERN
CLASSIFICATIONI
by
Geeffrey H. Ba!1 and David j. HallStanford Research Institute
I INTRODUCTION I.In this paper we discuss a technique for dealing with problems in
which the data are inherently described in many dimensions, where eachdimension correspinds to a variable of the problem. Such problems arevery commonplace, and many which are customarily described in terms ofa small (3 to 10) nunAl Q. dcmansions are in fact of a much larger di-mensionality, but have been simplified in order to allow manipulation(and description) of the data. Such collapsing of the problem is oftenuseful and suitable, indicating the preponderant importance of certainof the parameters. However, there remains a class of problems for whichsuch collapsing destroys significant interrelations between the parametersthat would give the data meaning.
II PATTERN RECOGNITION PRJ9PROCESSING AND CIASSIFICATION
The area of research labelled "pattern recognition" consists pri-.
marily of efforts to develop techniques capable of dealing with problemsof inherently high dimension.
Many aspects of the pattern recognition problem are, in fact, dataanalysis called by a different name. Realizing this, we feel free todiscuss ISODATA in the context of pattern recognition (which is our back-
ground), although others might prefer "automatic data analysis" as thelabel for our work.
One statistician, John W. Tukey, has stated that, in his mind, dataanalysis includes, among other things: "procedures for analyzing data,techniques for interpreting the results of such procedures, ways of plan-ning the gathering of data to make its analysis easier, more precise andmore accurate, and all the machinery and results of (mathematical)
Examples of such problems include automatic speech recognition, medical
diagnosis, alpha-numeric character recognition, sociological question-
naire analysis, and weather prediction.
21
45

statistics which apply to analyzing data."
2Dr. Tukey goes on to say that he considers data analysis as ascience in the sense that it has:
a) intellectual content
b) organization into an understandable form
c) reliance upon the test of experience as the ultimate Istandard of validity.
As a science he feels that,
a) "Data analysis must seek for scope and usefulness ratherthan security.
b) Data analysis must be willing to err moderately often inorder that inadequate evidence shall more often suggestthe right answer.
c) Data analysis must use mathematical argument and mathe-matical results as bases for judgment rather than anbases for proof of validity."
We feel that our work on ISODATA fits this description of data anal-ysis. Since we have also been able to describe ISODATA in the terminologyof pattern recognition, we feel justified in relating data analysis topattern recognition. Our work on ISODATA-POINTS has concentrated pri-marily on developing the algorithm and demonstrating experimentally thatit works on both real and artificial data. We are now engaged in study-ing the algorithm analytically and in comparing it to both other cluster-
ing techniques and to existing multivariate statistical mothods.
A convenient (though not usually well-defined) division of thepattern recognition problems is:
1) Design and Evaluation of Transducers--here "transducers"
are those parts of a pattern recognition system thattransform a physical phenomenon into a set of electricalmeasurements or optical patterns that are in a formsuitable for the preprocessor.
2) Design, (Automatic) Synthesis, and Evaluation of Pre-processing--here "preprocessing" Is that part of thesystem that transforms the measurements from the trans-ducers into multi-dimensional patterns. This transforma-tion should enhance the differences between classes wewant to discriminate. At the same time it should preservewithin-class similarities.
3
Ii
3) Design, (Automatic) Zy....... s, and Evaluation of t!.u
Categorizer--here the categorizer is that P*'L thattransforms the patterns from the preprocessing intolabels (output codes) associated with each set orclass of natternq.
In the design of the 'preprocessing" to do automatic classification,a first Sub-task ib Lu dlldlyse e representative set oi patterns. Manypresent preprocessing evaluation techniques, even when used on a set ofrepresentative data, give little information aq to how to modify the Ipreprocessing technique in order to improve it.
In order to know whether we can improve the preprocessing we mustbe able to distinguish between:
1) poor performance of the preprocessor, and2) inherently difficult data. :
The proposed technique has demonstrated its ability to lay bare thestructure of the data. ISODATA can be used to evaluate preprocessing -by comparing the clustering before the preprocessing with the clusteringafter the preprocessing. This makes it possible to evaluate the pre-processor with respect to the inherent difficulty of the data. Theclear picture of the data that the researcher obtains using this techniquehelps him to modify the preprocessor so that thu resulting patternsare structured in a more suitable manner. We have found that under-standing the structure of the data is also suggestive of now ways fortransducing the physical phenomenon.
In the classification of patterns a primary problem is the obtainingof an economical description of the patterns. Due to the complex natureof patterns arising from the real world, a description not rigidly con-strained by a number of a priori assumptions is desirable, The class
of techniques we describe has the characteristic that its descriptionof the data is determined primarily by the data and is self-adjustingin a way that makes this description economical.
In discussing this technique we concentrate on using it for theanalysis of data, We see the technique as specifically applicable to:
1) The design of preprocessing (and also more conventionaldata analysis), by allowing the examination of thestructure of multidimensional data in the original high-dimensional space; and
2) Classification of patterns, by finding the structure ineach class of patterns and providing an economicaldescription of the classes of patterns against which apattern of unknown class can be compared and so assignedto a specific class.
4
III THE TECHNIQUE*!
ISODATA, as the derivation of the name suggests, is a collectionof ±terati-r- i~v,. .t s uLto , e 1Lmpt to summarize all of the
finest nuances extractable from the data. Rather it focuses on central Itendencies and the major structure of the data. As ISODATA jt qnrma ,used, 1L ib a compromise between attempting to store and analyze everydetail and aspect of the data right from the start (if desirable, tiis
can be done later in the analysis on limited portions of the data) and anapproach that averages virtually everything together. (In fact, if itwere desirable for some reason, either extreme is attainable by appro-
priate selection of certain process parameters that control ISODATA,)
It is not practical to compare all patterns with all other patternsfor large numbers of patterns. Rather the procedure compares patternswith a set of clusters constructed from subsets of the patterns them-selves, and groups patterns together on the basai of these comparisons.The comparisons are made by establishing a measure of distanco in the
measurement space. Patterns are groupeo.together if they lie closestto the same "description of a cluster." The number of clusters usedby the technique varies in a way that depends on the structure of thepatterns in measurement space and on the ISODATA process parameters thatthe researcher controls.
When used on data for which categorization information is not avail-able, ISODATA finds a good approximation to the natural structure of thedata, rather than trying to impose an assumed structure on the data. Byclustering only one class of patterns at a tMa,,e, categorization informa-tion can be usedin conjunctionwith ISODATA to structure the data for aspecific pattern classification problem; a probability distribution ofthe data need not be known or even assumed to exist. The development ofa computationally-simple method that could be implemented for patternsof more than 1NO dimensions (e.g., optical patterns and complex waveforms)was an important factor guiding the development of this technique.
The simplest type of ISODATA is ISODATA-POINTS. This technique isdescribed ir the next section. In Appendix A we discuss ISODATA-LIENS andISODATA-PLANES, two generalizations of ISODATA-POINTS. There we give atentative algorithm for ISODATA-LINES. Though neither of these general-izations has yet been programmed, we feel them to be relatively straight-forward generalizations of ISODATA-POINTS.
With apologies for adding another acronym to the growing list, we have
coined ISODATA to represent Iterative Self-Organizing Data AnalysisTechniques A. (The "A" was added to make ISODATA pronouncable.) Theclassically-oriented can dertve it from ISO, meaning "the same" or "like,"+ Data.)*Here we uee "cluster" in a general way--allowing it to mean a set ofpatterns grouped around a point, a line, or a plane. Hence the "descrip-tion" is the specification of the point, line, or plane around which thepatterns are clustered.
IV DETAILED DESCRIPTION OF ISOII&TA-POINTS
Ir this section we describe ISODATA-POINTS from four points of
view, each succeeding point of view being more precise than the last.
The four points of view are:
(1) Verbal
(2) Pictorial
(3) Two-dimensional Illustrative Example
(4) Mathematical
We also give the results of a principal components analysis (a moreconventional statistical analysis technique) on the same data so thatthe results of it can be compared with the type of results obtainedusing ISODATA-POINTS.
A. Verbal Description
ISODATA-POINTS is an iterative procedure for the sorting ofa set of multi-dimensional (multi-variable) patterns into subsets ofpatterns. An average pattern is used to represent each subset ofpatterns, and the iterative process, by changing the composition ofthese subsets, creates new average patterns. These new average patternsdefine new subsets each of which has reduced variation about the averagepattern. The process also combines average patterns that are so similarthat their being separate falls to provide a significant amount ofadditional information about the structure of the patterns.
B. Pictorial Flow Diagram
We show a pictorial flow diagram of IS0DATA-POIH in Fig. 1.In line with our considering ISODATA as a procedure for sorting patternswe show the patterns being fed into a sorter, one at a time, from a"pattern hopper. " The patterns are sorted into subsets on the basis ofdistance from a set of cluster points--each pattern going into that sub-set associated with the cluster point to which It, the pattern, isclosest. The cluster points themselves are obtained as an output ofthe previous iteration. The set of cluster points for the first Itera-tion must be provided by the researcher.
The selection can be arbitrary, since the results of clustering havebeen found experimentnlly to be nearly independent of the choice of theinitial cluster points. Usually, however, a wise choice reduces sig-nificantly the number of iterations needed for satisfactory clustering.We have found it best to use a subset of the patterns randomly selectedfrom the training patterns as the initial cluster points. 4
6

PATTERN REICLTE SPL ITIHOPPER W''EP~RTS
POINT I POINT 2PON n
EUST USET 0 a 0 SUBSE T
RECIRULATS PATERN COMPUTES FOR EACH SUBSET:AFTER ALL ARE SORTED, 1) AVERAGE VALJE
f2) STANDARD DEV:AT IONI..J) OF EACH COMPONEENT
AVES VEURAEVLU2 AEVLE 3) NUMBER OF PATTERNS,
CLUSTER "INFO" HOPPER
VALVE 1 ( 8 0)
VLE2DISCARDED SMALLVALVE 2CLUSTERS
PATTERNS 90 TO SPLITTER If: PATTERNS GO TO LUMIPER if:I) ODD-ITERATION 1) LAST ITERATION,
OR SLTE (0)LUMPIER (8C OKPLIMAN 2) EVEN ITERATION,
CLA I N (RAE OECLUSTERS) ASDC$NMERO LSES ORWANTED 3) TWICE AS MANY
FIG1A XICTORIALVDESCITO OFDEAT-N SIE
IT 00
After all patterns have been sorted, the average of each of thesubsets of patterns is computed, and the sample standard deviations ineach dimension of each subset are determined. The average patternvector, the standard deviation in each dimension for each subset, andthe number of patterns in each subset are then passed on into the"Cluber iniormation Hopper."
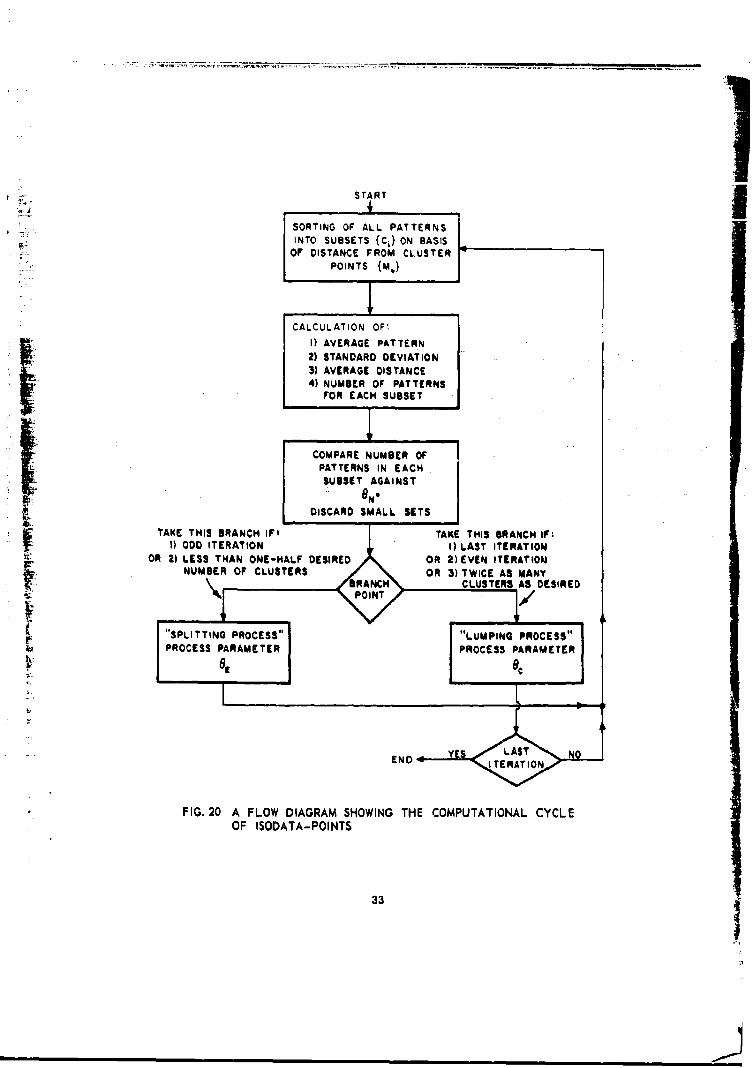
Those small clusters (with few.r than - clcannta) are diavarded at"Valve 1." The positioning of "Valve 2" is §etermined by the number ofthe iteration and by the total number of clusters, an indicated on thediagram.
The criteria and method of splitting and lumping of clusters aregiven in detail in the next two sections. Splitting takes place if thestandard deviation In any dimension is greater than _ and also if both(1) the cluster has enough members to split and (2) hal high averagedistance between its mean and the patterns in its subset.
Lumping occurs between, at most, the L pairs of means that are lessthan Sc apart. (The process parameters Sit act ON, and L are all suppliedby the researcher.)
After each lumping or splitting, the modified set of average points
is used as the set of c'I-iter points for the next Iteration and placedin the "Sorter Box."' The program ends when the number of iterationsperformed equals the number specified by the researcher. At this stage,the cluster points should adequately "fit" the data.
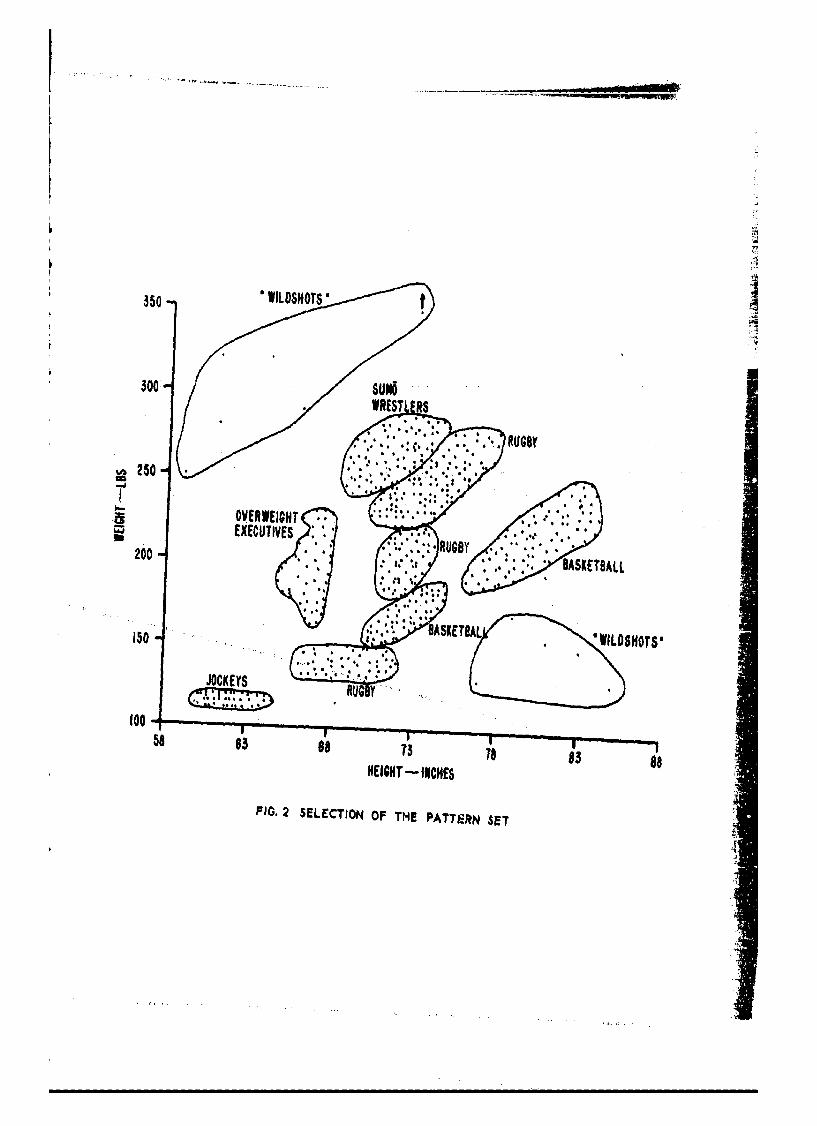
C. Two-Dimension Illustrative Example
In order to illustrate the details of I8ODATA-POINTS we havecontrived the set of two-dimensional patterns shown in Fig. 2. The twodimensions are height and weight. The patterns (the points shown inFig. 2) are intended to represent the height and weight of typicalprofessional athletes.
Given these points to cluster, the ISODATA-POINTS techniqueproceeds in a manner that we illustrate in Figs. 2-19. Each figureillustrates a major step in the computer'program. (The actual figuresare placed after the explanatory text for all of the figures and canbe folded out.)
The clustering shown in this example was found by running theexisting ISODATA-POINTS computer program. One particularly interestingaspect of this run is the way in which the technique found and isolateda number of points lying virtually alone. This offers one approachto treating "wild shots" in the analysis of data, since they aresingled out for further study or for discarding.
58
-OM a f -
Figure Step
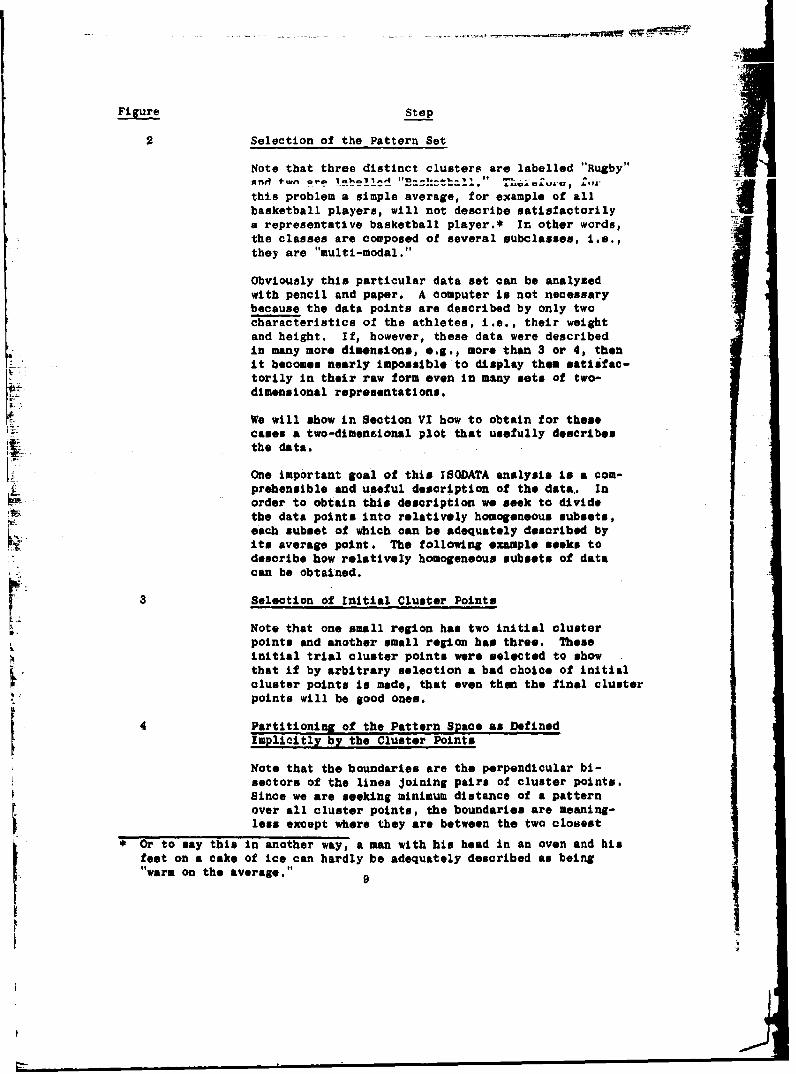
2 Selection of the Pattern Set
Note that three distinct clusters are labelled "Rugby"and twn or- Von1-• =! t. • , to ...T. lJ
this problem a simple average, for example of all
basketball players, will not describe satisfactorilya representative basketball player.* In other words,the classes are composed of several subclasses, i.e.,they are "multi-modal."
Obviously this particular data set can be analyzedwith pencil and paper. A computer is not necessarybecause the data points are described by only twocharacteristics of the athletes, i.e., their weightand height. If, however, these data were describedin many more dimensions, e.g., more than 3 or 4, thenit becomes nearly impossible to display them satisfac-torily in their raw form even in many sets of two-dimensional representations.
We will show in Section VI how to obtain for thesecases a two-dimenzional plot that usefully describesthe data.
One important goal of this ISODATA analysis is a com-prehensible and useful description of the data.. Inorder to obtain this description we seek to dividethe data points into relatively homogeneous subsets,each subset of which can be adequately described byits average point. The following example seeks to"describe how relatively homogeneous subsets of datacan be obtained.
3 Selection of Initial Cluster Points
Note that one small region has two initial clusterpoints and another small region has three. Theseinitial trial cluster points were selected to showthat if by arbitrary selection a bad choice of initialcluster points Is made, that even then the final clusterpoints will be good ones.
4 Partitioning of the Pattern Space as DefinedImplicitly by the Cluster Points
Note that the boundaries are the perpendicular bi-sectors of the lines Joining pairs of cluster points.Since we are seeking minimum distance of a patternover all cluster points, the boundaries are meaning-less except where they are between the two closest
*Or to say this In another way, a man with his head in an oven and hisfeet on a cake of ice can hardly be adequately described as being
"warm on the average." 9
t!

Figure Stpcluster points. Hence the piecewise-linear natureof the boundary.
t|Initial Partition
Note that the patterns are assigned to only one syb-
set, and that all subsets are contained in convexvolumes of pattern space. Note also that the initialpartition is not a good one. Subsets having fewer
than BN elements would be discarded at this point.
(eN is a researcher-3upplied process parameter.)
It may be helpful in this particular example to thinkof the data points as representing men standing in alarge field. The men are positioned in the field Inaccordance with their weight and their height, Thepartitions that divide the data points into'sub-sets can be thought of as "fences" dividing the men
into groups. The cluster points can be consideredas "group leaders" to whom the men owe temporaryallegiance, i.e., a man owes his allegiance to theclosest group leader. An we shall see, in the XB0DATA
process group leaders come and go (it was ever thus).
SFinding the Average Point of Each Subset
S. After the first iteration the ISODATA average pointsbecome cluster points.
7 Splitting of the Average Points takes place when
(1) the maximum standard deviation exceeds 0 (aresearcher-supplied I8ODATA process paraleter)and either 2 or 3 is true.
(2) the number of patterns in a subset exceeds
(20 + 2) and (when the average distance ofpatterns in subset i from the average pointof subset i) exceeds D, the average distance
of a pattern from its closest average point.NROWS is the number of clusters
* A volume is convex if the straight line connecting any two points inthe volume lies entirely within the volume.
10
-~ --.. ~ ----- ~. -.---- .... ...
Filere Step
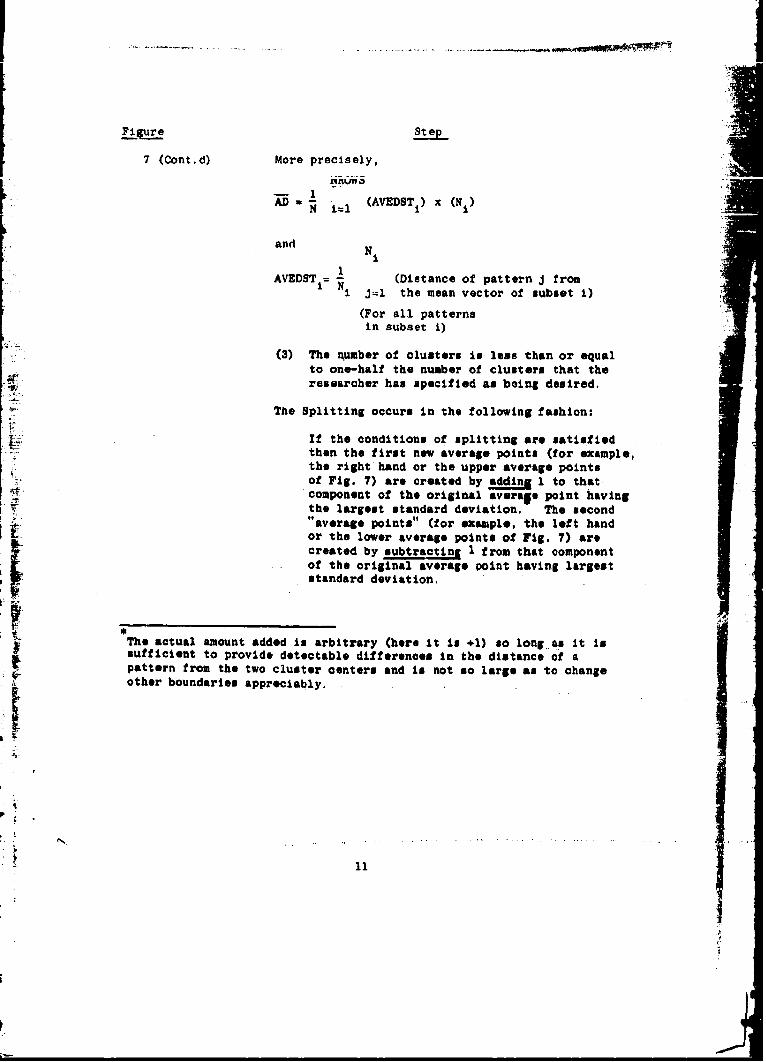
7 (Cont.d) More precisely,
AD1 i (AVEDSTt) x (N )
and N
AVEDST = - (Distance of pattern J fromN N1 J=l the mean vector of subset i)
(For all patternsin subset i)
(3) The number of clusters is less than or equalto one-half the number of clusters that theresearcher has specified as being desired.
The Splitting occurs in the following fashion:
If the conditions of splitting are.satisfiedthen the first new average points (for example,the right hand or the upper average pointsof Fig. 7) are created by adding 1 to thatcomponent of the original averape point having
the largest standard deviation. The second"average points" (for example, the left handor the lower average points of Fig. 7) arecreated by subtracting 1 from that componentof the original average point having largeststandard deviation.
The actual amount added is arbitrary (here it is +1) so long..as it issufficient to provide detectable differences in the distance of apattern from the two cluster centers and is not so large as to changeother boundaries appreciably.
S~11
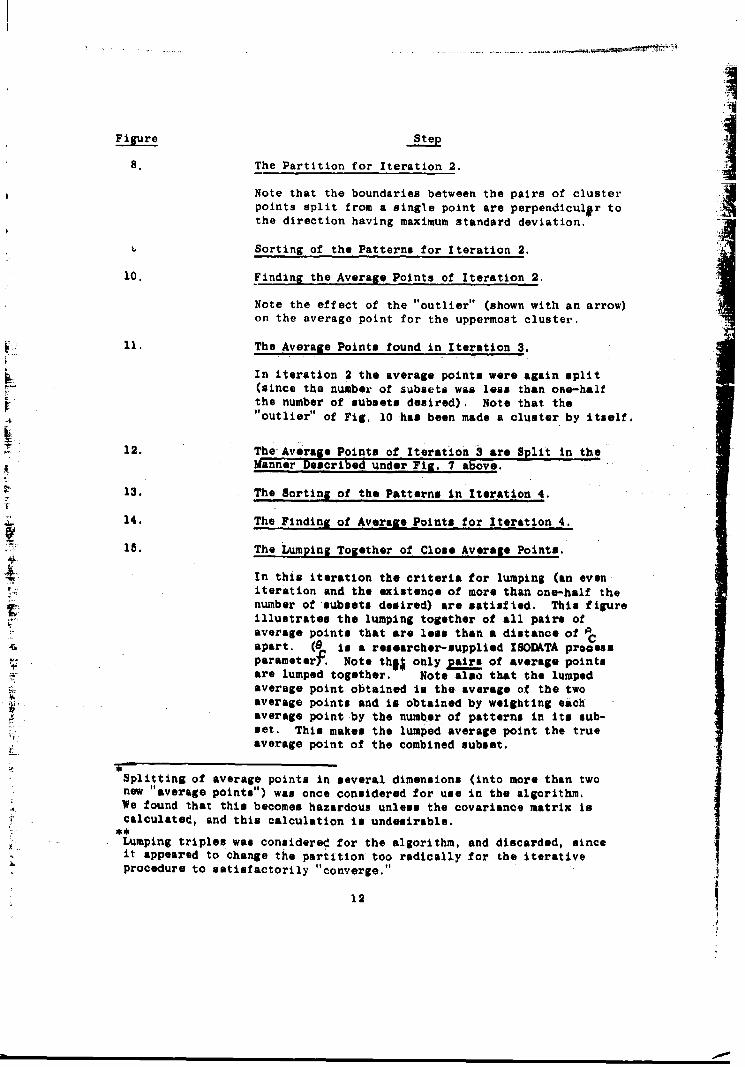
Figure SLtep
8. The Partition for Iteration 2.
Note that the boundaries between the pairs of clusterpoints split from a single point are perpendiculpr tothe direction having maximum standard deviation.
Sorting of the Patterns for Iteration 2.
10. Finding the Average Points of Iteration 2.
Note the effect of the "outlier" (shown with an arrow)on the average point for the uppermost cluster.
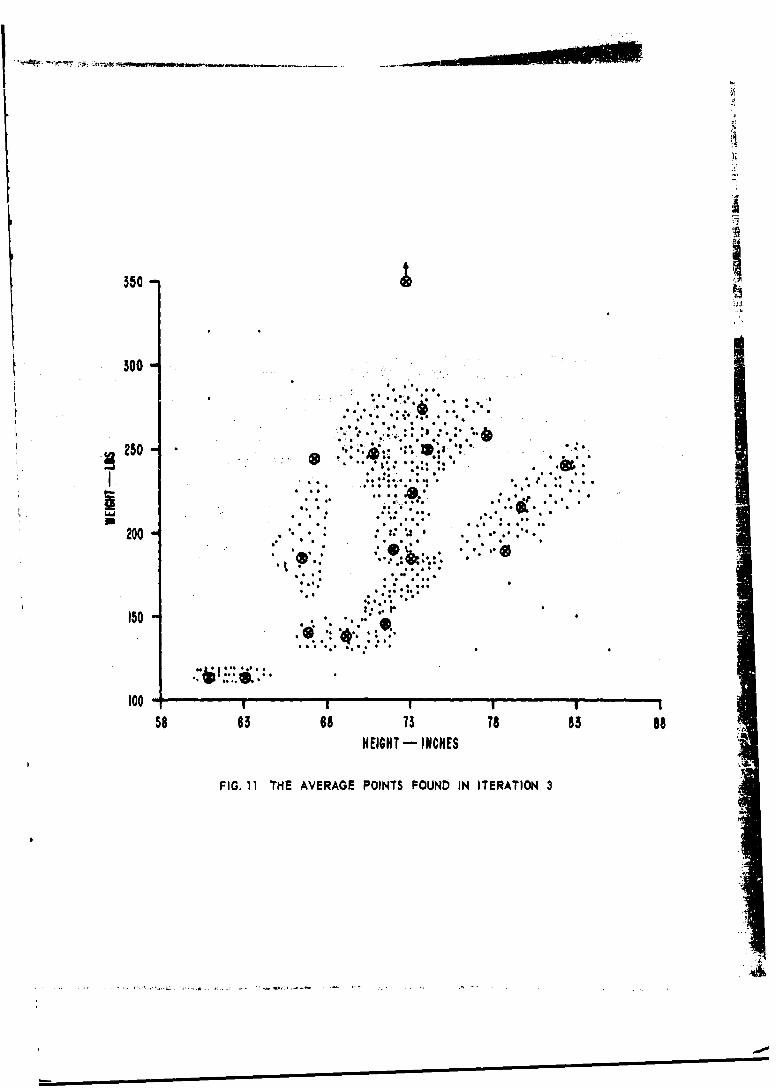
11. The Average Points found in Iteration 3.
In iteration 2 the average points were again split(since the number of subsets was less than ose-halfthe number of subsets desired). Note that the"outlier" of Fig. 10 has been made a cluster by itself.
12. The Average Points of Iteration 3 are Split in the
Manner Described under Fig. 7 above.
13. The Sorting of the Patterns in Iteration 4.
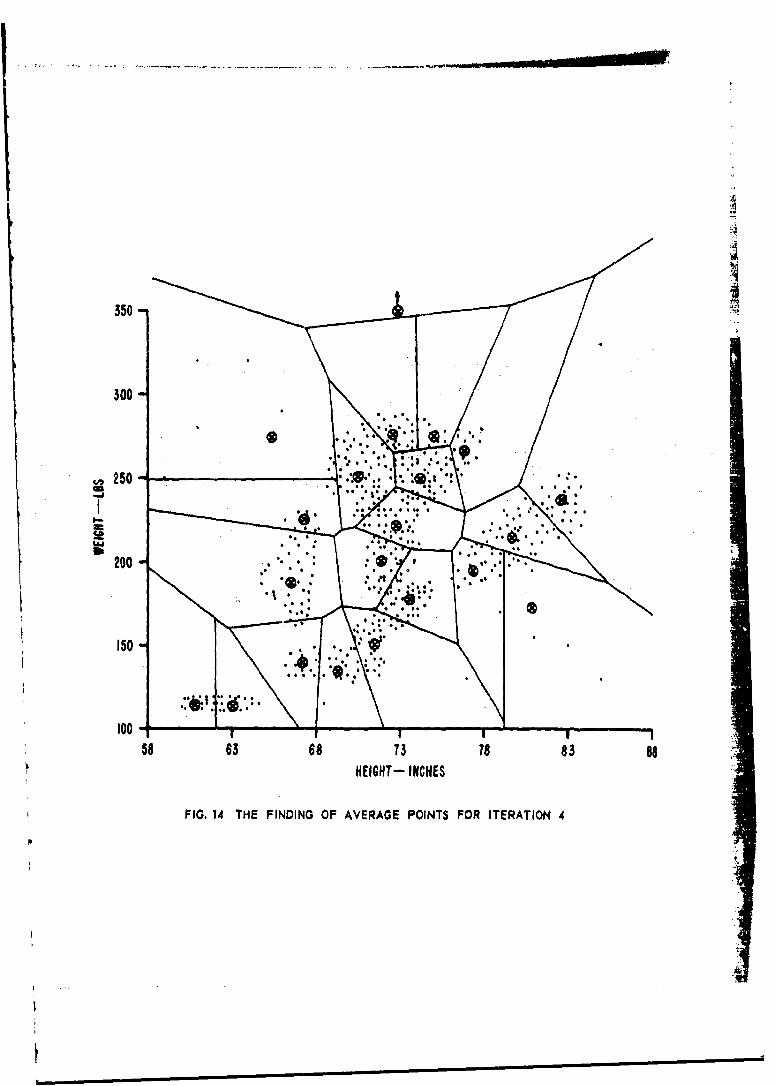
14. The Finding of Average Points for Iteration 4.
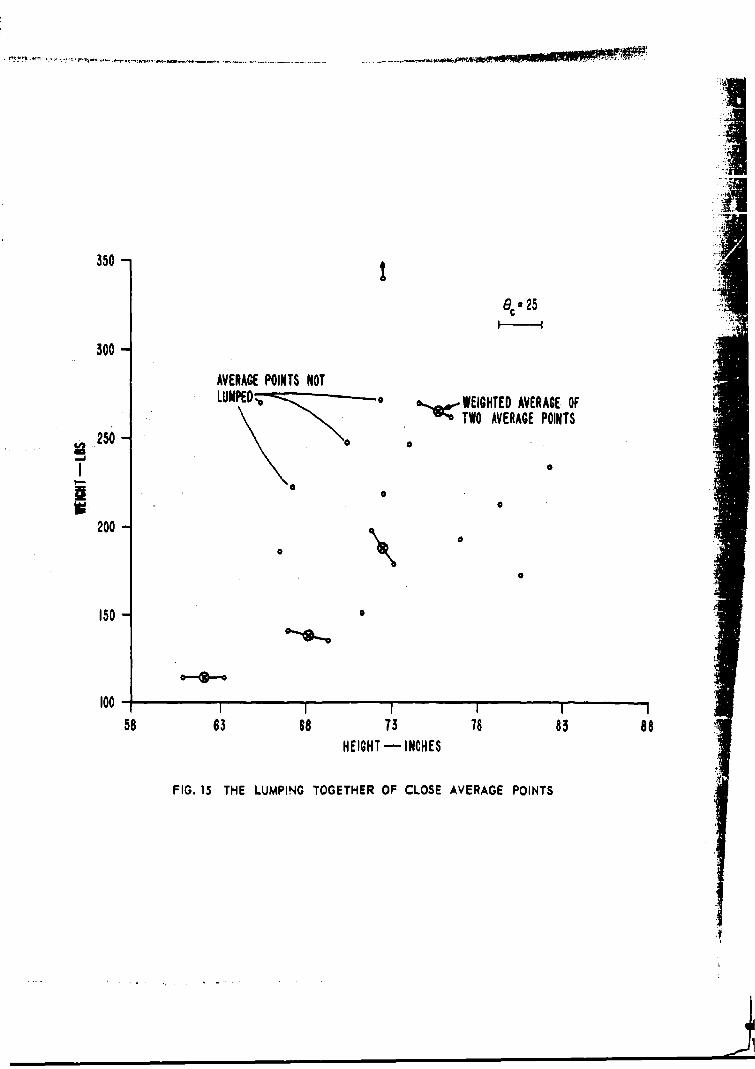
15. The Lumping Together of Close Average Points.
In this iteration the criteria for lumping (an eveniteration and the existence of more than one-half thenumber of subsets desired) are satisfied. This figure
W,• illustrates the lumping together of all pairs ofaverage points that are less than a distance of'*apart. (i is a researcher-supplied ISOIATA processparameterf. Note th#$ only pairs of average pointsare lumped together. Note also that the lumpedaverage point obtained is the average of the twoaverage points and is obtained by weighting eachaverage point by the number of patterns in its sub-set. This makes the lumped average point the trueaverage point of the combined subset.
Splitting of average points in several dimensions (into more than twonew "average points") was once considered for use in the algorithm.We found that this becomes hazardous unless the covariance matrix iscalculated, and this calculation is undesirable.
* Lumping triples was considered for the algorithm, and discarded, since
it appeared to change the partition too radically for the iterativeprocedure to satisfactorily "converge."
12

Fiere Step
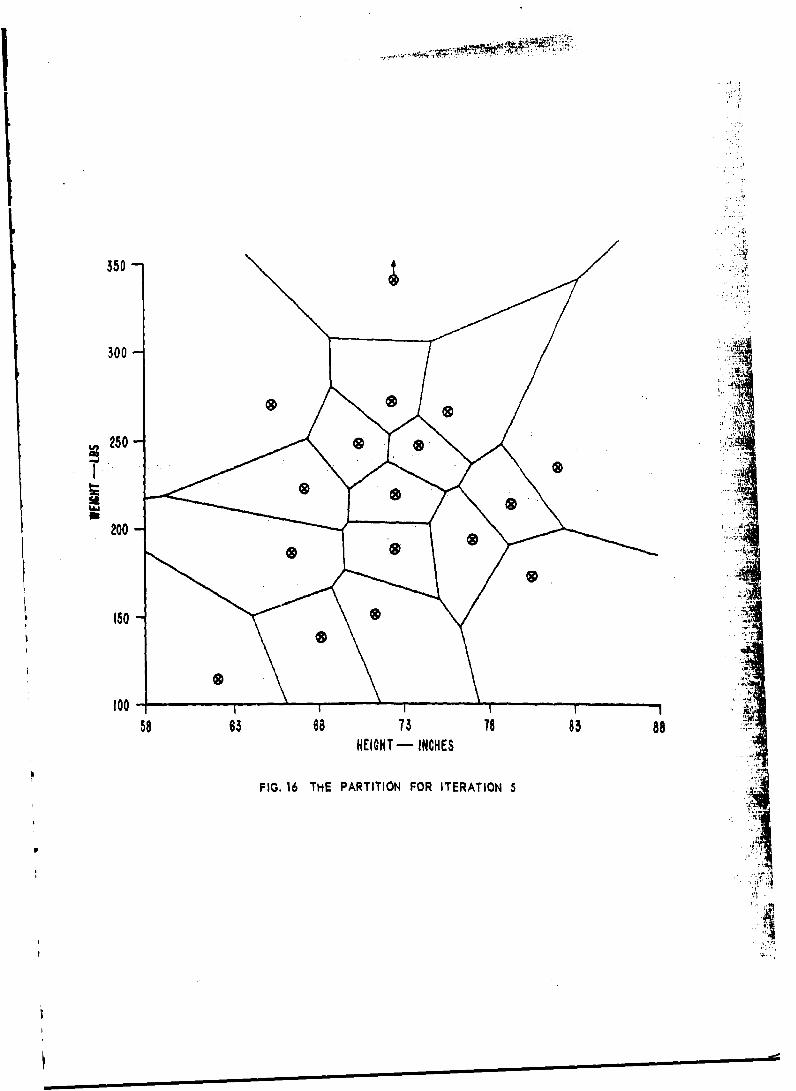
16. The Partition for Iteration 5.
17 Th... &,,o,.o D1j6t-
18. The Average Points for Iteration 6.
In the previous iteration, six average points weresplit. In this iteration four pairs of average pointswill be lumped together. These four pairs of pointsare indicated by being circled.
19. The Final Average Points After Several Iterations.
No splitting or lumping is allowed in this finaliteration, which is principally for consolidation.
We feel that these 19 average points do quite ade-quately describe this set of 562 data points witha 30:1 reduction of the number of points, Naturally,no description of the original data points whichprovides a similar amount of reduction can be asaccurate as the original data itself. However, areduced data description is often more useful thanthe more accurate but much more voluminous version.
Note the way theo "wild shots" or "outliers" have
been found and isolated by assigning them to clustersof their own. These wild shots can now be examinedfor their importance--either an a rare occurrence
well worth noting,or as an equipment malfunction.
We terminated the iterative procedure after itera-tion 7, because the clustering obtained seemed quiteadequate. If it had been necessary, we could havegone on by continuing the lumping and splitting,starting at the end of iteration 6. Our experiencehas shown that abgut six iterations are adequatefor many probleus -- adequate in the sense that thenumber of clusters is stable and the subsets rela-tively homogeneous,
We can, by increasing 0D and increasing 0 reduce thenumber of clusters we obtain. Decreasing them bothwould increase the number of clusters,
The number by each average point gives the number ofpatterns in that cluster.
We are presently seeking better criteria for terminating the itera+ions.
13
WILDSH-T350
300
a OVERWEICHTEXECUTIVES
200RUB
150 ASETBALWILDS$oTS@
10058 63 is 7 83 as
HEICT -liNC"Es
FIG. 2 SELECTION OF THE PATTERN SET
350- t
500 -. ** e .
C, %. *o . .; , * :• .:.. : .. . . ".
2•5- •": lFIG. 3 S O IA CLUSTER * **C C /• [R"**** C ** *POINTS .C b e ... .. . - : • .*...*
C C20 :* :'... 1. . .: '.
* J C
- , *.: * .I'.., .
Q• ~ * t • C •C. ..C...1. . .
*SCC *
I00k '"auiiv . ..5 66 75 78 83 88
NEIONT - INCHES
FIG, 3 SELECTION OF INITIAL CLUSTER POINTS

350
300
~CLUSTER POINT I
250 -CUTRPIT3 LS
200
100TH
150 836 57 30
HEICHT - INCHES
FIG. 4 PARTITIONING OF THE PATTERN SPACE AS DEFINED IMPLICITLYBY THE CLUSTER POINTS

350 -
300 81 BEI
250 - SUBSET3E
200 - I l
SUBEIGT 4 ."
FIG. 5 SORTING OF THE PATTERNS FOR ITERATION IiJSING THE INITIlL PARTITION
M OF
350
300
*AVERAG ON
~~50AG POIEANTPIN
200 - AVERAGE POINT
200GH - NC
FIG.~ ~ ~ ~ ~~AERG 6PIDNGTEAORGIPITOFECTSBE
POINT

350 -
300 -
AVERAGE POINT SPLIT2 -FRON AVERAGE POINT I
T AVERAGE POINT SPLIT GiAVERAGE POINT SPLIT
FROM AVERAGE POINT 3 FROM AVERAGE POINT 2
200
ISO , AVERACE POINT SPLITFROM AVERACE POINT 4
®AVERAGE POINT 5(NOT SPLIT)I00- 63I I ' I u'
58 63 $1 73 T8 83 88
HEIGHT- INCHES
FIG. 7 SPLITTING OF THE AVERAGE POINTS
p1
m • m m m
I ", - • °,• •' W W .•-_.___ __ _ __ _ __-_ _ ___.______- --.-- _ - l f lll m•
I
350
300
250
200
150
100-58 63 s8 T3 To 83 88
HEIGHT-INCHES
FIG. 8 THE PARTITION FOR ITERATION 2
p-
350 -
300 -
250 .
.- ,- .S/
'200
150
10058 65 se is is 88
HEIGHT- INCHES
FIG. 9 SORTING OF THE PATTERNS FOR ITERATION 2
p_ _ _ _ . •: "
I ' .. . - ' "tl oe ee •• •
S_ . . . ..

350 -
300 -*e eo**e~ S •
*~e *Je ** bo o e *e
250 .. . " . .' :
8 Is ol, T3 is e
... .:: __,. .. • .. . - .
h-C - IN CH
I* G* * *N TO** O
ae • e C.• , • * e ,CC *** *o •
"" .* '. .*
250 " ': " a*
* C
I00-
56 65 Os 73 16 65 86HEIGHT - INCHES *
FIG. 10 FINDING THE AVERAGE POINTS OF ITERATION 2
1.4
300 - ,:S ..- . ,
".. .,,": :a..
150. . i . . .
H iICH - I N HES
FIG. 1., S .N.. .S U . . "R"#*® .. _ .*. . .. . I ,:
.. .. ,. *- . .1 . •..* . . ... :, "..*.,' : • ,
* *:'*. *':: b.,:." • ..*~ *:*.. *o
., , . ." .
200 " •* : *:-''* "
"**:' ' : : ~::: i
...** .* . .. ;.::+.:' :.,*-. .....:..
58 03 68 13 78 83 88HEIGHT -- INCHES
FIG. 11 THE AVERAGE POINTS FOUND IN ITERATION 3
-t"4!.
i i i S ' i i i .

400-,
3501
~250 d
200
150
58 63 68 73 18 63HEICHT - -NClES
FIG. 12 THE AVERAGE POINTS OF ITERATION 3 ADR SPLIT IN THE MANNERDESCRIBED UNDER FIG. 7 ABOVE

350
300
200
58 63 68 15 7 83 88HEIGHT - INCHES
FIG. 13 THE SORTING OF THE PATTERNS IN ITERATION 4
p; . '0
350 -
300
~,250
200150 - ' . .. "
100w58 63 68 T3 is 83 88
HEIGHT- INCHES
FIG. 14 THE FINDING OF AVERAGE POINTS FOR ITERATION 4
200 .. ".; .'
"FA350 -i
6c .25
300 -
AVERAGE POINTS NOTLUMPED-O * 0 &,,,.WEIGHTED AVERAGE OF
,TWO AVERAGE POINTS
S250 -I0
aJ200
150 -•-
100 I
58 83 68 75 78 83 88HEIGHT - INCHES
FIG. 15 THE LUMPING TOGETHER OF CLOSE AVERAGE POINTS
350
300
~250
200 --
150
58 63 ea TS 18 83 88HEIGHT - INCHES
FIG. 16 THE PARTITION FOR ITERATION 5
F ii
I i
350
300
200 -
150 "
58 63 68 l13 1883 88HEIGHT - INCHES
FIG. 1? THE AVERAGE POINTS FOR THE SUBSETS OF ITERATION 5
• •F
ee oI

i
350 -
300
2000
6I * *I *•®.* ": .® .: ". .* : ...
58 5 so 3 18 83 88
~250 •*,.:.. . ." • ,..,:
""T I N S :_._,. 18 .T A P FO I
• .. ~ . .:. :;.- -:. .. 2 .ISO," .. • ,0"" " . " 1
* • , • "'*.0 ' .'.
• ,0.0:-"58 5 6 1 :"838 .: : - -" - - .I
HEIGHT-m INCHES
FIG. 18 THE AVERAGE POINTS FOR ITERATION 6
I

350 10I)
* €2). 3300 (44)
*(S)0 4.* . ).®*•.' :. ' ' : :,.
2 0 0 - ", ' • " ' .. : . : ( 3" : ')
~ ;: (23)
"(32)
150.. ) ..*"( G (2) .
" * U. *U . ' * .. • '
(58) 0?U
58 63 s8 73 18 83 88HEIHT - INCHES
FIG. 19 THE FINAL AVERAGE POINTS AFTER SEVERAL ITERATIONS"• " it

D. Mathematical Description
The details o& the calculations made in the existing ISODATA-vuvint' computer progrum are given in this section.
In Fig. 20 we show a computational flow chart onf the technIniqe.A glossary of the symbols used in the mathematical description is givennext in order to ease the struggle with new notation. Following theglossary we explicitly write the mathematical expression in the sequencecalculated for each significant computation made by the program.
Readers not interested in the details of the computation madeby ISODATA-POINTS can skip this section (i.e. turn to page 42) with outserious lose.
F
The processing time for this program is about
(2.7 x 10⁻⁴ x (number of patterns) x (number of cluster points)
x (number of dimensions)] seconds/iteration
on the B-5500 computer (at $180/hr) at SRI. The program is
written in Algol 60.
32
START
SORTING OF ALL PATTERNSINTO SUBSETS (Cj) ON BASIS
OF DISTANCE FROM CLUSTER
POINTS (M6)
CALCULATION OF:
I) AVERAGE PATTERN2) STANDARD DEVIATION
3) AVERAGE DISTANCE4) NUMBER OF PATTERNS
FOR EACH SUBSET
COMPARE NUMBER OFPATTERNS IN EACHSUBSET AGAINST
DISCARD SMALL SETS
TAKE THIS BRANCH IF, TAKE THIS BRANCH IF:1) ODD ITERATION I) LAST ITERATION
OR 2) LESS THAN ONE-HALF DESIRED OR 2) EVEN ITERATIONNUMBE OF/ CLSESR3 TWICE AS MANYBAC CLUMTER AS CDUEEIRED 3
PON"SPLITTING PROCESS" "LUMPING PROCESS"PROCESS PARAMETER PROCESS PARAMETER
,SIC
END I Y E RA ION
FIG. 20 A FLOW DIAGRAM SHOWING THE COMPUTATIONAL CYCLEOF ISODATA-POINTS
33

SYMBOLS USED IN MATHEMATICAL DESCRIPTION
SYMBOL STANDS FOR JOUND NOS
AD Overall average distance of 6, 10patterns from the average vectorof the cluster to which they areassigned. 1 l•__S
Z= (AVIDSTi) x N,
AV DSTt The average distance of the patterns 4, 6, 10"AVIDST 1 in cluster C from the average
vector (averige point) of that cluster
SN
for all P eCi
Ci The 1 th cluster 2, 3, 4,it, 5, 7
1D The dimension (number of components) 5, 9of a pattern vector.
5 The Euclidean distance between the 12average vector .P for cluster CtlIand the average vector P forcluster C
P
L The maximum number of pairs of 12, 13average vectors that can belumped at one time.
M Tt cluster point (vector) for the 1, 2, 11,
1 cluster 14
341

SYMBOL STANDS FOR FOUND IN .
____ ___ __ ___ ___ ___ ___ ____ ___ ___ ___ ___ ___ ___ STEP NOB.
N The total number of patterns. 2, 6
N. ThR numher nf pattarns in the 3, 5, t1 1 cluster C1 . 10, 13
NROWS The total number of clusters. 2, 4, 5,(Stands for the Number of Rows 6, 7, 9,in the matrix having the cluster 10, 11, 12point vectors as rows, which is 14an NROWS x D matrix.)
P The jth Pattern vector. 2,4
pJ The Ith component of the jth Bpattern vector PJ
P The averasg pattern vector 3, 4, 10,' for the i cluster C 12, 13
thipA The £ component of the avj~ape 5'A pattern vector P for the i
cluster. "
J + The positively "split" part of the 10average vector iP. (See Step 10.)
" The negatively "split" part of the 10average vector iP. (See Step 10.)
CtA The standard deviat n of the ith 5, 9cluster C in the I component(dimenslob)
JulIL11 P CC1 I
35
ii11
0.~ ~- ) - -
SYMBOL STANDS FOR 1TFOUNDoINH___:_ ____________________ _ TSTEP NOS.
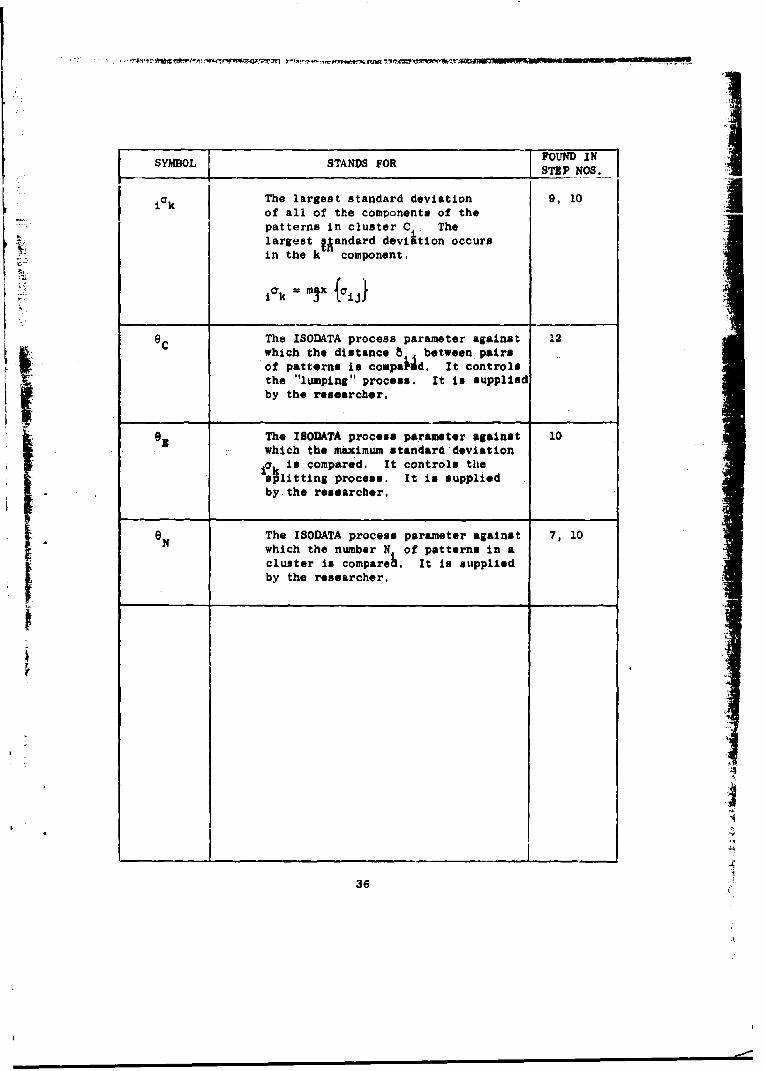
i k The largest standard deviation 9, 10Ii of all of the components of the
"patterns in cluster C Thelargest Aandard deviaition occursin the k component.
i k mi my ij
eC The ISODATA process parameter against 12which the distance 8 between pairsof patterns in compai~d. It controlsthe "lumping" process. It is suppliedby the researcher.
The ISODATA process parameter against 10which the maximum standard deviation
Alk is compared. It controls thesplitting process. It is suppliedby the researcher.
e N The ISODATA process parameter against 7, 10
which the number N of patterns in a
cluster is compare&. It is suppliedby the researcher.
36

STATEMENT OF THE GOAL
Given a set of pattern vnntnra fu Z , -anani.ion . i,the goal of ISODATA-POINTS is to sort 4hem into subsets C,,each having11 members and having small within-group variance, i.e., hnd a sot of
avorage vectors zuch. that vh of these average vectors adequatelydescribes that set of patterns lying closest to it. (Measuree andcriteria for determining when an adequate description of the data hasbeen obtained are being sought.)
The following steps describe in symbols the manipulations showngraphically in the figures accompanying the two-dimensional example
illustrating ISODATA-POINTS.
Step Computation
1. Select arbitrary subset of patterns having NROWSelements. These should be chosen as intelligentlyas possible--i.e., if possible, one from eachknown sub-class or cluster. Create a set ofpoints that are duplicates of this randomly.selected set of patterns. Call this duplicateset the initial "cluster points," = LiiNUOWB]
2. Do for all jal,---,N:
For each pattern P find Xi such that
(P " " M " W M Min (P ' -M '-
where the dot productA'BD D ..,'' aD' bl' bD)
D* Z aib
Assign P to subset Ci** This step sorts the {PJ
into subsets on the basis of distance from the
(M d (see figure below). (Ties are arbitrarily
decided. They almost never occur.) Mii
"Note that the M are not changed during this calculation over all J.
37

Step Computation
3. Compute for all of the i clusters Ci the averagevector iP of each cluster i
P PE piP•i
where N is the number of patterns in cluster Ci.±
NOTE: The E P is obtained as patterns are being sorted.
4. For all i, i=1,.,., NROWS.
Compute the average distance'AVUDBT of patternsin cluster C from the average vectir, of thatcluster.
AVID8T (P N1
2. N1 . -- " ' ,.
For all P j cC
5. For all i, i-l ... ,NROWS, and for all' , Dl,....,Dfind je standard deviation a of the 2 subset
for I" measurement where
Vot
For all P eCI
6. Compute average distance overall, AD, where
NROWSAD -- 2 (AVEDSTi) x N
N i=
This is the average distance of the patterns fromtheir closest cluster point.
38
Ai

Step Computation i
NOTE: Certain parameters e , e , e , L and the total number of
iterations, which will be mentioned in the followingsteps, are provided the program bv the rprha
For Steps 7-10 and Steps 12-13 no use is made of theindlvldila.1 -. ÷terne All calculatiom, ae made based on
means, standard deviations, AVEDSTi, and AD, and the processparameters.
7. For all i, i=l,..., NhtOWS.
If N < 0 then discard the ith cluster, Ci, and reduce thenumbir ol clusters by 1.
(a) If this iteration is the last iteration, set eC= 0 and.skip. to step 12,
(b) If number of clusters is less than or equal to j thenumber desired, then siop the. remaining step in 8 anddo step 9.
(c) If this iteration is an even-nutbered iteAti.on, orif number of clusters is greater than or equal' totwice the number desired, then skip to step 12.
NOTE: Steps 9 through ll'comprise the so-called "splitting"
process.
9. For all i, ifi,.:.,.NROIV, for J=1,...,D., findk and•. ~ ~ ~ i ik such that" .... .
Ik= m jx(i)
10. For each i, i=l,...,NROWS
(a) if iak >8 E and i
((if AVRDST >A5 and if Ni >20 + 2) or
(NROWSS 0.5 x number of clusters desired))
then create "
39

Step . Computation
10.(Cont) .T = .P .. (0 ..... O.+1.0 .... .0)L-Cn,(k cncomponent)
he +1 is placed in this kth component
cl..cmcnt (corresponding to a k ,fur uiuuter i)in order to split the cluster along thedirection having the maximum variation.
i• - i + (0,....o,-1,...,o) (th(k element)
(b) P is replaced by +, and i is added tothe list of average vectors, which increasesthe number of clusters by 1. (See figure below)
tP
x
11. Start the process again at Step 2. Ume the
jP, iml ... ,NROWS'} as the new alt (MJ)inP ace of the existing met {Mo}. (lROWtiu
"the number of clusters after splitting orlumping.)
NOTB: Steps 12 through 14 comprise the so-called "lumping"process.
12. For all i, t-1,..., NUOWS:
For all j > 1, jmi + 1,...,,ROWS:
(1) Compute the pairwise distance 8 between
average points where ii
40

Step Computation
12.(Cont.) (2) If 5 1 < KC then plane 5 ±, • I in an
ordered (3 x L) matrix. ~
"ij "i~j • "LJLI(2 2I
1 12 L
il J2 . ' JL
where . < 5 . < 5i 1iS1 L
NOTE: L (which is 9 9 for programming convenience) controls
the maximum number of pairs of clusters that arelumped together.
13. For all L, I= ,..., L.
If P and iP have not been previously used in
lumping, then
(1) Compute
NP + N [ )+ NN4P)+
(2) Replace tP with iP and delete P from the
list of average vectors (reducing the number of
clusters by 1).
y 4
o il,
14. If more iterations are to be done (this is at dis-
cretion of investigator), start the process again
at Step 2. Use the ( [P, i=1 .... NROWS'] as the new
set (M, in place of Ihe existing set (MU) If thiswas the last iteration, then end process.
41
E. Analysis of the Height vs. Weight Data Using PrincipalComponents Analysis
An alternative method of describing and analyzing the data ofSection C (the two-dimensional example) would be principal components
It may be objected that principal components analysis should notbe applied to data that is as heterogeneous as the data in this two-dimen-sional example. We agree. At least part of our point is that it is noteasy in high dimensions to determine just how heterogeneous the data is.
"The (Principal Component Mlethod) is a relatively straight-
forward way of 'breaking down' a covariance or correlation matrix intoa set of orthogonal components or axes equal in number to the number ofvariates concerned. These correspond to the latent roots and the accom-panying latent vectors .... of the matrix. The method has the property thatthe roots are extracted in descending order of magnitude, which is importantif only a few of the components are to be used in summarizing the data.The vectors are mutually orthogotial, and the componeqts derived from themare uneorrelated." The greatest possible "scatter" of n points pro-
* Jected onto a given number a of cooidinate axes in a k-dimeusional space(a A kI is obtained by this method.
The average point of the height vs. weight data is (724,208),(the inches are multiplied by 10) and the covariance matrix is
[667 1111"
11[ 1 2814]
The first eigenvalue is 3854 and the corresponding eigenvectoris (.936,1.00). The second eigenvalue is 1627 and the corresponding eigen-vector is (1.00, -. 936). In Fig. 21 we have plotted these eigenvectora
as a second set of "coordinate axes" with the mean value of all of the dataas origin. The length of the vectors is proportional to the magnitude of
the associated eigenvalue.
The direction of the first eigenvector indicates that generallythere is a positive correlation between height and weighc; that is, weightincreases with height. This "accounts for" about 70% of the variance.Both height and weight contributed about equally to this component.
The second eigenvector displays ihe extent to which height and
weight are negatively correlated. Again both height and weight contributeabout equally to this component.
The exact values of "scatter" for n data points in k dimensions are given
by Wilks.
42

1%7VX1
I
350 ii300 - llV
(72
-Jm..,25. K/ .
200 .::.: .: : : ?.:
- .. .: 268) K. .
*~ .*.COVARIANCE
2*.3* .MATRIX
~~~~~*. *. .... . . . : ''• ' .. . . ... I . ./.. ..
11~; 2814]
i-" ......
F 200 ," . . ....
F58 63 68 75 13 83 58ojHEIGHT- INCHESRF
1FIG. 21 THE PRINCIPAL COMPONENTS OF THE WEIGHT vs. HEIGHT DATARI
"OF THE TWO-DIMENSIONAL ILLL3TRATIVE EXAMPLE
43
These descriptions relate primarily to directions in the data.The largest eigenvector gives the direction along which a scale should beset up to get maximum variation in thA dat Tf t! ;: Z..-1- •1 4L•Ianaiysis is to find such a scale, then this is a very reasonable analysistechnique,
However, such "direction-finding" techniques tend to ignore
details in the data such as the existence of isolated clusters, e.g., thecluster around the point (62", 115 lbs.) in Fig. 21.
Clustering techniques like ISOi.4TA-POINTS ignore direction whileclustering the data In the pattern space. However, the average pointsobtained can be used to derive the directional characteristics of thedata. They are primarily sensitive to the density of the patterns inpattern space. they are well suited to "zooming" in on the detailedstructure of the date. They also can servw as methods for a preliminarysorting of patterns into relatively homogeneous subsets for furtherstatistical processing. (This sorting can prevent the confounding of twodisparate effects resulting from treating these effects as if they werethe result of the same (simple) cause.)
It may also be objected thatISODATA-POIFT8 has a certain arbi-trariness about it and that by setting the process parameters differentlywe would obtain different average points. It is true that differentaverage points can be obtained by varying the process parameters. How-ever the results of the clustering plus specification of the clusterparameters used, provides an objective and useful description of thedata.
In complex data we have found that there are a variety of validclusterings depending on the number of average points used, on scaling,and on the structure of the data itself. For example, if the data con-sists of tight clusters of data whose distances apart are large withrespect to the "diameter" of a cluster then the number of clusters willnot vary even with wide variations in the process parameters. If, onthe other hand, the data is uniformly distributed in pattern space, thenthe number of clusters found will tend to vary rather smoothly withchanges in the process parameters. The way that the number of clusters
varies as a function of the process parameters can be used to describethe structure of the data.
For these reasons, we feel that what must seem arbitrariness tosome is a flexibility that is needed fok the analysis of real data. Wefeel that this flexibility is not detrimental in the case of date analysisby clustering. •
We agree with John Tukey's appeal for good judgment in place ofrigorous optimization-
"Scientists know that they will sometimes be wrong; they try notp to err too often, but they accept some insecurity as the price
of wider scope. Data analysts must do the same."16
44

y J
And further.
"if data analysis is to be well done, much of it
statistical o,•7_non-statistical, will have to guide,
not command."
And finally, we quote from Tukey at some length, because of the rele-
vance of his remarks to clustering techniques.
"Practicing data analyshs' If data analysis is tobe helpful and useful, it must be practiced. Thereare many *ays in which it can be used, some good and
some evil. Laying aside unethiral practices, one ofthe most. dangerous (as I have argued elsewhcre (Tukey,1961b)) is the use of formal data-analytical proceduresfor sanctification, for the preservation of conclusionsfrom, all criticism, for the granting of an imprimatuWhile statisticians have contributed to this misuse,
their share has been small. There is a correspondingdanger for data analysis, particularly in its statisticalaspects. This is the view that all statisticians shouldtreat a given set of data in the same way, just as all
British admirals, in the days of sail, maneuvered inaccord with the same principles. The admirals could not
- communicate with one another, and a single basic doctrinewas essential to coordinated and effective action. Todaystatisticians can communicate with one another, and havemore to gain by using special knowledge (subject matter"or methodological) and flexibility of attack than theyhave to lose by not all behaving alike.
in general. the best account of current statisticalthinking and practice Is to be found in the printeddiscussions 1.n the Journal of the Royal Statistical
Society. While reviewing some of these lately, I wassirprised, and a little shocked to find the following:
snoild like to give a word of warning concerning theapproach to tests of significance adopted in this paper.It 1s very easy to devise different tests which, on theaverage, have similar properties, i.e., they behave satis-factorily when the null hypothesis is true and have approxi-mately the same power of detecting departures from thathypothesis. Two such tests may. however, give verydifferent results when applied to a given set of data.This situation leads to a good deal of contention amongst
statisticians and much discredit of the acience ofstatlstics. The appalling position can easily arise inwhich one can get any answer one wants if only one 1 oesaround to a large enough number of statisticians.'
45
3
1~
To my mind this quotation, if taken very much moreseriously than I presume it to have been meant,nearly typifies a picture of statistics as a mono-
lithic, authoritarian structure designed to produce
development in this direction is a real danger to
data analysis, I find it hard to believe that thisdanger is as great as thit poses by over-emphasis
on optimization.
Facing uncertaintyf The most important maxim fordata analysis to heed, and one which many statis-Uticians seem to have shunned, Is this: 'Far betteran approximate answer to the right question, whichis often vague, than an exact answer to the wrongquestion, which can always be made precise.' Dataanalysis must progress by approximate answers, at best,since its knowledge of what the problem really is willat best be approximate. It would be a mistake not toface up to this fact, for by denying it, we would deny
ourselves the use of a great body of approximateknowledge, as well as failing to maintain alertnessto the possible importance in each particular instance 19of particular ways in which our knowledge is incomplete."
We are presently investigating in more detail the relation-ships between clustering and "direction-finding" techniques. It appearsat this time as though they are qualitatively different, knd that theyshould be used to complement each other in data analysis.
V. EXPERIMENTAL RESULTS FROM COMPUTER IMPLEURNTATION OF ISODATA-POiNTS
In order to understand and evaluate the technique, we have per-
formed a series of experiments. These experiments have been of threetypes: those designed to validate ISODATA-POINTS, those designed toIllustrate graphically the approach taken, and those designed to ana-lyze data from the real world.
The detailed results that we have obtained using the ISODATA-POINTSprogram will be contained in a larger report. We shall not attempt torepeat the contents of that report, but rather shall extract some ofthe results that we consider particularly significant.
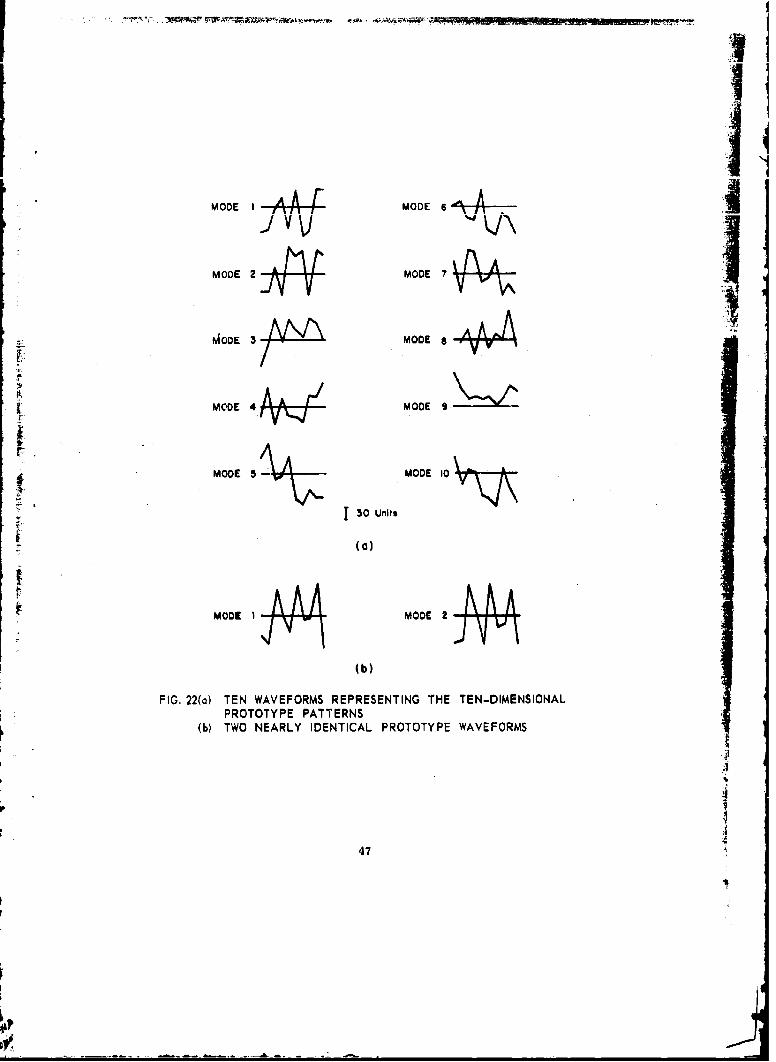
The validation experiments were constructed from data whose struc-ture was well known, in order that we might evaluate the clusteringobtained by ISODATA-POINTS. The data was obtained by adding Gaussian
random noise to 10 prototype patterns which serve as the ideal versionsof the noisy vectors. Each vector had 10 analog dimensions and can bedJsplayed as shown in Fig. 22(a). The values in each dimension werecoded into a 10-bit binary number using "snake-in-the-box" codes
46
Ii
MODE I MODE 6
MODE 2 MODE 7
40iDE 37~ MODE a
MODE 4 MODE 9
i-MODE 5 AA MODE 10
.• ' Iso unitsA AA
- (a)
MODE I MODE 2
(b)
FIG. 22(a) TEN WAVEFORMS REPRESENTING THE TEN-DIMENSIONALPROTOTYPE PATTERNS
(b) TWO NEARLY IDENTICAL PROTOTYPE WAVEFORMS
47 A

(a modified gray scale coding). These 10 dimensions were then cow.-bined to give a 100-bit pattern. The closest intermean distance was108 units of the original 10-dimensional space, or roughly 20 bitsahart in Hamminw distance. The envarianne matrix was tho same fnr qi1 I
distributions and was the scalar matrix, 01, I being the identitymatrix, and 7-30 units, where a is the standard deviation of the dis- I
LribuLiujua. The tizw uv 4=30 ib aizu indiudLed in Fig. 22(a).
The patterns were processed by the ISODATA-POINTS program withoutspecifying the distributions from which they came. The process para-meters were varied by the authors until the program sorted the patternsinto 11 clusters. We assigned each cluster to the mode whose patternspredominated in that cluster. Doing this the program classified 98%
of the patterns correctly. The Bayesian decision-theoretic optimumseparating planes, which were positioned using a priori knowledge ofthe location of the means, achieved a 99% correct rate using unquantizeddata.
In a later experiment only two distributions were used. The wave-forms of the two means are shown in Fig. 22. Their means were but 56
units (about 10 bits) apart, while they still had a standard deviationof about 30 units (about 6 bits). We obtained estimates of the meanvalues, again without knowledge of the pattern mode from which the datacame. fhe values obtained were only slightly different from the correctmeans. The optimum decision plane gave a percentage correct classifica-tion of 81% while ISODATA-POINTS (using two large clusters and two quitesmall ones) obtained 78%.
In a second validation experiment we constructed 48 pattern vectors.half of which had the last six bits + l's and half of which had the lastsix bits - l's. The first 24 bits of these 30-bit vectors were thenfilled with pattern vectors positioned so as to have all pairwise Hammingdistances between patterns exactly 24 bits in this 24-dimensional space.The ISODATA-POINTS program proved capable of extracting the six consistentbits of this 30-bit vector--disregarding thn rest of the "noise" for whichbits were not consistent. The program was 100% correct in its classifica-tion of these vectors. Again no categorization information was used tocluster the patterns.
In another experiment designed primarily to illustrate ISODATA-POINTSgraphically, we drew a set of O's and a set of Q's on a 10 x 10 retinaof squares. The O's and Q's had no registration noise (i.e., were nottranslated or rotated) but did have bits of noise added randomly, ad-jacent to the main outline of the O's and Q's. The program proved cap- 4able of dividing the O0s from the Q's perfectly. In addition, the sub-tracting of the average "0" pattern from the average "Q" pattern em-phasized the fact that the tall of the Q's was the primary distinctionbetween these two classes of patterns.
48
We felt that the utility of ISODATA-POINTS would be most clearlyindicated by application to data drawn from actual research situations.
We chose two such situations. The first was the sorting of a set of
sociological questionnaires, relating to the attitude of 209 scientists*t +fa-i- Ai, Vnr,- 1ahnrtnriP:. Tn 11th1 instance it was somewhat
difficult to specify a reasonable sorting of the questionnaires into
groups or categories. The second was a set of weather data, relatingto ceiling neignt preoiction in Washington, D.C. in this situatiun.
we could perform a preliminary sort (i.e., define a classification)using the ceiling height that actually did occur.
The sociological data were obtained from the Systems AnalysisLaboratory of the Management Sciences Division of Stanford ResearchInstitute. We found the groups into which the ISODATA-POINTS techniquedivided the scientists' questionnaires had reasonable internal con-sistency as measured by the mean deviation from the average point.Conversations with the research sociologists have indicated that thesegroupings are meaningful in terms of their experience with the personnelin the laboratories. We were even able to obtain distances(in termsof the measurements made by the questionnaire) between the averagepoints of these groups and to obtain the spatial relationships of thegroups in three dimensions. We feel that such groupings can point outthe characteristics of the people to whom a questionnaire is given.These characteristics appear to be useful in revising the questionnaire
for future use.
The ceiling height weather data provided us with the opportunityto investigate three aspects of the ISODATA-POINTS process. In thissense the weather problem is a very "rich" problem suggestive of manyuseful modifications of ISBODATA-POINTS, In particular it allowed us:
(1) To evaluate its ability to predict ceiling height;
(2) To evaluate its capabilities for measurement selection
(3) To lecrn how ISODATA-POINTS exhibits the structure of Iexperimentally-obtained data,
The performance obtained by the technique was slightly better thanpersistence forecasting. (Persistence forecasting is the technique offorecasting that predicts that the same conditions that exist at theprosent time will be in effect at some later time--(in this case fivehours). This prediction was, however, made without utilizing thecategorization information. In the near future we hope to improve theprediction score by utilizing the actual ceiling height that occurredfive hours later for a preliminary sorting of the patterns.
,
The analysis of this data was supported by contracts from the BehavioralScience Division of the Air Force Office of Scientific Research.
By measurement selection we mean the determination of those predictorsor measurements that are most useful in discriminating between classes.
49
Utilization of the typical patterns, or cluster centers, as wehave called them, allows us to evaluate the measurements that defineeach of the patterns. We have done this for the weather data and haveobtained agreement with he,th tho cn,4•,•rt• f ••t••G
and measuremenc evaluations obtained by statistical techniques. Wehave been able to go somewhat further than this in one respect. Fromour examin±.ation of tav UaLa it is evidet:t that when one considers onlythe weather records that resulted in low ceiling heights, the importantmeasurements are different from those considered important when one useshigh ceiling height records as well. This indicated to us that predictorsor measurements that may be essential in one region of pattern space neednot be even useful at all in other regions. Any over-all statementregarding predictor worth that averages together performance in differertregions of pattern space seems destined to obscure such important details. ••
By plotting the clster centers in a plane using the distances ofthe clusters from each other, we were able to see the structure of thisexperimental data. This we found quite suggestive of new measurementsthat should be made.
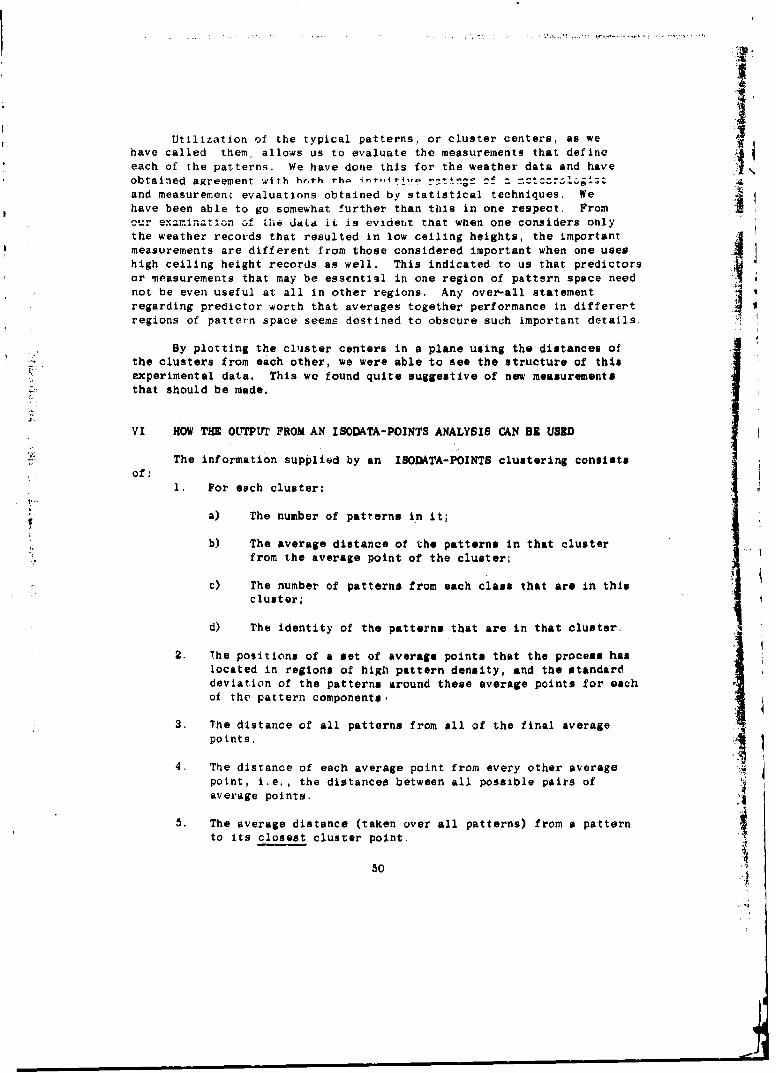
VI HOW THE OUTPUT FROM AN ISODATA-POINTS ANALYSIS CAN BE USED
The information supplied by an ISODATA-POINTS clustering consistsof:
1. For each cluster:
a) The number of patterns in it;
b) The average distance of the patterns in that clusterfrom the average point of the cluster;
c) rhe number of patterns from each class that are in this
cluster; jd) The identity of the patterns that are in that cluster.
2. !he positions of a set of average points that the process haslocated in regions of high pattern density, and the standarddeviation of the patterns around these average points for eachof the pattern components.
3. The distance of all patterns from all of the final average
points.
4. The distance of each average point from every other averagepoint, i.e., the distances between all possible pairs ofaverage points. it
5. The average distance (taken over all patterns) from a patternto its closest cluster point.
50
Using this information it is possible to learn a great deal aboutthe structure of the patterns in pattern space. The gross structure ofthe data is obtained by examining the spatial relationships between theaverage Points. Nntp th-+ tlt aver4ge points is smpall enoughto allow comparison of each average point with every oth-er average point. -'
We have found that a most useful way of comparing these average pnints iga...* a it is not possible to draw the plot in the originalpattern space because it has too many dimensions. However, by usitng thedistances between pairs of average points, it is possible to plot atleast t•ee average points on a flat surface. We have found that withreal data we have frequently been able to plot on a plane more than threeaverage points with sufficient accuracy to aid our intuition. The dis-tribution of patterns around these average points can be plotted usingdistances from these average points and a more detailed understanding ofthe fine structure of the data obtained.
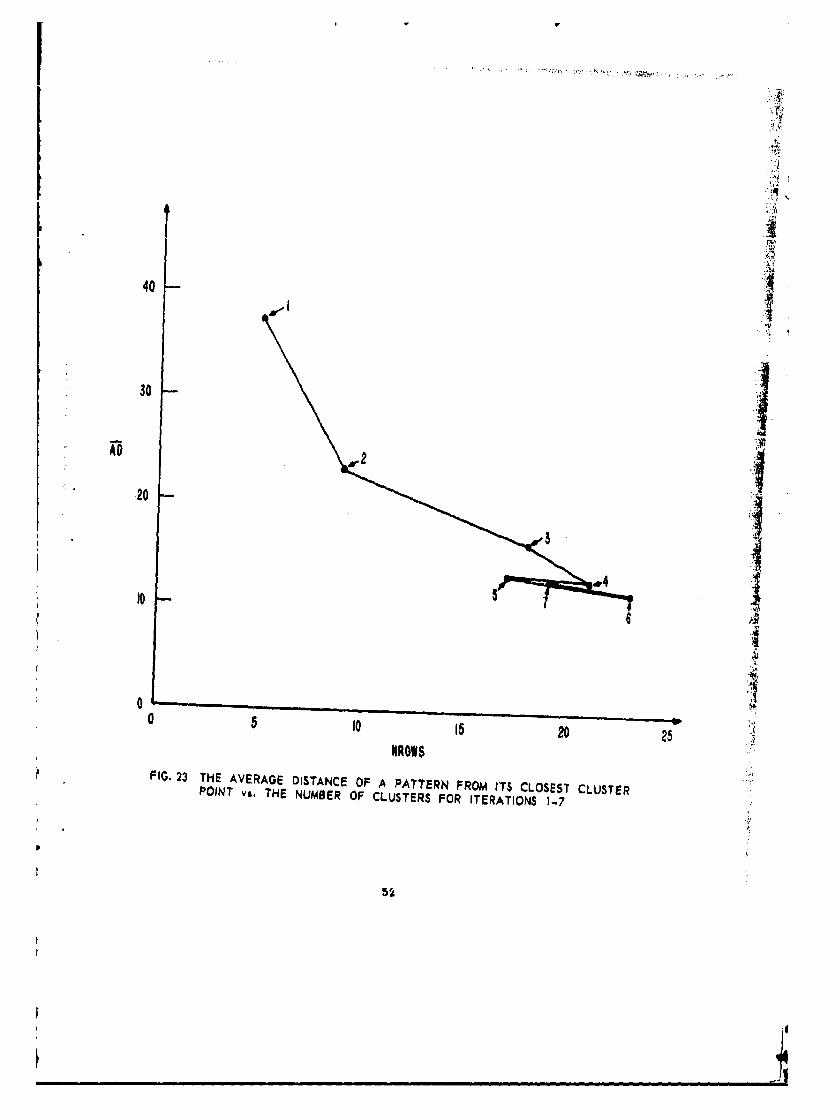
Using the information now available in the program some evaluationof the significance of a given clustering is poss'ble. One criterion of"clustering tha. can be used is average distance (AD) of a pattern from itsclosest average point (the average point for the cluster to which a patternbelongs). In Fig. 22 we show the value of AD vs.the number of clustersfor the two-dimensional example as the iterations progressed. Note thatafter the fourth iteration it changes little as the number of masks changes,This criterion is, however, probably not au sensitive as might be desired.By using the distsncem between average points an well it appears possibleto determine if the patterns are compactly clustered.
We are continuing to seek new ways in which the results of the cluster-Ing can be analyzed.
VII SUGGESTIONS FOR FURTHER RESEARCI H
The following further research in suggested by the work thus far.In addition to research on algorithms for ISODATA-LINIS and ISODATA-PLANES, we intend to investigate:
(1) Criteria for clustering, in order to improve our abilityto interpret the results of clustering and to facilitatea more efficient manipulation of the process parameters.
51
40
30j
20
S-0 -
0 5 10 I 20 25 .
NROWSFIG. 23 THE AVERAGE DISTANCE OF A PATTERN FROM ITS CLOSEST CLUSTER
POINT vs. THE NUMBER OF CLUSTERS FOR ITERATIONS 1-7
52

I(2) Methodology for using clusters of patterns Here we
seek methods of displaying and analyzing the resultsof clustering.
(3) Classification techniques based on ISO[TA-POINTS,ISODATA-LINSS Anti IrerAP_1AV-' 0, thnt .- :=rCCfrom points, line segments, and planar segments asthe criteria for determining the class membership ofan unknown pattern.
(4) Actual hardware implementations of any methods thatprove promising after thorough investigation by computerprograms. These implementations would be used for dataanalysis and clas3ification on the basis of distancefrom points, lincs, and planes.
(5) Applications using computer programs implementingISODATA-POINTS, ISODATA-LINUS, and ISODATA-PLANIS onreal-world problems.
In the following five sections we shall discuss these areas forfurther research in somn detail.
1. Criteria for Clustering
So far, in developing the ISODATA techniques we have contentedourselves with using intuitively satisfying criteria in the "decision-making" in the computer program. At this time, we feel that we shouldinvestigate additional analytical Justification and possibly entirelynew criteria. The needed criteria are:
(1) Criteria that could help determine the "goodness offit" of a given clustering. These criteria would helpdefine "convergence" for IBODATA-like procedures thatlearn without a teacher.
(2) Criteria for lumping and splitting of the clusters
One important aspect of this part of the work is the deter-mination of the effect of changing the scaling function used for variousmeasurements, e.g., changing from linear to logarithmic scales. Thiswill have an effect on the clusters found. We need to know more aboutthe extent of the effect.
There exist interesting statistical problems in this work. 4'For example, Dr. Charles Dawson of SRI has been able to show that thesum of an infinite set of n-dimensional multivatiate Gaussian distri-butions having means distributed uniformly along a straight line segmentcan be considered as n-i dimensional distributions lying in hyperplaneshaving the straight line as their normal vector, except very close tothe end of the line segment, This model seems an interesting one for thecase of detecting a known signal with time-varying amplitude. It also isquite close to a model for one ISODATA-LINES cluster,
-53-

I92. Methodology for Utilizing Clusters ef Patterns -
in our work thus far we have developed several methods and. A" .dU.K.. tLil i.'1C s5tructure ot oata alter clustering.
Two important ones are: I(1) The cluster center plot. By using the distance between
cluster centers we are able to plot the relat ivepositions of the cluster centers on a plane. We canalways plot three such centers and still satisfy theinter-point distance constraints exactly. Frequentlywe have found it possible to plot more than three ona plane. The exact number that it is possible to plotdepends on the spatial relationships that exist in thedata.
(2) A distance-from-cluster-center computer program. Usingthis program we asa able to obtain a histogram of thedistances of the patterns from the various clustercenters. This gives indications of the distributionof the patterns about the cluster centers--i.e. arethey loose or tight clusters, etc. This particularprogram is useful in setting thresholds and weightingdistances between pairs of clusters for the classification
- of patterns.
¶t is essential that we develop other methods of rapidlymanipulating these clusters of data in order to learn various thingsI
about the fine structure of the patterns. We have found that the ideascome most easily in attempting to analyze real data. We are particularlyinterested in drawing together these techniques to develop a coherent
methodology,
r 3. Classification Using Distance. from Lines and Planes
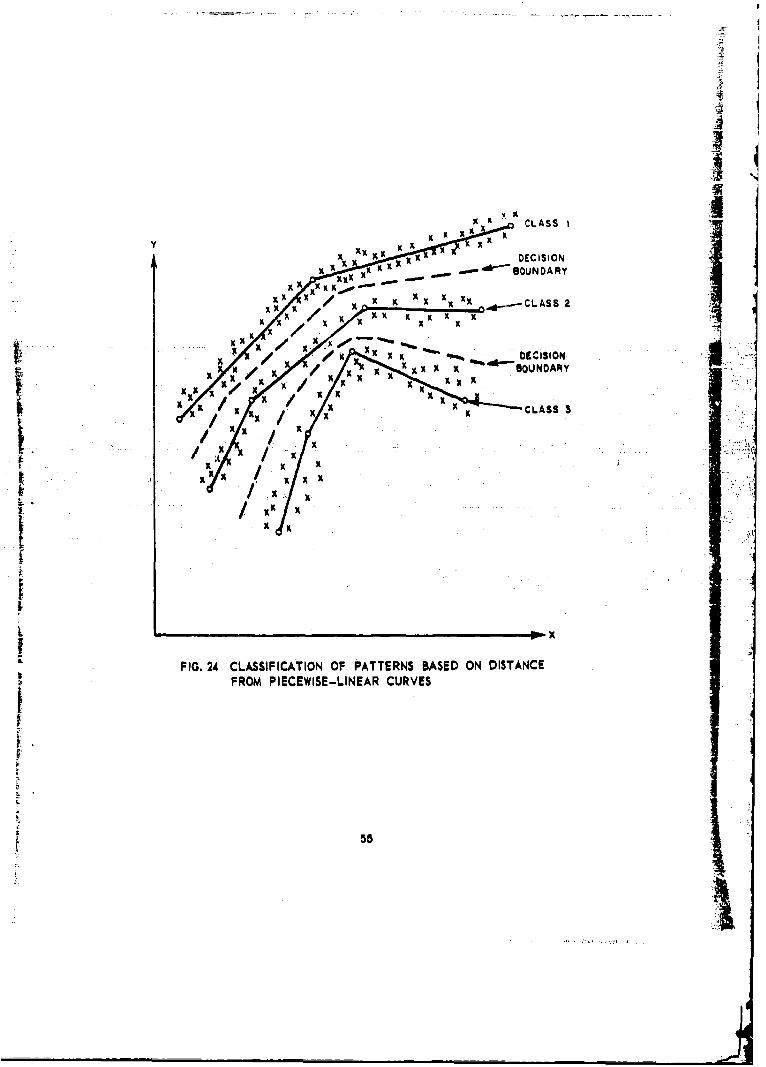
ISODATA-POINTS can be used as a mode-seoking classificationtechnique. Our work on the development of ISODATA-POINTS has alsohelped us understand so-called piecewise-linear error-correoction classi-fication techniquwb .l t Lhereture s+ims a plausible that !,o dovwiopmbntof ISOa4TA-LMS and IODATA-PZAYES should help the development ofclassification techniques that are based on the distance from a set ofline segments or from a set of planar segments, where different sets ofline segments for example, would be associated with the different classes(see Fig. 24).
For certain classes of patterns, such as speech, word recogni-tion, or speaker recognition, and other nou-stationary time-series analy-sis problems, this type of technique may prove quite powerful. Anothersuch application might be optical pattern recognition--specifically with*]
This seems all the more true when the possibility of optical implementa-tion exists and makes pattern dimensions of 1000 reasonable.
54
x X4 x
/ X X -,.ýx DEOCISION
X - - "f.
FRO PICWSELNA CURVESIO
X FX xSUDR
x x x
x x -A 55
x X xx XI

Irespect to recognizing patterns In spite of translation and rotation.We have some evidence that translation of a pattern in one directioncreates a straight line in measurement space so long as the rate ofchange of overlap between thp not*&" -A 4*. . .. ..---- ..These techniques also lend themselves to the use ofa2ur probabili-ties and cost functions.
4. Implementation of I8ODATA
In Fig. 25 we show three implementations capable of computingthe minimum Euclidean distance from:
(1) An n-dimensional point (the point is specified by avector Mo
(2) An n-dimensional line segment.
13) An n-dimensional planar segment,* These assemblies could therefore be used as basic units forclcssification using distance from lines or planes. These assemblagesare Particularly useful when it is not necessary during training tovary the correction factors i.::,M(shown In Fig. 25) after each pattern" i5.'lassifIed.;
The amplifiers shown-are variable-gain linear amplifiers.. hoth th, patterns and thi weights can be optical masks inthese implementations It the pattern could be put in the form showniA Fig. 26', this'would allow.the detailed examination of non-statlonarytime saries with the only requirement being that the system response.time not bs siower than the sampling rate.
S. Appl ications
Data usually analysed by timesaeries analysis, particularlynon-stationary series such as speech and business trends, seem to providesuitable sources of data for 180DTA4LIN•S.
gA ood soure-e of data for X3ODVTA-PAIM would be Prediction.. roblwms where many Predictors are used to'prediot one quantity--forexample, ceiling height or air turbulence in'Neteorology.
Data from the social sciences would provide excellent datausually suitable for analysis by at least one of the three ISO/ATAtechniques.
The techniques should be particularly useful for analyzingpreprocessing for pattern recognition. The selection of measurementsbecomes, we have found, more meaningful when it is possible to eia.,inerelatively homogeneous subsets, i.e., after clustering.•i "5"-

p 2 INSOUARrO EUCLIDEAN..'• ~DISTANCE BE'TWIEEN
.11"
bI
N 0 AN
2 0 -0 DiSURO ULDA
mo iPMsP- mo
•~ ~~~~i m• • rm11 o
FIG. 25(c) IMPLEMENTATION FOR FINDING EUCLIDEAN DISTANCEOF A PATTERN FROM A .POINT
57

2
SWEEP '+
V~~GI rOON )~OF A PATER FRO AIIN
I-A
Da' ROM l Tl 0 _(M0', TI
IVI

3 13GANGAI N D,'
ARE INDEPENDENT Moo Mg MOF THE PATTERNS I• . G A IN .r I G A IN•
'' '\ 1 I i I •...i • . /.AMP AM." t l ~ GAIN /'
2P m A:_I
i I
I~~~ A IF AIATR RO LN
(SWEEP
p ,0
A, p . . -. -w -
* .aIMg. AdMIr+2M0o~ml+2.TMqmm
FIG. 25(c) IMPLEMENTATiON FOR FINDING EUCLIDEAN DISTANCEOF A PATTERN FROM A PLANE

I
. .
UM[-
EELEMENT CORRESPONDING -TO THE I IMEASUREMENT.
ITS INTENSITY INDICATES VALUE OF VARIABLE 1.
FIG. 26 AN OPTICAL PANEL FOR INPUTTING A HIGH-DIMENSIONAL PATTERN•IINTO AN ISODATA SYSTEM
60
We are attempting to improve and refine our techniques formeasurement selection and to look at the possibilities of generatingmeaningful measurement- r.•t 4 !1:. jVill A=NOW' XG~aN-S
We would like co thank the many people at SRI with whom we've
worked who have listened to and commented on our ideas. We wouldparticularly like to thank Dean Babcock and Charles Rosen for enco~irage-ment and the time to pursue the research necessary to develop theseideas. Discussions with Charles Dawson, Wade Foy, and Nils Nilssonhave pointed out important relationships. t
The work was supported by internal funding by Stanford ResearvhInstitute and contracts from the Graphical Data Transducer Branch, DataDivision, Communications Department, USAEL, Fort Monmouth, N.J.
Ij I,
APPENDIX A
:G,.ZTA-LJLAZZ ANDI ISODATA-PLANES
In thiq appendix wc Coraiid'n Oxe generailzation of ISODATA-POINTSto the fitting of connected line segments to 'tubular" high dimensionaldata arnd to the fitting of ti-iangular~ segments of hyper-planes to
"surface-1±ke" high-dimensional datat.
The fundamental concept of ISODATA is the iterative adjustment ofthe position of "clusters" in order that these clusterý; come to reflect,in their relative positions, the struQ~urc of the data, In ISODATA-POINTSthe goal. i±E to adjust these clusters so that they lie around well-chosenaverage pO;nts.
In the generalizations of ISODATA-POINTS in this section we willrelate first pairs (ISODArA-LZINZb) and then trip.ýes (ISODATA-PLANBS) ofpoints to each other. In the first generalization we relate, pairs ofpoints together in order to create line negmenmtaý By allowing each..point4to be in more.than ýone rai~rlwe ar. able to create a piecewise-.linearcurve': We propose fitting curivesocomposed 'of segMentS Of these lines to*the'data: (rather-thin just. -single points), :thus obtainling ani pi.ece-wi8*linear algebraic exprbmsion describing a, set of dara poiaits in a high-
*diment ional.s pac'e. Such iterative.f ittin .g .o If a aset .oflim. sii'mqnte to,data We' call. ISODATA,-LINZS.>S'u~h& c'urve is shown fitted to a set ofIhypothetical data-in; Fig. A-1.
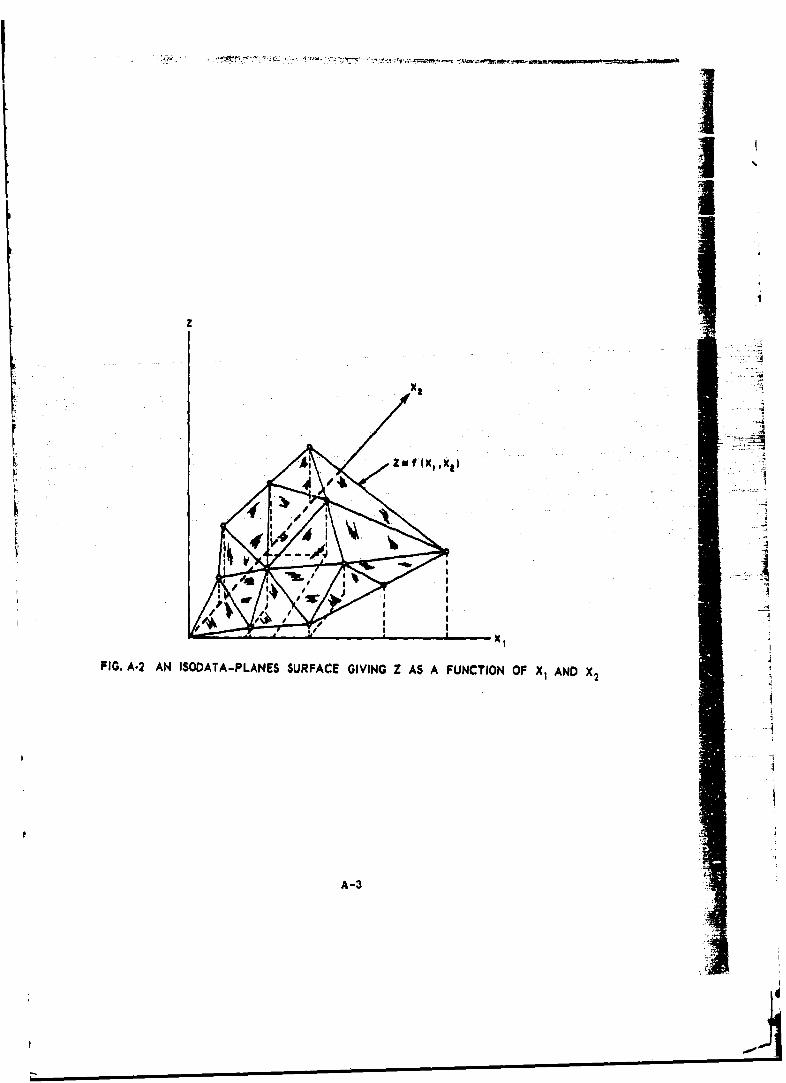
n nthe second.ý.general~iiatioin of ISOIDATA-POINTS we associate triplesof poincm togother.' These triplesaxof points can be used to define atriangular segment. of a plane, ihný-dimensional- apace. .By allowing points >to be inmore than one triple of poihnts.we sink these triangular segmentsof planes together to form a piocowis.-pl'anar surface in n-apace. Thissurface would then be~iterativ'ely adjusted to cause it to fit a sot ofdata. This iechr'ique we call fSODATA-PLANES Such a surface* in a three-dimensional m pace is shown in Fig. A-2.
We have:i not developed an. adouat algorithm for either of thesegeneralizations. We have investigated IBODATA-LINIS to a greater extent,*the results of which we now describe..
*U
An example of "tubular" data would be a set of tine samples of thepatterns at the output of a set of band-pasm filters into which a wordhas been spoken. An examrie of surface-like data is the values ofn-predictors that are used to predict a single predictand such as the1Z.ceiling height at Washington, D.C.
A-1

V4•
R.M.$ VOLTAGEABOVE 1600scp
(IN VOLTS) x N
x x x xx
x x x Xx x
x II x 1ý10.4 x x x x
x X XE
0.4x
x
x x
• X x x x, x x III
x x ItxII x x
0.0.3 x
VL.MS VOLtTAG
x x x
X It xX x X X
-0.2 x x x
k(xI x
It It x X
ItLO 960 x
. x t 'X xoX f x x x x
xx It
xx
S0 0.1 0.2 0.3 0.4vtm A.MS. VOLTAGE
BELOW 1600 ¢0m(IN VOLTS)
FIG. A.I AN I$ODATA-LINES CURVE FITTED TO A SET OF HYPOTHETICAL DATA .(The Trajectory of the Word "zero")
A-2
- . -..- -
I
I
z!
I I
4 4
FIG. A*2 AN ISODATA-PLANES SURFACE GIVING Z AS A FUNCTION OF X1 AND X2
A-3

A. ISODATA-LINES
At the present time it appears to us that tha ____ .I! •'TA-LiE. snouic consist of the following ateps: 1
(1) Use I$ODATA-PO!NT8 to dcfino cluster centers within thedata.
(2) Take the nearest two cluster points and reiate themi,-: (i.e., they are to define a line segment).
(3) Starting with one cluster point of this pair, find thatnew cluster point nearest to it. Relate this pair.(A maximum allowable distance for pairs might be usedhere.)
(4) Continue this procedure until all acceptable clusterpoints are paired. At this point iterative adjustmentof the line segments would begin.
(B) Effective iterative adjustment of the line segmentsrequires the answering of the following two questions:
(a) What subset of patterns should be associated(probably not disjointly) with each line segment?
(b) In what direction should each pattern move thecluster points that define the line selgmentassociated with that pattern and what amount shouldit move it?
*Zach pair considered for a relationship should be examined to ensure1 that there are points lying near the straight line segment connectingthem. A simple modification of the ISODhTA-POINT8 program to storethe second (and third?) cluster points nearest to the patterns wouldallow the presence or absence of patterns between two cluster pointstO be found.
Some cluster points may be isolated from others due to the nature ofthe data and in this sense "unacceptable." If this isolated point weresplit into two points in the manner of ISODATA-POINTS a best-fit lineto this isolated cluster could be obtained.
A-4 .4
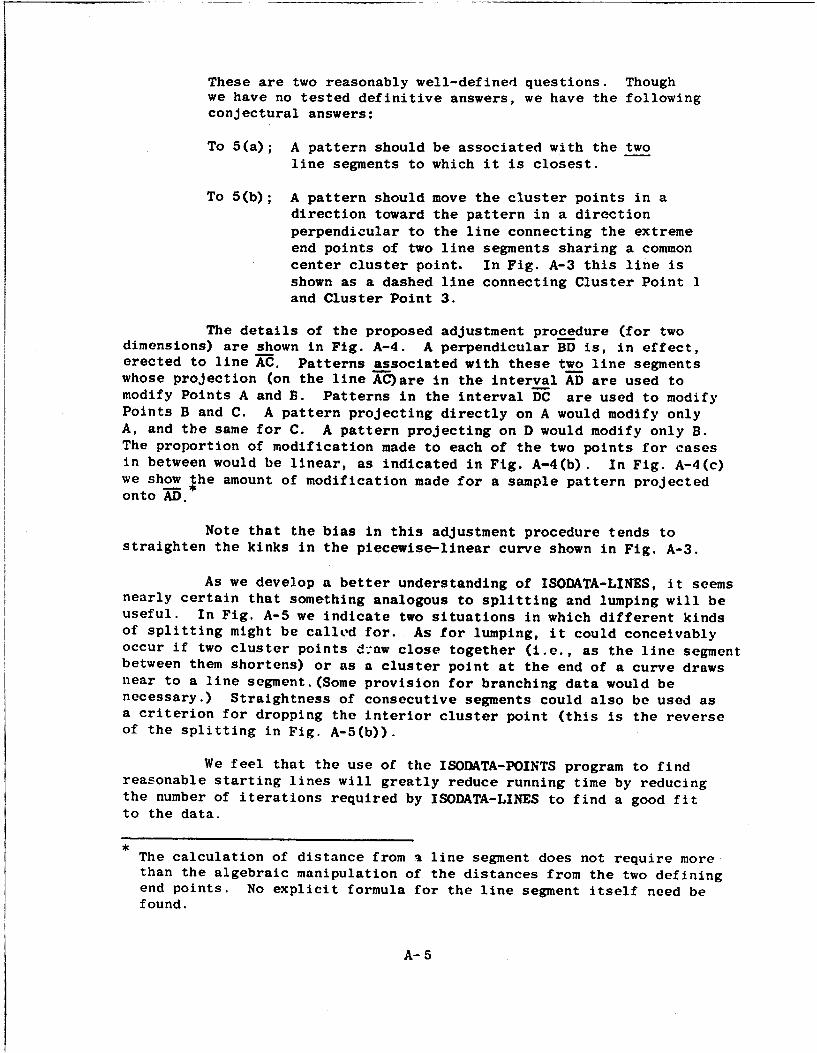
These are two reasonably well-defined questions. Thoughwe have no tested definitive answers, we have the followingconjectural answers:
To 5(a); A pattern should be associated with the twoline segments to which it is closest.
To 5(b); A pattern should move the cluster points in adirection toward the pattern in a directionperpendicular to the line connecting the extremeend points of two line segments sharing a commoncenter cluster point. In Fig. A-3 this line isshown as a dashed line connecting Cluster Point 1and Cluster Point 3.
The details of the proposed adjustment procedure (for twodimensions) are shown in Fig. A-4. A perpendicular BD is, in effect,erected to line AC. Patterns associated with these two line segmentswhose projection (on the line AXC)are in the interval AD are used tomodify Points A and B. Patterns in the interval D-C are used to modifyPoints B and C. A pattern projecting directly on A would modify onlyA, and the same for C. A pattern projecting on D would modify only B.The proportion of modification made to each of the two points for casesin between would be linear, as indicated in Fig. A-4(b). In Fig. A-4(c)we show the amount of modification made for a sample pattern projectedonto AD.
Note that the bias in this adjustment procedure tends tostraighten the kinks in the piecewise-linear curve shown in Fig. A-3.
As we develop a better understanding of ISODATA-LINES, it seemsnearly certain that something analogous to splitting and lumping will beuseful. In Fig. A-5 we indicate two situations in which different kindsof splitting might be called for. As for lumping, it could conceivablyoccur if two cluster points d&aw close together (i.e., as the line segmentbetween them shortens) or as a cluster point at the end of a curve drawsnear to a line segment.(Some provision for branching data would benecessary.) Straightness of consecutive segments could also be used asa criterion for dropping the interior cluster point (this is the reverseof the splitting in Fig. A-5(b)).
We feel that the use of the ISODATA-POINTS program to findreasonable starting lines will greatly reduce running time by reducingthe number of iterations required by ISODATA-LINES to find a good fitto the data.
The calculation of distance from a line segment does not require morethan the algebraic manipulation of the distances from the two definingend points. No explicit formula for the line segment itself need befound.
A-5
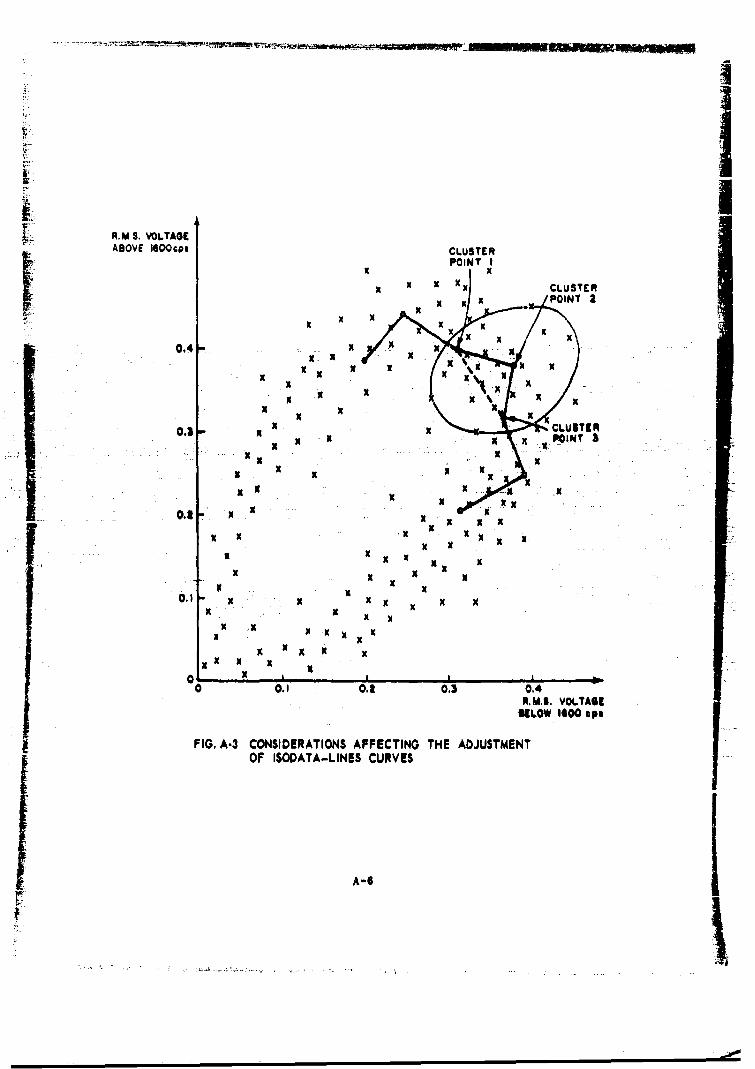
R,M S. VOLTAGE•.ABOVE 1600•;pe CLUSTERWA
POINTIIt x x Xx xCLUSTER
x X X x / x P O.. . IN T 2
0.4 x x IX. x
x It x X ,t0,4 t •• IUT[
x x - x x .x.O N
- C L U S x "
xxxI x xxx x
It x X
K K
Kx
x~~i x I
x . x x0. X x x X X
x xx x
0.1 t x x X X x x
X~ X x
0 .. 1 0.| 0.3 0,4
RM.I,. VOiLTAGEIllLOW 1400 4111
S~FIG. A-3 CONSIDERATIONS AFFECTING THE ADJUSTMENTOF ISOOATA-LINES CURVES
A-10

xx x
X B x SUBSET ASSOCIATED WITHX x X ,,"-'THESE TWO LINE SEGMENTS
x
*1ýx D ~Xx C
x
(a)
B • AFFECTS ONLY CLUSTERPOINT C
I
Wpx
AFFECTS CLUSTER POINT B ABOUT 2AND CLUSTER POINT A ABOUT
(b)
SIZE OFTOTAL MODIFICATION
8 -1 TO 8
A3TO-PROJECTION ON AD
30r
C
(c)
FIG. A-4(o) THE SUBSET OF PATTERNS ASSOCIATED WITH TWO LINE SEGMENTS(b) THE CLUSTER POINTS AFFECTED BY PARTICULAR PATTERNS(c) THE PROPORTION OF CLUSTER POINT MODIFICATION
CAUSED BY A SINGLE PATTERN
A-7

XxX X X X X X
Xx X X Xi~ X X X
ORGIA LN 0~- - THE TWO NEW LINEORIGINAL LINE SEGMENTS SPLIT AWAY
xSM X X X X FROM IT
xX x x XX X XX X X X xX XX X x K Xx
(o)
I x X xX X
XX X xx x x "xx x
xx x •., x x
SPLIT BY ADDING NEW K X
CLUSTER POINT X X XTO CENTER OF SEGMENT X K
X X X
(b)
FIG. A-5(a) SPLITTING BY CREATING NEW LINE SEGMENTS
(b) SPLITTING BY CREATING A NEW CLUSTER POINT
A-8
I
B. ISODATA-PLANES
We have not yet workeE out a tentative algorithm for the itera-tive adjustment of these planes, e_±.ct insofar as the alaorithm iswimiiar to INODATA-LINES. We feel that by the time we have developedISODATA-LINES we will have a good start on developing ISODATA-PLANES.It is interesting to note that for !SODATA-PUNES we only nood distance&
from the three defining points in order to find the distances from aplans. We do not need an explicit formula for the plane.
A-9
II!
2, ...
-A-
j m im mm • j mm im m •j mAi m

REFERENCES
1. Tukey, John W., "The Future of Data Analysis," Annals ofMathematical Statistics Vol. 33, No. 2, p. 2, March, 1962.(This is an excellent paper for those concerned with thedata analysis aspects of pattern recognition.)
2. Ibid., pp 5-6
3. D.N. Lawley and A.E. Maxwell, Factor Analysis as a StatisticalMethod, Butterworths, London, p.2, 1963.
4. Samuel S. Wilks, Mathematical Statistics, John Wiley and Sons,Inc., New York, p. 565, 1962.
5. Ibid, p. 544.
6. Bonner, R.E. "On Some Clustering Techniques," IBM J. of Res.and Dev.,p 22-32, Jan., 1964.
7. Cooper, David B., and Cooper Paul W., "Adaptive Pattern Recognitionwithout Supervision," Proceedings of the 1964 IEEE InternationalConvention, 1964.
8. Fierschein, G., and Fischler, M., "Automatic Subclass Determinationfor Pattern Recognition Applications," Corres. Trans. PGEC,Vol. EC-12, No.2, pp 137-141, April, 1963.
9. Glaser, E.M "Signal Detection by Adaptive Filters," IRE Trans.on Info. Thy., Vol. IT-7, No. 2 pp 87-98 April, 1961.
10. Jakowotz, C.V., Shuey, R.L., and White, G.M., "Adaptive WaveformRecognition," Information Theory, C. Cherry, editor,Butterworths, Washington, D.C., 1961.
11. Rogers, D.J., and Tanimoto, T.T., "A Computer Prograh, )r ClassifyingPlants," Science, 132, pp 1115-1118, 21 Oct. 1960.
12. Sebestyen, George, "Pattern Reccgnition by an Adaptive Process ofSample Set Construction," Trans. PGIT, Vol 8, pp S82-S91,September 1962.
13. Smith, James W., IEEE Trans. on Info. Thy., Vol IT-10, No. 3,pp 208-214, July, 1964.
14. Spilker, J.J., Luby, D.D., Lawhorn, R.D., "Progress Report--Adaptive Binary Waveform Detection," Communication SciencesDepartment Technical Report #75, Philco Western DevelopmentLab , Palo Alto, California, December 1963.
15. Stark, L., Okajima, M., Whipple, G.H., "Computer Pattern Recognition.Techniques: Electrocardiographic Diagnosis," Communicationsof the ACM, Vol 5, pp. 527-531, October 1962.

REFERENCES (Continued)
16. Tukey, J.W., op. cit., p.9.
17. Tukey, J.W., op. cit., p. 10.
18. Yates, F., (Discussion) J. Roy, Statist. Soc., Ser. B., Vol 17,
p. 31, 1955.
19. Tukey, J.W., op. cit., p 1 3 - 1 4 .
F -~ ~'~ ~ ,',.4
STANFORD MELIPRRESEARCH CANLORNPAKINSTITUTE CLFRI
Regional Offices and Laboratories
Southern California Laboratories8120 misslon streetSouth Pasadena, Californiai 91031
-Washington Office
808-17th Street, NA,Washington. D.C. 20606.
NetrYoi k Office -
Detroita Office
Pollkanstreata 37Zurich 1, Switzerland
Japan OffiesNomIura Security Building, 6kh Floor1-1 Nihronbashidaii, Chuo.kuTokyojapan
Retained Representatives
Toronto, Ontario, CanadaCyril A. Ing67 Yong# Shetet, Room 710Toronto 1, Ontario, Canada
Mi~an, ItalyLorenzo FranceechiniViII Macedonjo Melloni, 49Milan. Italy