Embed Size (px)
Citation preview
Clemson University Annual Report 2014-15
2020 Road Map Annual Report
1
*Report provided by the Office of Institutional Effectiveness and Assessment

Overall Rank Among Public Universities 2
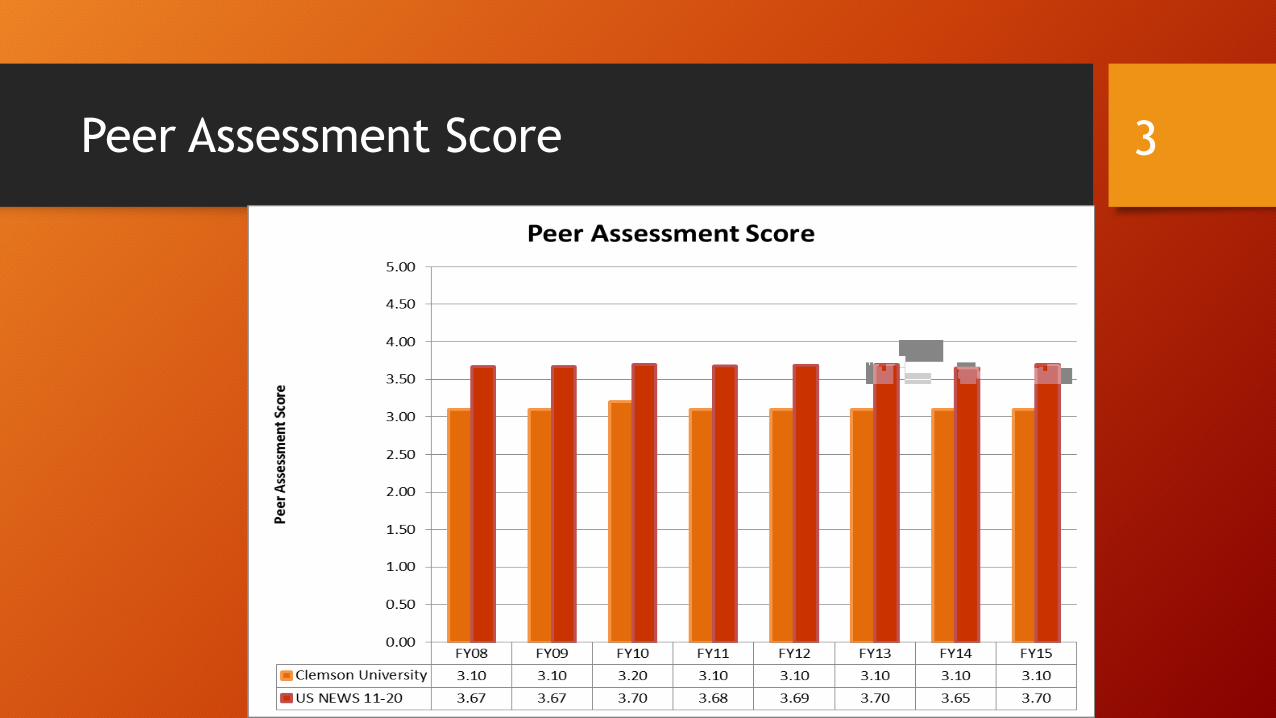
Peer Assessment Score 3
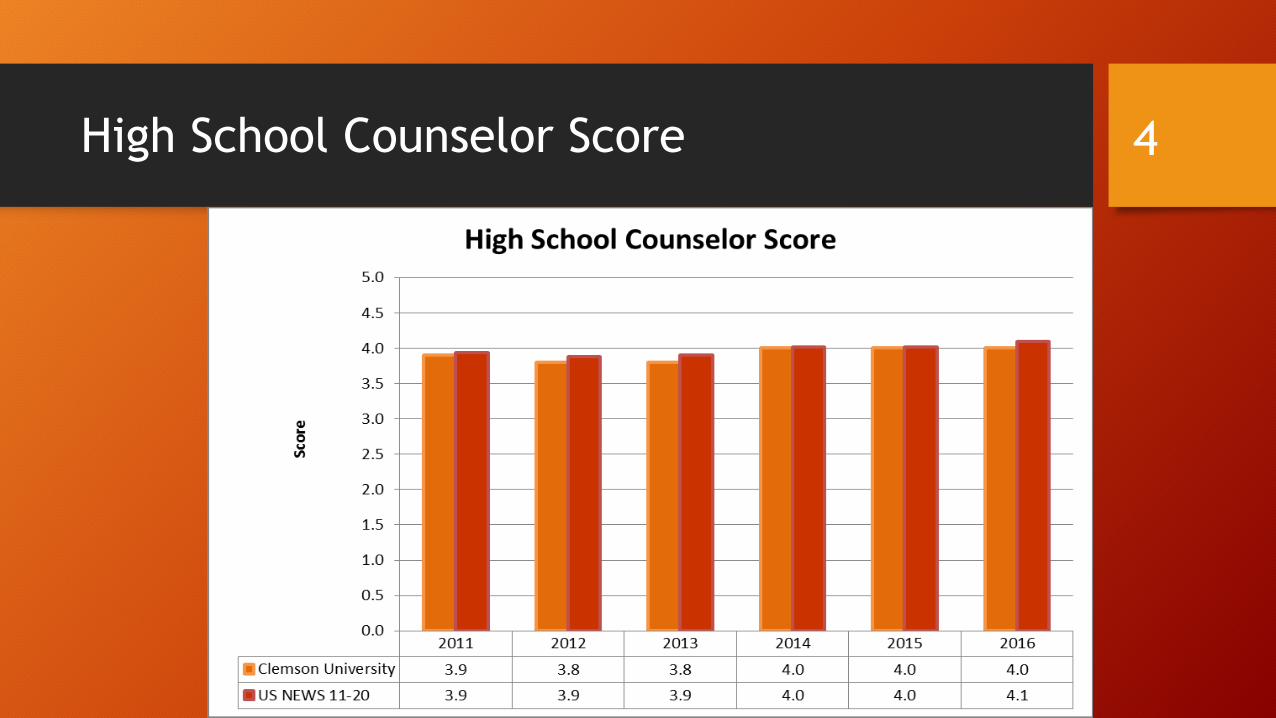
High School Counselor Score 4

Enhancing Student Quality and Performance
• As the heart of Clemson University, students and their success are our primary concern, and the demand for a Clemson education continues to rise. In the fall of 2014, 20,756 applications were received. Of those, 10,694 were accepted (an acceptance rate of 57%) and 3,482 actually enrolled.
5
Enhancing Student Quality
• Once again, the entering freshman class was outstanding with: • An average ACT score of 28; • An Average SAT score of 1253; • 55% graduated in the top 10 percent of their high
school class • 61% were from in-state; • 43 states and 7 countries were represented.
6
Enhancing Student Performance
• Road Map strategies to improve student quality and performance include • Strategic enrollment management to enhance quality and diversity and
increase enrollment in focus areas; • Increasing student competitiveness for national awards and providing more
opportunities for students to attend and present at national conferences; • Continuing to increase retention and graduation rates; • Offering more competitive scholarships and graduate stipends; • Introducing new teaching and delivery methods
7

Average MATH SAT Score 8

Average Verbal SAT Score 9

SAT 25th Percentile 10

SAT 75th Percentile 11

Average Freshmen Retention Rate 12

Student Selectivity Rank 13
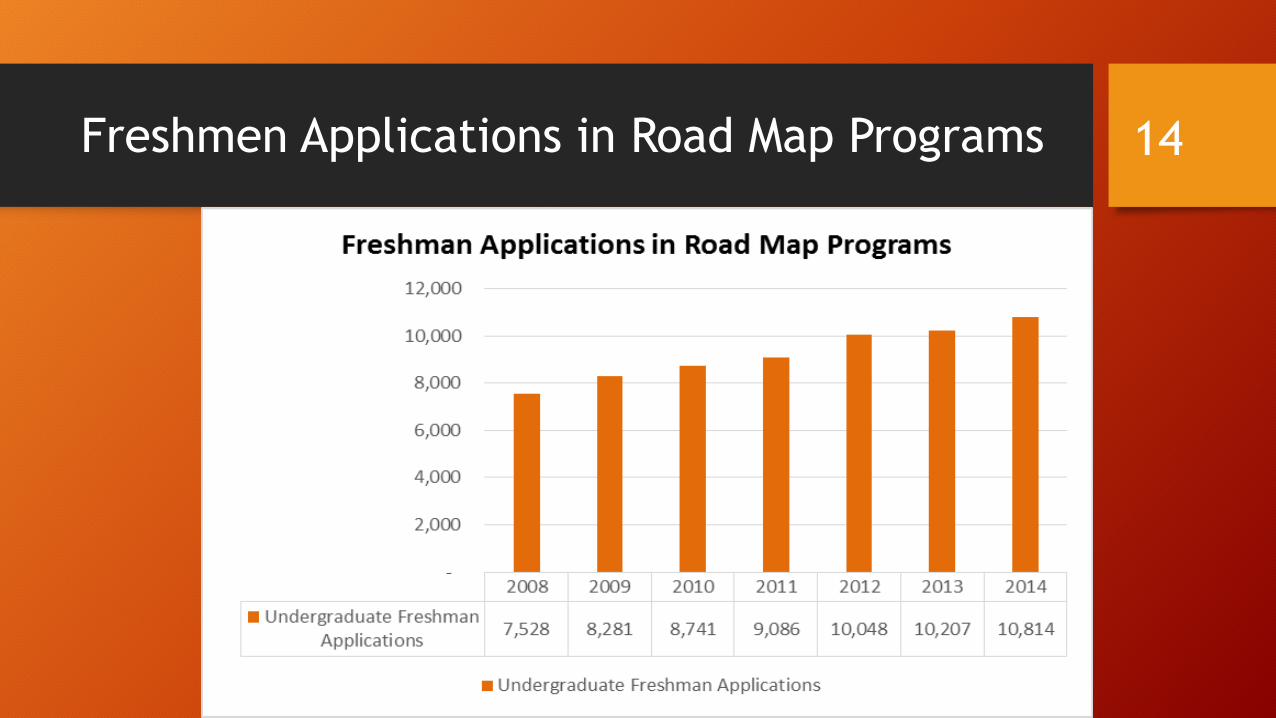
Freshmen Applications in Road Map Programs 14

Acceptance Rate 15
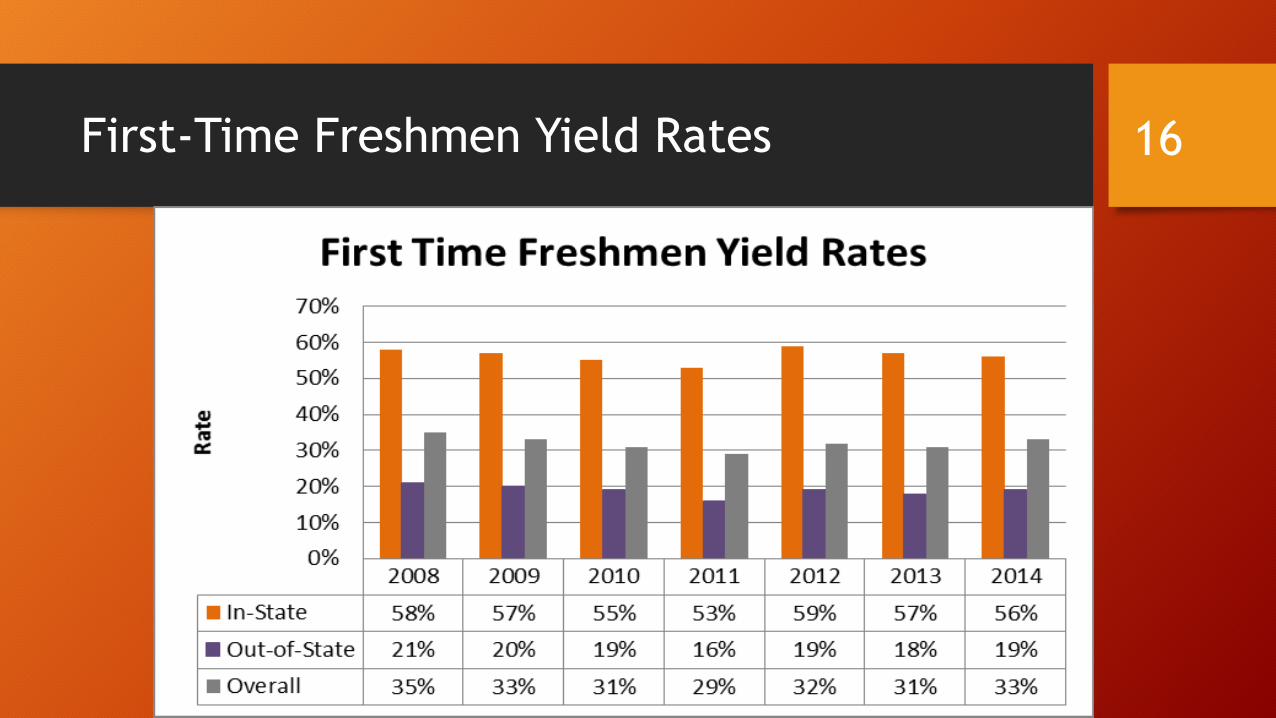
First-Time Freshmen Yield Rates 16

Percentage of Students in Top 10% of High School Class 17
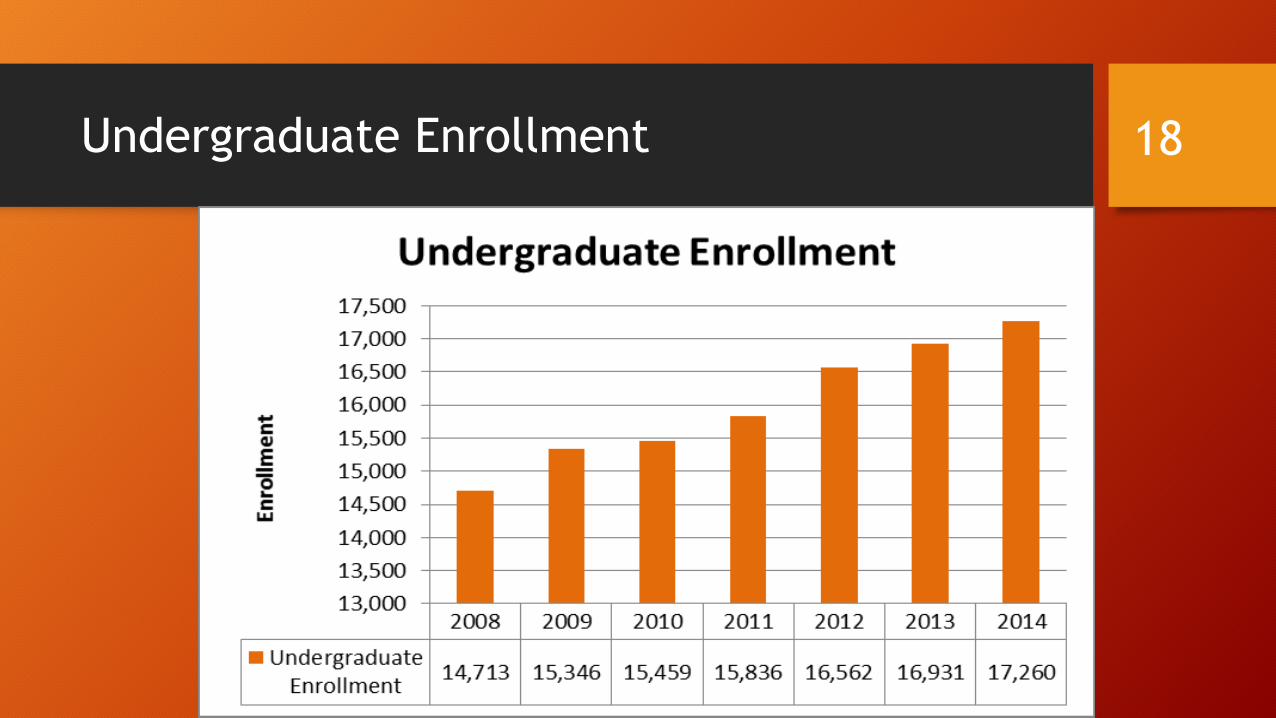
Undergraduate Enrollment 18

Undergraduate Minority Enrollment 19
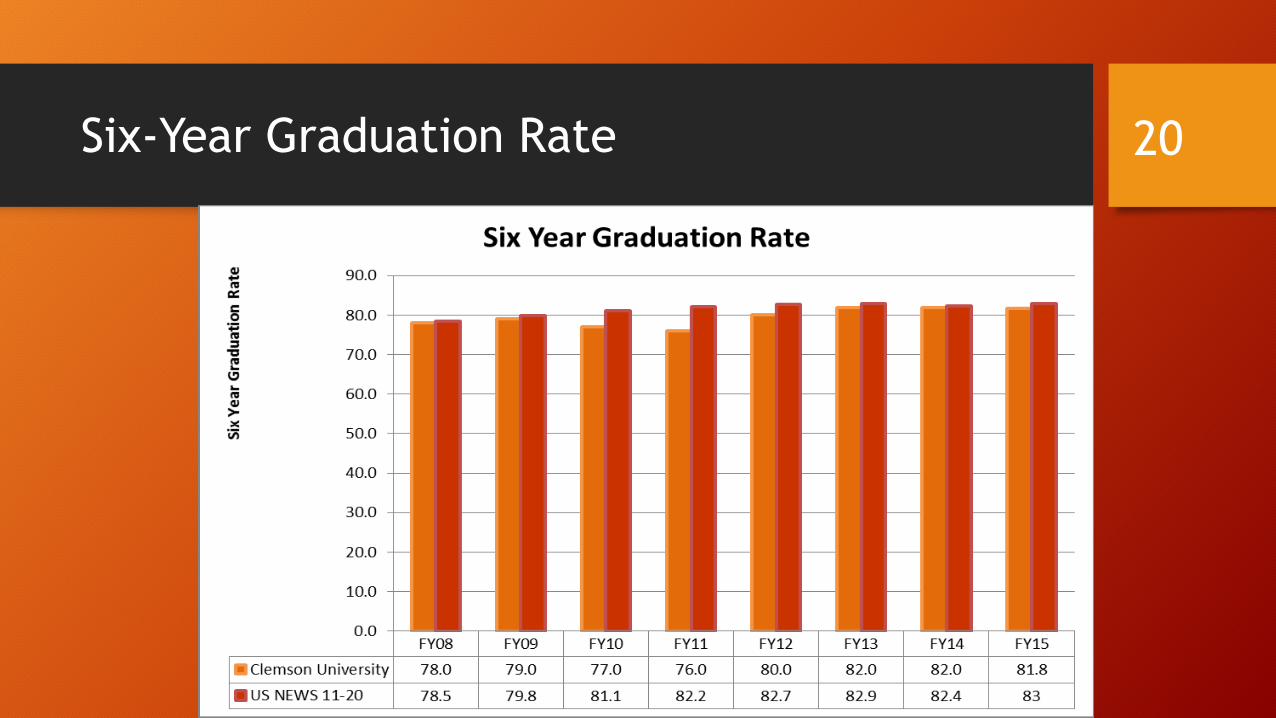
Six-Year Graduation Rate 20

Predicted Graduation Rate 21
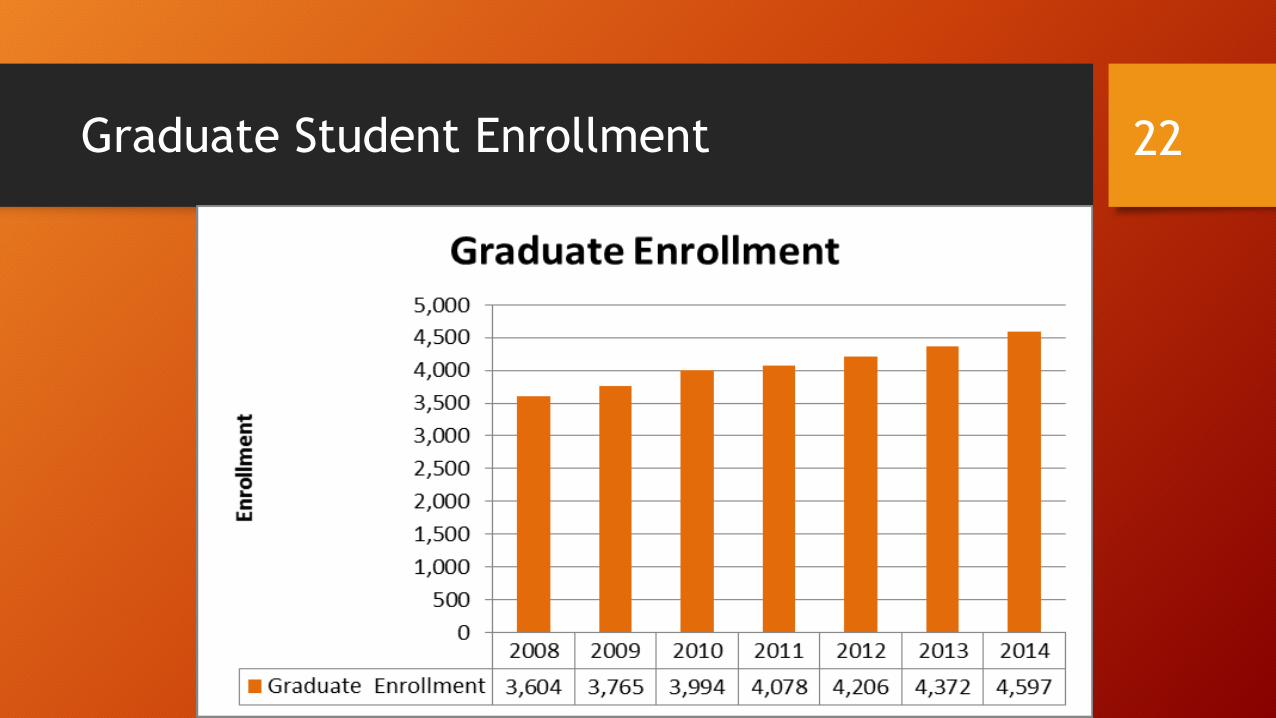
Graduate Student Enrollment 22

Doctorates Awarded 23
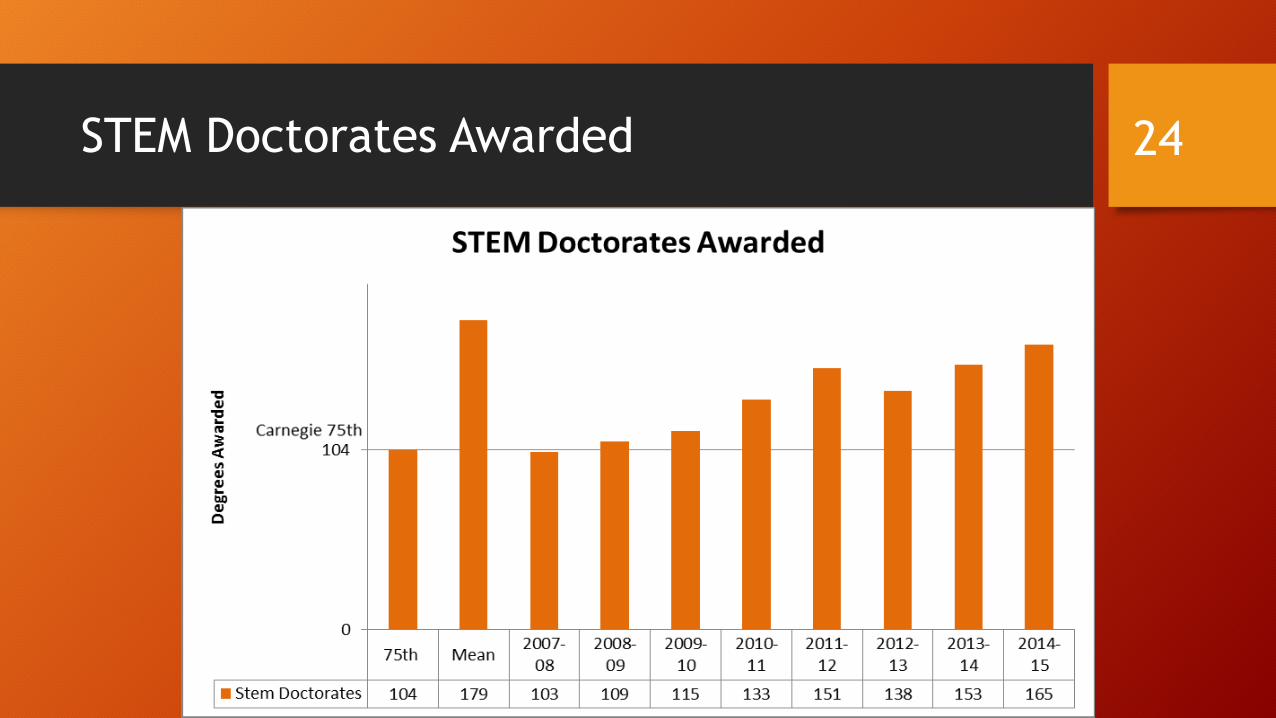
STEM Doctorates Awarded 24

Private Gifts for Student Support 25
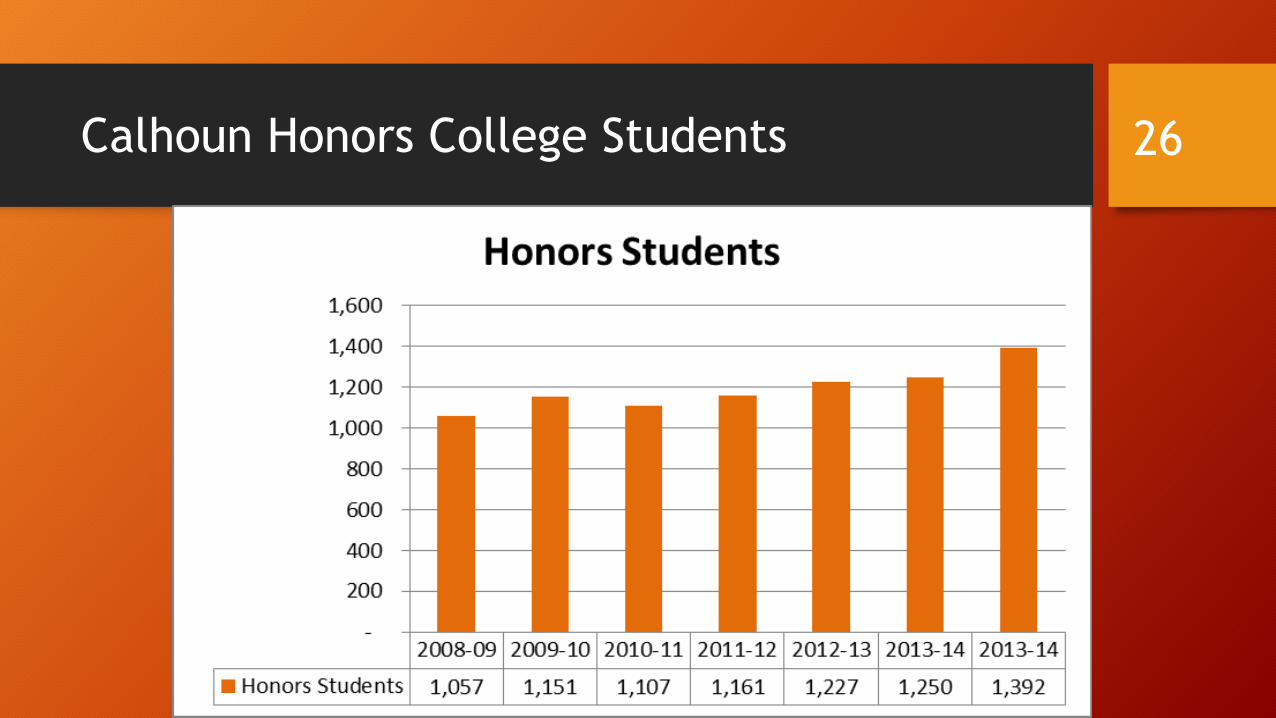
Calhoun Honors College Students 26
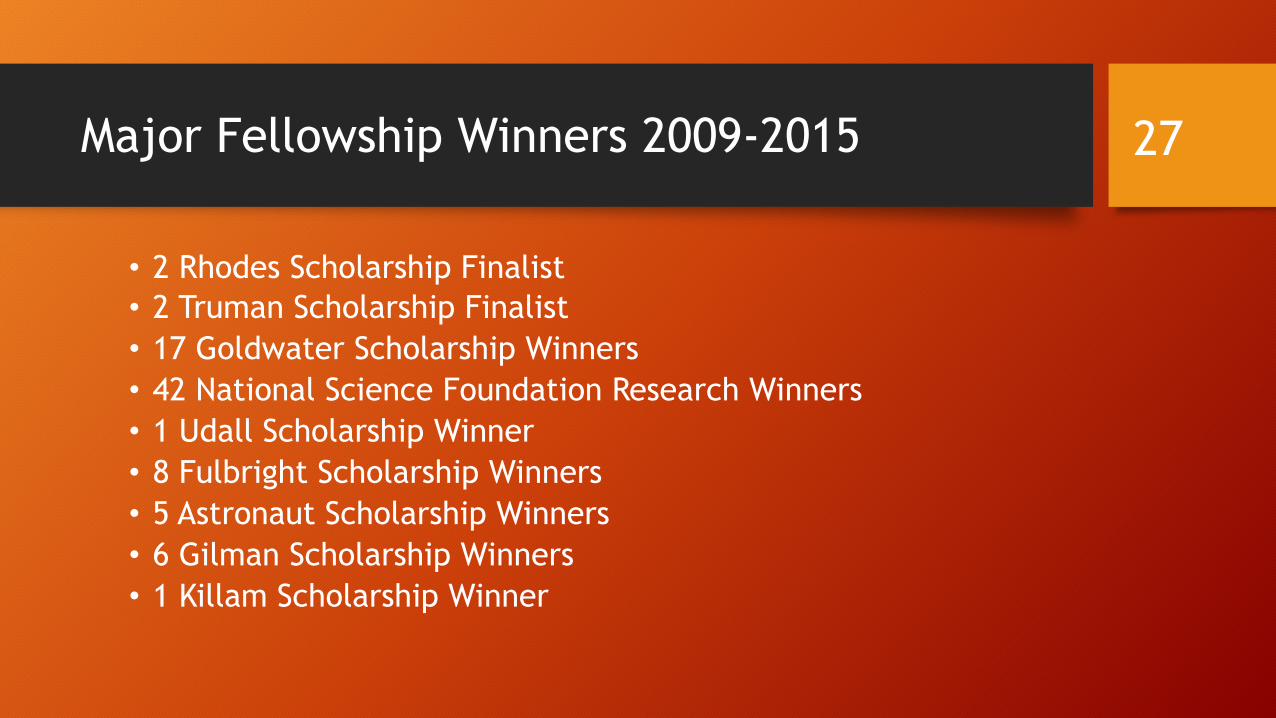
Major Fellowship Winners 2009-2015
• 2 Rhodes Scholarship Finalist • 2 Truman Scholarship Finalist • 17 Goldwater Scholarship Winners • 42 National Science Foundation Research Winners • 1 Udall Scholarship Winner • 8 Fulbright Scholarship Winners • 5 Astronaut Scholarship Winners • 6 Gilman Scholarship Winners • 1 Killam Scholarship Winner
27

Student-to-Faculty Ratio 28

Healthy Behaviors DUI Arrest 29
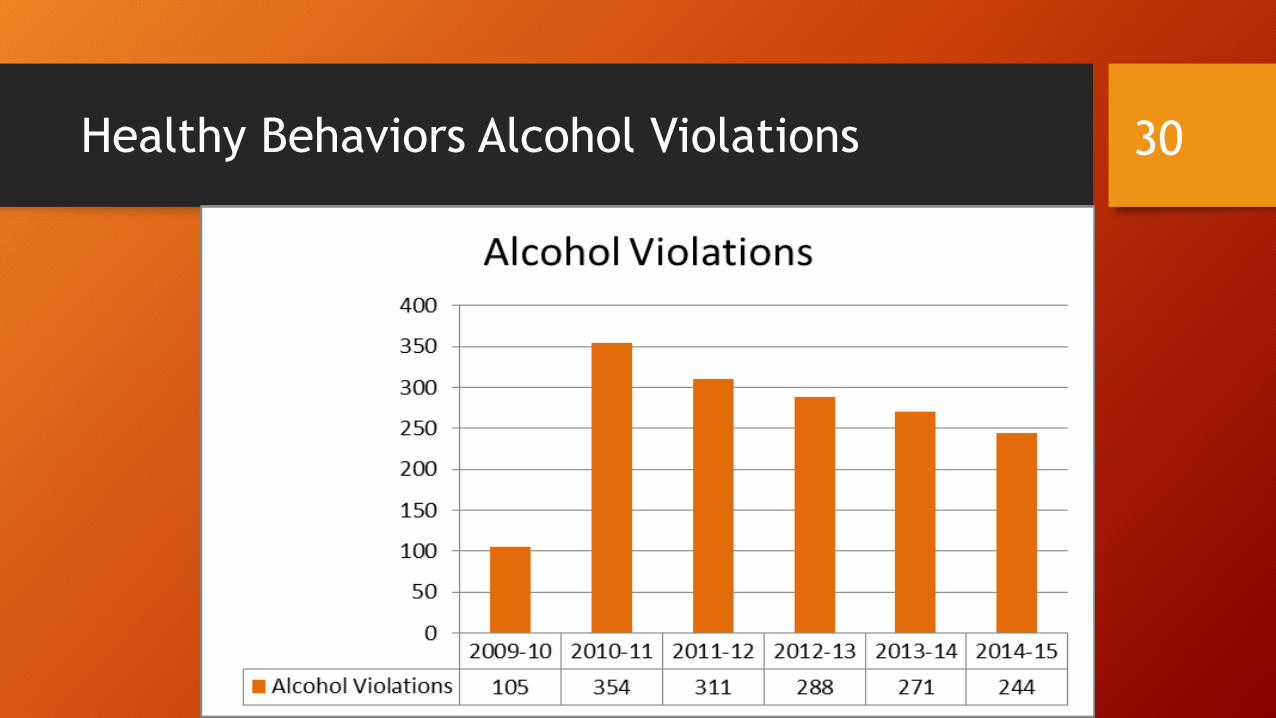
Healthy Behaviors Alcohol Violations 30

Healthy Behaviors Drug Arrest 31
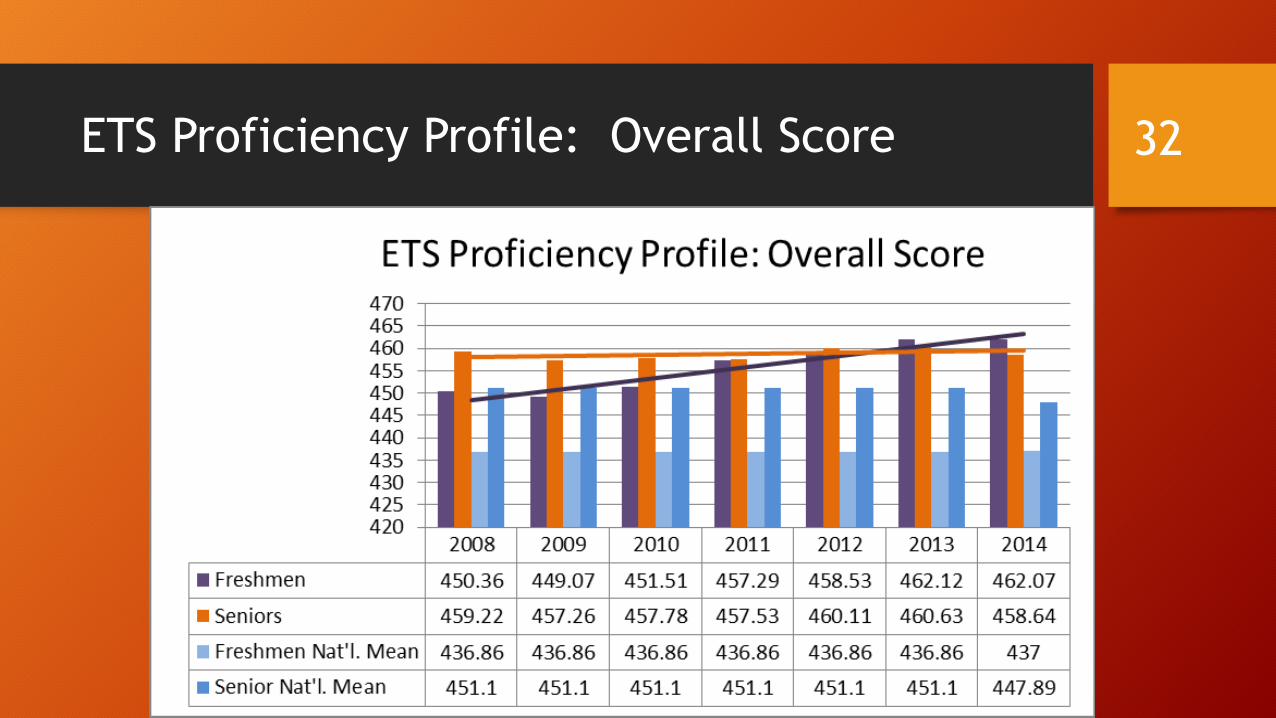
ETS Proficiency Profile: Overall Score 32
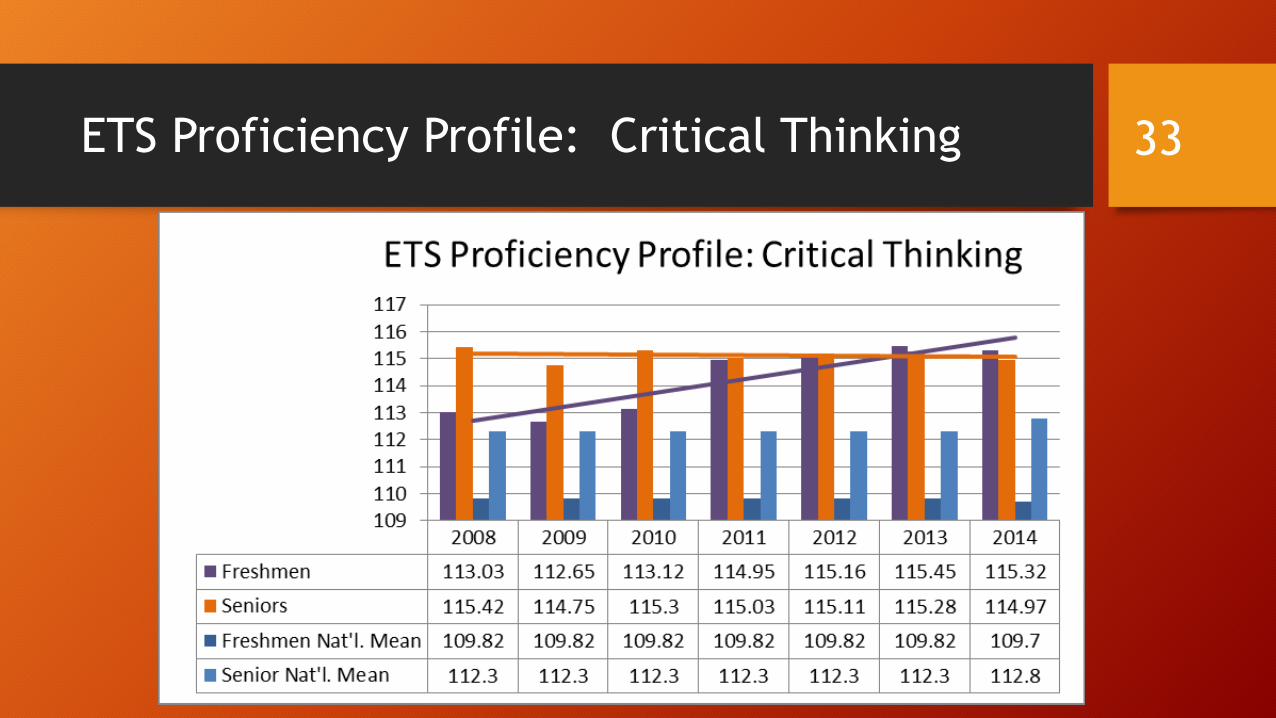
ETS Proficiency Profile: Critical Thinking 33
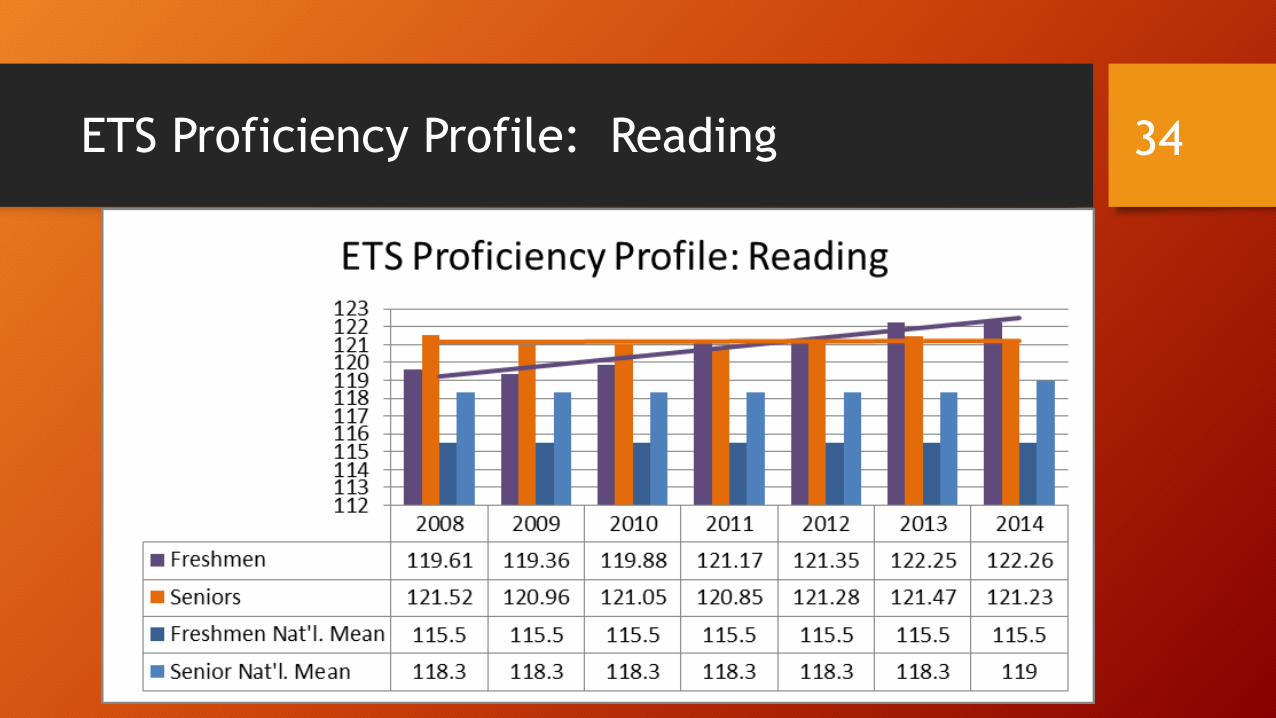
ETS Proficiency Profile: Reading 34

ETS Proficiency Profile: Writing 35
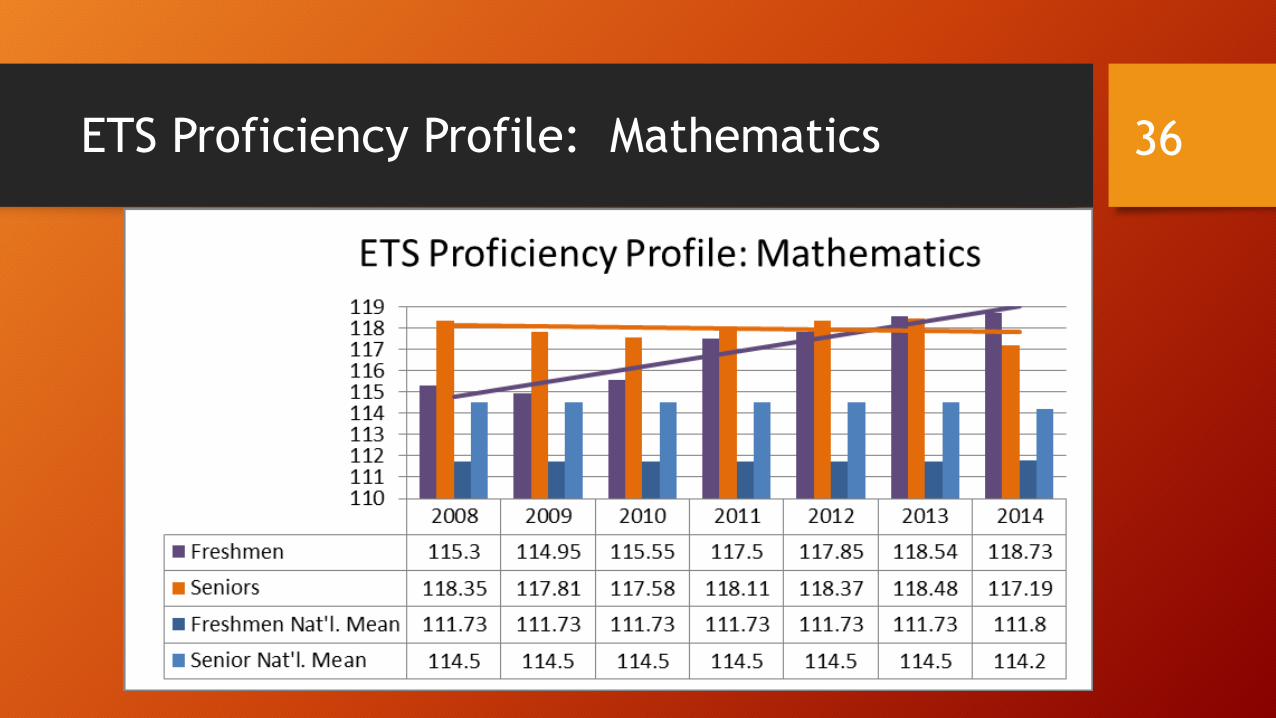
ETS Proficiency Profile: Mathematics 36
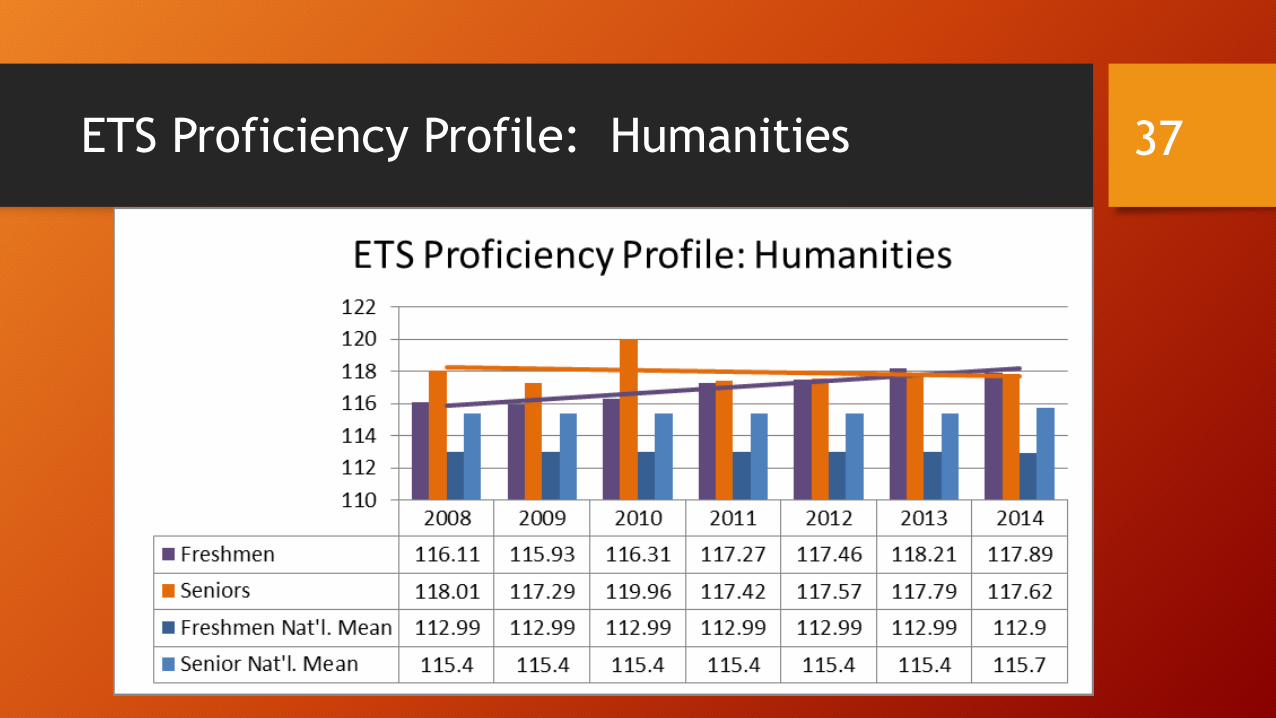
ETS Proficiency Profile: Humanities 37

ETS Proficiency Profile: Social Sciences 38

ETS Proficiency Profile: Natural Sciences 39

Clemson Athletics Highlights
• It was a very exciting year for Clemson student-athletes and their fans. Across campus 19 varsity sports give Tiger fans something to cheer about. • Here are some of the peaks of the year in sports at Clemson.
• Football Academic Progress Rate (APR) ranked in the Top 10% for the last 5 years.
• Both Women’s Golf and Women’s Diving APR scores ranked in the Top 10% • The overall APR for all sports was 994, topping the previous record of 974 in
2008-09. • Student Athletes posted a 3.02 overall GPA for the 2014-15 academic year. • The overall Graduation Success Rate was 91%.
40

Clemson Athletics Highlights
• The football program posted 10 wins for the fourth consecutive season for only the second time in school history. • Seven teams finished in the Top 25 – football, women’s tennis,
women’s soccer, women’s indoor track, and men’s golf. • Five teams participated in NCAA post season tournaments –
baseball, women’s tennis, men’s golf, men’s soccer, and women’s soccer. • Facilities upgrades include new baseball players complex,
upgraded suite and club levels at Memorial Stadium, new playing surface at Historic Riggs Field, upgrades to Jervey gymnasium, completion of the WestZone bridge/oculus project.
41
Provide Engagement Opportunities for all Students
• Engagement pays off for students during their tenure at the University and long afterward. Studies have repeatedly proven that students who are deeply engaged in their college experience have a greater academic success in the areas of retention, grades and graduation. • Employers also make a strong case for the advantage that these
engaged students bring to the workplace in the form of skills such as teamwork, leadership, communication and analytical thinking. Clemson continues to offer opportunities for engagement through cooperative education, undergraduate and graduate research, and internships – both on and off campus.
42

Provide Engagement Opportunities for all Students
• One highly successful engagement program has been the on-campus internship program, University Professional Internship/Co-op Program (UPIC). The program began in 2012 with 31 internships. In 2014-15, that number had reached 861, with students serving a wide variety of roles across the campus.
43

Provide Engagement Opportunities for all Students
• Road Map strategies to increase participation in engagement include; • Teaching differently to stimulate creativity; • Adding or enhancing living learning communities; • Doubling the number of students participating in Creative Inquiry, service
learning and study abroad; • Providing on-campus internships that give students opportunities to help run
the University; • Incorporating engagement throughout student-life programing.
44
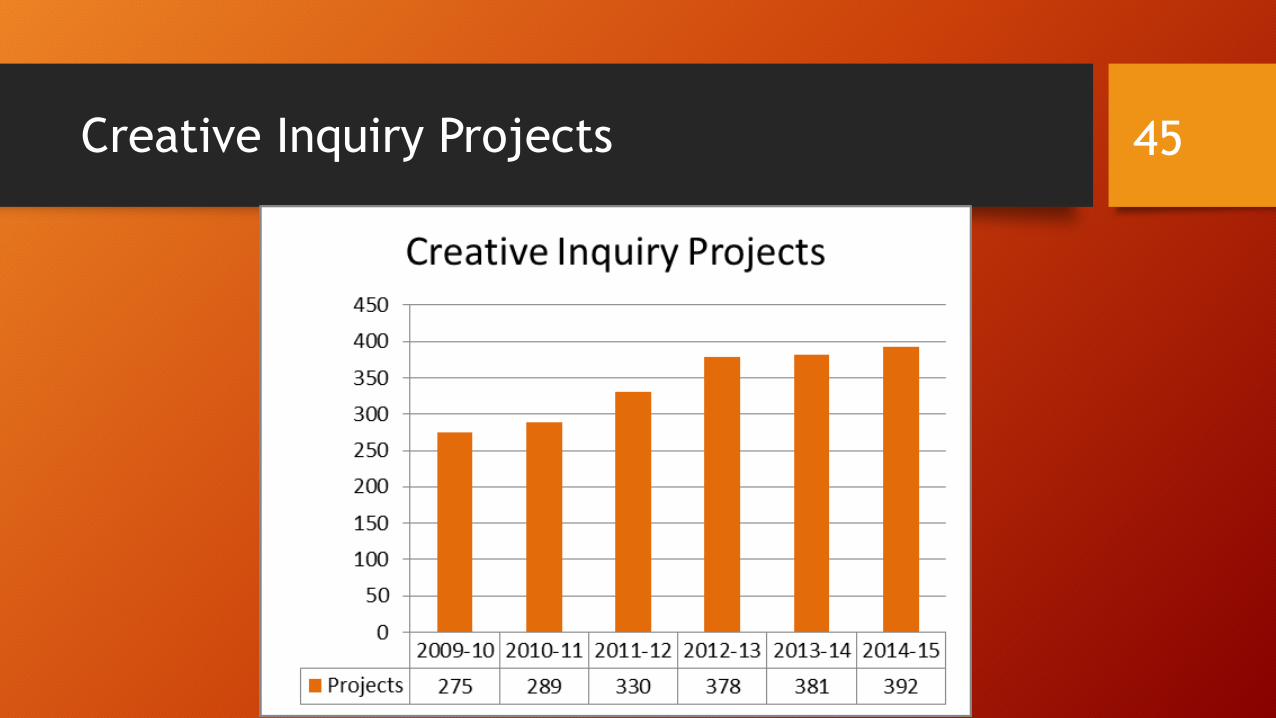
Creative Inquiry Projects 45
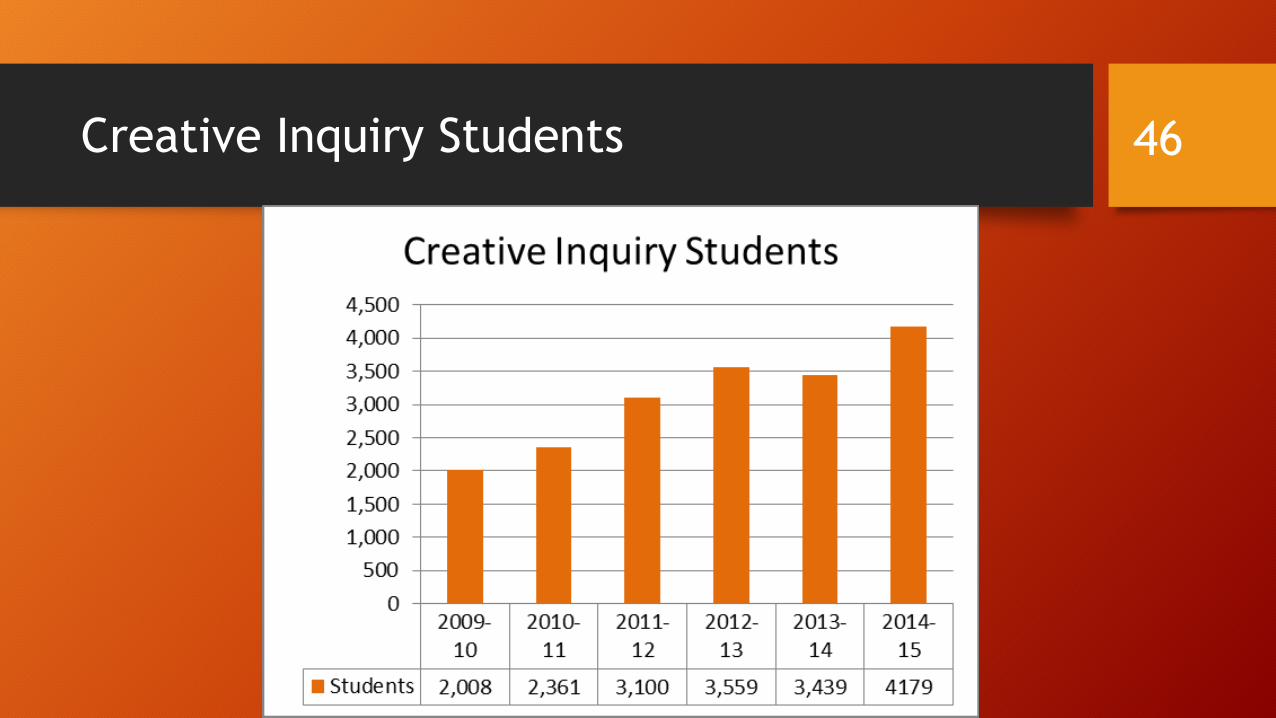
Creative Inquiry Students 46

Academic Internships and Co-Op’s 47

University Professional Internships and Co-Op’s (UPIC) 48
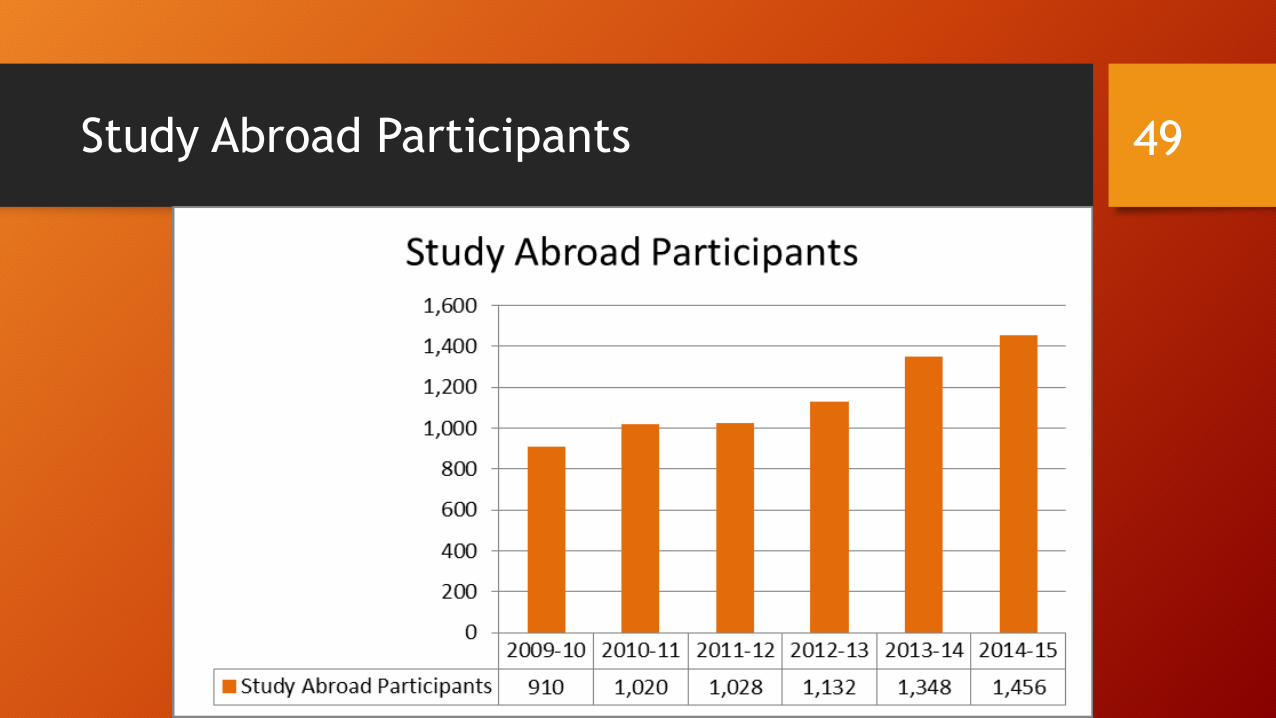
Study Abroad Participants 49

Sections of Clemson Thinks2 50

Students in Clemson Thinks 2 51
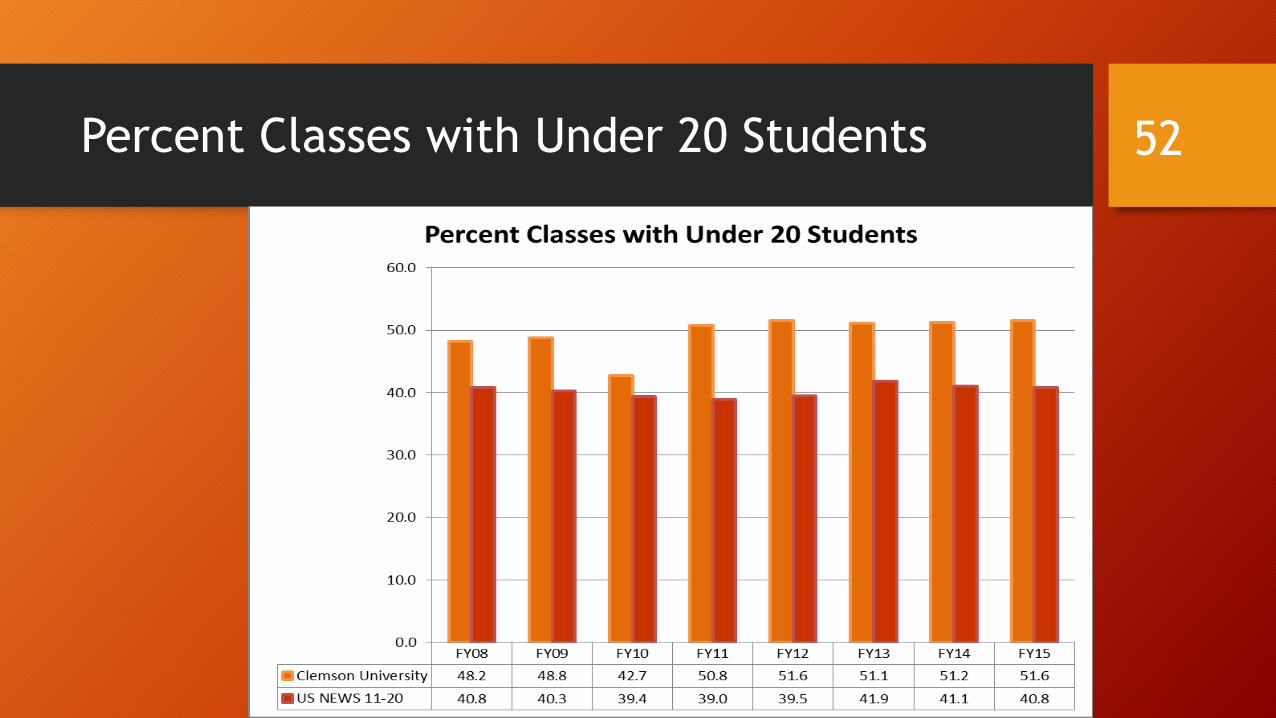
Percent Classes with Under 20 Students 52

Percent Classes with 50 or More Students 53
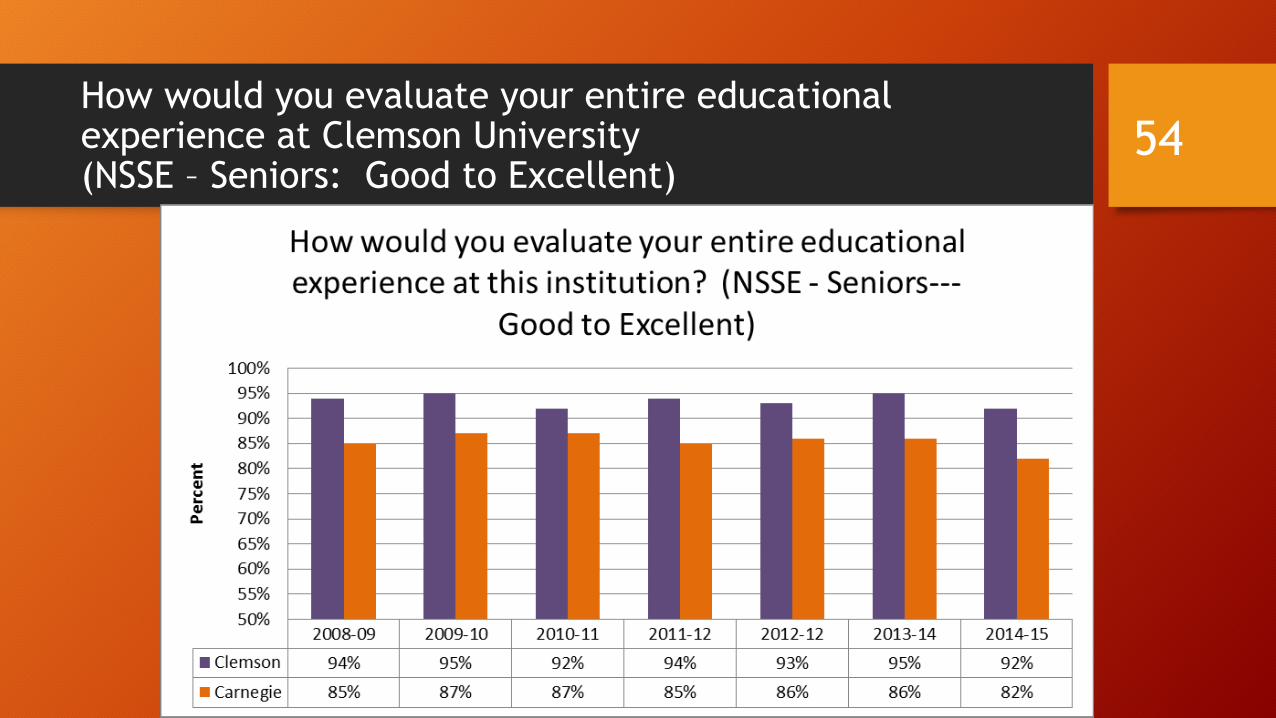
How would you evaluate your entire educational experience at Clemson University (NSSE – Seniors: Good to Excellent)
54
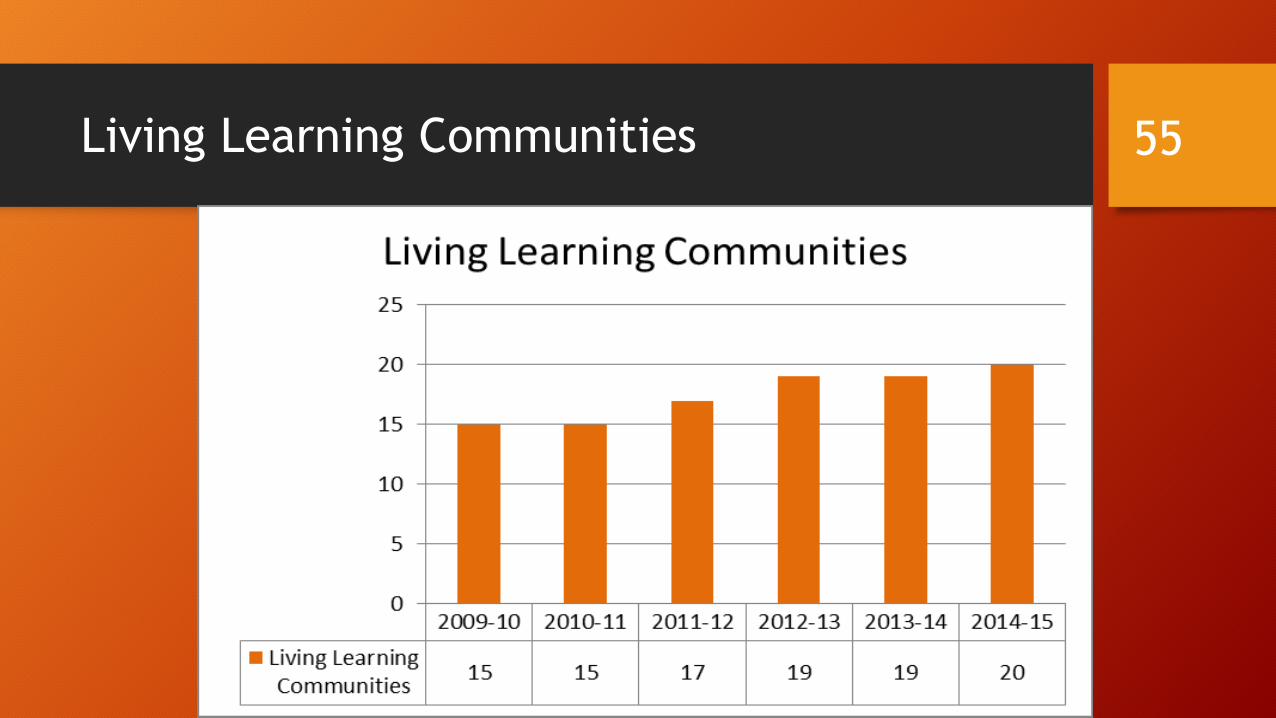
Living Learning Communities 55

Living Learning Communities Students 56

Attract, Retain and Reward Outstanding Faculty and Staff
• Outstanding faculty are vital to the health of the University, and recruiting and retaining top faculty through competitive compensation, adding faculty in focus areas and providing the support for enrollment and program management makes this goal attainable.
57

Attract, Retain and Reward Outstanding Faculty and Staff
• The five-year Compensation Plan continues in its implementation and included a general cost-of-living increase and performance-driven and incentive-based bonuses for faculty and staff. Within this period, new faculty were added, including a number in strategic areas. • Road Map strategies include
• Providing competitive compensation; • Adding faculty or teams of faculty in research focus areas and; • Recruiting champions in enrollment management, summer programs, online
education and student engagement.
58

Faculty Resource Rank 59

Percent of Faculty with a Ph.D. 60

Full-Time Faculty 61
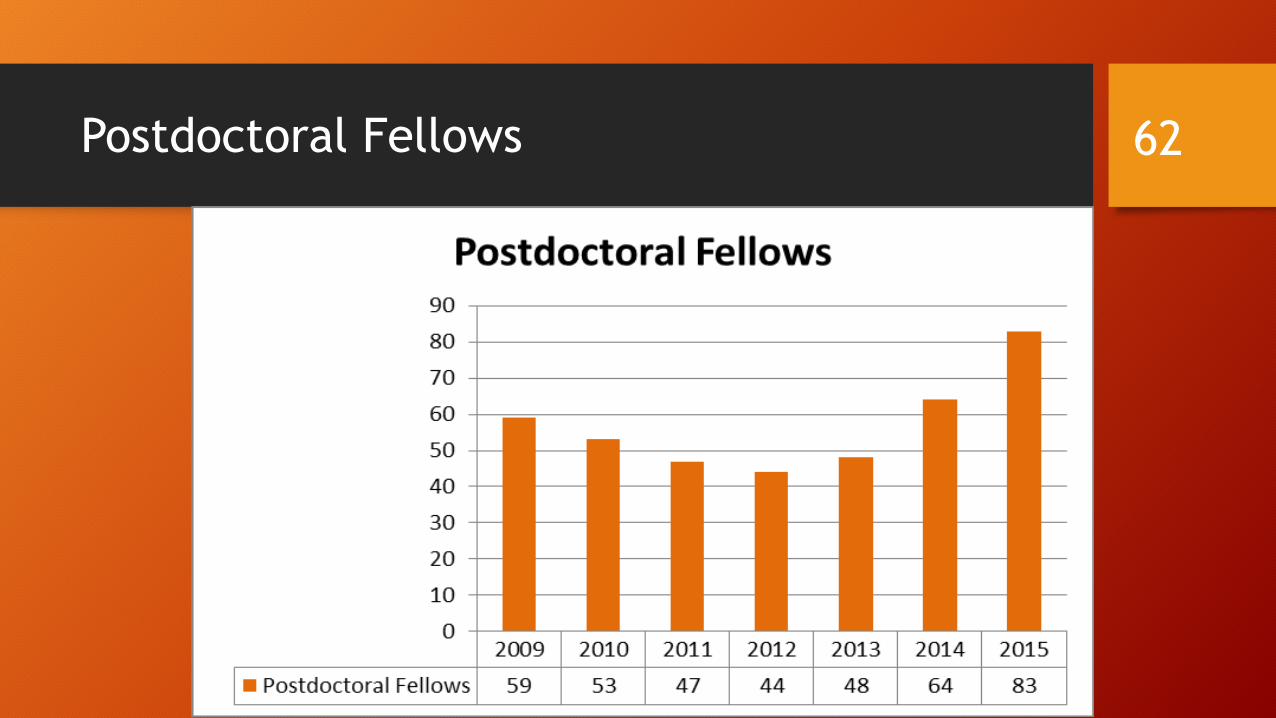
Postdoctoral Fellows 62

Research Faculty 63

Clemson University Mean Full Professor Salary as Compared to Oklahoma Faculty Salary Survey 64
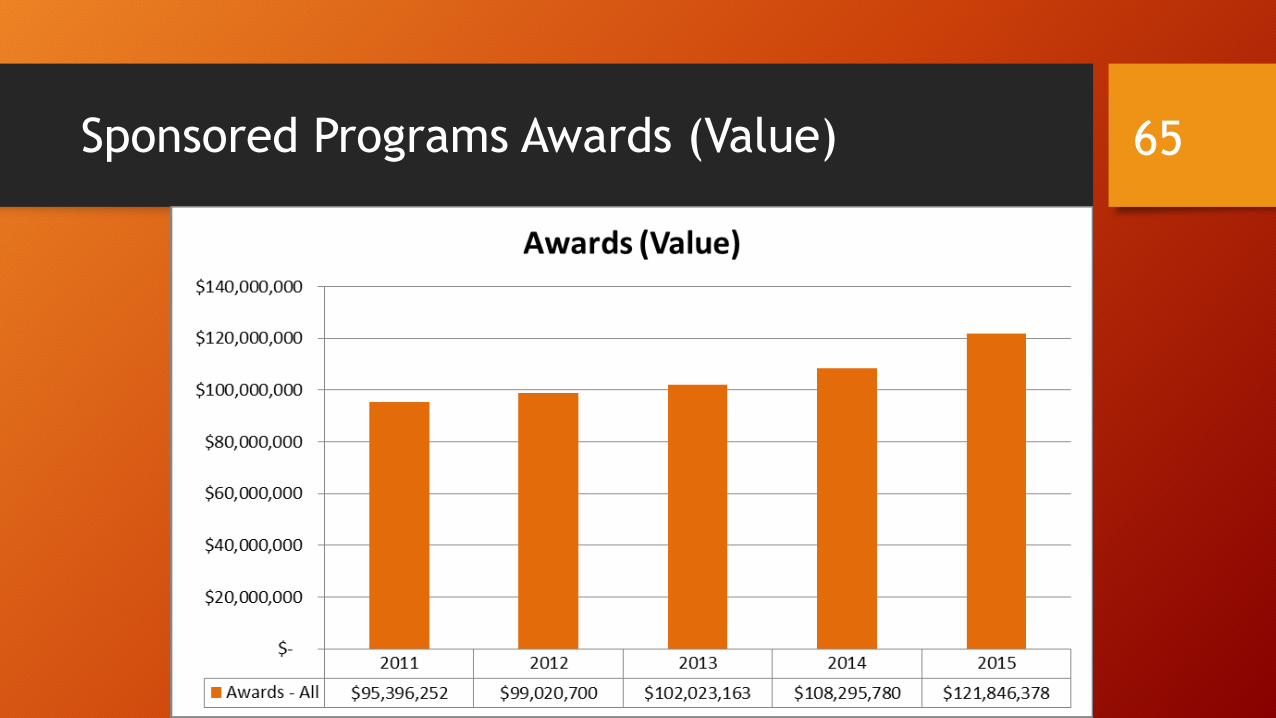
Sponsored Programs Awards (Value) 65
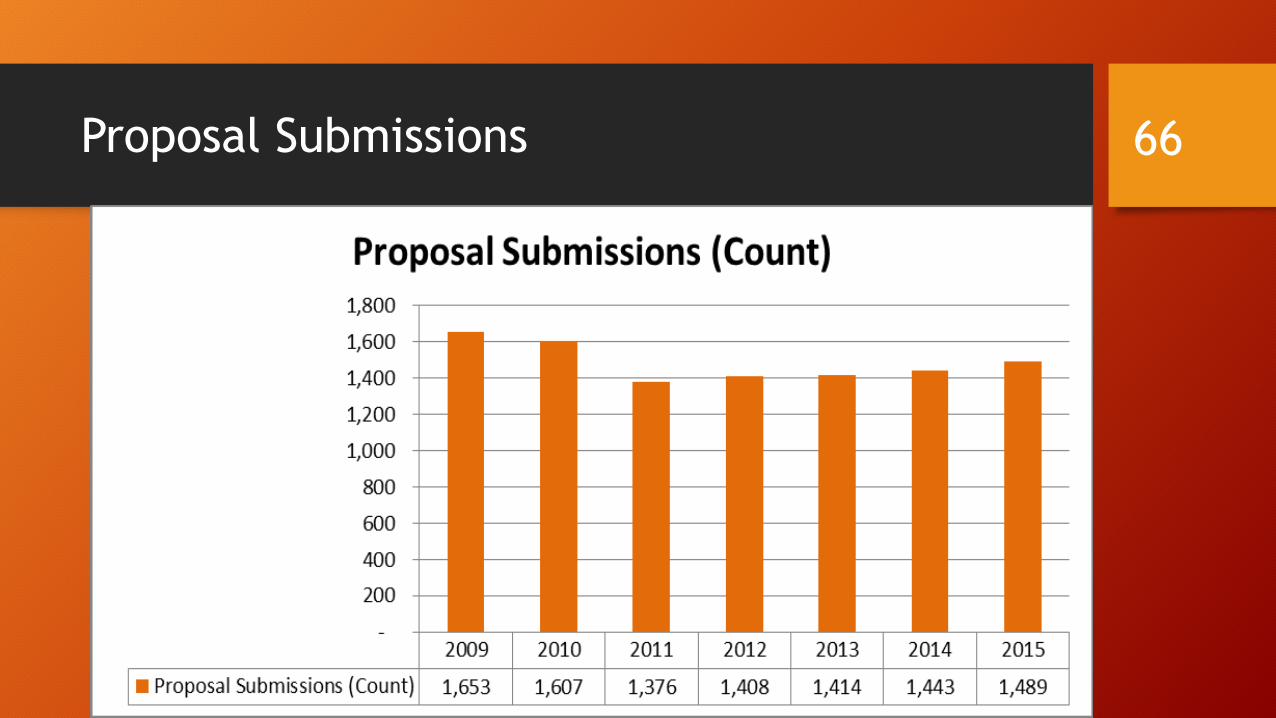
Proposal Submissions 66
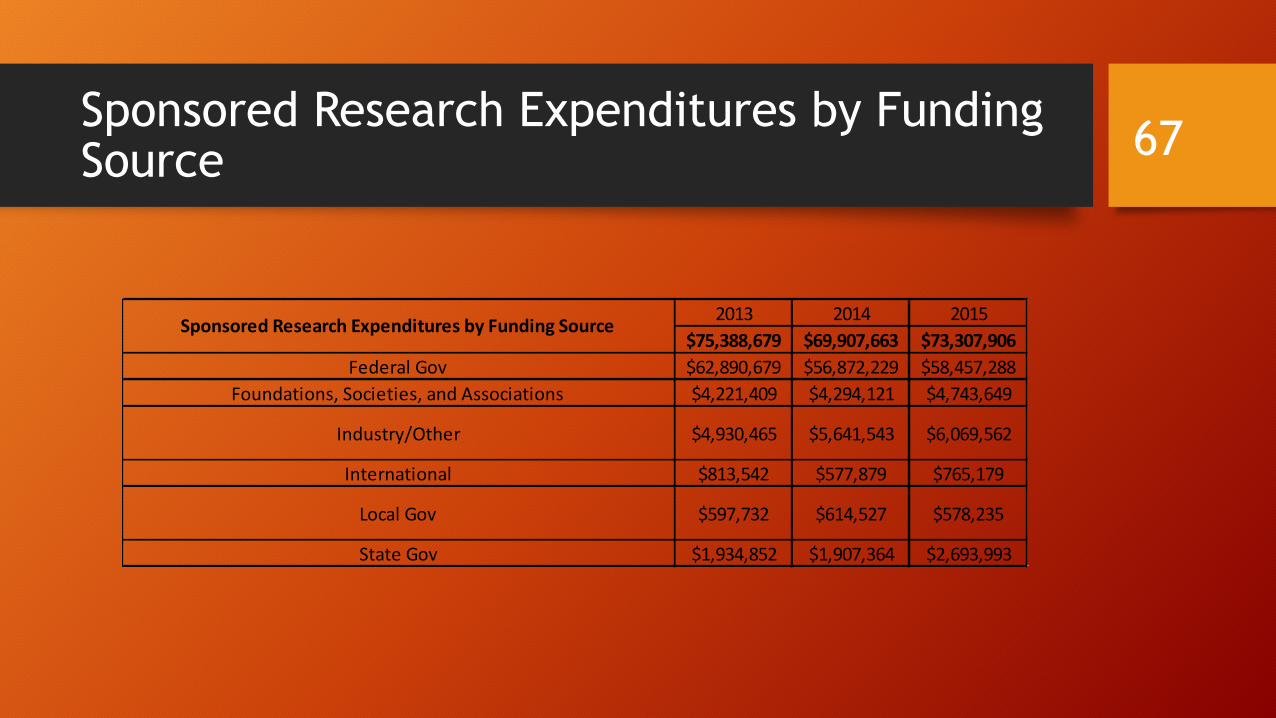
Sponsored Research Expenditures by Funding Source
2013 2014 2015$75,388,679 $69,907,663 $73,307,906
FederalGov $62,890,679 $56,872,229 $58,457,288Foundations,Societies,andAssociations $4,221,409 $4,294,121 $4,743,649
Industry/Other $4,930,465 $5,641,543 $6,069,562
International $813,542 $577,879 $765,179
LocalGov $597,732 $614,527 $578,235
StateGov $1,934,852 $1,907,364 $2,693,993
SponsoredResearchExpendituresbyFundingSource
67

Sponsored Research by Business Unit
RESEARCHPROCESS 2013 2014 2015SponsoredResearchExpendituresbyBusinessUnit 75,388,679$ 69,907,664$ 73,307,909$AAH 504,683$ 378,112$ 419,826$CAFLS 13,786,867$ 11,367,002$ 9,948,298$CBBS 1,906,528$ 1,585,854$ 1,686,018$COES 43,244,291$ 41,407,944$ 41,147,344$HEHD 5,586,560$ 5,671,050$ 6,782,152$CCIT 1,996,620$ 1,631,199$ 3,400,258$PSA 5,294,784$ 5,598,121$ 5,765,430$VPforRes&InterdiscInst 1,330,014$ 563,027$ 372,808$
AllOther 1,738,332$ 1,705,355$ 3,785,775$
68
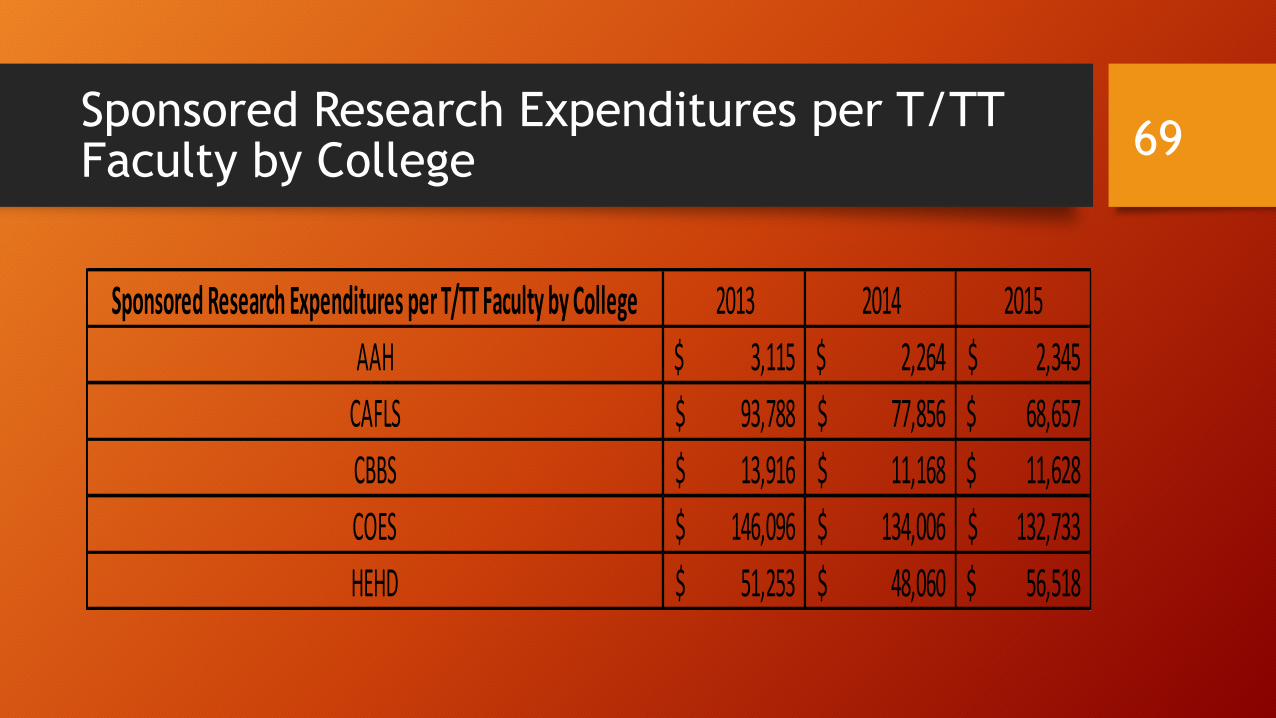
Sponsored Research Expenditures per T/TT Faculty by College
SponsoredResearchExpendituresperT/TTFacultybyCollege 2013 2014 2015AAH 3,115$ 2,264$ 2,345$CAFLS 93,788$ 77,856$ 68,657$CBBS 13,916$ 11,168$ 11,628$COES 146,096$ 134,006$ 132,733$HEHD 51,253$ 48,060$ 56,518$
69

Sponsored Research Expenditures by Emphasis Area
SponsoredResearchExpendituresbyEmphasisArea 75,388,679$ 64,908,663$ 73,307,906$
AdvancedMaterials 14,258,840$ 11,288,090$ 10,713,746$Automotive&TransportationTechnology 4,687,300$ 5,680,684$ 7,236,984$Biotechnology&BiomedicalSciences 11,953,360$ 9,459,648$ 10,060,574$
Family&CommunityLiving 5,110,644$ 4,332,146$ 4,989,424$
GeneralEducation 2,618,598$ 2,929,771$4,023,792$
Information&CommunicationTechnology 10,277,111$ 10,513,388$ 10,137,409$Leadership&Entrepreneurship 1,633,044$ 1,235,240$ 818,397$
Other 6,518,006$ 7,591,364$ 7,401,285$SustainableEnvironment 18,331,776$ 11,878,332$ 17,926,295$
70
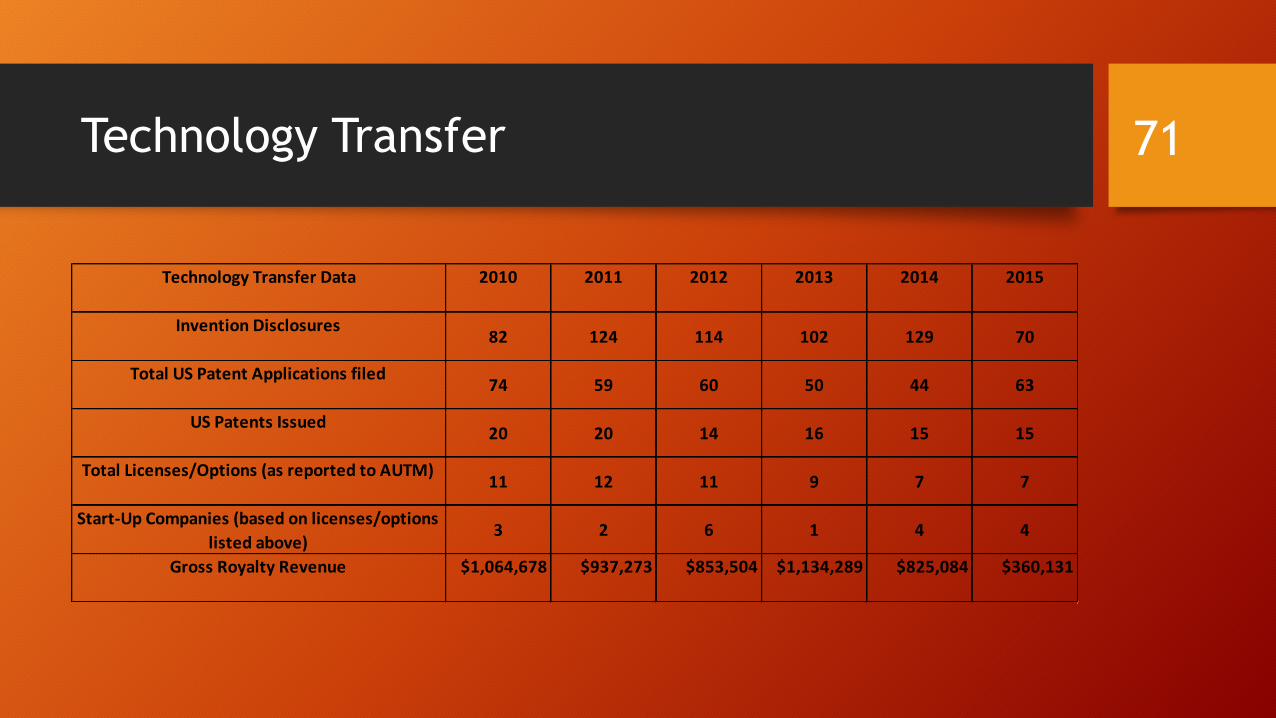
Technology Transfer 71
2010 2011 2012 2013 2014 2015
82 124 114 102 129 70
74 59 60 50 44 63
20 20 14 16 15 15
11 12 11 9 7 7
3 2 6 1 4 4
$1,064,678 $937,273 $853,504 $1,134,289 $825,084 $360,131GrossRoyaltyRevenue
Start-UpCompanies(basedonlicenses/optionslistedabove)
TechnologyTransferData
InventionDisclosures
TotalUSPatentApplicationsfiled
USPatentsIssued
TotalLicenses/Options(asreportedtoAUTM)
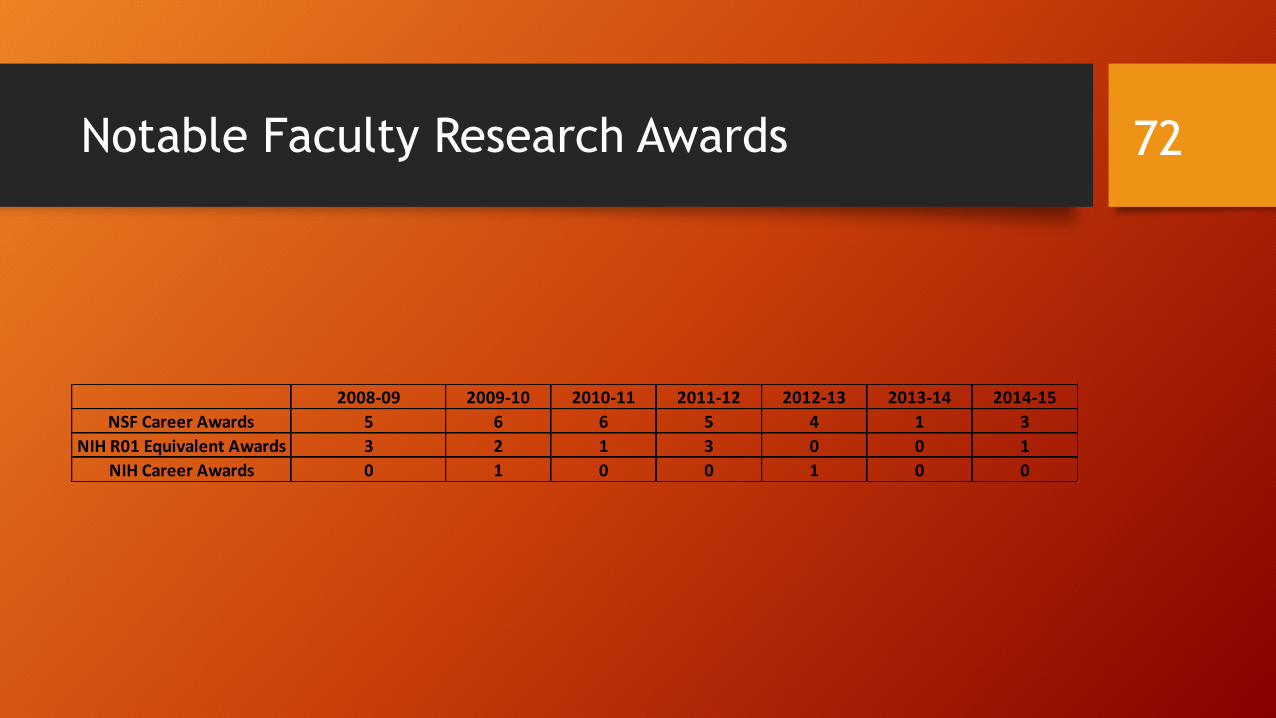
Notable Faculty Research Awards
2008-09 2009-10 2010-11 2011-12 2012-13 2013-14 2014-15NSFCareerAwards 5 6 6 5 4 1 3
NIHR01EquivalentAwards 3 2 1 3 0 0 1NIHCareerAwards 0 1 0 0 1 0 0
72
Build to Compete – Facilities, Infrastructure, and Technology
• Perhaps the most visible element of the Road Map is the goal of providing our students, faculty and staff with the tools they need to succeed. Technology and facilities are being remodeled, replaced and upgraded across the campus. The implementation of the plan has begun and is now moving ahead – all in support of goals of student, faculty and staff performance, campus-wide engagement and economics development.
73

Project Updates Since 2012-2013
• Improvements to housing and dining facilities including the addition of the Boar’s Head Deli at Fernow Street Café and Panda Express at the Hendrix Center. • The Watt Family Innovation Center will be completed in occupied
in the fall of 2015. • Freeman Hall addition is completed and occupied. • Doug Kingsmore Stadium expansion will be completed in fall of
2015. • Core Campus and Douthit Hills projects construction are now
underway.
74

Technology-Enhanced Classrooms 75
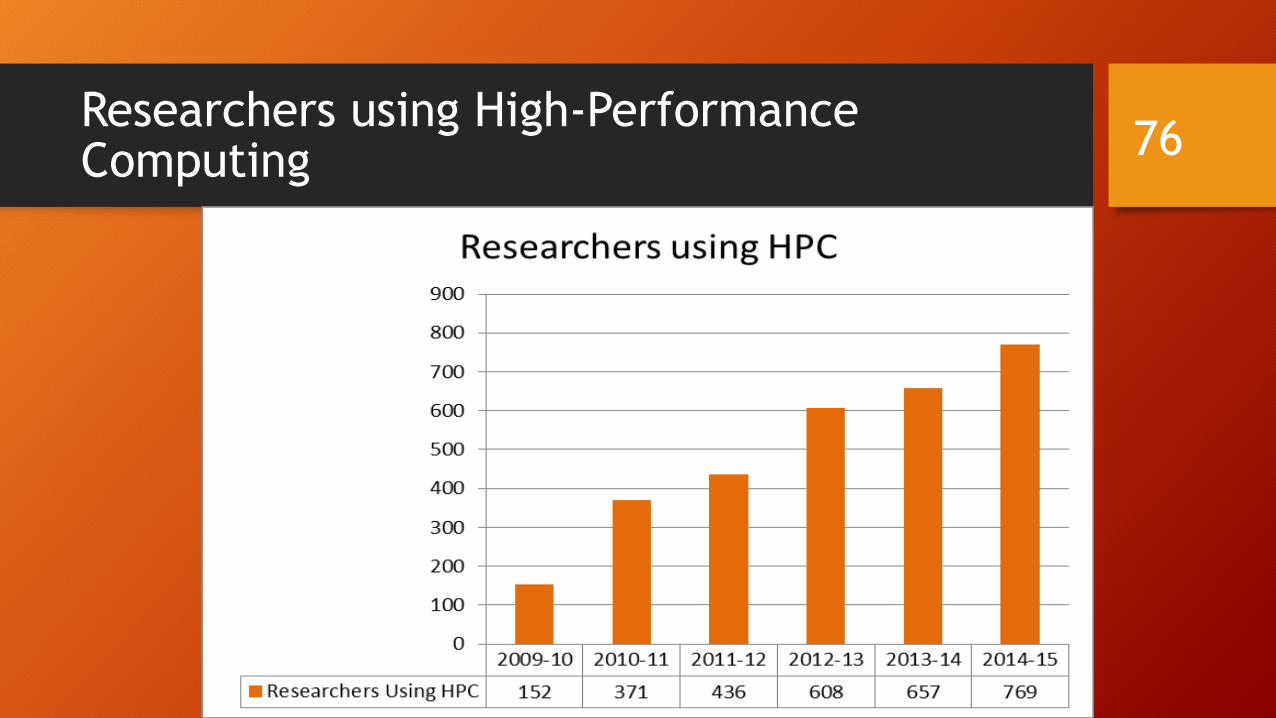
Researchers using High-Performance Computing 76

Departments using High-Performance Computing 77

Compute Hours in Millions 78
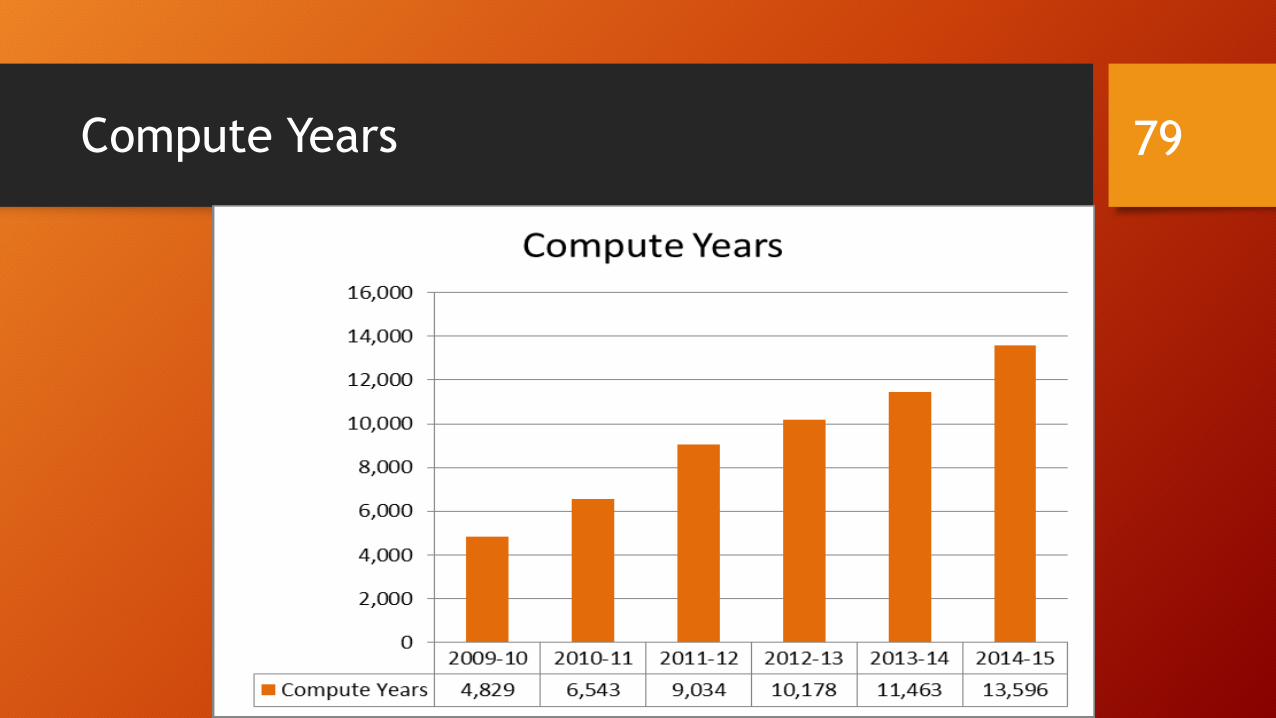
Compute Years 79
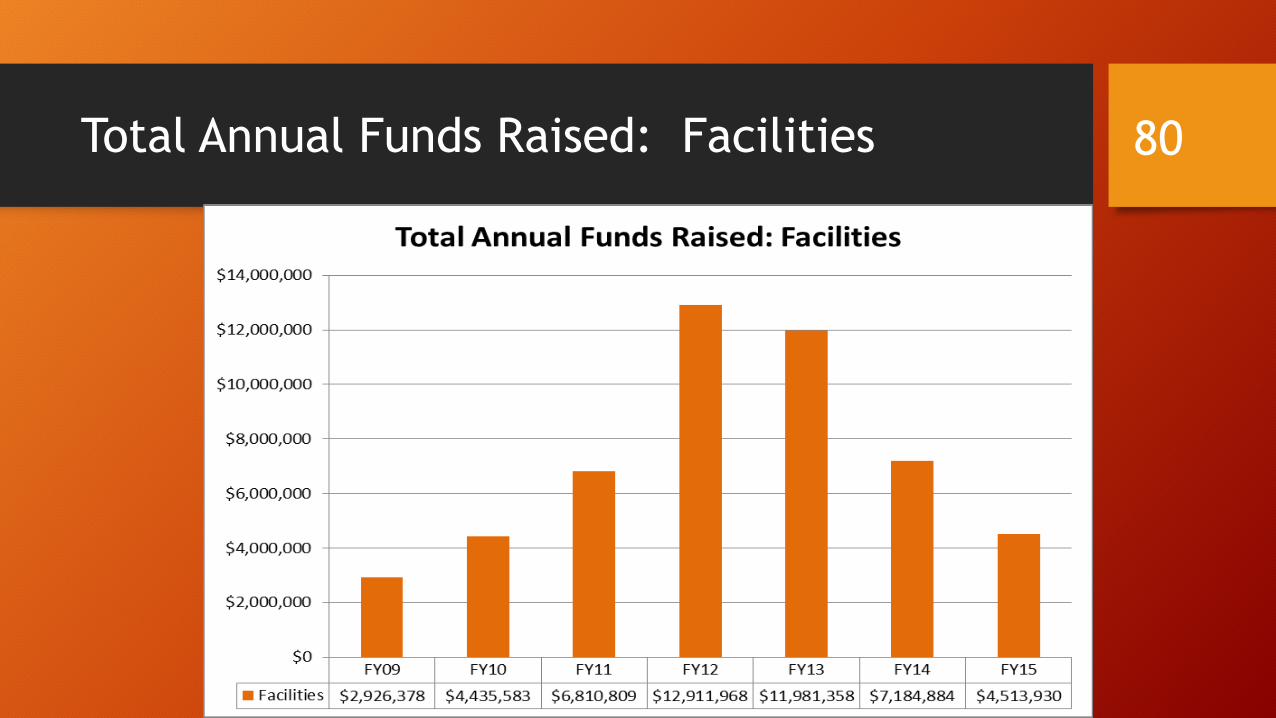
Total Annual Funds Raised: Facilities 80

Divest to Invest and Generate Alternative Revenues to help Fund the Road Map
• In order to implement the goals of the 2020 Road Map and to ensure that Clemson remains a strong institution far into the future, financial resources are vital. • The road Map calls for both divestment and new revenue
generation. During the fifth year of the plan, the Will to Lead for Clemson continued on its goal of $1 billion, raising $688 million as of the end of FY15. • During this same period, alumni giving rose with 22,341 alumni
giving to the University. IPTAY giving also reached $28.6 million.
81
Divest to Invest and Generate Alternative Revenues to help Fund the Road Map
• Divestment and reallocation targets call for: • Reducing personnel cost through attrition and selective outsourcing of non-
core functions; • Reducing administrative and institutional support cost; • Reducing state funding for units that can generate alternative revenues
82

Total R & D Expenditures in $1,000s 83

Average Alumni Giving Rate 84

Total Annual Funds Raised 85
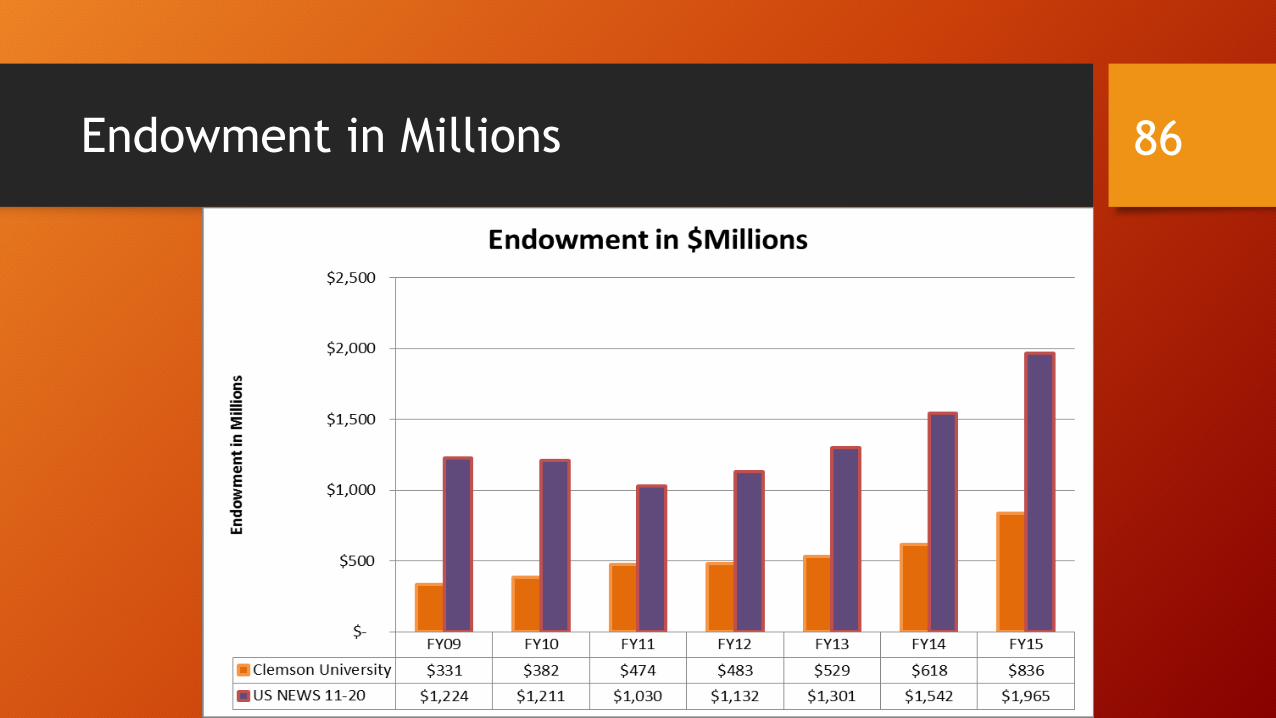
Endowment in Millions 86
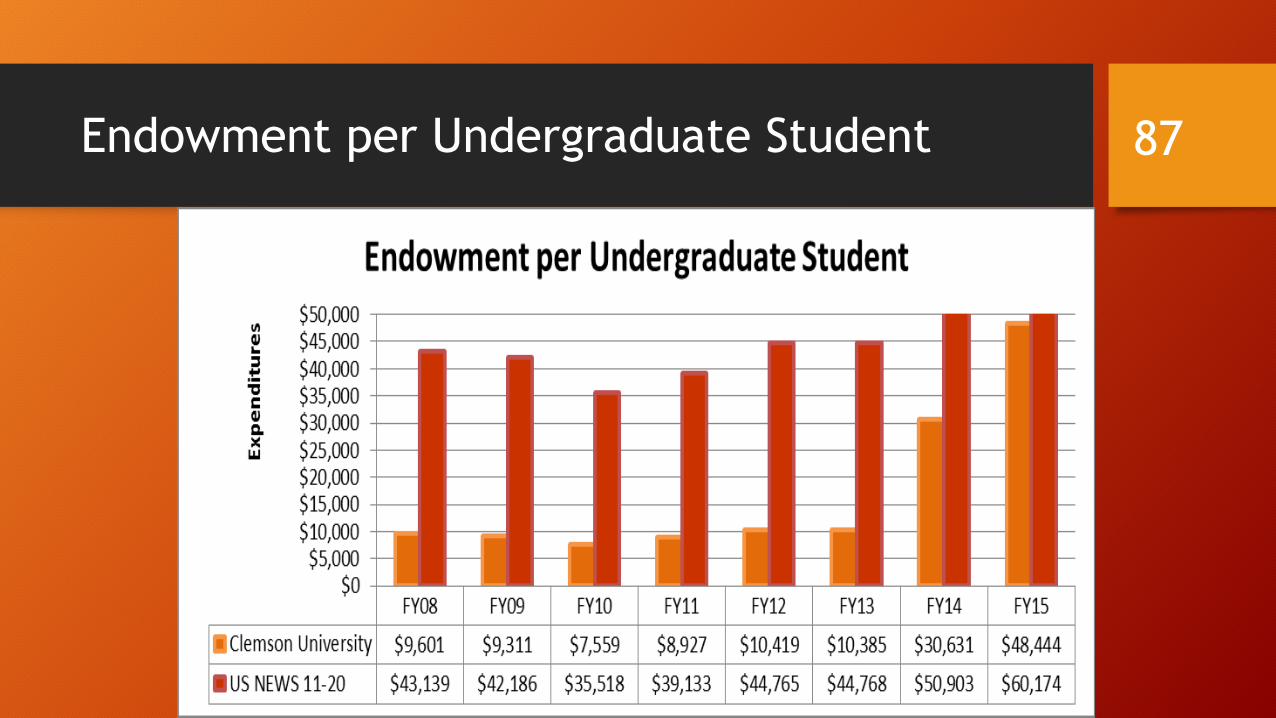
Endowment per Undergraduate Student 87

Educational Expenditures per Undergraduate Student 88

Financial Resource Rank 89

Total Online Courses 90
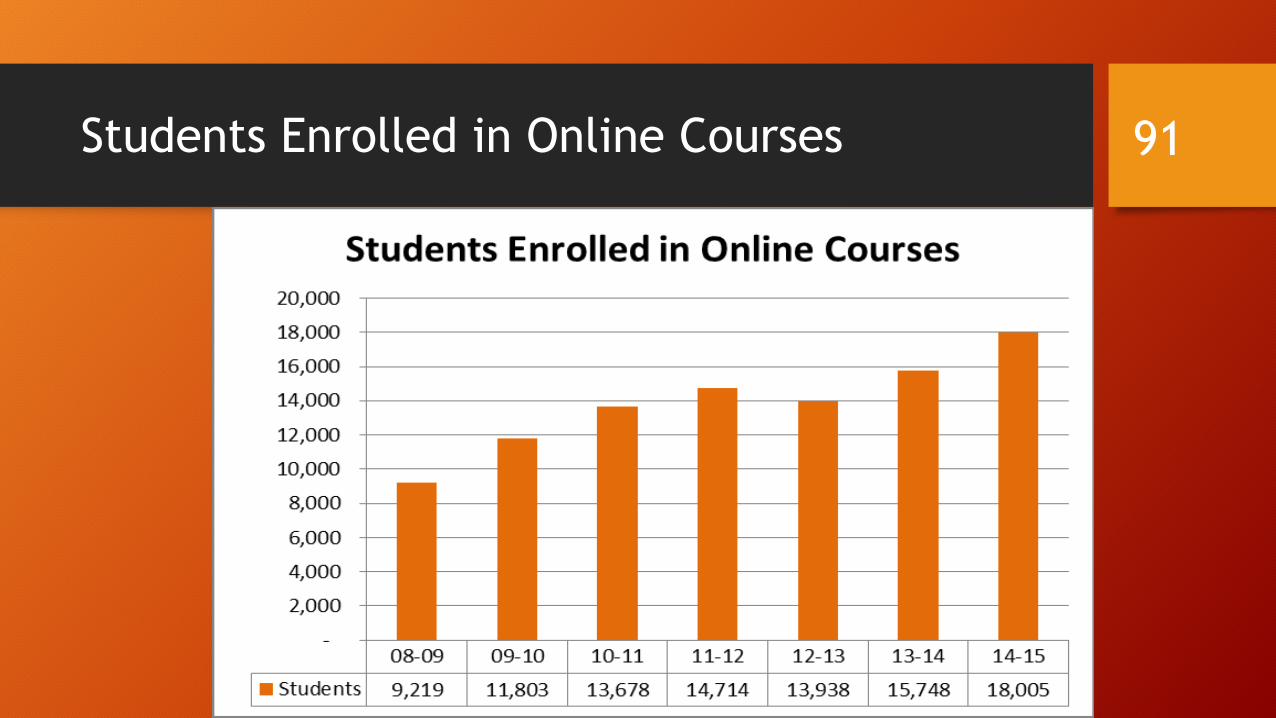
Students Enrolled in Online Courses 91
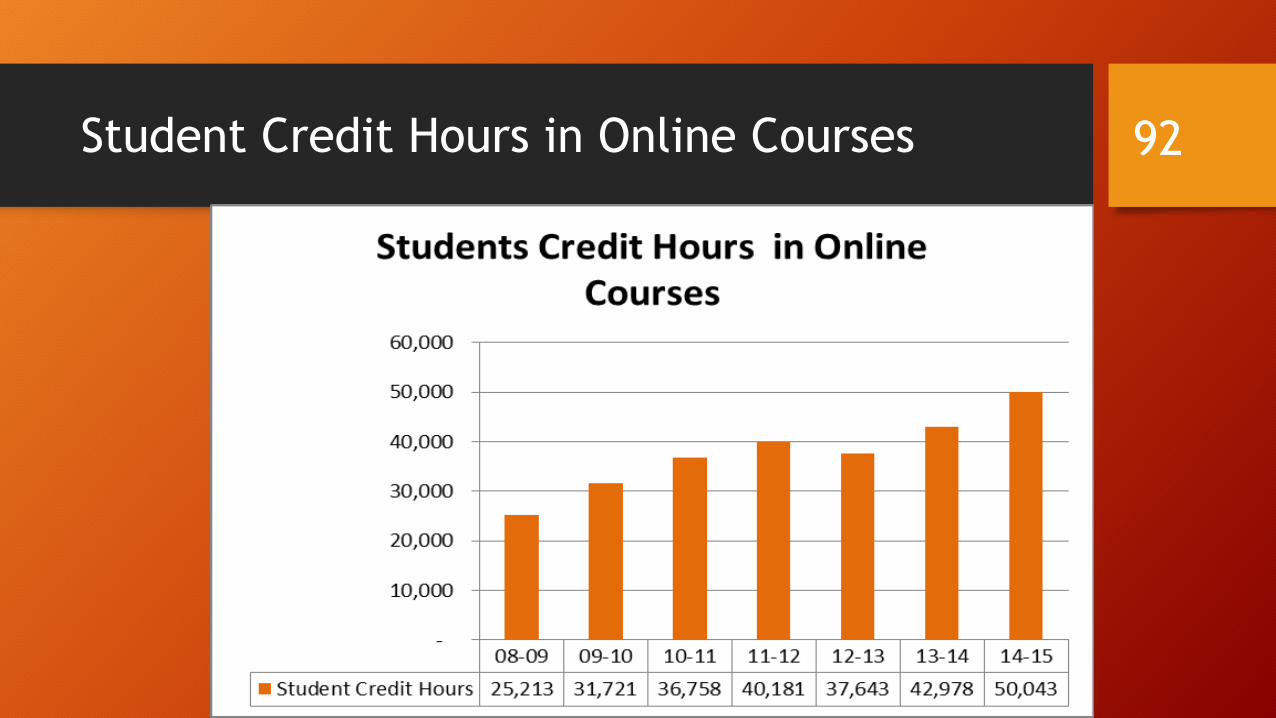
Student Credit Hours in Online Courses 92

Summer School Enrollments 93

Summer School Courses 94

Summer School Credit Hours 95

State Appropriations 96

E & G State Appropriations per FTE 97


![CLEMSON UNIVERSITY Doctoral Hooding Ceremony · 2020-01-06 · 4 a Brief History of graDuate eDucation anD tHe graDuate scHool at clemson university [Clemson’s faculty] would engage](https://img.pdfslide.us/doc/110x75/5e9195993a87b17c06608514/clemson-university-doctoral-hooding-ceremony-2020-01-06-4-a-brief-history-of-graduate.jpg)