Embed Size (px)
Citation preview

CLEARVIEW REGIONAL HIGH SCHOOL DISTRICT
Mullica Hill, New JerseyCounty of Gloucester
COMPREHENSIVE ANNUAL FINANCIAL REPORTFOR THE FISCAL YEAR ENDED JUNE 30, 2015


Clearview Regional High School DistrictFinance Department
COMPREHENSIVE ANNUAL FINANCIAL REPORT
OF THE
CLEARVIEW REGIONAL HIGH SCHOOL DISTRICT
MULLICA HILL, NEW JERSEY
FOR THE FISCAL YEAR ENDED JUNE 30, 2015
Prepared by


PAGE
Letter of Transmittal 1Organizational Chart 5Roster of Officials 6Consultants and Advisors 7
Independent Auditors' Report 11
REQUIRED SUPPLEMENTARY INFORMATION - PART I
Management's Discussion & Analysis 17
BASIC FINANCIAL STATEMENTS
A. Government-Wide Financial Statements:A-1 Statement of Net Position 37A-2 Statement of Activities 38
B. Fund Financial Statements:Governmental Funds:
B-1 Balance Sheet 45B-2 Statement of Revenues, Expenditures & Changes in Fund Balance 46B-3 Reconciliation of the Statement of Revenues, Expenditures & Changes in Fund
Balance of Governmental Funds to the Statement of Activities 47Proprietary Funds:
B-4 Statement of Net Position 51B-5 Statement of Revenues, Expenditures & Changes in Fund Net Position 52B-6 Statement of Cash Flows 53
Fiduciary Funds:B-7 Statement of Fiduciary Net Position 57B-8 Statement of Changes in Fiduciary Net Position 58
Notes to Financial Statements 61
REQUIRED SUPPLEMENTARY INFORMATION - PART II
C. Budgetary Comparison Schedules:C-1 Budgetary Comparison Schedule - General Fund 97C-1a Combining Schedule of Revenue, Expenditures & Changes in Fund Balance -
Budget & Actual N/AC-1b Education Jobs Fund Program - Budget & Actual N/AC-2 Budgetary Comparison Schedule - Special Revenue Fund 108
Notes to the Required Supplementary Information - Part IIC-3 Budget-to-GAAP Reconciliation 111
OUTLINE OF CAFR - GASB #34
INTRODUCTORY SECTION
FINANCIAL SECTION
REQUIRED SUPPLEMENTARY INFORMATION - PART III
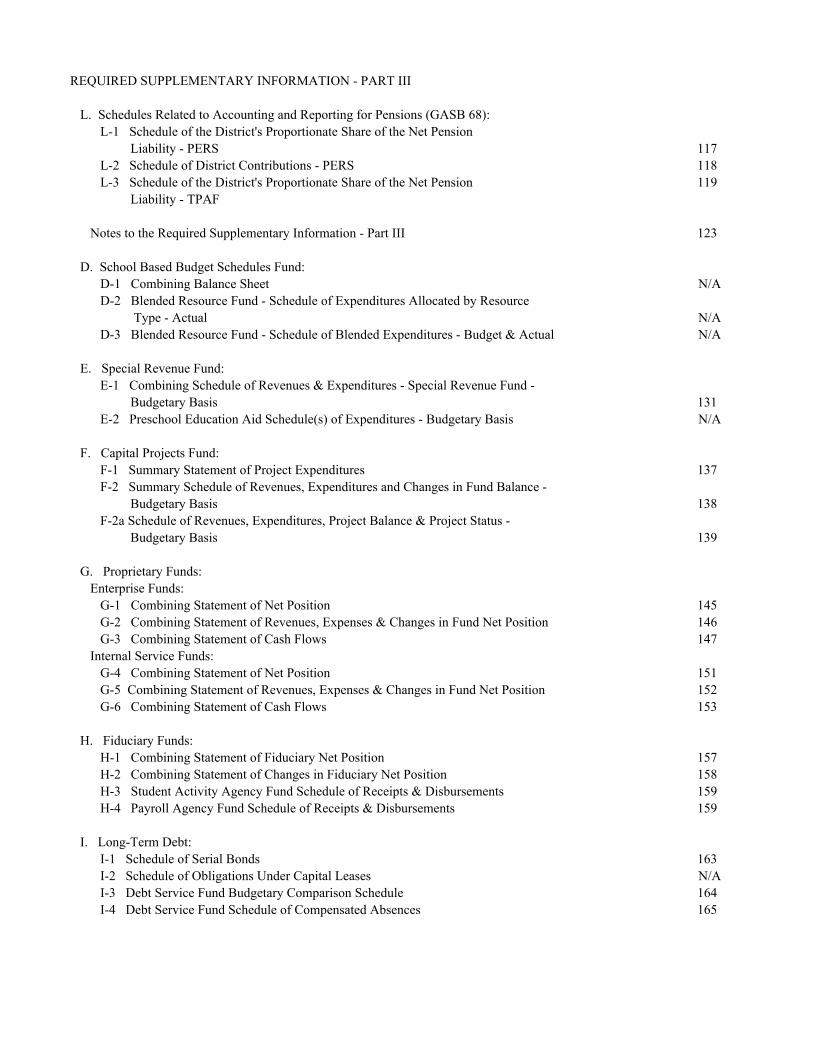
L. Schedules Related to Accounting and Reporting for Pensions (GASB 68):L-1 Schedule of the District's Proportionate Share of the Net Pension
Liability - PERS 117L-2 Schedule of District Contributions - PERS 118L-3 Schedule of the District's Proportionate Share of the Net Pension 119
Liability - TPAF
Notes to the Required Supplementary Information - Part III 123
D. School Based Budget Schedules Fund:D-1 Combining Balance Sheet N/AD-2 Blended Resource Fund - Schedule of Expenditures Allocated by Resource
Type - Actual N/AD-3 Blended Resource Fund - Schedule of Blended Expenditures - Budget & Actual N/A
E. Special Revenue Fund:E-1 Combining Schedule of Revenues & Expenditures - Special Revenue Fund -
Budgetary Basis 131E-2 Preschool Education Aid Schedule(s) of Expenditures - Budgetary Basis N/A
F. Capital Projects Fund:F-1 Summary Statement of Project Expenditures 137F-2 Summary Schedule of Revenues, Expenditures and Changes in Fund Balance -
Budgetary Basis 138F-2a Schedule of Revenues, Expenditures, Project Balance & Project Status -
Budgetary Basis 139
G. Proprietary Funds:Enterprise Funds:
G-1 Combining Statement of Net Position 145G-2 Combining Statement of Revenues, Expenses & Changes in Fund Net Position 146G-3 Combining Statement of Cash Flows 147
Internal Service Funds:G-4 Combining Statement of Net Position 151G-5 Combining Statement of Revenues, Expenses & Changes in Fund Net Position 152G-6 Combining Statement of Cash Flows 153
H. Fiduciary Funds:H-1 Combining Statement of Fiduciary Net Position 157H-2 Combining Statement of Changes in Fiduciary Net Position 158H-3 Student Activity Agency Fund Schedule of Receipts & Disbursements 159H-4 Payroll Agency Fund Schedule of Receipts & Disbursements 159
I. Long-Term Debt:I-1 Schedule of Serial Bonds 163I-2 Schedule of Obligations Under Capital Leases N/AI-3 Debt Service Fund Budgetary Comparison Schedule 164I-4 Debt Service Fund Schedule of Compensated Absences 165

Financial Trends:J-1 Net Position by Component 169J-2 Changes in Net Position 170J-3 Fund Balances - Governmental Funds 173J-4 Changes in Fund Balance - Governmental Funds 174J-5 Other Local Revenue by Source - General Fund 176
Revenue Capacity:J-6 Assessed Value & Estimated Actual Value of Taxable Property 177J-7 Direct & Overlapping Property Tax Rates 178J-8 Principal Property Taxpayers 179J-9 Property Tax Levies & Collections 180
Debt Capacity:J-10 Ratios of Outstanding Debt by Type 181J-11 Ratios of General Bonded Debt Outstanding 182J-12 Direct & Overlapping Governmental Activities Debt 183J-13 Legal Debt Margin Information 184
Demographic & Economic Information:J-14 Demographic & Economic Statistics 185J-15 Principal Employers 186
Operating Information:J-16 Full-Time Equivalent District Employees by Function/Program 187J-17 Operating Statistics 188J-18 School Building Information 189J-19 Schedule of Required Maintenance 190J-20 Insurance Schedule 191
K-1 Independent Auditors' Report on Internal Control Over Financial Reporting and onCompliance and Other Matters Based on an Audit of Financial Statements Performed in Accordance with Government Auditing Standards 195
K-2 Independent Auditors' Report on Compliance for Each Major Program and on Internal Control Over Compliance Required by OMB Circular A-133 and New Jersey OMB Circular(s) 04-04 and/or 15-08 197
K-3 Schedule of Expenditures of Federal Awards, Schedule A 201K-4 Schedule of Expenditures of State Financial Assistance, Schedule B 202K-5 Notes to Schedules of Awards and Financial Assistance 203K-6 Schedule of Findings & Questioned Costs 205K-7 Summary Schedule of Prior Audit Findings 208
STATISTICAL SECTION (unaudited)
SINGLE AUDIT SECTION

This page intentionally left blank

INTRODUCTORY SECTION

This page intentionally left blank.

1

2

3

4

5 5

MEMBERS OF THE BOARD OF EDUCATION TERM EXPIRES
Patrick Campbell, President 2016
Michele Giaquinto, Vice President 2017
David Burgin 2017
Debbie Lundberg 2016
Gregory Fuller 2017
Vincent Caltaldi, Jr. 2016
Karen Vick 2015
Ron Moore 2015
Paul Ware 2015
OTHER OFFICIALS
John Horchak, III, Superintendent
Esther R. Pennell, CPA, School Business Administrator
Frank P. Cavallo, Jr., Esquire, Solicitor
CLEARVIEW REGIONAL HIGH SCHOOL DISTRICT420 Cedar Road
Mullica Hill, New Jersey 08062
ROSTER OF OFFICIALS
June 30, 2015
6

P.O. Box 5054
OFFICIAL DEPOSITORY
Parker McCay
Mount Laurel, New Jersey 08054-1539
618 Stokes RoadMedford, New Jersey 08055
ATTORNEY
Mullica Hill, New Jersey 08062
CLEARVIEW REGIONAL HIGH SCHOOL DISTRICTMULLICA HILL, NEW JERSEY
CONSULTANTS AND ADVISORS
AUDIT FIRM
Holman Frenia Allison, P.C.Michael Holt, CPA, PSA
100 N. Main Street
9000 Midlantic Drive, Suite 300
Century Savings Bank
7

This page intentionally left blank
8

FINANCIAL SECTION
9

This page intentionally left blank.
10

INDEPENDENT AUDITOR’S REPORT Honorable President and Members of the Board of Education Clearview Regional High School District County of Gloucester Mullica Hill, New Jersey 08062 Report on the Financial Statements We have audited the accompanying financial statements of the governmental activities, the business-type activities, each major fund and the aggregate remaining fund information of the Clearview Regional High School District, County of Gloucester, State of New Jersey, as of and for the fiscal year ended June 30, 2015, and the related notes to the financial statements, which collectively comprise the District’s basic financial statements as listed in the table of contents. Management’s Responsibility for the Financial Statements Management is responsible for the preparation and fair presentation of these financial statements in accordance with accounting principles generally accepted in the United States of America; this includes the design, implementation, and maintenance of internal control relevant to the preparation and fair presentation of financial statements that are free from material misstatement, whether due to fraud or error. Auditor’s Responsibility Our responsibility is to express opinions on these financial statements based on our audit. We conducted our audit in accordance with auditing standards generally accepted in the United States of America; and the standards applicable to financial audits contained in Governmental Auditing Standards, issued by the Comptroller General of the United States; and audit requirements as prescribed by the Office of School Finance, Department of Education, State of New Jersey. Those standards require that we plan and perform the audit to obtain reasonable assurance about whether the financial statements are free from material misstatement. An audit involves performing procedures to obtain audit evidence about the amounts and disclosures in the financial statements. The procedures selected depend on the auditor’s judgment, including the assessment of the risks of material misstatement of the financial statements, whether due to fraud or error. In making those risk assessments, the auditor considers internal control relevant to the entity’s preparation and fair presentation of the financial statements in order to design audit procedures that are appropriate in the circumstances, but not for the purpose of expressing an opinion on the effectiveness of the entity’s internal control. Accordingly, we express no such opinion. An audit also includes evaluating the appropriateness of accounting policies used and the reasonableness of significant accounting estimates made by management, as well as evaluating the overall presentation of the financial statements. We believe that the audit evidence we have obtained is sufficient and appropriate to provide a basis for our audit opinions.
11
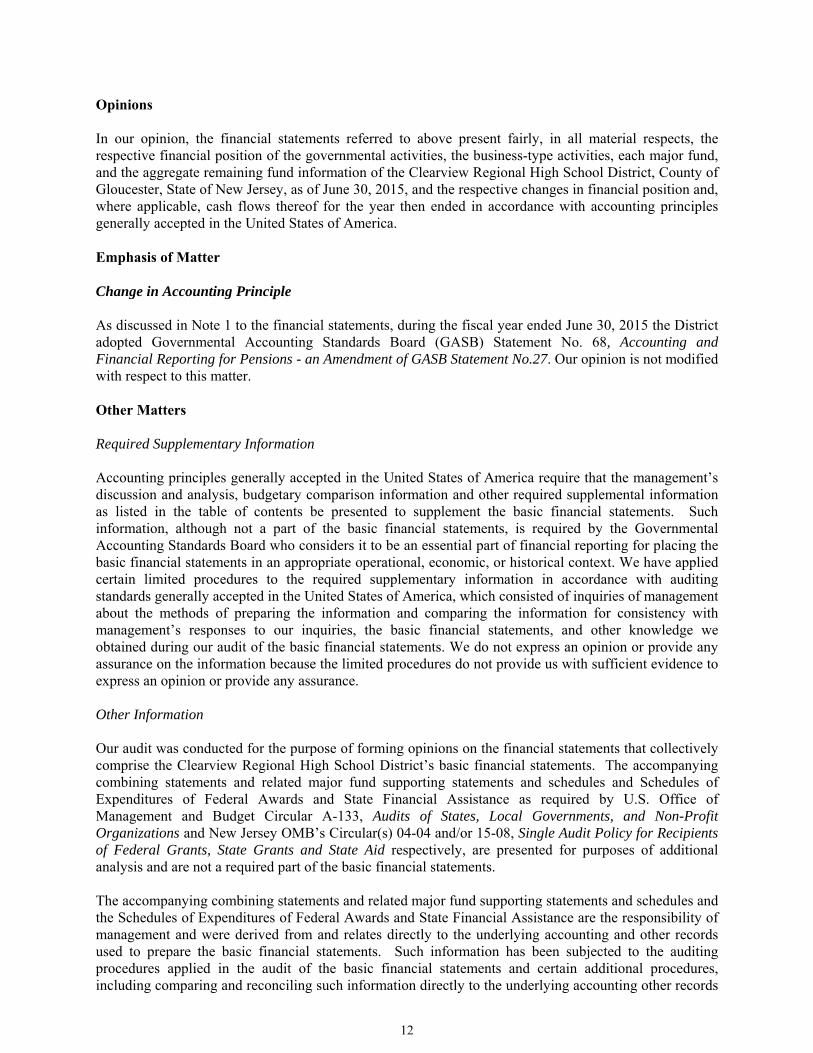
Opinions In our opinion, the financial statements referred to above present fairly, in all material respects, the respective financial position of the governmental activities, the business-type activities, each major fund, and the aggregate remaining fund information of the Clearview Regional High School District, County of Gloucester, State of New Jersey, as of June 30, 2015, and the respective changes in financial position and, where applicable, cash flows thereof for the year then ended in accordance with accounting principles generally accepted in the United States of America. Emphasis of Matter Change in Accounting Principle As discussed in Note 1 to the financial statements, during the fiscal year ended June 30, 2015 the District adopted Governmental Accounting Standards Board (GASB) Statement No. 68, Accounting and Financial Reporting for Pensions - an Amendment of GASB Statement No.27. Our opinion is not modified with respect to this matter. Other Matters Required Supplementary Information Accounting principles generally accepted in the United States of America require that the management’s discussion and analysis, budgetary comparison information and other required supplemental information as listed in the table of contents be presented to supplement the basic financial statements. Such information, although not a part of the basic financial statements, is required by the Governmental Accounting Standards Board who considers it to be an essential part of financial reporting for placing the basic financial statements in an appropriate operational, economic, or historical context. We have applied certain limited procedures to the required supplementary information in accordance with auditing standards generally accepted in the United States of America, which consisted of inquiries of management about the methods of preparing the information and comparing the information for consistency with management’s responses to our inquiries, the basic financial statements, and other knowledge we obtained during our audit of the basic financial statements. We do not express an opinion or provide any assurance on the information because the limited procedures do not provide us with sufficient evidence to express an opinion or provide any assurance. Other Information Our audit was conducted for the purpose of forming opinions on the financial statements that collectively comprise the Clearview Regional High School District’s basic financial statements. The accompanying combining statements and related major fund supporting statements and schedules and Schedules of Expenditures of Federal Awards and State Financial Assistance as required by U.S. Office of Management and Budget Circular A-133, Audits of States, Local Governments, and Non-Profit Organizations and New Jersey OMB’s Circular(s) 04-04 and/or 15-08, Single Audit Policy for Recipients of Federal Grants, State Grants and State Aid respectively, are presented for purposes of additional analysis and are not a required part of the basic financial statements. The accompanying combining statements and related major fund supporting statements and schedules and the Schedules of Expenditures of Federal Awards and State Financial Assistance are the responsibility of management and were derived from and relates directly to the underlying accounting and other records used to prepare the basic financial statements. Such information has been subjected to the auditing procedures applied in the audit of the basic financial statements and certain additional procedures, including comparing and reconciling such information directly to the underlying accounting other records
12

used to prepare the basic financial statements or to the basic financial statements themselves, and other additional procedures in accordance with auditing standards generally accepted in the United States of America. In our opinion, the accompanying combining statements and related major fund supporting statements and schedules and Schedules of Expenditures of Federal Awards and State Financial Assistance are fairly stated in all material respects in relation to the basic financial statements taken as a whole. The introductory section and statistical information have not been subjected to the auditing procedures applied in the audit of the basic financial statements and, accordingly, we do not express an opinion or provide any assurance on them. Other Reporting Required by Government Auditing Standards In accordance with Government Auditing Standards, we have also issued our report dated December 4, 2015 on our consideration of the Clearview Regional High School District’s internal control over financial reporting and on our tests of its compliance with certain provisions of laws, regulations, contracts, and grant agreements and other matters. The purpose of that report is to describe the scope of our testing of internal control over financial reporting and compliance and the results of that testing, and not to provide an opinion on internal control over financial reporting or on compliance. That report is an integral part of an audit performed in accordance with Government Auditing Standards in considering Clearview Regional High School District’s internal control over financial reporting and compliance.
Respectfully Submitted,
HOLMAN FRENIA ALLISON, P.C.
Michael Holt Certified Public Accountant Public School Accountant No. 1148
Medford, New Jersey December 4, 2015
13

This page intentionally left blank
14

REQUIRED SUPPLEMENTARY INFORMATION - PART I
15

This page intentionally left blank.
16

CLEARVIEW REGIONAL HIGH SCHOOL DISTRICT Mullica Hill, New Jersey
MANAGEMENT’S DISCUSSION AND ANALYSIS
FISCAL YEAR ENDED JUNE 30, 2015
UNAUDITED The District’s management discussion and analysis of financial performance provides an overview of the District’s financial activities for the fiscal year ended June 30, 2015. The intent of the discussion and analysis is to look at the District’s financial performance as a whole. Interested parties should review the basic financial statements and notes in connection with this document in order to enhance and clarify their understanding of the finances of the District. The Management’s Discussion and Analysis (MD&A) is an element of the Required Supplementary Information specified in the Governmental Accounting Standards Board’s (G.A.S.B.) Statement No. 34 – Basic Financial Statements and Management’s Discussion and Analysis for State and Local Governments issued in June 1999. Comparative information between the current year (2014-2015) and the prior year (2013-2014) is required to be present in the MD&A. As described in Note 1 to the financial statements, "Change in Accounting Principle", the District has adopted the provisions of GASB Statement No. 68, Accounting and Financial Reporting for Pensions, for the year ended June 30, 2015. The adoption of this principle resulted in a restatement of the District's opening net position as of July 1, 2015 in the amount of $10,771,945, as indicated in Note 19 to the financial statements. Prior year balances reflected in MD&A have not been updated to reflect this change. Financial Areas of Interest for 2014/2015
Overview During the budget preparation process, Clearview was notified that it would receive a $50,400 increase in general fund state aid (half for PARCC Readiness and half for Per Pupil Growth Aid) and a ($83,990) decrease in debt service state aid. The State only funded 85% of its promised Debt Service Aid, type 2. In addition, the State charged Clearview a $217,620 SDA Assessment Charge. This assessment represents 15% of the State’s principle and interest cost coming due on facility grants that were awarded to Clearview in prior years. Once again the lack of sufficient State Aid and the inability to raise taxes above the 2% cap, caused significant shortages in various 2014/2015 budget appropriation line items. A large increase in the cost of special education tuition caused an increase in the District’s general fund tax levy. The district was forced to use banked cap in the amount of $352,363. The general fund levy was increased by a total amount of $683,914 and caused a 1 cent per $100 of assessed value increase in taxes in the Harrison community and a 3 cent per $100 of assessed value increase in taxes in the Mantua community. In recent prior years, the lack of state aid created a financial crisis in many school districts across the State of New Jersey, including Clearview. This caused communities, especially growing ones like ours, to increase local property taxes to meet the needs of the District. The number of students attending Clearview Regional over the past seven years increased by approximately 92, which is a 4% increase in the student population.
17

School Year Students 2007/2008 2399 2008/2009 2454 2009/2010 2441 2010/2011 2501 2011/2012 2498 2012/2013 2489 2013/2014 2516 2014/2015 2491
Delay in State Aid Payments The Commissioner of Education again announced that the last two State aid payments for 2014/15 in the amount of $1,363,684 would be delayed until July 2015. This measure along with S1701 (reduction of surplus to 2%) has resulted in severe cash flow issues for all New Jersey School Districts. Staffing
The need for additional staff continues to have a substantial impact on the District budget. The District is committed to meeting the staffing needs in order to accommodate the growing special education student population.
Special Education The costs for the out-of-district placements continued to rise. The District incurred costs of $2,473,228 for tuition. This does not include the cost for the transportation related to these students. The District continues to closely monitor these costs as they represent a substantial portion of the budget.
Vocational School Tuition The district incurred costs of $338,391 for tuition to the County Vocational School. Prior to the 2010/11 school year, the County Vocational School did not charge local districts tuition. This is a new expenditure over the past five years that is paid for with the local tax levy. These students are not reported on our rolls so we do not receive any State Aid for them.
Transportation The District’s growth in student population over the past ten years continues to impact the transportation department. Additional drivers, buses, activity routes, and outside contracted routes resulted in considerable expenditure increases. The increase in staff time required to perform the tasks of transporting approximately 2,491 students is significant and costly. The Transportation Department expenditures for operations and salaries were approximately $1,745,864 which is $63,461 more than 2013/14. The District continues to provide transportation services to the Mantua Township School District. This adds another 1,650 students to the daily responsibilities of the Transportation Department. We continue to realize cost efficiencies in this area by maximizing fleet utilization.
18

Facility Projects
High School LGI: During the summer of 2014, the District awarded a contract to Allied Equipment Company, Inc. in the amount of $82,022 to install new seating and tables in the High School’s Large Group Instruction classroom which comfortably seats 96 students. This room was utilized for PARCC testing during 2014/15. Middle School Partial Roof Replacement and High School EPDM Warranty Extension: In May 2015, the District awarded a contract to Roof Management, Inc. in the amount of $638,000 for roof renovations in both schools. The project was funded with funds which were available in the capital reserve for that purpose. This project was substantially completed in September 2015. Middle School Secure Vestibule: In 2014/15, the District awarded a contract to W.J. Gross, Inc. in the amount of $17,990 to install a secure vestibule in the lobby of the Middle School. The project was funded with capital reserve funds which were available for that purpose.
State Aid
While State Aid has been approximately level for seven fiscal years (2001-02, 2002-03, 2003-04, 2004-05, 2005-06, 2006-07 and 2007-08), due to the School Funding Reform Act of 2008, the district received an increase in State Aid for 2008-09 and 2009-10. For 2009/10 this 5% increase totaled $624,684. While the District was originally awarded a 5% increase in State Aid when developing its budget for 2009/10, we were notified on February 11, 2010 that $1,498,592 would be withheld from 2009/10 state aid payments in the amount of surplus and reserve account monies available to the District. The District opted to reduce 2009/10 appropriations by $961,819 to offset this reduction. The remaining $536,773 came from the reserves. The 2010/11 State Aid to the District was reduced by $1,839,530 causing the entire budget to be reduced by $2,000,939. For 2012/13 the District received a net increase in State Aid of $692,518. For 2013/14 the District received a net increase in State Aid of $103,549. For 2014/15 the District received a net increase in State Aid of $50,400.
Tax Rate and Base The final budget resulted in a tax increase of 1.14 cents per hundred of assessed value for Harrison Township residents and increased 3.15 cents per hundred of assessed value for Mantua Township residents. Mantua Township’s ratable base decreased by ($423,338) for 2014. The increase in the ratable base in Harrison Township was $20,023,755 (1.48% inc.). The municipal tax is shared between the towns with Mantua’s absorbing 51.92% while Harrison’s is 48.08% during the 2014-15 school year.
19
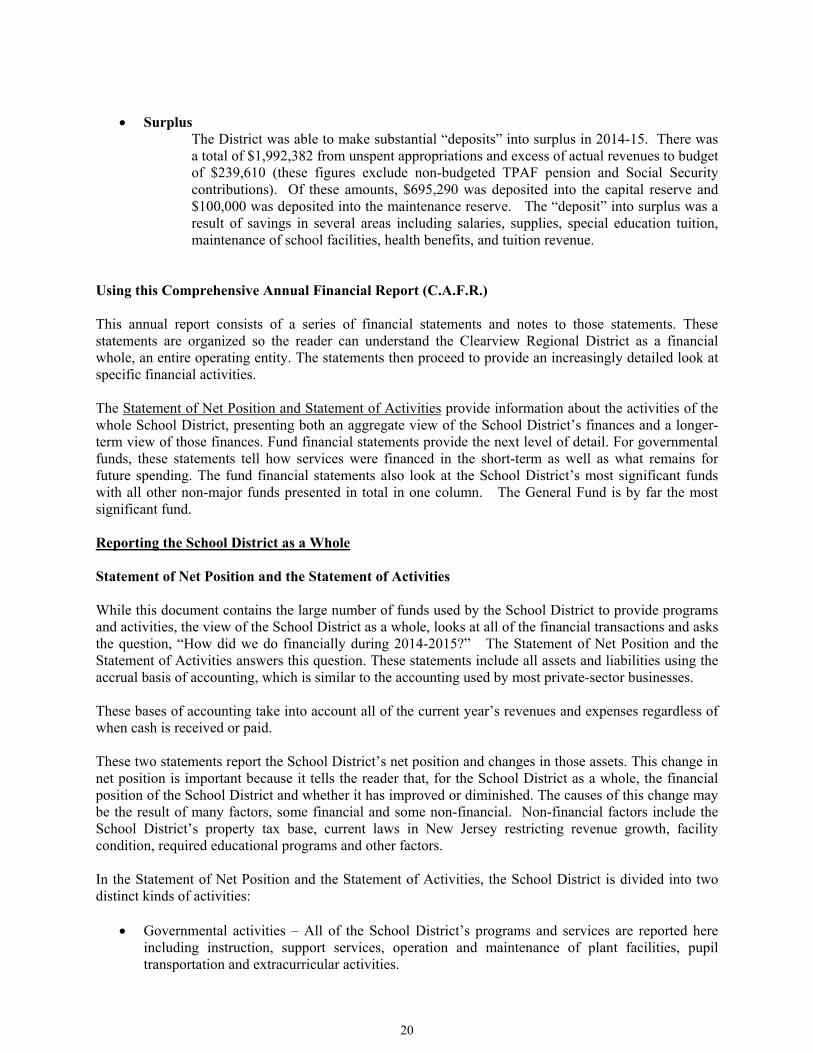
Surplus
The District was able to make substantial “deposits” into surplus in 2014-15. There was a total of $1,992,382 from unspent appropriations and excess of actual revenues to budget of $239,610 (these figures exclude non-budgeted TPAF pension and Social Security contributions). Of these amounts, $695,290 was deposited into the capital reserve and $100,000 was deposited into the maintenance reserve. The “deposit” into surplus was a result of savings in several areas including salaries, supplies, special education tuition, maintenance of school facilities, health benefits, and tuition revenue.
Using this Comprehensive Annual Financial Report (C.A.F.R.) This annual report consists of a series of financial statements and notes to those statements. These statements are organized so the reader can understand the Clearview Regional District as a financial whole, an entire operating entity. The statements then proceed to provide an increasingly detailed look at specific financial activities. The Statement of Net Position and Statement of Activities provide information about the activities of the whole School District, presenting both an aggregate view of the School District’s finances and a longer-term view of those finances. Fund financial statements provide the next level of detail. For governmental funds, these statements tell how services were financed in the short-term as well as what remains for future spending. The fund financial statements also look at the School District’s most significant funds with all other non-major funds presented in total in one column. The General Fund is by far the most significant fund. Reporting the School District as a Whole Statement of Net Position and the Statement of Activities While this document contains the large number of funds used by the School District to provide programs and activities, the view of the School District as a whole, looks at all of the financial transactions and asks the question, “How did we do financially during 2014-2015?” The Statement of Net Position and the Statement of Activities answers this question. These statements include all assets and liabilities using the accrual basis of accounting, which is similar to the accounting used by most private-sector businesses. These bases of accounting take into account all of the current year’s revenues and expenses regardless of when cash is received or paid. These two statements report the School District’s net position and changes in those assets. This change in net position is important because it tells the reader that, for the School District as a whole, the financial position of the School District and whether it has improved or diminished. The causes of this change may be the result of many factors, some financial and some non-financial. Non-financial factors include the School District’s property tax base, current laws in New Jersey restricting revenue growth, facility condition, required educational programs and other factors. In the Statement of Net Position and the Statement of Activities, the School District is divided into two distinct kinds of activities:
Governmental activities – All of the School District’s programs and services are reported here including instruction, support services, operation and maintenance of plant facilities, pupil transportation and extracurricular activities.
20

Business-Type Activities – This service is provided on a charge for goods or services basis to recover all the expenses of the goods or services provided. The Food Service and School Store enterprise funds are reported as business activities.
Reporting the School District’s Most Significant Funds Fund Financial Statements Fund financial reports provide detailed information about the School District’s funds. The School District uses many funds to account for a multitude of financial transactions. The School District’s governmental funds are the General Fund, Special Revenue Fund, Capital Projects Fund, and Debt Service Fund. Governmental Funds The School District’s activities are reported in governmental funds, which focus on how money flows into and out of those funds and the balances left at year-end available for spending in the future years. These funds are reported using an accounting method called modified accrual accounting, which measures cash and all other financial assets that can readily be converted to cash. The governmental fund statements provide a detailed short-term view of the School District’s general government operations and the basic services it provides. Governmental fund information helps the reader determine whether there are more or fewer financial resources that can be spent in the near future to finance educational programs. The relationship (or differences) between governmental activities (reported in the Statement of Net Position and the Statement of Activities) and governmental funds is reconciled in the financial statements. Enterprise Fund The enterprise funds use the same basis of accounting as business-type activities; therefore, these statements are essentially the same. Notes to the Financial Statements The notes provide additional information that is essential to a full understanding of the data provided in the District-wide and fund financial statements. The notes to the financial statements can be found on pages 61 – 91 of this Report. The School District as a Whole The Statement of Net Position provides the perspective of the School District as a whole. Net position may serve over time as a useful indicator of a government’s financial position. The District’s financial position is the product of several financial transactions including the net results of activities, the acquisition and payment of debt, the acquisition and disposal of capital assets, and the depreciation of capital assets. Table 1 provides a summary of the School District’s net position for FY 2015 compared to FY2014.
21

Table 1
Business- Business- Total TotalGovernmental Type Governmental Type 2015 2014
AssetsCurrent and Other Assets 5,198,846 367,413 4,628,093 380,401 5,566,259 5,008,494Capital Assets 43,831,501 9,866 45,137,587 4,467 43,841,367 45,142,054Total Assets 49,030,347 377,279 49,765,680 384,868 49,407,626 50,150,548
Deferred Outflow of ResourcesDeferred Charges of Refunding
Debt 685,496 - 823,027 - 685,496 823,027 Deferred Outflows Related
to Pensions 811,048 - - - 811,048 - Total Deferred Outflow
of Resources 1,496,544 823,027 1,496,544 823,027
Total Deferred Outflow ofResources and Assets 50,526,891 377,279 50,588,707 384,868 50,904,170 50,973,575
LiabilitiesCurrent Liabilities 1,043,485 86,071 446,608 24,447 1,129,556 471,055Noncurrent Liabilities 30,469,967 60,237 21,955,936 68,391 30,530,204 22,024,327Total Liabilities 31,513,452 146,308 22,402,544 92,838 31,659,760 22,495,382
Deferred Inflow of ResourcesDeferred Inflows Related
to Pensions 670,224 - - - 670,224 - Total Deferred Inflow
of Resources 670,224 - - - 670,224 -
Total Deferred Inflow ofResources and Liabilities 32,183,676 146,308 22,402,544 92,838 32,329,984 22,495,382
Net Position - - Net Investment in Capital Assets 25,823,501 9,866 25,259,587 4,467 25,833,367 25,264,054 Restricted 5,265,951 - 4,829,648 - 5,265,951 4,829,648 Unrestricted (12,746,237) 221,075 (1,903,072) 287,563 (12,525,162) (1,615,509) Total Net Position 18,343,215 230,941 28,186,163 292,030 18,574,156 28,478,193
2015 2014Clearview Regional High School District's Net Position
22

Table 2 shows changes in net position for fiscal year 2015.
Table 2 Governmental Business-type Governmental Business-type
Total Total
2015 2015 2014 2014 2015 2014
Revenues
Program Revenues:
Charges for Services 1,092,305 668,429 1,182,320 773,209 1,760,734 1,955,529
Operating Grants & Contributions 7,264,298 157,846 1,327,801 169,415 7,422,144 1,497,216
General Revenues:
Property Taxes 19,372,310 18,662,177 19,372,310 18,662,177
Grants and Entitlements 15,298,114 17,685,796 15,298,114 17,685,796
Other 733,574 202,588 617,069 3,213 936,162 620,282
Total Revenues 43,760,601 1,028,863 39,475,163 945,837 44,789,464 40,421,000
Program Expenses:
Instruction 14,461,278 14,069,087 14,461,278 14,069,087
Support Services:
Tuition 2,843,925 2,546,942 2,843,925 2,546,942
Student & instructional related 2,861,254 2,987,274 2,861,254 2,987,274
School administrative services 1,550,592 1,440,069 1,550,592 1,440,069
General administration 511,964 518,845 511,964 518,845
Central services 378,779 380,167 378,779 380,167
Administrative info technology 451,437 337,575 451,437 337,575
Plant operations & maintenance 2,701,354 2,839,811 2,701,354 2,839,811
Pupil transportation 2,720,369 2,695,591 2,720,369 2,695,591
Employee benefits 11,435,299 8,286,479 11,435,299 8,286,479
Special schools 60,908 72,318 60,908 72,318
Interest and Charges on
Long- Term Debt 1,000,410 1,071,875 1,000,410 1,071,875
Unallocated depreciation 1,854,035 1,870,974 1,854,035 1,870,974
Food service 1,026,744 865,226 1,026,744 865,226
Other business-type activities 63,208 64,683 63,208 64,683
Total expenses 42,831,604 1,089,952 39,117,007 929,909 43,921,556 40,046,916
Increase (Decrease) in Net Position 928,997 (61,089) 358,156 15,928 867,908 374,084
Activities Activities
23

Governmental Activities Property taxes made up 44.27 percent of revenues for governmental activities for the fiscal year 2015. Property tax revenues, increased by, $710,133, which equates to a 3.81% increase over the prior year Governmental Fund tax revenues. The increase was needed to fund the additional expenditures associated with an increase in enrollment, higher operating costs, and maintenance projects. The District’s total governmental revenues were $43,760,601 including the Capital Projects fund. The revenue breakout for all funds is as follows: Revenues for Governmental Funds for Fiscal Year 2015
PercentageFederal and state aid unrestricted 34.96%Property taxes 44.27%Federal and state aid restricted 19.09%Miscellaneous (Adult school, interest, other) 1.68%
100.00%
Expenses for Governmental Funds for Fiscal Year 2015 compared to 2014
2015 2014Percentage Percentage
Instruction 33.76% 35.97%Student support services 13.32% 14.15%School administration 3.62% 3.68%General administration 1.20% 1.33%Central administration 0.88% 0.97%Administrative info. Technology 1.05% 0.86%Operations & maintenance 6.31% 7.26%Transportation 6.35% 6.87%Employee benefits 26.70% 21.19%Special schools 0.14% 0.18%Interest on debt 2.34% 2.74%Depreciation 4.33% 4.79%
100.00% 100.00%
24

Business-Type Activities Revenues for the District’s business-type activities (food service program) were comprised of charges for services and federal and state reimbursements.
Food service, summer camp, the Little Pioneers Preschool Program and school store expenses exceeded revenues by $61,089. Charges for services represent $668,429 of revenue. This represents amounts paid by patrons for daily food service, summer camps, the Little Pioneers Preschool Program and school store sales. Federal and state reimbursement for meals, including payments for free and reduced lunches and breakfast, and donated commodities was $157,846.
Governmental Activities The Statement of Activities shows the cost of program services and the charges for services and grants offsetting those services. Table 3 shows the total cost of services and the net cost of services. The net cost shows the financial burden that was placed on the District’s taxpayers by each of these functions.
Table 3
Table 3 Total Cost of Net Cost of Total Cost of Net Cost of
Governmental 2015 2015 2014 2014 Instruction 14,461,278 14,024,280 14,069,087 13,528,007 Support services: Student & instructional staff 5,705,179 5,450,526 5,534,216 5,247,612
School administrative services 1,550,592 1,550,592 1,440,069 1,440,069 General administration 511,964 511,964 518,845 518,845 Central services 378,779 378,779 380,167 380,167 Administrative info. Technology 451,437 451,437 337,575 337,575 Plant operations & maintenance 2,701,354 2,701,354 2,839,811 2,839,811 Pupil transportation 2,720,369 1,767,752 2,695,591 1,682,403 Employee benefits 11,435,299 5,198,910 8,286,479 8,117,347Special schools 60,908 60,908 72,318 72,318Interest and Charges on Long-Term
Debt 1,000,410 524,464 1,071,875 571,758Depreciation 1,854,035 1,854,035 1,870,974 1,870,974Total governmental expenses 42,831,604 34,475,001 39,117,007 36,606,886
Business-typeFood Service 1,026,744 255,298 865,226 (1,970)Other business-type activities 63,208 8,379 64,683 14,685Total business-type expenses 1,089,952 263,677 929,909 12,715Total expenses 43,921,556 34,738,678 40,046,916 36,619,601
Services Services
Instruction expenses include activities directly dealing with the teaching of pupils and the interaction between teacher and student, including extracurricular activities.
25

Pupils and instructional staff include the activities involved with assisting staff with the content and process of teaching to students, including curriculum and staff development. General administration, school administration, and business include expenses associated with administrative and financial supervision of the District. Operation and maintenance of facilities involve keeping the school grounds, buildings, and equipment in an effective working condition. Pupil transportation includes activities involved with the conveyance of students to and from school, as well as to and from school activities, as provided by State law. Interest and Charges on Long-Term Debt involves the transactions associated with the payment of interest and other related charges to debt of the School District. “Other” includes special schools and unallocated depreciation and amortization. The School District’s Funds All governmental funds (i.e., general fund, special revenue fund, capital projects fund and debt service fund presented in the fund-based statements) are accounted for using the modified accrual basis of accounting. Total revenues amounted to $39,470,067 and expenditures were $39,027,961. The net change in fund balance for the year was most significant in the General Fund, with an increase of $522,108. The schedules (see Exhibit B-2) included in the financial section of this Report demonstrate that the District continues to meet its responsibility for sound financial management. As demonstrated by the various statements and schedules included in the financial section of this Report, the District continues to meet its responsibility for sound financial management. The following schedules present a summary of the revenues of the governmental funds for the fiscal year ended June 30, 2015, and the amount and percentage of increases and decreases in relation to prior year revenues.
Table 4
Increase Percent ofPercent of (Decrease) Increase
Revenue Amount Total from 2014 (Decrease)Local sources 20,105,884 50.94% 826,638 4.99%State sources 18,701,824 47.38% 392,203 2.58%Federal sources 662,356 1.68% (41,620) -5.77%
39,470,064 100.00% 1,177,221 3.62%
The increase in revenue was due to an increase of tax levy revenue of $710,133 and a federal aid decrease of $41,620 offset by an increase of state aid of $392,206. The following schedules present a summary of general fund, special revenue fund, and debt service fund expenditures for the fiscal year ended June 30, 2015, and the amount and percentage of increases and decreases in relation to prior year expenditures.
26

Increase Percent ofPercent of (Decrease) Increase
Expenditures Amount Total from 2014 (Decrease)Current expense: Instruction 14,461,278 37.05% 392,191 3.00% Undistributed 21,068,713 53.98% 220,980 1.33%Capital Outlay 770,297 1.97% 387,382 61.98%Special Schools 60,908 0.16% (11,410) -12.42%Debt Service: Principal 1,870,000 4.79% 85,000 5.70% Interest 796,765 2.04% (82,447) -6.38%
39,027,961 100.00% 991,696 3.28%
The largest portion of General Fund expenditures is for salaries and benefits. The District is a service entity and as such is labor intensive. This is typical for a service industry in both the public sector and private industry. Expenditures are up $991,696 over the prior year mostly due to increase in Capital Outlay and Tuition expenditures. General Fund Budgeting Highlights The School District’s budget is prepared according to New Jersey law, and is based on accounting for certain transactions on a basis of cash receipts, disbursements, and encumbrances. The most significant budgeted fund is the General Fund. Over the course of the year, the District revised the annual operating budget several times. Revisions were made to recognize revenues that were not anticipated and to prevent over-expenditures in specific line item accounts. The major areas are addressed below.
Cost Savings Initiated
The Clearview Regional Board of Education continued to implement cost savings initiatives throughout 2014-15, including but not limited to: Special Education Alternative Program The aforementioned self-contained educationally handicapped component was continued at the alternative high school program. This program reduced the number of students in need of out of District placement by providing the environment and special services needed on campus. Health Benefits The “Opt-out” program allowed the District to realize additional savings in this area. The “Opt-out” program enables employees to receive cash in-lieu-of benefits under the Section 125 Plan. On July 1, 2015, the Board of Education approved to move out of the Southern NJ Regional Employee Benefits Fund for provision of health benefits and to utilize Horizon. This resulted in savings in the 2014/15 district budget.
27

Split School Staffing Teachers were assigned to deliver instructional services at both schools, thereby negating the need for some additional staff.
Tiered Bus Schedules
There are two bus runs which enabled to utilize the buses twice for pickup and twice for dropoff. Clearview also transports all Mantua Elementary children. Solar System In March 2010, the district completed the installation of a new solar photovoltaic system on the Middle School roof. Savings on the Middle School electricity is realized annually. In 2014/15 the District sold Solar Renewable Energy Credits (SREC) and brought additional revenues in the amount of $50,343 into the District budget.
Interest Income The District realized $9,790 in interest income during the 2014-2015 school year. This was an increase of $1,220 over the prior year.
Grants The District continues to pursue competitive grants. In 2014-2015, the District took advantage of the Perkins Technology grant in the amount of $46,793. The Federal award for Perkins Funds decreased by ($4,322) in 2014/15.
Financial Concerns The budget will continue to be impacted by the increasing costs in the following areas: special education, workers compensation insurance, property/casualty insurance, medical costs and salaries. The areas of transportation, maintenance, substitute teachers, home-instruction, athletic and energy all continue to increase as the size of the District increases. These areas are often overlooked when reviewing the true impact of a growing District. The Business Office continues to monitor every line item in an effort to contain costs in every area.
Prior Recommendations
None
28

Statewide Performance Goals Because the State has transitioned to a new assessment, the previous attainment goals are no longer valid. 2014-15 assessment results established a new baseline of performance data; however, the district can report its performance in comparison with New Jersey’s passing averages on all applicable assessments. In ELA, Grade 11, Clearview’s passing percentage was 40%, compared to 41% for the State; in Grade 10, Clearview’s passing percentage was 39%, compared to 36% for the State; in Grade 9, Clearview’s passing percentage was 48%, compared to 39% for the State; in Grade 8, Clearview’s passing percentage was 44%, compared to 51% for the State; and in Grade 7, Clearview’s passing percentage was 53%, compared to 52% for the State. In Mathematics, in Algebra II, Clearview’s passing percentage was 33% compared to 24% for the State; in Geometry, Clearview’s passing percentage was 27% compared to 23% for the State; and in Algebra I, Clearview’s passing percentage was 44% compared to 36% for the State. High School Report The 2014-2015 school year was most successful. Our students continued to excel in many areas including the classroom, athletic fields, concert halls, artist studios, and other co-curricular activities. Developing and supporting the “whole student” with 21st Century Skills continues to be our objective. In the area of academics, there was a great deal of accomplishment. Many of our students excelled in their courses, and the colleges and universities that our seniors were admitted to provided testimony to the quality of our academic programs, our staff, and our student body. As a district we offered 16 Advanced Placement courses and the results of the district’s SAT scores continue to be among the best in our county and all of Southern New Jersey. In the area of athletics and extra-curricular activities, the 2014-15 school year was also very successful. Overall, our athletic teams were very competitive, with several teams qualifying for tournaments and/or winning their division during each season. Athletics & Student Activities The Department of Athletics and Student Activities had another successful year in its athletic programs for the 2014-2015 school year. We've continued our ongoing success in the competitive Tri-County/Olympic Conferences. The focus on athletics continues to be augmented by a district-wide approach of incorporating a sportsmanship philosophy in addition to being competitive. We've been recognized in several venues for our ongoing efforts to infuse the sportsmanship mindset in each athletic program and at every level of competition. The clubs and activities continue to offer award winning programs and experiences for our student body. The Department continues to oversee 52 high school clubs/activities, 14 middle school clubs/activities both with 98 advisors, 26 varsity sports, and 41 sub-varsity sports (inclusive of JV, F, and MS programs) with a total of 82 coaches.
29

Administration At June 30, 2015, the School District had $30,530,204 of outstanding debt. Of this amount, $1,096,810 is for compensated absences, $924,354 is for unamortized bond premiums associated with bond refunding costs, $10,501,040 is for the Net Pension Liability and $18,008,000 of serial bonds for school construction.
Table 6
20151997 General obligation bonds 880,0002010 General obligation bonds 923,0002010 School Refunding Bonds 16,205,000Total 18,008,000
Outstanding Debt at June 30
For the Future The Clearview Regional High School District is currently in sound financial condition. The District appreciates the support of our communities and understands the financial pressure placed on the taxpayers as taxes continue to rise. We will strive to become more effective and efficient as we continue to balance the needs of the students with the resources of the community. We remain committed to being a community center and will offer facilities and services that will be a source of pride for our communities. We are being proactive with facilities, financial resources and personnel in an effort to maintain services without financially burdening our communities.
Capital Projects The District is committed to appropriating funds in order to keep our facilities up to date and safe for our students and staff. Preventive maintenance will continue to be our insurance policy that will ensure that we continue to have quality facilities to offer our public. In July 2014, the District awarded a contract to Allied Equipment Company, Inc. in the amount of $82,022 for the renovation of the High School LGI. Brand new furniture along with 96 laptops have been installed. This will provide an area for PARCC testing. The project is funded with funds which are available in the reserves for that purpose. This project is almost complete.
NCLB Implications
The District is currently monitoring the No Child Left Behind, Federal legislation to ensure compliance with all of these new regulations.
30

Contacting the School District’s Financial Management This financial report is designed to provide the taxpayers, bondholders, creditors and other interested parties with a general overview of the District’s finances and to show the District’s accountability for the resources it receives. If you have questions about this report or need additional information, please contact Mr. John Horchak III, Superintendent or Esther R. Pennell, Business Administrator at the address below or visit our web site at www.clearviewregional.edu.
Clearview Regional Board of Education Administration Building 420 Cedar Road Mullica Hill, NJ 08062 856-223-2764
31

This page intentionally left blank
32

BASIC FINANCIAL STATEMENTS
33

This page intentionally left blank.
34

A. Government-Wide Financial Statements
35

This page intentionally left blank
36

EXHIBIT A-1
TOTALSGOVERNMENTAL BUSINESS-TYPE JUNE 30,
ACTIVITIES ACTIVITIES 2015
Cash & Cash Equivalents 1,525,347$ 335,975$ 1,861,322$ Receivables, Net 968,635 8,009 976,644 Internal Balances 66,177 - 66,177 Inventory - 23,399 23,399 Restricted Cash & Cash Equivalents 2,638,687 - 2,638,687 Capital Assets, Non-Depreciable (Note 5) 1,626,240 - 1,626,240 Capital Assets, Depreciable, Net (Note 5) 42,205,261 9,866 42,215,127
Total Assets 49,030,347 377,249 49,407,596
Deferred Charges of Refunding of Debt 685,496 - 685,496 Deferred Outflows Related to Pensions 811,048 - 811,048
Total Deferred Outflow of Resources 1,496,544 - 1,496,544
Total Assets and Deferred Outflow of Resources 50,526,891 377,249 50,904,140
Accounts Payable 250,114 1,181 251,295 Accrued Interest Payable 280,624 - 280,624 Internal Balances - 65,227 65,227 Payable to State Government 26,834 - 26,834 Unearned Revenue 5,074 19,663 24,737 PERS Pension Payable 480,839 - 480,839 Noncurrent Liabilities (Note 6): Due Within One Year 2,072,051 - 2,072,051 Due Beyond One Year 28,397,916 60,237 28,458,153
Total Liabilities 31,513,452 146,308 31,659,760
Deferred Inflows Related to Pensions 670,224 - 670,224
Total Deferred Inflow of Resources 670,224 - 670,224
Total Assets and Deferred Inflow of Resources 32,183,676 146,308 32,329,984
Net Investment in Capital Assets 25,823,501 9,866 25,833,367 Restricted For: Capital Projects 58,421 - 58,421 Other Purposes 5,211,420 - 5,211,420 Unrestricted (12,750,127) 221,075 (12,529,052)
Total Net Position 18,343,215$ 230,941$ 18,574,156$
The accompanying Notes to Financial Statements are an integral part of this statement
NET POSITION
CLEARVIEW REGIONAL HIGH SCHOOL DISTRICTSTATEMENT OF NET POSITION
JUNE 30, 2015
DEFERED OUTFLOW OF RESOURCES
ASSETS
LIABILITIES
DEFERED INFLOW OF RESOURCES
37

EXH
IBIT
A-2
(Pag
e 1
of 2
)
TOTA
LSC
HA
RG
ESO
PER
ATI
NG
BU
SIN
ESS-
FOR
GR
AN
TS &
GO
VER
NM
ENTA
LTY
PEJU
NE
30,
FUN
CTI
ON
S/PR
OG
RA
MS
EXPE
NSE
SSE
RV
ICES
CO
NTR
IBU
TIO
NS
AC
TIV
ITIE
SA
CTI
VIT
IES
2015
Gov
ernm
enta
l Act
iviti
es:
In
stru
ctio
n:
R
e gul
ar10
,545
,751
$
-
$
-$
(10,
545,
751)
$
-$
(1
0,54
5,75
1)$
Spe
cial
Edu
catio
n2,
857,
568
-
43
6,99
8
(2
,420
,570
)
-
(2,4
20,5
70)
Oth
er In
stru
ctio
n1,
057,
959
-
-
(1,0
57,9
59)
-
(1
,057
,959
)
Su p
port
Serv
ices
:
T
uitio
n2,
843,
925
-
-
(2,8
43,9
25)
-
(2
,843
,925
)
S
tude
nt &
Inst
ruct
ion
Rel
ated
Ser
vice
s2,
342,
772
-
25
4,65
3
(2
,088
,119
)
-
(2,0
88,1
19)
Hea
lth S
ervi
ces
260,
174
-
-
(2
60,1
74)
-
(260
,174
)
Edu
catio
nal M
edia
Ser
vice
s/Sc
hool
Lib
rar y
258,
308
-
-
(2
58,3
08)
-
(258
,308
)
Sch
ool A
dmin
istra
tive
Serv
ices
1,55
0,59
2
-
-
(1
,550
,592
)
-
(1,5
50,5
92)
Gen
eral
Adm
inis
tratio
n51
1,96
4
-
-
(511
,964
)
-
(5
11,9
64)
C
entra
l Ser
vice
s37
8,77
9
-
-
(378
,779
)
-
(3
78,7
79)
A
dmin
istra
tive
Info
rmat
ion
Tech
nolo
gy45
1,43
7
-
-
(451
,437
)
-
(4
51,4
37)
P
lant
Ope
ratio
ns &
Mai
nten
ance
2,70
1,35
4
-
-
(2
,701
,354
)
-
(2,7
01,3
54)
Pu p
il Tr
ansp
orta
tion
2,72
0,36
9
952,
617
-
(1,7
67,7
52)
-
(1
,767
,752
)
U
nallo
cate
d B
enef
its11
,240
,782
13
9,68
8
6,09
6,70
1
(5,0
04,3
93)
-
(5
,004
,393
)
Spe
cial
Sch
ools
60,9
08
-
-
(6
0,90
8)
-
(60,
908)
Int
eres
t and
Cha
r ges
on
Long
-Ter
m D
ebt
1,00
0,41
0
-
475,
946
(524
,464
)
-
(5
24,4
64)
Una
lloca
ted
De p
reci
atio
n1,
854,
035
-
-
(1,8
54,0
35)
-
(1
,854
,035
)
T
otal
Gov
ernm
enta
l Act
iviti
es42
,637
,087
1,
092,
305
7,26
4,29
8
(34,
280,
484)
-
(34,
280,
484)
CL
EA
RV
IEW
RE
GIO
NA
L H
IGH
SC
HO
OL
DIS
TR
ICT
STA
TE
ME
NT
OF
AC
TIV
ITIE
SFO
R F
ISC
AL
YE
AR
EN
DE
D J
UN
E 3
0, 2
015
PRO
GR
AM
REV
ENU
ESN
ET (E
XPE
NSE
) REV
ENU
E A
ND
CH
AN
GES
IN N
ET P
OSI
TIO
N
38

EXH
IBIT
A-2
(Pag
e 2
of 2
)
TOTA
LSC
HA
RG
ESO
PER
ATI
NG
BU
SIN
ESS-
FOR
GR
AN
TS &
GO
VER
NM
ENTA
LTY
PEJU
NE
30,
FUN
CTI
ON
S/PR
OG
RA
MS
EXPE
NSE
SSE
RV
ICES
CO
NTR
IBU
TIO
NS
AC
TIV
ITIE
SA
CTI
VIT
IES
2015
Bus
ines
s-T y
pe A
ctiv
ities
:
Foo
d Se
rvic
e1,
026,
744
61
3,60
0
157,
846
-
(2
55,2
98)
(2
55,2
98)
Oth
er A
ctiv
ities
63,2
08
54,8
29
-
-
(8
,379
)
(8,3
79)
T
otal
Bus
ines
s-T y
pe A
ctiv
ities
1,08
9,95
2
668,
429
15
7,84
6
-
(263
,677
)
(263
,677
)
Tota
l Prim
ary
Gov
ernm
ent
43,7
27,0
39$
1,76
0,73
4$
7,42
2,14
4$
(34,
280,
484)
(263
,677
)(3
4,54
4,16
1)
G
ener
al R
even
ues:
Taxe
s:
Prop
erty
Tax
es, L
evie
d fo
r Gen
eral
Pur
pose
s, N
et17
,261
,493
-
17
,261
,493
Ta
xes L
evie
d fo
r Deb
t Ser
vice
2,11
0,81
7
-
2,11
0,81
7
Fe
dera
l & S
tate
Aid
Not
Res
trict
ed
15,2
98,1
14
-
15,2
98,1
14
Tu
ition
Cha
rges
493,
235
-
493,
235
In
vest
men
t Ear
ning
s13
,216
52
5
13
,741
Mis
cella
neou
s Inc
ome
227,
123
-
227,
123
Tr
ansf
ers
(194
,517
)
19
4,51
7
-
C
apita
l Ass
et A
djus
tmen
t-
7,54
6
7,54
6
Tota
l Gen
eral
Rev
enue
s , Sp
ecia
l Ite
ms,
Extra
ordi
nary
Item
s & T
rans
fers
35,2
09,4
81
202,
588
35,4
12,0
69
Cha
n ge
In N
et P
ositi
on92
8,99
7
(6
1,08
9)
86
7,90
8
Net
Pos
ition
- B
egin
ning
17,4
14,2
18
292,
030
17,7
06,2
48
Net
Pos
ition
- En
ding
18,3
43,2
15$
230,
941
$
18,5
74,1
56$
The
acco
mpa
nyin
g N
otes
to F
inan
cial
Sta
tem
ents
are
an
inte
gral
par
t of t
his s
tate
men
t.
NET
(EX
PEN
SE) R
EVEN
UE
AN
D C
HA
NG
ES IN
NET
PO
SITI
ON
PRO
GR
AM
REV
ENU
ES
CL
EA
RV
IEW
RE
GIO
NA
L H
IGH
SC
HO
OL
DIS
TR
ICT
STA
TE
ME
NT
OF
AC
TIV
ITIE
SFO
R F
ISC
AL
YE
AR
EN
DE
D J
UN
E 3
0, 2
015
39

This page intentionally left blank
40

B. Fund Financial Statements
41

This page intentionally left blank
42

Governmental Funds
43

This page intentionally left blank
44

EXHIBIT B-1
TOTALSSPECIAL CAPITAL DEBT
GENERAL REVENUE PROJECTS SERVICE JUNE 30,ASSETS FUND FUND FUND FUND 2015
Cash & Cash Equivalents 1,899,867$ -$ 58,421$ -$ 1,958,288$ Receivables from Other Governments 458,104 197,921 - - 656,025 Other Accounts Receivable 14,459 - - - 14,459 Interfund Accounts Receivable 66,177 - - 66,177 Restricted Cash & Cash Equivalents 2,638,687 - - - 2,638,687
Total Assets 5,077,294$ 197,921$ 58,421$ -$ 5,333,636$
LIABILITIES & FUND BALANCES
Liabilities: Cash Overdraft -$ 161,311$ -$ -$ 161,311$ Accounts Payable 215,220 8,373 - 223,593 Intergovernmental Payable: State - 26,834 - - 26,834 Unearned Revenue 3,671 1,403 - 5,074
Total Liabilities 218,891 197,921 - - 416,812
Fund Balances: Restricted for: Maintenance Reserve 261,277 - - - 261,277 Capital Reserve Account 2,377,410 - - - 2,377,410 Excess Surplus - Designated for Subsequent Year's Expenditures 1,281,957 - - - 1,281,957 Excess Surplus 1,290,776 - - - 1,290,776 Capital Projects Fund - - 58,421 - 58,421 Unassigned: General Fund (353,017) - - - (353,017)
Total Fund Balances 4,858,403 - 58,421 - 4,916,824
Total Liabilities & Fund Balances 5,077,294$ 197,921$ 58,421$ -$
Amounts reported for governmental activities in the statement of Net Position (A-1)are different because: Capital assets used in governmental activities are not financial resources and therefore are not reported in the funds. The cost of the assets is $73,850,066 and the accumulated depreciation is $30,018,565. 43,831,501$ Accrued interest payable and PERS pension payable are not recorded in the fund Financial Statements due to the fact that the payables are not due in the period. (761,463) Deferred outflows and inflows of resources related to pensions and deferred charges or credits on debt refundings are applicable to future reporting periods and, therefore, are not reported in the funds. 826,320 Internal service funds are used by management to charge the costs of certain activities, such as transportation and food service to other governments. Assets and liabilities of the internal service funds of $29,410 are included in governmental activities in the Statement of Net Position - Long-term liabilities, including bonds payable, are not due and payable in the current period and therefore are not reported as liabilities in the funds. (30,469,967)
Net position of Governmental Activities 18,343,215$
The accompanying Notes to Financial Statements are an integral part of this statement.
JUNE 30, 2015
CLEARVIEW REGIONAL HIGH SCHOOL DISTRICTGOVERNMENTAL FUNDS
BALANCE SHEET
45

EXHIBIT B-2
TOTALSSPECIAL CAPITAL DEBT
GENERAL REVENUE PROJECTS SERVICE JUNE 30,FUND FUND FUND FUND 2015
Revenues: Local Sources: Local Tax Levy 17,261,493$ -$ -$ 2,110,817$ 19,372,310$ Tuition 493,235 - - - 493,235 Transportation 4,942 - - - 4,942 Interest Earned on Investments 9,790 - - - 9,790 Interest Earned on Capital Reserve Funds 3,426 - - - 3,426 Miscellaneous 211,876 10,305 - - 222,181
Total Local Sources 17,984,762 10,305 - 2,110,817 20,105,884
State Sources 18,142,213 83,668 - 475,946 18,701,827 Federal Sources 14,769 647,587 - - 662,356
Total Revenues 36,141,744 741,560 - 2,586,763 39,470,067
Expenditures: Current Expense: Regular Instruction 10,545,751 - - - 10,545,751 Special Education Instruction 2,420,570 436,998 - - 2,857,568 Other Instruction 1,057,959 - - - 1,057,959 Support Services: Tuition 2,843,925 - - - 2,843,925 Student & Instruction Related Services 2,088,119 254,653 - - 2,342,772 Health Services 260,174 - - - 260,174 Educational Media Services/ School Library 258,308 - - - 258,308 Instructional Staff Training 66,626 - - - 66,626 General Administrative 445,338 - - - 445,338 School Administrative Services 1,550,592 - - - 1,550,592 Central Services 378,779 - - - 378,779 Administrative Information Technology 451,437 - - - 451,437 Plant Operations & Maintenance 2,696,626 - - - 2,696,626 Pupil Transportation 1,745,864 - - - 1,745,864 Employee Benefits 7,833,755 - - - 7,833,755 Special Schools 60,908 - - - 60,908 Debt Service: Principal - - - 1,870,000 1,870,000 Interest & Other Charges - - - 796,765 796,765 Capital Outlay 720,388 49,909 - - 770,297
Total Expenditures 35,425,119 741,560 - 2,666,765 38,833,444
Excess/(Deficiency) of Revenues Over/(Under) Expenditures 716,625 - - (80,002) 636,623
Other Financing Sources/(Uses): Transfers In - - - 80,000 80,000 Transfers Out (194,517) - - - (194,517) Transfers to Debt Service - - (80,000) - (80,000)
Total Other Financing Sources & Uses (194,517) - (80,000) 80,000 (194,517)
Net Change in Fund Balances 522,108 - (80,000) (2) 442,106 Fund Balances July 1, 2014 4,336,295 - 138,421 2 4,474,718
Fund Balances June 30, 2015 4,858,403$ -$ 58,421$ -$ 4,916,824$
The accompanying Notes to Financial Statements are an integral part of this statement.
FOR FISCAL YEAR ENDED JUNE 30, 2015
CLEARVIEW REGIONAL HIGH SCHOOL DISTRICTGOVERNMENTAL FUNDS
STATEMENT OF REVENUES, EXPENDITURES AND CHANGES IN FUND BALANCES
46

EXHIBIT B-3
Total Net Change in Fund Balances - Governmental Funds (From B-2 442,106$
Amounts reported for governmental activities in the statement ofactivities (A-2) are different because:
Capital outlays are reported in governmental funds as expendituresHowever, in the statement of activities, the cost of those assets isallocated over their estimated useful lives as depreciation expenseThis is the amount by which capital outlays exceeded depreciationin the period:
Depreciation Expense (1,854,035)$ Capital Outlays Adjustments (4,728)Capital Outlays 552,677 (1,306,086)
Repayment of debt principal is an expenditure in the governmentafunds, but the repayment reduces long-term liabilities in the statemenof net position and is not reported in the statement of activities
Bond Principal Payments 1,870,000
Interest on long-term debt in the statement of activities is accrued, regardless of whendue. In the governmental funds, interest is reported when due
Prior year 315,121Current Year (280,624) 34,497
Amortization of losses on early extinguishments of debt and premiums from refunded debissuances are recorded when incurred in the governmental funds but are accrued andexpensed over time in the statement of activities 3,064
District pension contributions are reported as expenditures in the governmentafunds when made. However, they are reported as deferred outflows of resourcesin the Statement of Net Position because the reported net pension liability is measureda year before the District's report date. Pension expense, which is the change in the nepension liability adjusted for changes in deferred outflows and inflows of resources relatedto pensions, is reported in the Statement of Activities
Pension Expense - PERS Contribution - 2015 462,374Unfunded TPAF Pension Expense (3,198,229)State Share of Unfunded TPAF Pension Expense 3,198,229Pension Expense (531,484) (69,110)
Internal service funds are used by management to charge the costsof certain activities, such as shared business services. The operatinggain of $7,522, are included in the governmental activities and Statemenof Net Position (see Exhibit G-5). (21,888)
In the statement of activities, certain operating expenses, e.g., compensated absenceand special termination benefits are measured by the amounts earned during the yearIn governmental funds, however, expenditures for these items are reported in theamount of financial resources used/(paid). When the earned amount exceeds the paidamount, the difference is a reduction in the reconciliation; when the paid amountexceeds the earned amount the difference is an addition to the reconciliation (23,586)
Change in Net Position of Governmental Activities 928,997$
The accompanying Notes to Financial Statements are an integral part of this statement
FOR THE YEAR ENDED JUNE 30, 2015
CLEARVIEW REGIONAL HIGH SCHOOL DISTRICTRECONCILIATION OF THE STATEMENT OF REVENUES, EXPENDITURES,
AND CHANGES IN FUND BALANCES OF GOVERNMENTAL FUNDSTO THE STATEMENT OF ACTIVITIES
47

This page intentionally left blank
48

Proprietary Funds
49

This page intentionally left blank
50

EXHIBIT B-4
GOVERNMENTAL TOTALSFOOD ACTIVITIES-
SERVICE OTHER INTERNAL JUNE 30, ASSETS FUND FUNDS SERVICE FUND 2015
Current Assets: Cash & Cash Equivalents 245,830$ 90,145$ -$ 335,975$ Receivables from Other Governments 6,229 - 298,151 304,380 Other Receivable 1,780 - - 1,780 Interfund Receivable - 83 - 83 Inventories 3,484 19,915 - 23,399
Total Current Assets 257,323 110,143 298,151 665,617
Fixed Assets: Equipment 305,844 - - 305,844 Accumulated Depreciation (295,978) - - (295,978)
Total Fixed Assets 9,866 - - 9,866
Total Assets 267,189 110,143 298,151 675,483
LIABILITIES
Current Liabilities: Cash Overdraft - - 271,630 271,630 Accounts Payable 104 1,077 26,521 27,702 Unearned Revenue 14,338 5,325 - 19,663 Interfund Payable 65,310 - - 65,310
Total Current Liabilities 79,752 6,402 298,151 384,305
Noncurrent Liabilities: Compensated Absences 60,237 - - 60,237
Total Noncurrent Liabilities 60,237 - - 60,237
Total Liabilities 139,989 6,402 298,151 444,542
NET POSITION
Net Investments in, Capital Assets 9,866 - - 9,866 Unrestricted 117,334 103,741 - 221,075
Total Net Position 127,200$ 103,741$ -$ 230,941$
The accompanying Notes to Financial Statements are an integral part of this statement.
CLEARVIEW REGIONAL HIGH SCHOOL DISTRICTPROPRIETARY FUNDS
STATEMENT OF NET POSITIONFOR FISCAL YEAR ENDED JUNE 30, 2015
ENTERPRISE FUNDSACTIVITIES
BUSINESS-TYPE
51

EXHIBIT B-5
GOVERNMENTAL TOTALSACTIVITIES-
SERVICE OTHER INTERNAL JUNE 30,FUND FUNDS SERVICE FUND 2015
Operating Revenue: Daily Sales - Reimbursable Programs 238,264$ -$ -$ 238,264$ Daily Sales - Nonreimbursable Programs 362,080 - - 362,080 Transportation Fees - - 952,617 952,617 Special Functions 12,456 - - 12,456 Miscellaneous Income 800 54,829 - 55,629
Total - Daily Sales - Reimbursable Programs 613,600 54,829 952,617 1,621,046
Operating Expenses: Salaries 456,755 42,705 464,595 964,055 Employee Benefits 230,097 3,302 139,688 373,087 Supplies and Materials 39,523 4,823 119,400 163,746 Other Purchased Services 10,511 22,118 32,629 Cleaning, Repair & Maintenance Services - - 84,017 84,017 Depreciation 2,147 - - 2,147 Miscellaneous Other Expenses - - 521 521 Cost of Sales 287,711 12,378 - 300,089 Contracted Services (Between Home & School Vendors - - 64,323 64,323 Contracted Services (Special Education (Students) - Joint Agreements - - 18,461 18,461 Aid in Lieu - - 61,382 61,382
Total Operating Expenses 1,026,744 63,208 974,505 2,064,457
Operating (Loss)/Gain (413,144) (8,379) (21,888) (443,411)
Nonoperating Revenues/(Expenses): State Sources: State School Lunch Program 4,865 - - 4,865 Federal Sources: National School Lunch Program 119,442 - - 119,442 Food Distribution Program 33,539 - - 33,539 Interest Revenue 525 - - 525 Board Contribution 194,517 - - 194,517 Capital Asset Adjustment 7,546 - - 7,546
Total Nonoperating Revenues 360,434 - - 360,434
Change in Net Position (52,710) (8,379) (21,888) (82,977) Net Position - Beginning of Year 179,910 112,120 21,888 313,918
Total Net Position - End of Year 127,200$ 103,741$ -$ 230,941$
The accompanying Notes to Financial Statements are an integral part of this statement.
ENTERPRISE FUNDACTIVITIES
CLEARVIEW REGIONAL HIGH SCHOOL DISTRICTPROPRIETARY FUNDS
STATEMENT OF REVENUES, EXPENSES AND CHANGESIN FUND NET POSITION
FOR FISCAL YEAR ENDED JUNE 30, 2015
BUSINESS-TYPE
52

EXHIBIT B-6
GOVERNMENTAL TOTALSFOOD ACTIVITIES-
SERVICE OTHER INTERNAL JUNE 30,FUND FUNDS SERVICE FUND 2015
Cash Flows From Operating Activities: Receipts from Customers 627,518$ 53,870$ 863,928$ 1,545,316$ Payments to Employees (464,909) (42,705) (455,377) (962,991) Payments for Employee Benefits (230,097) (3,302) (139,688) (373,087) Payments to Suppliers (289,871) (18,017) (370,222) (678,110)
Net Cash Provided/(Used) by Operating Activities (357,359) (10,154) (101,359) (468,872)
Cash Flows From Noncapital Financing Activities: Cash Received From Board Contribution 194,517 - - 194,517 Cash Received From State & Federal Reimbursements 160,030 - - 160,030
Net Cash Provided by Noncapital Financing Activities 354,547 - - 354,547
Cash Flows From Investing Activities: Interest & Dividends 525 - - 525
Net Cash Provided by Investing Activities 525 - - 525
Net Increase/(Decrease) in Cash & Cash Equivalents (2,287) (10,154) (101,359) (113,800) Cash & Cash Equivalents, July 1 248,117 100,299 (170,271) 178,145
Cash & Cash Equivalents, June 30 245,830$ 90,145$ (271,630)$ 64,345$
RECONCILIATION OF OPERATING INCOME/(LOSS) TO NET CASH PROVIDED/(USED) BY OPERATING ACTIVITIES:
Cash Provided/(Used) by Operating Activities: Operating Income/(Loss) (413,144)$ (8,379)$ (21,888)$ (443,411)$ Adjustments to Reconcile Operating Income/(Loss) to Cash Provided/(Used) by Operating Activities: Depreciation Expense 2,147 - - 2,147 Change in Assets & Liabilities: (Increase)/Decrease in Accounts Receivable (420) 484 (88,689) (88,625) (Increase)/Decrease in Inventory (1,093) (94) - (1,187) Increase/(Decrease) in Unearned Revenue 14,338 (1,243) - 13,095 Increase/(Decrease) in Accounts Payable 48,967 (922) 9,218 57,263 Increase/(Decrease) in Compensated Absences (8,154) - - (8,154)
Total Adjustments 55,785 (1,775) (79,471) (25,461)
Net Cash Provided/(Used) by Operating Activities (357,359)$ (10,154)$ (101,359)$ (468,872)$
The accompanying Notes to Financial Statements are an integral part of this statement.
CLEARVIEW REGIONAL HIGH SCHOOL DISTRICTPROPRIETARY FUNDS
STATEMENT OF CASH FLOWSFOR FISCAL YEAR ENDED JUNE 30, 2015
ENTERPRISE FUND
BUSINESS-TYPEACTIVITIES
53

This page intentionally left blank
54

Fiduciary Fund
55

This page intentionally left blank
56

EXH
IBIT
B-7
TOTA
LSU
NEM
PLO
YM
ENT
HA
LL O
FSC
HO
LAR
SHIP
CO
MPE
NSA
TIO
NPA
YR
OLL
STU
DEN
TJU
NE
30,
ASS
ETS
HO
NO
RFU
ND
TRU
STFU
ND
AC
TIV
ITIE
S20
15
Cas
h &
Cas
h E q
uiva
lent
s1,
064
$
5,30
7$
22
6,91
9$
188,
990
$
421,
003
$
843,
283
$
T
otal
Ass
ets
1,06
4
5,30
7
22
6,91
9
188,
990
421,
003
843,
283
LIA
BIL
ITIE
S
Payr
oll D
educ
tions
& W
ithho
ldin
gs-
-
-
188,
743
-
18
8,74
3
Acc
ount
s Pa y
able
-
-
-
-
858
858
D
ue to
Stu
dent
Gro
u ps
-
-
-
-
419,
442
419,
442
In
terf
und
Acc
ount
s Pa y
able
-
-
-
24
7
70
3
95
0
T
otal
Lia
bilit
ies
-
-
-
18
8,99
0
42
1,00
3
60
9,99
3
NET
PO
SITI
ON
Res
erve
d:
Une
mpl
oym
ent C
laim
s-
-
226,
919
-
-
22
6,91
9
R
eser
ved
for S
chol
arsh
i ps
1,06
4
5,30
7
-
-
-
6,
371
T
otal
Net
Pos
ition
1,06
4$
5,
307
$
226,
919
$
-
$
-$
23
3,29
0$
The
acco
mpa
nyin
g N
otes
to F
inan
cial
Sta
tem
ents
are
an
inte
gral
par
t of t
his s
tate
men
t.
STA
TE
ME
NT
OF
FID
UC
IAR
Y N
ET
PO
SIT
ION
JUN
E 3
0, 2
015
AG
ENC
YPR
IVA
TE P
UR
POSE
CL
EA
RV
IEW
RE
GIO
NA
L H
IGH
SC
HO
OL
DIS
TR
ICT
FID
UC
IAR
Y F
UN
DS
57
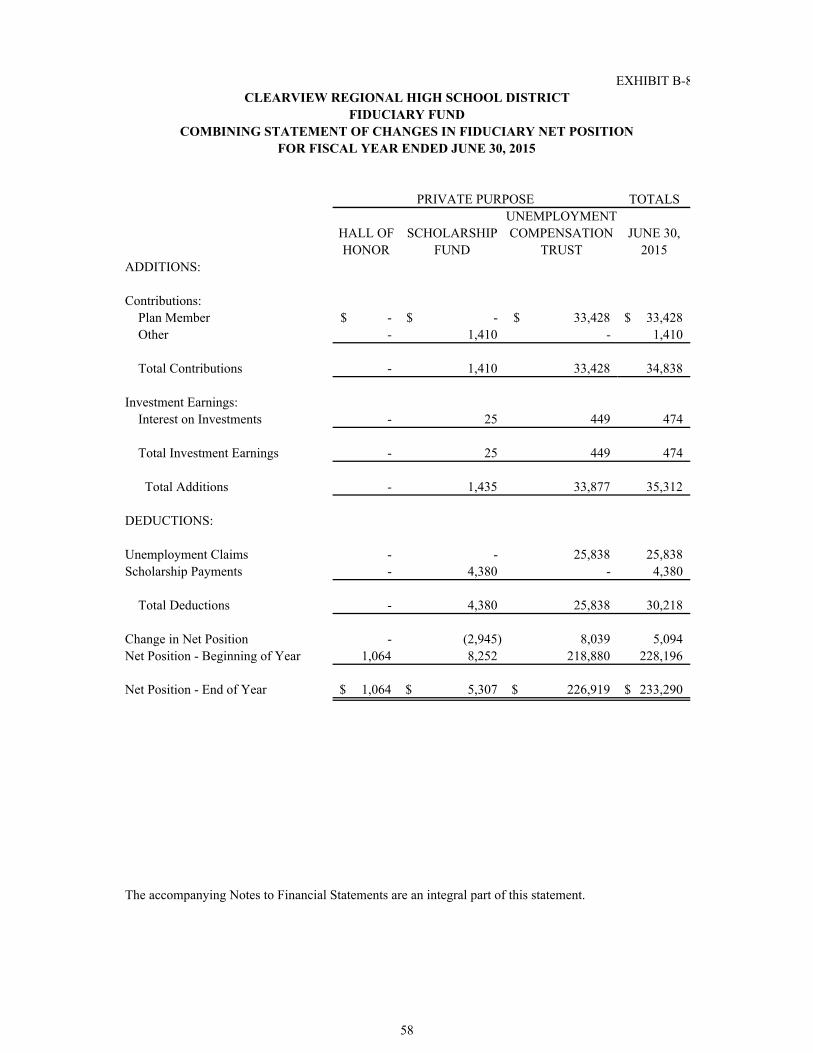
EXHIBIT B-8
TOTALSUNEMPLOYMENT
HALL OF SCHOLARSHIP COMPENSATION JUNE 30,HONOR FUND TRUST 2015
ADDITIONS:
Contributions: Plan Member -$ -$ 33,428$ 33,428$ Other - 1,410 - 1,410
Total Contributions - 1,410 33,428 34,838
Investment Earnings: Interest on Investments - 25 449 474
Total Investment Earnings - 25 449 474
Total Additions - 1,435 33,877 35,312
DEDUCTIONS:
Unemployment Claims - - 25,838 25,838 Scholarship Payments - 4,380 - 4,380
Total Deductions - 4,380 25,838 30,218
Change in Net Position - (2,945) 8,039 5,094 Net Position - Beginning of Year 1,064 8,252 218,880 228,196
Net Position - End of Year 1,064$ 5,307$ 226,919$ 233,290$
The accompanying Notes to Financial Statements are an integral part of this statement.
FOR FISCAL YEAR ENDED JUNE 30, 2015
PRIVATE PURPOSE
CLEARVIEW REGIONAL HIGH SCHOOL DISTRICTFIDUCIARY FUND
COMBINING STATEMENT OF CHANGES IN FIDUCIARY NET POSITION
58

CLEARVIEW REGIONAL HIGH SCHOOL DISTRICT
NOTES TO THE FINANCIAL STATEMENTSJUNE 30, 2015
59

This page intentionally left blank
60

CLEARVIEW REGIONAL HIGH SCHOOL DISTRICT
NOTES TO THE FINANCIAL STATEMENTS JUNE 30, 2015
Note 1. Summary of Significant Accounting Policies The accompanying financial statements of the Clearview Regional High School District have been prepared in conformity with generally accepted accounting principles as prescribed by the Governmental Accounting Standards Board (GASB). The following is a summary of more significant accounts policies. For the year ended June 30, 2015, the District implemented the provisions of GASB Statement No. 68, Accounting and Financial Reporting for Pensions, as amended by GASB Statement No. 71, Pension Transition for Contributions Made Subsequent to the Measurement Date. GASB Statement Nos. 68 and 71 establish standards for measuring and recognizing net pension liabilities, deferred outflows of resources, deferred inflows of resources, and expenses/expenditures related to pension benefits provided through defined benefit pension plans. In addition, Statement No. 68 requires disclosure of information related to pension benefits. Reporting Entity The Clearview Regional High School District is a Type II District located in the County of Gloucester, State of New Jersey. As a Type II District, the School District functions independently through a Board of Education. The Board is comprised of nine members elected to three-year terms. These terms are staggered so that three member’s terms expire each year. The purpose of the School District is to educate students in grades 7-12 received from the Townships of Harrison and Mantua. The Clearview Regional High School District has an approximate enrollment at June 30, 2015 of 2,491 students. The primary criterion for including activities within the District’s reporting entity, as set forth in Section 2100 of the GASB Codification of Governmental Accounting and Financial Reporting Standards, is whether:
the organization is legally separate (can sue or be sued in their own name) the District holds the corporate powers of the organization the District appoints a voting majority of the organization’s board the District is able to impose its will on the organization the organization has the potential to impose a financial benefit/burden on the District there is a fiscal dependency by the organization on the District
There were no additional entities required to be included in the reporting entity under the criteria as described above. Furthermore, the District is not includable in any other reporting entity on the basis of such criteria. Component Units GASB Statement No.14. The Financial Reporting Entity, provides guidance that all entities associated with a primary government are potential component units and should be evaluated for inclusion in the financial reporting entity. A primary government is financially accountable not only for the organizations that make up its legal entity but also for legally separate organizations that meet the criteria established by GASB Statement No. 14, as amended by GASB Statement No. 39, Determining Whether Certain Organizations are Component Units. The District had no component units as of for the year ended June 30, 2015.
61

CLEARVIEW REGIONAL HIGH SCHOOL DISTRICT
NOTES TO THE FINANCIAL STATEMENTS JUNE 30, 2015
Note 1. Summary of Significant Accounting Policies (continued):
Government-Wide Financial Statements
The District’s Government-Wide Financial Statements include a Statement of Net Position and a Statement of Activities. These statements present summaries of Governmental and Business-Type Activities for the District accompanied by a total column. Fiduciary activities of the District are not included in these statements.
These statements are presented on an “economic resources” measurement focus and the accrual basis of accounting. Accordingly, all of the District’s assets, deferred outflows of resources, liabilities, and deferred inflows of resources, including capital assets and long-term liabilities, are included in the accompanying Statement of Net Position. The Statement of Activities presents changes in net position. Under the accrual basis of accounting, revenues are recognized in the period in which they are earned while expenses are recognized in the period in which the liability is incurred, regardless of the timing of related cash flows. The types of transactions reported as program revenues for the District are reported in three categories: 1) charges for services, 2) operating grants and contributions, and 3) capital grants and contributions.
Certain eliminations have been made to interfund activities, payables, and receivables. All internal balances in the Statement of Net Position have been eliminated except those representing balances between the governmental activities and the business-type activities, which are presented as internal balances and eliminated in the total primary government column. In the Statement of Activities, internal service fund transactions have been eliminated; however, those transactions between governmental and business-type activities have not been eliminated.
Governmental Fund Financial Statements
Governmental fund financial statements include a Balance Sheet and a Statement of Revenues, Expenditures and Changes in Fund Balances for all major governmental funds and non-major funds aggregated. An accompanying schedule (Exhibit B-3) is presented to reconcile and explain the differences in fund balances and changes in fund balances as presented in these statements to the net position and changes in net position presented in the Government-Wide financial statements. The District has presented all major funds that met those qualifications.
All governmental funds are accounted for on a spending or “current financial resources” measurement focus and the modified accrual basis of accounting. Accordingly, only current assets and current liabilities are included on the Balance Sheets. (The District’s deferred outflows of resources and deferred inflows of resources are noncurrent.) The Statement of Revenues, Expenditures and Changes in Fund Balances present increases (revenues and other financing sources) and decreases (expenditures and other financing uses) in net current assets. Under the modified accrual basis of accounting, revenues are recognized in the accounting period in which they become both measurable and available to finance expenditures of the current period. Accordingly, revenues are recorded when received in cash, except that revenues subject to accrual (generally 60 days after year-end) are recognized when due. The primary revenue sources, which have been treated as susceptible to accrual by the District, are property tax and intergovernmental revenues and other taxes. Expenditures are recorded in the accounting period in which the related fund liability is incurred.
62
CLEARVIEW REGIONAL HIGH SCHOOL DISTRICT
NOTES TO THE FINANCIAL STATEMENTS JUNE 30, 2015
Note 1. Summary of Significant Accounting Policies (continued):
Proprietary Fund Financial Statements
Proprietary fund financial statements include a Statement of Net Position, a Statement of Revenues, Expenses and Changes in Fund Net Position, and a Statement of Cash Flows for each major proprietary fund and for the non-major funds aggregated. A column representing internal service funds is also presented in these statements. However, internal service funds balances and activities have been combined with the governmental activities in the Government-Wide financial statements.
Proprietary funds are accounted for using the “economic resources” measurement focus and the accrual basis of accounting. Accordingly, all assets, deferred outflows of resources, liabilities (whether current or noncurrent), and deferred inflows of resources are included on the Statement of Net Position. The Statement of Revenues, Expenses and Changes in Fund Net Position presents increases (revenues) and decreases (expenses) in total net position. Under the accrual basis of accounting, revenues are recognized in the period in which they are earned while expenses are recognized in the period in which the liability is incurred, regardless of the timing of related cash flows.
Operating revenues in the proprietary funds are those revenues that are generated from the primary operations of the fund. All other revenues are reported as non-operating revenues. Operating expenses are those expenses that are essential to the primary operations of the fund. All other expenses are reported as non-operating expenses.
Fiduciary Fund Financial Statements
Fiduciary fund financial statements include a Statement of Net Position. The District’s fiduciary funds are Agency Funds, which are custodial in nature (assets equal liabilities) and do not involve measurement of results of operations. The Agency funds are accounted for on a spending or “economic resources” measurement focus and the accrual basis of accounting as are the proprietary funds explained above. Measurement Focus, Basis of Accounting and Financial Statement Presentation The government-wide financial statements are reported using the economic resources measurement focus and the accrual basis of accounting as are the proprietary fund and fiduciary fund financial statements. Revenues are recorded when earned and expenses are recorded when a liability is incurred, regardless of the timing of related cash flows. Property taxes are recognized as revenues in the year in which they are levied. Grants and similar items are recognized as revenue as soon as all eligibility requirements imposed by the provider have been met.
Amounts reported as program revenues include 1) charges to customers or applicants for goods, services, or privileges provided, 2) operating grants and contributions, and 3) capital grants and contributions. Internally dedicated resources are reported as general revenues rather than as program revenues. Likewise, general revenues include all taxes. While government-wide and fund financial statements are presented separately, they are interrelated. The governmental activities column of the government wide statements incorporates data from governmental funds and internal service funds, while business-type activities incorporate data from the District’s enterprise funds. Separate financial statements are provided for governmental funds, proprietary funds, and fiduciary funds. However, data from the fiduciary funds is not incorporated in the government-wide financial statements
63

CLEARVIEW REGIONAL HIGH SCHOOL DISTRICT
NOTES TO THE FINANCIAL STATEMENTS JUNE 30, 2015
Note 1. Summary of Significant Accounting Policies (continued): Governmental fund financial statements are reported using the current financial resources measurement focus and the modified accrual basis of accounting. Revenues are recognized as soon as they are both measurable and available. Revenues are considered to be available when they are collectible within the current period or soon enough thereafter to pay liabilities of the current period. For this purpose, the District considers revenues to be available if they are collected within 60 days of the end of the current \ fiscal year-end. Expenditures generally are recorded when a liability is incurred, as under accrual accounting. However, debt service expenditures, as well as expenditures related to compensated absences and claims and judgments, are recorded only when payment is due. General capital assets acquisitions are reported as expenditures in the governmental funds. Issuance of long-term debt and acquisitions under capital leases are reported as other financing sources.
Property taxes, charges for services, licenses, and interest on notes receivable associated with the current fiscal period are all considered to be susceptible to accrual and accordingly have been recognized as revenues of the current fiscal period. Entitlements are recorded as revenues when all eligibility requirements are met, including any time requirements, and the amount is received during the period or within the availability period for this revenue source (within 60 days of year-end). Expenditure-driven grants are recognized as revenue when the qualifying expenditures have been incurred and all eligibility requirements have been met, and the amount is received during the period or within the availability period for this revenue source (within 60 days of year-end). All other revenue items are considered to be measurable and available when cash is received.
Proprietary funds distinguish operating revenues and expenses from nonoperating items. Operating revenues and expenses generally result from providing services and producing and delivering goods in connection with a proprietary fund’s principal ongoing operations. The principal operating revenues of the Food Service Fund, School Store Fund, Little Pioneers Fund and Summer Camps Fund are charges to customers for sales and services. Operating expenses for enterprise funds include the cost of sales and services, employee salaries and benefits, administrative expenses, and depreciation on capital assets. All revenues and expenses not meeting this definition are reported as nonoperating revenues and expenses. When both restricted and unrestricted resources are available for use, it is the District’s policy to use restricted resources first, then unrestricted resources as they are needed. Internal service funds are used to account for those operations which provide benefits to other funds, departments, or agencies of the primary government and its component unit. Although internal service funds are reported as a proprietary fund in the fund financial statements, it is incorporated into governmental activities in the government-wide financial statements. The District maintains a Transportation Consortium in the Internal Service Funds. The District reports the following major governmental funds:
General Fund - The general fund is the general operating fund of the District and is used to account for all financial resources except those required to be accounted for in another fund. Included are certain expenditures for vehicles and movable instructional or noninstructional equipment which are classified in the Capital Outlay sub-fund. As required by the New Jersey Department of Education the District includes budgeted capital outlay in this fund. Generally accepted accounting principles as they pertain to governmental entities state that General Fund resources may be used to directly finance capital outlays for long-lived improvements as long as the resources in such cases are derived exclusively from unrestricted revenues.
64

CLEARVIEW REGIONAL HIGH SCHOOL DISTRICT
NOTES TO THE FINANCIAL STATEMENTS JUNE 30, 2015
Note 1. Summary of Significant Accounting Policies (continued):
Resources for budgeted capital outlay purposes are normally derived from State of New Jersey Aid, interest earnings and appropriated fund balance. Expenditures are those that result in the acquisition of or additions to capital assets for land, existing buildings, improvements of grounds, construction of buildings, additions to or remodeling of buildings and the purchase of built-in equipment. These resources can be transferred from and to Current Expense by board resolution.
Special Revenue Fund - The Special Revenue Fund is used to account for the proceeds of specific revenue from State and Federal Government, (other than major capital projects, Debt Service or the Enterprise Funds) and local appropriations that are legally restricted to expenditures for specified purposes. Capital Projects Fund - The capital projects fund is used to account for all financial resources to be used for the acquisition or construction of major capital facilities (other than those financed by proprietary funds). Debt Service Fund - The debt service fund is used to account for the accumulation of resources for, and the payment of principal and interest on bonds issued to finance major property acquisition, construction and improvement programs.
The District reports the following major proprietary funds:
Food Service Fund – This fund accounts for the revenues and expenses pertaining to the District’s cafeteria operations.
Summer Camps Program – This fund accounts for the revenues and expenses pertaining to the District’s summer camp program. School Store – This fund accounts for the revenues and expenses pertaining to the school store that operates in the high school. Little Pioneers Program – This fund accounts for the revenues and expenses pertaining to the District’s child day care program.
Additionally, the District reports the following major fiduciary funds:
Private Purpose Trust Funds - Private-purpose trust funds are used to account for the principal and income for trust arrangements that benefit individuals, private organizations, or other governments. The district currently maintains the following private purpose trust funds:
Unemployment Trust Fund – Revenues consist of employee payroll withholdings, interest income, and contributions through the annual budget process of the District. Expenditures consist of unemployment reimbursement claims. Scholarship Fund – Revenues consist of interest income and donations. Expenditures consist of scholarships provided to students.
65

CLEARVIEW REGIONAL HIGH SCHOOL DISTRICT
NOTES TO THE FINANCIAL STATEMENTS JUNE 30, 2015
Note 1. Summary of Significant Accounting Policies (continued):
Agency Funds - Agency funds are assets held by a governmental entity (either as trustee or as an agent) for other parties that cannot be used to finance the governmental entity’s own operating programs. The district currently maintains Payroll funds and Student Activity Funds as Agency Funds.
During the course of operations, the District has activity between funds for various purposes. Any residual balances outstanding at year end are reported as due from/to other funds and advances to/from other funds. While these balances are reported in fund financial statements, certain eliminations are made
in the preparation of the government-wide financial statements. Balances between the funds included in governmental activities (i.e., the governmental funds and internal service funds) are eliminated so that only the net amount is included as internal balances in the governmental activities column. Similarly, balances between the funds included in business-type activities (i.e., the enterprise funds) are eliminated so that only the net amount is included as internal balances in the business-type activities column.
Further, certain activity occurs during the year involving transfers of resources between funds. In fund financial statements these amounts are reported at gross amounts as transfers in/out. While reported in fund financial statements, certain eliminations are made in the preparation of the government-wide financial statements. Transfers between the funds included in governmental activities are eliminated so that only the net amount is included as transfers in the governmental activities column. Similarly, balances between the funds included in business-type activities are eliminated so that only the net amount is included as internal balances in the business-type activities column.
Budgets/Budgetary Control Annual appropriated budgets are prepared in the spring of each year for the general, special revenue and debt service funds. The budgets are submitted to the county office. In accordance with P.L.2011 c.202, which became effective January 17, 2012, the District eliminated the April annual voter referendum on budgets which met the statutory tax levy cap limitations and the board of education members are elected at the November general election. Budgets are prepared using the modified accrual basis of accounting. The legal level of budgetary control is established at line item accounts within each fund. Line item accounts are defined as the lowest (most specific) level of detail as established pursuant to the minimum chart of accounts referenced in N.J.A.C. 6A:23-2-2(f)1. Transfers of appropriations may be made by School Board resolution at any time during the fiscal year in accordance with N.J.A.C. 6A:23-2-11. Formal budgetary integration into the accounting system is employed as a management control device during the year. For governmental funds there are no substantial differences between the budgetary basis of accounting and generally accepted accounting principles with the exception of the legally mandated revenue recognition of the last state aid payment for budgetary purposes only and the special revenue fund as noted below. Encumbrance accounting is also employed as an extension of formal budgetary integration in the governmental fund types. Unencumbered appropriations lapse at fiscal year-end. The accounting records of the special revenue fund are maintained on the grant accounting budgetary basis. The grant accounting budgetary basis differs from GAAP in that the grant accounting budgetary basis recognizes encumbrances as expenditures and also recognizes the related revenues, whereas the GAAP basis does not. Sufficient supplemental records are maintained to allow for the presentation of GAAP basis financial reports.
66
CLEARVIEW REGIONAL HIGH SCHOOL DISTRICT
NOTES TO THE FINANCIAL STATEMENTS JUNE 30, 2015
Note 1. Summary of Significant Accounting Policies (continued): The budget, as detailed on Exhibit C-1, Exhibit C-2, and Exhibit I-3, includes all amendments to the adopted budget, if any. Exhibit C-3 presents a reconciliation of the general fund revenues and special revenue fund revenues and expenditures from the budgetary basis of accounts as presented in the General Fund Budgetary Comparison Schedules and the Special Revenue Fund Budgetary Comparison Schedule to the GAAP basis of accounting as presented in the Statement of Revenues, Expenditures and Changes in Fund Balance – Governmental Funds. Note that the District does not report encumbrances outstanding at fiscal year-end as expenditures in the general fund since the general fund budget follows modified accrual basis with the exception of the revenue recognition policy for the last state aid payments. Encumbrances Under encumbrance accounting purchase orders, contracts and other commitments for the expenditure of resources are recorded to reserve a portion of the applicable appropriation. Open encumbrances in governmental funds other than the special revenue fund are reported as assigned fund balances at fiscal year-end as they do not constitute expenditures or liabilities but rather commitments related to unperformed contracts for goods and services. Open encumbrances in the special revenue fund for which the District has received advances are reflected in the balance sheet as a reduction of the accounts receivables or as unearned revenue at fiscal year-end. The encumbered appropriation authority carries over into the next fiscal year. An entry will be made at the beginning of the next fiscal year to increase the appropriation reflected in the certified budget by the outstanding encumbrance amount as of the current fiscal year-end. Cash and Cash Equivalents Cash and Cash equivalents include petty cash, change funds, cash in banks and all highly liquid investments with a maturity of three months or less at the time of purchase and are stated at cost plus accrued interest. U.S. Treasury and agency obligations and certificates of deposit with maturities of one year or less when purchased are stated at cost. New Jersey School Districts are limited as to the types of investments and types of financial institutions they may invest in. N.J.S.18A:20-37 provides a list of permissible investments that may be purchased by New Jersey school districts. Additionally, the District has adopted a cash management plan that requires it to deposit public funds in public depositories protected from loss under the provisions of the Governmental Unit Deposit Protection Act (“GUDPA”). GUDPA was enacted in 1970 to protect Governmental Units from loss of funds on deposit with a failed banking institution in New Jersey. N.J.S.A.17:9-41 et. Seq. establishes the requirements for the security of deposits of governmental units. The statute requires that no governmental unit shall deposit public funds in a public depository unless such funds are secured in accordance with the Act. Public depositories include Savings and Loan institutions, banks (both state and national banks) and savings banks the deposits of which are federally insured. All public depositories must pledge collateral, having a market value at least equal to five
67

CLEARVIEW REGIONAL HIGH SCHOOL DISTRICT
NOTES TO THE FINANCIAL STATEMENTS JUNE 30, 2015
Note 1. Summary of Significant Accounting Policies (continued): percent of the average daily balance of collected public funds, to secure the deposits of Governmental Units. If a public depository fails, the collateral it has pledged, plus the collateral of all other public depositories, is available to pay the full amount of their deposits to the Governmental Units. Tuition Payable/Receivable Tuition rates for the fiscal year end June 30, 2015 were established by the receiving district based on estimated costs. The charges are subject to adjustment when the final costs have been determined. Inventories Inventories are valued at cost, using the first-in/first-out (FIFO) method. The costs of inventories are recorded as expenditures when consumed rather when purchased. Short-Term Interfund Receivables/Payables Short-term interfund receivables/payables represent amounts that are owed, other than charges for goods or services rendered to/from a particular fund in the District and that are due within one year. The amounts are eliminated in the governmental and business-type activities, which are presented as Internal Balances. Balances with fiduciary funds are not considered Internal Balances; therefore those balances are reported on the Statement of Net Position. Capital Assets
Capital assets are reported in the applicable governmental or business-type activities column in the government-wide financial statements. Purchased or constructed assets are recorded at actual cost or estimated historical cost if actual cost is unavailable. Donated capital assets are recorded at estimated fair value at the date of donation. The District has established a threshold of $2,000 for capitalization of depreciable assets.
Major outlays for capital assets and improvements are capitalized as projects are constructed. The costs of normal maintenance and repairs that do not add to the value of the asset or materially extend asset lives are not capitalized.
Capital assets of the District are depreciated or amortized using the straight-line method over the following estimated lives:
Site Improvements 20 Years Building & Improvements 20-50 Years Machinery and Equipment 5–20 Years Compensated Absences Compensated absences are those absences for which employees will be paid, such as vacation, sick leave and sabbatical leave. A liability for compensated absences that are attributable to services already rendered, and that are not contingent on a specific event that is outside the control of the District and its employees, is accrued as the employees earn the rights to the benefits. Compensated absences that relate to future services, or that are contingent on a specific event that is outside the control of the District and
68

CLEARVIEW REGIONAL HIGH SCHOOL DISTRICT
NOTES TO THE FINANCIAL STATEMENTS JUNE 30, 2015
Note 1. Summary of Significant Accounting Policies (continued): its employees, are accounted for in the period in which such services are rendered or in which such events take place. In the Government-Wide financial statements, under governmental activities, compensated absences are reported as an expenditure and noncurrent liabilities. Unearned Revenue Unearned revenue arises when assets are recognized before revenue recognition criteria have been satisfied and is recorded as a liability until the revenue is both measureable and the District is eligible to realize the revenue. Accrued Liabilities and Long-Term Obligations All payables, accrued liabilities, and long-term obligations are reported in the government-wide financial statements, and all payables, accrued liabilities and long-term obligations payable from proprietary funds are reported on the proprietary fund financial statements. In general, government fund payables and accrued liabilities that, once incurred, are paid in a timely manner and in full from current financial resources, are reported as obligations of the funds. However, claims and judgments, compensated absences, special termination benefits and contractually required pension contributions that will be paid from governmental funds, are reported as a liability in the fund financial statements only to the extent that they are normally expected to be paid with expendable available financial resources. Use of Estimates The preparation of financial statements in conformity with accounting principles generally accepted in the United States of America requires management to make estimates and assumption that affect certain reported amounts and disclosures. Accordingly, actual results could differ from those estimates. Fund Balance In accordance with Government Accounting Standards Board 54, Fund Balance Reporting and Governmental Fund Type Definitions, the District classifies governmental fund balances as follows:
Non-spendable – This classification includes amounts that cannot be spent because they are either not in spendable form or are legally or contractually required to be maintained intact. Non-spendable items are not expected to be converted to cash or are not expected to be converted to cash within the next year.
Restricted – This classification includes amounts for which constraints have been placed on the use of the resources either externally imposed by creditors (such as through a debt covenant), grantors, contributors, or laws or regulations of other governments, or imposed by law through constitutional provisions or enabling legislation.
Committed – This classification includes amounts that can be used only for specific purposes
pursuant to constraints imposed by formal action of the Board of Education. These amounts
69

CLEARVIEW REGIONAL HIGH SCHOOL DISTRICT
NOTES TO THE FINANCIAL STATEMENTS JUNE 30, 2015
Note 1. Summary of Significant Accounting Policies (continued):
cannot be used for any other purpose unless the Board of Education removes or changes the specified use by taking the same type of action (resolution) that was employed when the funds were initially committed. This classification also includes contractual obligations to the extent that existing resources have been specifically committed for use in satisfying those contractual requirements. The School Board did not have any committed resources as of June 30, 2015.
Assigned – This classification includes amounts that are constrained by the School District’s
intent to be used for a specific purpose but are neither restricted nor committed. This intent can be expressed by the Board of Education or through the Board of Education delegating this responsibility to the business administrator through the budgetary process. This classification also includes the remaining positive fund balance for all governmental funds except for the General Fund.
Unassigned – This classification includes the residual fund balance for the General Fund. The
Unassigned classification also includes negative residual fund balance of any other governmental fund that cannot be eliminated by offsetting of Assigned fund balance amounts.
When an expenditure is incurred for purposes for which both restricted and unrestricted fund balance is available, it is the District’s policy to consider restricted funds to have been spent first. When an expenditure is incurred for which committed, assigned, or unassigned fund balances are available, it is the District’s policy to consider amounts to have been spent first out of committed funds, then assigned funds, and finally unassigned funds, as needed, unless the Board has provided otherwise in its commitment or assignment actions. Net Position Net position, represents the difference between summation of assets and deferred outflows of resources, and the summation of liabilities and deferred inflows of resources. Net position is classified in the following three components:
Net Investment in Capital Assets – This component represents capital assets, net of accumulated depreciation, net of outstanding balances of borrowings used for acquisition, construction, or improvement of those assets.
Restricted – Net position is reported as restricted when there are limitations imposed on their use either through the enabling legislation adopted by the District or through external restrictions imposed by creditors, grantors or laws or regulations of other governments.
Unrestricted – Net position is reported as unrestricted when it does not meet the criteria of the
other two components of net position. Impact of Recently Issued Accounting Principles
Recently Issued and Adopted Accounting Pronouncements
The GASB issued Statement 68, Accounting and Financial Reporting for Pensions—an amendment of GASB Statement 27 effective for fiscal years beginning after June 15, 2014. GASB 68 improves accounting and financial reporting by state and local governments for pensions. It also improves
70

CLEARVIEW REGIONAL HIGH SCHOOL DISTRICT
NOTES TO THE FINANCIAL STATEMENTS JUNE 30, 2015
Note 1. Summary of Significant Accounting Policies (continued): information provided by state and local governmental employers about financial support for pensions that is provided by other entities. This Statement results from a comprehensive review of the effectiveness of existing standards of accounting and financial reporting for pensions with regard to providing decision-useful information, supporting assessments of accountability and inter-period equity, and creating additional transparency. Bond Premiums, Discounts and Issuance Costs
In the government-wide financial statements and in the proprietary fund financial statements, bond premiums and discounts are deferred and amortized over the life of the bonds using the effective interest method. Bonds payable are reported net of the applicable bond premium or discount. Bond issuance costs are expensed when bonds are issued. In governmental fund financial statements, bond premiums and discounts, as well as debt issuance costs are recognized in the current period. The face amount of the debt is reported as other financing sources. Premiums received on debt issuance are also reported as other financing sources. Issuance costs, whether or not withheld from the actual debt proceeds, are reported as debt service expenditures. Deferred Loss on Refunding Debt Deferred loss on refunding debt arising from the issuance of the refunding bonds is recorded as deferred outflows of resources. It is amortized in a systematic and rational manner over the shorter of the duration of the related debt or the new debt issues as a component of interest expense. Deferred Outflows and Deferred Inflows of Resources In addition to assets, the statement of net position will sometimes report a separate section for deferred outflows of resources. This separate financial statement element, deferred outflows of resources, represents a consumption of net position that applies to a future period(s) and so will not be recognized as an outflow of resources (expense/expenditure) until then. In addition to liabilities, the statement of net position will sometimes report a separate section for deferred inflows of resources. This separate financial statement element, deferred inflows of resources, represents an acquisition of net position that applies to a future periods and so will not be recognized as an inflow of resources (revenue) until that time. Subsequent Events The District has evaluated subsequent events occurring after June 30, 2015 through the date of December 4, 2015, which is the date the financial statements were available to be issued.
71

CLEARVIEW REGIONAL HIGH SCHOOL DISTRICT
NOTES TO THE FINANCIAL STATEMENTS JUNE 30, 2015
Note 1. Summary of Significant Accounting Policies (continued): Pensions Section
For purposes of measuring the net pension liability, deferred outflows of resources and deferred inflows of resources related to pensions, and pension expense, information about the pension plan’s fiduciary net position and additions to/deductions from the plan’s fiduciary net position have been determined on the same basis as they are reported by the plan. For this purpose, benefit payments (including refunds of employee contributions) are recognized when due and payable in accordance with the benefit terms. Investments are reported at fair value. Note 2. Cash Cash Deposits Custodial Credit Risk – Custodial credit risk is the risk that, in the event of a bank failure, the Board’s deposits may not be recovered. Although the Board does not have a formal policy regarding custodial credit risk, NJSA 17:9-41 et seq. requires that the governmental units shall deposit public funds in public depositories protected from loss under the provisions of GUDPA. Under the Act, the first $250,000 of governmental deposits in each insured depository is protected by FDIC. Public fund owned by the Board in excess of FDIC insured amounts are protected by GUDPA. However, GUDPA does not protect intermingled trust funds such as salary withholdings, student activity may pass to the Board relative to the happening of a future condition. Such funds are shown as Uninsured and Uncollateralized in the schedule below. As of June 30, 2015, the District’s bank balance of $6,078,866 was exposed to custodial credit risk as follows: Insured Under FDIC $ 250,000 Collateralized by securities held by Pledging financial institution 4,906,577 Uninsured & Uncollateralized 922,289 Total $ 6,078,866 Investments New Jersey statues permit the Board to purchase the following types of securities:
1. Bonds and other obligations of the United State or obligations guaranteed by the United States. 2. Bonds of any Federal Intermediate Credit Bank, Federal Home Loan Bank, Federal National
Mortgage Agency or of any United States Bank , which have a maturity date not greater than twelve months from the date of purchase.
3. New Jersey Cash Management Fund, New Jersey Asset and Rebate Management Fund and MBIA CLASS.
Custodial credit risk - This is the risk that in the event of the failure of the counterparty (e.g., broker-dealer) to a transaction, a government will not be able to recover the value of its investment or collateral securities that are in the possession of another party. The District does not have custodial credit risk policies for investments.
72

CLEARVIEW REGIONAL HIGH SCHOOL DISTRICT
NOTES TO THE FINANCIAL STATEMENTS JUNE 30, 2015
Note 2. Cash Deposits and Investments (continued): Interest rate risk - This is the risk that changes in market interest rates will adversely affect the fair value of an investment. Generally, the longer the maturity of an investment, the greater the sensitivity of its fair value to changes in market interest rates. The District does not have a formal investment policy that limits investment maturities as a means of managing its exposure to fair value losses arising from increasing interest rates. Credit risk - Generally, credit risk is the risk that an issuer of a debt type investment will not fulfill its obligation to the holder of the investment. This is measured by assignment of a rating by a nationally recognized rating organization. U.S. Government securities or obligations explicitly guaranteed by the U.S. government are not considered to have credit risk exposure.. Concentrations - The District places no limit in the amount the District may invest in any one issuer The District did not hold any investments at June 30, 2015. Note 3. Reserve Accounts A. Capital Reserve A capital reserve account was established by the Board of Education by inclusion of $5,000 on September 28, 2000, for the accumulation of funds for use as capital outlay expenditures in subsequent fiscal years. The capital reserve account is maintained in the general fund and its activity is included in the general fund annual budget. Funds placed in the capital reserve account are restricted to capital projects in the district’s approved Long Range Facilities Plan (LRFP). Upon submission of the LRFP to the department, a district may increase the balance in the capital reserve by appropriating funds in the annual general fund budget certified for taxes or by transfer by Board resolution at year-end of any unanticipated revenue or unexpended line-item appropriation amounts, or both. A district may also appropriate additional amounts when the express approval of the voters has been obtained either by a separate proposal at budget time or by a special question at one of the four special elections authorized pursuant to N.J.S.A.19:60-2. Pursuant to N.J.A.C.6:23A-14.1(g), the balance in the account cannot at any time exceed the local support costs of uncompleted capital projects in its approved LRFP. The activity of the capital reserve for the July 1, 2014 to June 30, 2015 fiscal year is as follows:
Beginning Balance, July 1, 2014 1,826,318$
Withdrawals (147,624)$
Transfer per June Resolution 695,290 Interest Earnings 3,426
Ending Balance, June 30, 2015 2,377,410$
73

CLEARVIEW REGIONAL HIGH SCHOOL DISTRICT
NOTES TO THE FINANCIAL STATEMENTS JUNE 30, 2015
Note 3. Reserve Accounts (continued): B. Maintenance Reserve Account The District established a Maintenance Reserve Account for the accumulation of Funds for use as maintenance expenditures in subsequent fiscal years. The Maintenance Reserve Account is maintained in the general fund and its activity is included in the general fund annual budget. Funds placed in the maintenance reserve account are restricted to maintenance projects in the District’s approved Maintenance Plan (M-1). A district may increase the balance in the maintenance reserve by appropriating funds in the annual general fund budget certified for taxes or by transfer by Board resolution at year-end of any unanticipated revenue or unexpended line-item appropriation amounts, or both. The activity of the maintenance reserve for the July 1, 2014 to June 30, 2015 fiscal year is as follows:
Beginning Balance, July 1, 2014 277,880$
Withdrawals (116,603)
Transfer per June Resolution 100,000
Ending Balance, June 30, 2015 261,277$
Note 4. Accounts Receivable Accounts receivable at June 30, 2015 consisted of accounts and intergovernmental grants. All receivables are considered collectible in full due to the stable condition of state programs and the current fiscal year guarantee of federal funds. Accounts receivable as of fiscal year end for the School District’s individual major and fiduciary funds, in the aggregate, are as follows:
SpecialGeneral Revenue Proprietary
Fund Fund Funds Total
Intergovernmental 458,104$ 197,921$ 304,380$ 960,405$ Other 14,459 - 1,780 16,239
Total 472,563$ 197,921$ 306,160$ 976,644$
74

CLEARVIEW REGIONAL HIGH SCHOOL DISTRICT
NOTES TO THE FINANCIAL STATEMENTS JUNE 30, 2015
Note 5. Capital Assets The following schedule is a summarization of the capital assets by source for the fiscal year ended June 30, 2015:
June 30, Transfers/ June 30, 2014 Additions Deletions Adjustments 2015
Governmental Activities:Capital assets not being depreciated: Land 1,556,708$ -$ -$ -$ 1,556,708$ Construction in Progress - 69,532 - - 69,532
Total assets not being depreciated 1,556,708 69,532 - - 1,626,240
Capital Assets being depreciated: Buildings & Improvements 61,739,455 127,155 (57,106) - 61,809,504 Land Improvements 3,760,959 - - - 3,760,959 Machinery & Equipment 6,404,354 355,990 (110,880) 3,899 6,653,363 Total Historical Cost 71,904,768 483,145 (167,986) 3,899 72,223,826
Less: accumulated depreciation Buildings & Improvements (20,825,216) (1,478,595) - - (22,303,811) Land Improvements (2,180,270) (136,926) - - (2,317,196) Machinery & Equipment (5,318,403) (238,514) 167,986 (8,627) (5,397,558) Total accumulated depreciation (28,323,889) (1,854,035) 167,986 (8,627) (30,018,565)
Capital assets being depreciated, net 43,580,879 (1,370,890) - (4,728) 42,205,261
Total Governmental Activities, net 45,137,587$ (1,301,358)$ -$ (4,728)$ 43,831,501$
The following is a summary of proprietary fund type fixed assets at June 30, 2015:
June 30, Transfers/ June 30,2014 Additions Adjustments 2015
Business-Type Activities:Capital assets being depreciated:
Machinery & Equipment 301,442$ 4,402$ -$ 305,844$
Less: accumulated depreciation:Equipment (296,975) (2,147) 3,144 (295,978)
Business-type activities capital assets, net 4,467$ 2,255$ 3,144$ 9,866$
75

CLEARVIEW REGIONAL HIGH SCHOOL DISTRICT
NOTES TO THE FINANCIAL STATEMENTS JUNE 30, 2015
Note 6. Long-Term Obligations Bonds are authorized in accordance with State law by the voters of the Municipality through referendums. All Bonds are retired in serial installments within the statutory period of usefulness. Bonds Issued by the Board are General Obligation Bonds. A. Defeased Debt: On December 1, 1997, the District issued General Obligation Bonds of $10,105,000 (par value) with interest rates ranging from 3.70% to 5.375% to advance refund 1994 General Obligation Bonds with an interest rate of 6.10% and a par value of $9,255,000. Maturities of the 1994 Bonds range from 2005 to 2015 and they are callable, at par, on or after August 1, 2005. The 1997 General Obligation Bonds were issued with a net bond premium of $153,806 that was used, in part, to pay issuance costs of $137,147. The net proceeds from the issuance of the General Obligation Bonds were used to purchase U.S.Government securities and those securities were placed on deposit in an irrevocable trust with an escrow agent to provide debt service payments on the 1994 Bonds. The advance refunding met the requirements of an in-substance defeasance and the 1994 Bonds were removed from the District’s debt. As a result of the advance refunding, the District reduced its total debt service requirements by $399,191, which resulted in an economic gain (difference between the present value of the debt service payments on the old and new debt) of $295,453. Also as a result of the refunding the district incurred an accounting loss of $712,853 which is being amortized over the remaining life of the defeased bond issue. On December 23, 2009, the District issued Bonds of $1,303,000 (par value) with interest rates ranging from 2% to 3.5%. Maturities of the 2009 Bonds range from 2011 to 2025 and they are callable, at par, on or after January 15, 2025. The proceeds from the sale of the Bond will be used to finance the installation of solar panels at the Middle School. On October 13, 2010 the School District received approval from the Local Finance Board to finally adopt a refunding bond ordinance to effectuate the issuance of not-to-exceed $20,500,000 School Refunding Bonds for the purpose of refunding the 2003 Bonds. The Refunding Bonds were priced on the morning of Wednesday, October 27, 2010 by Roosevelt & Cross Incorporated, acting as Sole Manager for the Refunding Bonds. The Refunding Bonds were received well by the market and effectively priced by the underwriter, resulting in most of the maturities fully sold. The remaining unsold balances were underwritten by Roosevelt & Cross. The rates achieved on the Refunding Bonds produced present value savings of 5.205% for the School District, greatly exceeding the target of 3.00%. The Refunding Bonds were issued over the same term as the 2003 Bonds, with maturities of February 15, 2011 through February 12, 2023 with coupons of 2.00% to 5.00% and interest rates ranging from 0.75% to 3.35%. The structure of the Refunding Bonds consisted of all serial bonds. The Refunding Bonds are subject to optional redemption prior to maturity. The Board will realize a total of $1,163,814 in debt service savings through 2023 as a result of this refunding. On a present value basis, the savings equate to $987,246 (net of all costs of issuing the bonds), or 5.205% of the bonds refunded. B. Long-Term Obligation Activity: During the fiscal year ended June 30, 2015 the following changes occurred in liabilities reported in the general long-term debt account group:
76

CLEARVIEW REGIONAL HIGH SCHOOL DISTRICT
NOTES TO THE FINANCIAL STATEMENTS JUNE 30, 2015
Note 6. Long-Term Obligations (continued):
June 30, June 30, Due Within2014 Additions Retired 2015 One Year
Bonds Payable 19,878,000$ -$ 1,870,000$ 18,008,000$ 1,940,000$ Unamortized Bond Premium 1,064,949 - 140,595 924,354 132,051 Net Pension Liability 10,771,945 - 270,905 10,501,040 - Compensated Absences Payable:
Governmental 1,012,987 23,586 - 1,036,573 - Business-Type 68,391 - 8,154 60,237 -
Total 32,796,272$ 23,586$ 2,289,654$ 30,530,204$ 2,072,051$
C. Bonds Payable: The voters of the municipality through referendums authorize bonds in accordance with State Law. All bonds are retired in serial installments within the statutory period of usefulness. Bonds issued by the Board are general obligation bonds. Principal and interest due on serial bonds outstanding is as follows:
Year-endingJune 30, Principal Interest Total
2016 1,940,000$ 711,459$ 2,651,459$ 2017 1,990,000 648,209 2,638,209 2018 2,030,000 574,496 2,604,496 2019 2,160,000 483,934 2,643,934 2020 2,265,000 387,734 2,652,734
2021-2025 7,623,000 589,650 8,212,650
Total 18,008,000$ 3,395,482$ 21,403,482$
Note 7. Operating Leases The District has commitments to lease copiers under non-cancellable operating leases for five years. Total lease payments made during the year ended June 30, 2015 amounted to $73,213. Future minimum lease payments are as follows:
Year-ending June 30, 2016 $ 99,840 2017 97,775 2018 84,213 2019 21,392
Total Minimum Lease Payments $303,220
77

CLEARVIEW REGIONAL HIGH SCHOOL DISTRICT
NOTES TO THE FINANCIAL STATEMENTS JUNE 30, 2015
Note 8. Pension Plans A. Public Employees’ Retirement System (PERS) Plan Description - The State of New Jersey, Public Employees' Retirement System (PERS) is a cost-sharing multiple-employer defined benefit pension plan administered by the State of New Jersey, Division of Pensions and Benefits (the Division). For additional information about PERS, please refer to Division's Comprehensive Annual Financial Report (CAFR) which can be found at www.state.nj.us/treasury/pensions/annrprts.shtml. The vesting and benefit provisions are set by N.J.S.A. 43:15A. PERS provides retirement, death and disability benefits. All benefits vest after ten years of service, except for medical benefits, which vest after 25 years of service or under the disability provisions of PERS. The following represents the membership tiers for PERS: Tier Definition 1 Members who were enrolled prior to July 1, 2007 2 Members who were eligible to enroll on or after July 1, 2007 and prior to November 2, 2008 3 Members who were eligible to enroll on or after November 2, 2008 and prior to May 22, 2010 4 Members who were eligible to enroll on or after May 22, 2010 and prior to June 28, 2011 5 Members who were eligible to enroll on or after June 28, 2011 Service retirement benefits of 1/5 5th of final average salary for each year of service credit is available to tiers 1 and 2 members upon reaching age 60 and to tier 3 members upon reaching age 62. Service retirement benefits of 1/60th of final average salary for each year of service credit is available to tier 4 members upon reaching age 62 and tier 5 members upon reaching age 65. Early retirement benefits are available to tiers 1 and 2 members before reaching age 60, tiers 3 and 4 before age 62 with 25 or more years of service credit and tier 5 with 30 or more years of service credit before age 65. Benefits are reduced by a fraction of a percent for each month that a member retires prior to the age at which a member can receive full early retirement benefits in accordance with their respective tier. Tier 1 members can receive an unreduced benefit from age 55 to age 60 if they have at least 25 years of service. Deferred retirement is available to members who have at least 10 years of service credit and have not reached the service retirement age for the respective tier. Basis of Presentation - The schedules of employer allocations and the schedules of pension amounts by employer (collectively, the Schedules) present amounts that are considered elements of the financial statements of PERS or its participating employers. Accordingly, they do not purport to be a complete presentation of the financial position or changes in financial position of PERS or the participating employers. The amounts presented in the Schedules were prepared in accordance with U.S. generally accepted accounting principles. Such preparation requires management of PERS to make a number of estimates and assumptions relating to the reported amounts. Due to the inherent nature of these estimates, actual results could differ from those estimates. Contributions - The contribution policy for PERS is set by N.J.S.A. 15A and requires contributions by active members and contributing employers. State legislation has modified the amount that is contributed by the State. The State's pension contribution is based on an actuarially determined amount which includes the employer portion of the normal cost and an amortization of the unfunded accrued liability.
78
CLEARVIEW REGIONAL HIGH SCHOOL DISTRICT
NOTES TO THE FINANCIAL STATEMENTS JUNE 30, 2015
Note 8: Pension Obligations (continued) A. Public Employees’ Retirement System (PERS) (continued) Funding for noncontributory group insurance benefits is based on actual claims paid. For fiscal year 2014 and 2013, the State's pension contribution was less than the actuarial determined amount. The local employers' contribution amounts are based on an actuarially determined rate which includes the normal cost and unfunded accrued liability. Chapter 19, P.L. 2009 provided an option for local employers of PERS to contribute 50% of the normal and accrued liability contribution amounts certified for payments due in State fiscal year 2009. Such employers will be credited with the full payment and any such amounts will not be included in their unfunded liability. The actuaries will determine the unfunded liability of those retirement systems, by employer, for the reduced normal and accrued liability contributions provided under this law. This unfunded liability will be paid by the employer in level annual payments over a period of 15 years beginning with the payments due in the fiscal year ended June 30, 2012 and will be adjusted by the rate of return on the actuarial value of assets.
Annual Percentage Net Year Pension of APC Pension
Funded Cost (APC) Contributed Obligation
6/30/2015 484,322$ 100% 10,501,040$ 6/30/2014 444,423 100% 10,771,945 6/30/2013 442,314 100% -
Three-Year Trend Information for PERS
Components of Net Pension Liability - At June 30, 2015, the District reported a liability of $10,501,040 for its proportionate share of the PERS net pension liability. The net pension liability was measured as of June 30, 2014. The total pension liability used to calculate the net pension liability was determined using update procedures to roll forward the total pension liability from an actuarial valuation as of June 30, 2013, to the measurement date of June 30, 2014. The District’s proportion of the net pension liability was based on the District’s actual contributions to the plan relative to the total of all participating employers’ contributions for the year ended June 30, 2014. The District’s proportion measured as of June 30, 2014, was .05609%, which was an decrease of .00027% from its proportion measured as of June 30, 2013.
6/30/2015 6/30/2014Actuarial valuation date July 1, 2014 July 1, 2013
Deferred Outflows of Resources 811,048$ 462,374$ Deferred Inflows of Resources 670,224$ -$
Net Pension Liability 10,501,040$ 10,771,945$
District's portion of the Plan's total net pension Liability 0.05609% 0.05636%
Collective Balances at June 30, 2015 and June 30, 2014
79

CLEARVIEW REGIONAL HIGH SCHOOL DISTRICT
NOTES TO THE FINANCIAL STATEMENTS JUNE 30, 2015
Note 8: Pension Obligations (continued) A. Public Employees’ Retirement System (PERS) (continued)
Pension Expense and Deferred Outflows/Inflows of Resources - For the year ended June 30, 2015, the District recognized pension expense of $670,224. At June 30, 2015, the District reported deferred outflows of resources and deferred inflows of resources related to PERS from the following sources:
Deferred Outflows Deferred Inflows
of Resources of Resources
Changes of assumptions 330,209$ -$
Net difference between projected and actualearnings on pension plan investments - 670,224
Changes in proportion and differencesbetween District contributions and proportionateshare of contributions - -
District contributions subsequent to themeasurement date 480,839 - Total 811,048$ 670,224$
The $480,839 reported as deferred outflows of resources related to pensions resulting from school district contributions subsequent to the measurement date (i.e. for the school year ending June 30, 2015, the plan measurement date is June 30, 2014) will be recognized as a reduction of the net pension liability in the year ended June 30, 2016. Other amounts reported as deferred outflows of resources and deferred inflows of resources related to pensions will be recognized in pension expense as follows:
Year Ended June 30: PERS
2016 (82,770)$ 2017 (82,770) 2018 (82,770) 2019 (82,770) 2020 (82,770)
Thereafter 73,836 Actuarial Assumptions - The total pension liability for the June 30, 2014 measurement date was determined by an actuarial valuation as of July 1, 2013, which was rolled forward to June 30, 2014. The total pension liability for the June 30, 2013 measurement date was determined by an actuarial valuation as of July 1, 2013. This actuarial valuation used the following actuarial assumptions, applied to all periods in the measurement:
80

CLEARVIEW REGIONAL HIGH SCHOOL DISTRICT
NOTES TO THE FINANCIAL STATEMENTS JUNE 30, 2015
Note 8: Pension Obligations (continued) A. Public Employees’ Retirement System (PERS) (continued)
PERSMeasurement date June 30, 2014
Actuarial valuation date July 1, 2013
Interest rate 7.90%
Salary scale 2012-2021 - 2.15-4.40%Based on Age
Thereafter - 3.15-5.40%Based on Age
Inflation rate 3.01% Mortality rates were based on the RP-2000 Combined Healthy Male or Female Mortality Tables (setback 1 year for females) with adjustments for mortality improvements from base year of 2012 based on Projection Scale AA. The actuarial assumptions used in the July 1, 2013 valuation were based on the results of an actuarial experience study for the period July 1, 2008 to June 30, 2011. Long-Term Expected Rate of Return - In accordance with State statute, the long-term expected rate of return on plan investments is determined by the State Treasurer, after consultation with the Directors of the Division of Investments and Division of Pensions and Benefits, the board of trustees and the actuaries. Best estimates of arithmetic real rates of return for each major asset class included in PERS's target asset allocation as of June 30, 2014 are summarized in the following table:
Target Long-Term ExpectedAsset Class Allocation Real Rate of Return
Cash 6.00% 0.80%Core Bonds 1.00% 2.49%Intermediate - Term Bonds 11.20% 2.26%Mortgages 2.50% 2.17%High Yield Bonds 5.50% 4.82%Inflation-Indexed Bonds 2.50% 3.51%Broad US Equities 25.90% 8.22%Developed Foreign Equities 12.70% 8.12%Emerging Market Equities 6.50% 9.91%Private Equity 8.25% 13.02%Hedge Funds/Absolute Return 12.25% 4.92%Real Estate (Property) 3.20% 5.80%Commodities 2.50% 5.35%
Total 100%
81

CLEARVIEW REGIONAL HIGH SCHOOL DISTRICT
NOTES TO THE FINANCIAL STATEMENTS JUNE 30, 2015
Note 8: Pension Obligations (continued) A. Public Employees’ Retirement System (PERS) (continued)
Discount Rate - The discount rate used to measure the total pension liability was 5.39% as of June 30, 2014. The single blended discount rate was based on long-term expected rate of return on pension plan investments of 7.9%, and a municipal bond rate of 4.29% as of June 30, 2014, based on the Bond Buyer Go 20-Bond Municipal Bond Index which includes tax-exempt general obligation municipals bonds with an average rating of AA/Aa or higher. The projection of cash flows used to determine the discount rate assumed that employee contributions will be made at the current member contribution rates and that contributions from employers will be made on the average of the last five years of contributions made in relation to the last five years of recommended contributions. Based on those assumptions, the plan’s fiduciary net position was projected to be available to make projected future benefit payments of current plan members through 2033. Therefore, the long-term expected rate of return on plan investments was applied to projected benefit payments through 2033, and the municipal bond rate was applied to projected benefit payments after that date in determining the total pension liability. Sensitivity of the Collective Net Pension Liability to Changes in the Discount Rate - The following presents the collective net pension liability of the participating employers as of June 30, 2014, calculated using the discount rate as disclosed above, as well as what the collective net pension liability would be if it were calculated using a discount rate that is 1-percentage-point lower (4.39%) or 1-percentage-point higher (6.39%) than the current rate:
1% Current 1%Decrease Discount Increase(4.39%) Rate (5.39%) (6.39%)
District's proportionate share of the net pension liability 13,210,666 10,501,040 8,225,644
B. Teachers’ Pension and Annuity Fund (TPAF) Plan Description - The State of New Jersey, Teachers' Pension and Annuity Fund (TPAF) is a cost sharing multiple-employer defined benefit pension plan with a special-funding situation, by which the State of New Jersey (the State) is responsible to fund 100% of the employer contributions, excluding any local employer early retirement incentive (ERI) contributions. TPAF is administered by the State of New Jersey, Division of Pensions and Benefits (the Division). For additional information about TPAF, please refer to Division's Comprehensive Annual Financial Report (CAFR) which can be found at www.state.nj.us/treasury/pensions/annrprts.shtml. The vesting and benefit provisions are set by N.J.S.A. 18A:66. TPAF provides retirement, death and disability benefits. All benefits vest after ten years of service, except for medical benefits, which vest after 25 years of service or under the disability provisions of TPAF. Members are always fully vested for their own contributions and, after three years of service credit, become vested for 2% of related interest earned on the contributions. In the case of death before retirement, members' beneficiaries are entitled to full interest credited to the members' accounts.
82

CLEARVIEW REGIONAL HIGH SCHOOL DISTRICT
NOTES TO THE FINANCIAL STATEMENTS JUNE 30, 2015
Note 8: Pension Obligations (continued) B. Teachers’ Pension and Annuity Fund (TPAF) (continued) The following represents the membership tiers for TPAF: Tier Definition 1 Members who were enrolled prior to July 1, 2007 2 Members who were eligible to enroll on or after July 1, 2007 and prior to November 2, 2008 3 Members who were eligible to enroll on or after November 2, 2008 and prior to May 22, 2010 4 Members who were eligible to enroll on or after May 22, 2010 and prior to June 28, 2011 5 Members who were eligible to enroll on or after June 28, 2011 Service retirement benefits of 1/60th of final average salary for each year of service credit is available to tier 4 members upon reaching age 62 and tier 5 members upon reaching age 65. Early retirement benefits are available to tiers 1 and 2 members before reaching age 60, tiers 3 and 4 before age 62 with 25 or more years of service credit, and tier 5 before age 65 with 30 or more years of service credit. Benefits are reduced by a fraction of a percent for each month that a member retires prior to the retirement age for his/her respective tier. Deferred retirement is available to members who have at least 10 years of service credit and have not reached the service retirement age for the respective tier. Basis of Presentation - The schedules of employer and nonemployer allocations and the schedules of pension amounts by employer and nonemployer (collectively, the Schedules) present amounts that are considered elements of the financial statements of TPAF and the State as an employer/nonemployer entity. Accordingly, they do not purport to be a complete presentation of the financial position or changes in financial position of TPAF or the State. The amounts presented in the Schedules were prepared in accordance with U.S. generally accepted accounting principles. Such preparation requires management of TPAF to make a number of estimates and assumptions relating to the reported amounts. Due to the inherent nature of these estimates, actual results could differ from those estimates. Contributions - The contribution policy for TPAF is set by N.J.S.A 18A:66 and requires contributions by active members and contributing employers. State legislation has modified the amount that is contributed by the State. The State's pension contribution is based on an actuarially determined amount which includes the employer portion of the normal cost and an amortization of the unfunded accrued liability. Funding for noncontributory group insurance benefits is based on actual claims paid. For fiscal year 2014 and 2013, the State's pension contribution was less than the actuarial determined amount. Special Funding Situation - The employer contributions for local participating employers are legally required to be funded by the State in accordance with N.J.S.A 18:66-33. Therefore, these local participating employers are considered to be in a special funding situation as defined by GASB Statement No. 68 and the State is treated as a nonemployer contributing entity. Since the local participating employers do not contribute directly to the plan (except for employer specific financed amounts), there is no net pension liability or deferred outflows or inflows to report in the financial statements of the local participating employers. However, the notes to the financial statements of the local participating employers must disclose the portion of the nonemployer contributing entities' total proportionate share of the net pension liability that is associated with the local participating employer.
83

CLEARVIEW REGIONAL HIGH SCHOOL DISTRICT
NOTES TO THE FINANCIAL STATEMENTS JUNE 30, 2015
Note 8: Pension Obligations (continued) B. Teachers’ Pension and Annuity Fund (TPAF) (continued)
Annual Percentage Net Year Pension of APC Pension
Funded Cost (APC) Contributed Obligation
6/30/2015 1,872,127$ 100% -6/30/2014 1,522,739 100% -6/30/2013 1,868,031 100% -
Three-Year Trend Information for TPAF Pension & Post Retirement Medical Contributions(Paid on behalf of the District)
Teachers Pensions and Annuity Fund (TPAF) - For purposes of measuring the net pension liability, deferred outflows of resources and deferred inflows of resources related to pensions, and pension expense, information about the fiduciary net position of the Teachers Pension and Annuity Fund (TPAF) and additions to/deductions from the TPAF’s fiduciary net position have been determined on the same basis as they are reported by the TPAF. For this purpose, benefit payments (including refunds of employee contributions) are recognized when due and payable in accordance with the benefit terms. Investments are reported at fair value.
TPAFMeasurement date June 30, 2014
Acturial valuation date July 1, 2013
Interest rate 7.90%
Salary scale
Inflation rate 2.50%
Varies Based On Experience
Mortality rates based on the RP-2000 Health Annuitant Mortality Table for Males or Females, as appropriate, with adjustments for mortality improvements based on Scale AA. Pre-retirement mortality improvements for active members are projected using Scale AA from the base year 2000 until the valuation date plus 15 years to account for future mortality improvement. Post-retirement mortality improvements for non-disabled annuitants are projected using Scale AA from the base year of 2000 for males and 2003 for females until the valuation date plus 7 years to account for future mortality improvement. The actuarial assumptions used in the July 1, 2013 valuation were based on the results of an actuarial experience study for the period July 1, 2009 to June 30, 2012.
84
CLEARVIEW REGIONAL HIGH SCHOOL DISTRICT
NOTES TO THE FINANCIAL STATEMENTS JUNE 30, 2015
Note 8: Pension Obligations (continued) B. Teachers’ Pension and Annuity Fund (TPAF) (continued) Long-Term Expected Rate of Return - In accordance with State statute, the long-term expected rate of return on plan investments is determined by the State Treasurer, after consultation with the Directors of the Division of Investments and Division of Pensions and Benefits, the board of trustees and the actuaries. Best estimates of arithmetic real rates of return for each major asset class included in TPAF's target asset allocation as of June 30, 2014 are summarized in the following table:
Target Long-Term ExpectedAsset Class Allocation Real Rate of Return
Cash 6.00% 0.50%Core Fixed Income 0.00% 2.19%Core Bonds 1.00% 1.38%Short-Term Bonds 0.00% 1.00%Intermediate-Term Bonds 11.20% 2.60%Long-Term Bonds 0.00% 3.23%Mortgages 2.50% 2.84%High Yield Bonds 5.50% 4.15%Non-US Fixed Income 0.00% 1.41%Inflation-Indexed Bonds 2.50% 1.30%Broad US Equities 25.90% 5.88%Large Cap US Equities 0.00% 5.62%Mid Cap US Equities 0.00% 6.39%Small Cap US Equities 0.00% 7.39%Developed Foreign Equities 12.70% 6.05%Emerging Market Equities 6.50% 8.90%Private Equity 8.25% 9.15%Hedge Funds/Absolute Return 12.25% 3.85%Real Estate (Property) 3.20% 4.43%Real Estate (REITS) 0.00% 5.58%Commodities 2.50% 3.60%Long Credit Bonds 0.00% 3.74%
Total 100% Discount rate - The discount rate used to measure the total pension liability was 7.75 percent. The projection of cash flows used to determine the discount rate assumed that employee contributions will be made at the current contribution rate, contributions from school districts will be made at contractually required rates (actuarially determined), and contributions from the State will be made at current statutorily required rates. Based on those assumptions, the pension plan’s fiduciary net position was projected to be available to make all projected future benefit payments of current active and inactive employees. Therefore, the long-term expected rate of return on pension plan investments was applied to all periods of projected benefit payments to determine the total pension liability.
85

CLEARVIEW REGIONAL HIGH SCHOOL DISTRICT
NOTES TO THE FINANCIAL STATEMENTS JUNE 30, 2015
Note 8: Pension Obligations (continued) B. Teachers’ Pension and Annuity Fund (TPAF) (continued) Pension plan fiduciary net position. Detailed information about the pension plan’s fiduciary net position is available in the separately issued PERS & TPAF financial report. C. Defined Contribution Retirement Program (DCRP) The District contributes to the New Jersey Defined Contribution Retirement Program (DCRP) which is a defined contribution retirement benefit plan, along with life insurance and disability coverage, for its employees who are ineligible for PERS or TPAF. When enrolled in the DCRP, members contribute 5.5 percent of their base salary to a tax-deferred investment account established with Prudential Financial, which jointly administers the DCRP investments with the Division of Pension and Benefits. Member contributions are matched by a 3 percent employer contribution. For the year ended June 30, 2015, employee contributions totaled $23,409, and the District recognized pension expense of $17,412, which included $3,272 towards life insurance. Employees are immediately vested in their own contributions and earnings on those contributions and become vested in District contributions and earnings on District contributions after commencement of their second year of employment, with some exceptions. Nonvested District contributions and earnings are forfeited upon separation from covered employment. Such forfeitures are reverted back to a forfeiture account for the employer and may be used to reduce pension expenses. For the year ended June 30, 2015, the District did not apply forfeitures to reduce the District’s pension expense. Note 9. Post-Retirement Benefits Chapter 384 of Public Laws 1987 and Chapter 6 of Public Laws 1990 required Teachers’ Pensions and Annuity Fund (TPAF) and the Public Employees’ Retirement System (PERS), respectively, to fund post-retirement medical benefits for those State Employees who retire after accumulating 25 years of credited service or on a disability retirement. P.L. 2007, c.103 amended the law to eliminate the funding of post-retirement medical benefits through the TPAF and PERS. It created separate funds outside of the pension plans for the funding and payment of post-retirement medical benefits for retired State employees and retired educational employees. As of June 30, 2015, there were 103.432 retirees receiving post-retirement medical benefits, and the state contributed $1.04 billion on their behalf.. The cost of these benefits is funded through contributions by the State in accordance with P.L. 1994, c.62. Funding of post-retirement medical benefits changed from a pre-funding basis to a pay-as-you-go basis beginning in Fiscal Year 1994. The State is also responsible for the cost attributable to P.L. 1992, c.126, which provides free health benefits to members of PERS and the Alternate Benefit Program who retired from a board of education or county college with 25 years of service. The State paid $165.8 million toward Chapter 126 benefits for 18,122 eligible retired members in Fiscal Year 2014.
86

CLEARVIEW REGIONAL HIGH SCHOOL DISTRICT
NOTES TO THE FINANCIAL STATEMENTS JUNE 30, 2015
Note 10. Risk Management The District is exposed to various risks of loss related to torts; theft of, damage to and destruction of assets; errors and omissions; injuries to employees; and natural disasters. Property and Liability Insurance – The District maintains commercial insurance coverage for property, liability, student accident and surety bonds. A complete schedule of insurance coverage can be found in the Statistical Section of this Comprehensive Annual Financial Report. New Jersey Unemployment Compensation Insurance – The District has elected to fund their New Jersey Unemployment Compensation Insurance under the “Benefit Reimbursement Method”. Under this plan the District is required to reimburse the New Jersey Unemployment Trust Fund for benefits paid to its former employees and charged to its account with the State. The District is billed quarterly for amounts due to the State. The following is a summary of School District contributions, reimbursements to the State for benefits paid and the ending balance of the School District’s expendable trust fund for the current and previous two years:
District Employee Amount EndingFiscal Year Contributions Contributions Reimbursed Balance
2014-2015 -$ 33,877$ 25,838$ 226,919$ 2013-2014 - 42,103 6,106 218,880 2012-2013 - 33,650 40,860 182,883
Annual contributions to the Fund are determined by the Fund’s Board of Trustees. The District is jointly and personally liable for claims insured by the Fund and its members during the period of its membership, including liability for supplemental assessments, if necessary. The Fund’s Board of Trustees may authorize refunds to its members in any fund year for which contributions exceed the amount necessary to fund all obligations for that year. Note 11. Contingent Liabilities In the opinion of the Administration and Legal Counsels, there are no material litigation or contingent liabilities that are pending against the Clearview Regional High School District.
Note 12. Economic Dependency The District receives a substantial amount of its support from federal and state governments. A significant reduction in the level of support, if this were to occur, could have an effect on the District’s programs and activities.
87

CLEARVIEW REGIONAL HIGH SCHOOL DISTRICT
NOTES TO THE FINANCIAL STATEMENTS JUNE 30, 2015
Note 13. Interfund Receivables and Payables The following interfund balances remained on the balance sheet at June 30, 2015:
Interfund InterfundFund Receivable Payable
General Fund 66,177$ -$ Enterprise Funds 83 65,310 Fiduciary Funds - 950
66,260$ 66,260$
The interfund receivables and payables above predominately resulted from payment made by certain funds on behalf of other funds. All interfund balances are expected to be repaid within one year. The summary of interfund transfers follows:
Fund Transfers In Transfers Out
General Fund 60,468$ -$ Food Service Fund - 60,468 Capital Projects Fund - 80,000 Debt Service Fund 80,000 -
140,468$ 140,468$
The purpose of interfund transfers were for the liquidation of prior year interfund receivables and payables and for payments made on behalf of other funds. Note 14. Fund Balance Disclosures General Fund (Exhibit B-1) – Of the $4,858,403 General Fund fund balance at June 30, 2015, $1,281,957 is restricted for excess surplus – designated for subsequent years expenditures; $261,277 is restricted to establish the Maintenance Reserve Account; $2,377,410 is restricted to establish the Capital Reserve Account; $1,286,886 is restricted for excess surplus in accordance with N.J.S.A.18A:7F-7; and $(349,127) is unassigned. Capital Projects Fund (Exhibit B-1) – The fund balance of $58,421 has been restricted for the Capital Projects Fund.
88

CLEARVIEW REGIONAL HIGH SCHOOL DISTRICT
NOTES TO THE FINANCIAL STATEMENTS JUNE 30, 2015
Note 15. Deferred Compensation The Board offers its employees a choice of the following deferred compensation plans created in accordance with Internal Revenue Code Section 403(b). The plans, which are administered by the entities listed below, permits participants to defer a portion of their salary until future years. Amounts deferred under the plans are not available to employees until termination, retirement, death or unforeseeable emergency. The plan administrators are as follows: Lincoln Investment Planning, Inc. AXA Equitable Met Life Aspire Note 16. Compensated Absences The District accounts for compensated absences (e.g., unused vacation, sick leave) as directed by Governmental Accounting Standards Board Statement No. 16 (GASB 16), “Accounting for Compensated Absences”. A liability for compensated absences attributable to services already rendered and not contingent on a specific event that is outside the control of the employer and employee is accrued as employees earn the rights to the benefits. District employees who are employed for ten months are entitled to ten paid sick leave days per fiscal school year. Employees who are employed for twelve months are entitled to twelve paid sick days per fiscal school year. Unused sick leave may be accumulated and carried forward to the subsequent years. However, an employee must have 25 years of service or their contract must specifically allow the payment of unused sick leave. District employees are entitled to three personal days, which may be carried forward to subsequent years. Vacation days not used during the year may not be accumulated and carried forward. Benefits paid in any future year will be calculated according to formulas outlined in the District’s agreements with the various employee unions and included in the current years’ budget. The liability for vested compensated absences of the governmental fund types is recorded in the statement of net position under governmental activities. The current portion of the compensated absence balance is not considered material to the applicable funds total liabilities, and is therefore not shown separately from the long-term liability balance of compensated absences. The amount at June 30, 2014 is $1,036,573 for governmental activities and $60,237 for business-type activities. Note 17. Calculation of Excess Surplus In accordance with N.J.S.A.18A:7F-7, as amended by P.L. 2004, c.73 (S1701), the designation for Restricted Fund Balance – Excess Surplus is a required calculation pursuant to the New Jersey School Funding Reform Act of 2008 (SFRA). New Jersey school districts are required to restrict General Fund fund balance at the fiscal year-end of June 30 if they did not appropriate a required minimum amount as budgeted fund balance in their subsequent years’ budget. The excess fund balance at June 30, 2015 is $1,286,886.
89

CLEARVIEW REGIONAL HIGH SCHOOL DISTRICT
NOTES TO THE FINANCIAL STATEMENTS JUNE 30, 2015
Note 18. Transfers to Capital Outlay During the year ending June 30, 2015, the District transferred $196,498 to the capital outlay accounts. Note 19. Deficit Fund Balance The District has a deficit fund balance of $349,127 in the General Fund as of June 30, 2015 as reported in the fund statements (modified accrual basis). N.J.S.A. 18A:22-44.2 provides that in the event a state school aid payment is not made until the following school budget year, districts must record the delayed one or more June state aid payments as revenue, for budget purposes only, in the current school budget year. The bill provides legal authority for school districts to recognize this revenue in the current budget year. For intergovernmental transactions, GASB Statement No. 33 requires that recognition (revenue, expenditure, asset, liability) should be in symmetry, i.e., if one government recognizes an asset, the other government recognizes a liability. Since the State is recording the June state aid payment(s) in the subsequent fiscal year, the school district cannot recognize the June state aid payment(s) (on the GAAP financial statements) until the year the State records the payable. Due to the timing difference of recording the June state aid payment, the General Fund balance deficit does not alone indicate that the district is facing financial difficulties. Note 20. Deficit Unrestricted Net Position As reflected on Exhibit A-1, Statement of Net position, a deficit in unrestricted net position of $(12,746,237) existed as of June 30, 2015 for governmental activities. The primary causes of this deficit is the District not recognizing the receivable for the last two state aid payments and the recording of the long-term liability for compensated absences and net pension. In accordance with full accrual accounting, which is the basis of accounting for Exhibit A-1, Statement of Net position, such liabilities are required to be recorded in the period in which they are incurred. However, in accordance with the rules and regulations that govern the District in the formulation of their annual budget (see Note 1), compensated absences and pension liabilities that relate to future services, or that are contingent on a specific event outside the control of the District and its employees, are funded in the period in which such services are rendered or in which such events that place. Therefore, this deficit in unrestricted net position for governmental activities does not indicate that the District is facing financial difficulties.
90

CLEARVIEW REGIONAL HIGH SCHOOL DISTRICT
NOTES TO THE FINANCIAL STATEMENTS JUNE 30, 2015
Note 21. Prior Period Adjustment/Restatement of Net Position Net position as of July 1, 2014, has been restated as follows for the implementation of GASB Statement No. 68, Accounting and Financial Reporting for Pensions, as amended by GASB Statement No. 71, Pension Transition for Contributions Made Subsequent to the Measurement Date.
Governmental Activities Net Position as previously
reported at June 30, 2014 $28,186,163
Prior period adjustment - Implementation of GASB 68:
Net Pension Liability (measurement date as of June 30, 2013) (10,771,945)
Deferred Outflows – district contributions made during fiscal year 2014 462,374 PERS Pension Payable (2015 district PERS Pension Contribution) (462,374)
Total prior period adjustment (10,771,945) Net Position as restated, July 1, 2014. $ 17,414,218
Note 22. Subsequent Events – Bond Issue In December 2015, the Clearview Regional High School District issued $1,995,000 of School Bonds for various improvements and/or renovations at the High School, Middle School and Administration Building. Payments are due each February 1st and August 1st commencing August, 2016.
91

This page intentionally left blank
92

REQUIRED SUPPLEMENTARY INFORMATION - PART II
93

This page intentionally left blank
94

C. Budgetary Comparison Schedules
95

This page intentionally left blank
96

EXH
IBIT
C-1
(Pag
e 1
of 1
1)
POSI
TIV
E/(N
EGA
TIV
E)A
CC
OU
NT
OR
IGIN
AL
BU
DG
ETFI
NA
LFI
NA
L TO
NU
MB
ERS
BU
DG
ETTR
AN
SFER
SB
UD
GET
AC
TUA
LA
CTU
AL
Rev
enue
s:
Loc
al T
ax L
evy
10-1
210
17,2
61,4
93$
-$
17
,261
,493
$
17,2
61,4
93$
-$
Tui
tion
from
Indi
vidu
als
10-1
310
-
-
-
6,
536
6,53
6
T
uitio
n fr
om O
ther
LEA
's W
ithin
the
Stat
e10
-132
036
6,50
0
-
36
6,50
0
483,
557
11
7,05
7
Tui
tion
from
Sum
mer
Sch
ool
10-1
350
2,50
0
-
2,50
0
3,
142
642
T
rans
porta
tion
10-1
420-
1440
10,0
00
-
10
,000
4,94
2
(5
,058
)
In
tere
st o
n In
vest
men
ts-
-
-
9,79
0
9,
790
Inte
rest
on
Cap
ital R
eser
ve F
unds
10-1
XX
X6,
000
-
6,
000
3,42
6
(2
,574
)
M
isce
llane
ous R
even
ues
10-1
XX
X15
5,00
0
-
15
5,00
0
211,
876
56
,876
T
otal
Loc
al S
ourc
e s17
,801
,493
-
17,8
01,4
93
17
,984
,762
18
3,26
9
Sta
te S
ourc
es:
E
qual
izat
ion
Aid
10-3
176
12,7
25,8
60
-
12
,725
,860
12,7
25,8
60
-
Cat
egor
ical
Sec
urity
Aid
10-3
177
195,
116
-
195,
116
19
5,11
6
-
Cat
egor
ical
Tra
nspo
rtatio
n A
id10
-312
140
9,46
4
-
40
9,46
4
409,
464
-
C
ateg
oric
al S
peci
al E
duca
tion
Aid
10-3
132
1,39
7,19
8
-
1,39
7,19
8
1,
397,
198
-
Ext
raor
dina
ry A
id10
-313
124
4,53
5
-
24
4,53
5
292,
383
47
,848
Non
-Pub
lic T
rans
porta
tion
Aid
10-3
190
-
-
41
,572
41
,572
Oth
er S
tate
Aid
10-3
xxx
175,
097
-
175,
097
17
5,09
7
-
Non
budg
eted
:
O
n-B
ehal
f TPA
F Pe
nsio
n C
ontri
butio
n-
-
-
723,
528
72
3,52
8
O
n-B
ehal
f TPA
F Po
st-R
etire
men
t Med
ical
Con
tribu
tion
-
-
-
1,
148,
599
1,14
8,59
9
Rei
mbu
rsed
TPA
F So
cial
Sec
urity
Con
tribu
tion
-
-
-
1,
026,
345
1,02
6,34
5
T
otal
Sta
te S
ourc
e s15
,147
,270
-
15,1
47,2
70
18
,135
,162
2,
987,
892
Fed
eral
Sou
rces
:
Med
icai
d R
eim
burs
emen
t-
-
-
14,7
69
14,7
69
T
otal
Fed
eral
Sou
rce s
-
-
-
14
,769
14
,769
Tota
l Rev
enue
s32
,948
,763
-
32,9
48,7
63
36
,134
,693
3,
185,
930
Expe
nditu
res:
Cur
rent
Exp
ense
:
Inst
ruct
ion
- Reg
ular
Pro
gram
s:
Sa
larie
s of T
each
ers:
Gra
des 6
- 8
11-1
30-1
00-1
013,
521,
618
(60,
200)
3,46
1,41
8
3,
403,
756
57,6
62
Gra
des 9
- 12
11-1
40-1
00-1
016,
334,
858
(79,
759)
6,25
5,09
9
6,
241,
615
13,4
84
H
ome
Inst
ruct
ion:
Sa
larie
s of T
each
ers
11-1
50-1
00-1
0140
,000
(8
84)
39,1
16
39
,116
-
Pu
rcha
sed
Prof
essi
onal
-
E
duca
tiona
l Ser
vice
s11
-150
-100
-320
30,0
00
(2,8
16)
27
,184
26,0
73
1,11
1
JUN
E 30
, '20
15
CL
EA
RV
IEW
RE
GIO
NA
L H
IGH
SC
HO
OL
DIS
TR
ICT
GE
NE
RA
L F
UN
DB
UD
GE
TA
RY
CO
MPA
RIS
ON
SC
HE
DU
LE
FOR
TH
E F
ISC
AL
YE
AR
EN
DE
D J
UN
E 3
0, 2
015
97

EXH
IBIT
C-1
(Pag
e 2
of 1
1)
POSI
TIV
E/(N
EGA
TIV
E)A
CC
OU
NT
OR
IGIN
AL
BU
DG
ETFI
NA
LFI
NA
L TO
NU
MB
ERS
BU
DG
ETTR
AN
SFER
SB
UD
GET
AC
TUA
LA
CTU
AL
Expe
nditu
res (
cont
inue
d):
R
egul
ar P
rogr
ams -
Und
istri
bute
d In
stru
ctio
n:
O
ther
Sal
arie
s for
Inst
ruct
ion
11-1
90-1
00-1
0641
,614
-
41,6
14
41
,194
42
0
Oth
er P
urch
ased
Ser
vice
s11
-190
-100
-500
123,
151
44
2
12
3,59
3
103,
909
19
,684
Gen
eral
Sup
plie
s11
-190
-100
-610
647,
844
(3
6,77
1)
61
1,07
3
546,
471
64
,602
Text
book
s11
-190
-100
-640
144,
800
84
3
14
5,64
3
141,
605
4,
038
Mis
cella
neou
s Exp
endi
ture
s11
-190
-100
-890
9,04
9
48
2
9,
531
2,01
2
7,
519
T
otal
Re g
ular
Pro
gram
s10
,892
,934
(1
78,6
63)
10
,714
,271
10,5
45,7
51
168,
520
S pec
ial E
duca
tion:
L
earn
ing
and/
or L
angu
age
Dis
abili
ties:
Sal
arie
s of T
each
ers
11-2
04-1
00-1
0187
,483
-
87,4
83
87
,483
-
T
otal
Lea
rnin
g an
d/or
Lan
guag
e D
isab
ilitie
s87
,483
-
87,4
83
87
,483
-
B
ehav
ior D
isab
ilitie
s :
S
alar
ies o
f Tea
cher
s11
-209
-100
-101
50,8
10
-
50
,810
50,8
10
-
O
ther
Sal
arie
s for
Inst
ruct
ion
11-2
09-1
00-1
0615
,481
8,
289
23
,770
23,3
75
395
Gen
eral
Sup
plie
s11
-209
-100
-610
1,55
6
-
1,55
6
27
8
1,27
8
T
otal
Beh
avio
ral D
isab
ilitie
s67
,847
8,
289
76
,136
74,4
63
1,67
3
M
ulti p
le D
isab
ilitie
s:
S
alar
ies o
f Tea
cher
s11
-212
-100
-101
286,
639
(1
,850
)
284,
789
28
4,68
1
108
Oth
er S
alar
ies f
or In
stru
ctio
n11
-212
-100
-106
302,
778
(1
14,8
81)
18
7,89
7
187,
897
-
Pur
chas
ed P
rofe
ssio
nal/E
duca
tion
Serv
ices
11-2
12-1
00-3
20-
20
9,21
8
20
9,21
8
200,
263
8,
955
G
ener
al S
uppl
ies
11-2
12-1
00-6
1010
,665
50
0
11
,165
10,3
23
842
Oth
er O
bjec
ts11
-212
-100
-800
2,00
0
-
2,00
0
1,
902
98
T
otal
Mul
ti ple
Dis
abili
ties
602,
082
92
,987
695,
069
68
5,06
6
10,0
03
R
esou
rce
Roo
m:
Sal
arie
s of T
each
ers
11-2
13-1
00-1
011,
348,
535
(7,9
88)
1,
340,
547
1,31
3,30
7
27
,240
O
ther
Sal
arie
s for
Inst
ruct
ion
11-2
13-1
00-1
0623
8,19
6
(32,
700)
205,
496
20
0,29
4
5,20
2
Pur
chas
ed P
rofe
ssio
nal/E
duca
tion
Serv
ices
11-2
13-1
00-3
2023
,770
23,7
70
21
,274
2,
496
G
ener
al S
uppl
ies
11-2
13-1
00-6
106,
488
(500
)
5,
988
5,49
0
49
8
T
otal
Res
ourc
e R
oom
1,59
3,21
9
(1
7,41
8)
1,
575,
801
1,54
0,36
5
35
,436
JUN
E 30
, '20
15
BU
DG
ET
AR
Y C
OM
PAR
ISO
N S
CH
ED
UL
EFO
R T
HE
FIS
CA
L Y
EA
R E
ND
ED
JU
NE
30,
201
5
CL
EA
RV
IEW
RE
GIO
NA
L H
IGH
SC
HO
OL
DIS
TR
ICT
GE
NE
RA
L F
UN
D
98

EXH
IBIT
C-1
(Pag
e 3
of 1
1)
POSI
TIV
E/(N
EGA
TIV
E)A
CC
OU
NT
OR
IGIN
AL
BU
DG
ETFI
NA
LFI
NA
L TO
NU
MB
ERS
BU
DG
ETTR
AN
SFER
SB
UD
GET
AC
TUA
LA
CTU
AL
Spec
ial E
duca
tion
(con
tinue
d):
H
ome
Inst
ruct
ion:
Pu
rcha
sed
Prof
essi
onal
-
E
duca
tiona
l Ser
vice
s11
-219
-100
-320
17,0
00
16,2
00
33
,200
33,1
93
7
T
otal
Hom
e In
stru
ctio
n17
,000
16
,200
33,2
00
33
,193
7
T
otal
Spe
cial
Edu
catio
n2,
367,
631
100,
058
2,46
7,68
9
2,
420,
570
47,1
19
S
choo
l Spo
nsor
ed C
ocur
ricul
ar A
ctiv
ities
:
S
alar
ies
11-4
01-1
00-1
0015
7,02
8
-
15
7,02
8
136,
776
20
,252
P
urch
ased
Ser
vice
s11
-401
-100
-500
13,6
00
2,00
0
15,6
00
15
,038
56
2
G
ener
al S
uppl
ies
11-4
01-1
00-6
0018
,320
-
18,3
20
18
,320
-
Oth
er O
bjec
ts11
-401
-100
-800
5,97
5
(2
,000
)
3,97
5
3,
935
40
Tra
nsfe
rs to
Cov
er D
efic
it 11
.401
-100
-930
10,0
00
-
10
,000
9,90
2
98
T
otal
Sch
ool S
pons
ored
Coc
urric
ular
Act
iviti
es20
4,92
3
-
20
4,92
3
183,
971
20
,952
S
choo
l Spo
nsor
ed A
thle
tics -
Inst
ruct
ion:
Sal
arie
s11
-402
-100
-100
545,
532
5,
600
55
1,13
2
533,
214
17
,918
O
ther
Pur
chas
ed S
ervi
ces
11-4
02-1
00-5
0013
4,40
9
(5,6
00)
12
8,80
9
85,4
74
43,3
35
Sup
plie
s and
Mat
eria
ls11
-402
-100
-600
89,4
60
768
90,2
28
86
,037
4,
191
O
ther
Obj
ects
11-4
02-1
00-8
0045
,838
-
45,8
38
42
,926
2,
912
T
otal
Sch
ool S
pons
ored
Ath
letic
s Ins
truct
ion
815,
239
76
8
81
6,00
7
747,
651
68
,356
T
otal
Oth
er In
stru
ctio
nal P
rogr
ams
1,02
0,16
2
76
8
1,
020,
930
931,
622
89
,308
B
efor
e/A
fter S
choo
l Pro
gram
s - In
stru
ctio
n:
S
alar
ies
11-4
21-1
00-1
00-
-
-
-
-
T
otal
Bef
ore/
Afte
r Sch
ool P
rogr
ams -
Inst
ruct
ion
-
-
-
-
-
S
umm
er S
choo
l - In
stru
ctio
n :
S
alar
ies o
f Tea
cher
s11
-422
-100
-101
35,4
00
(2,3
70)
33
,030
33,0
18
12
Gen
eral
Sup
plie
s11
-422
-100
-610
1,00
0
(6
)
994
-
99
4
-
T
otal
Sum
mer
Sch
ool -
Inst
ruct
ion
36,4
00
(2,3
76)
34
,024
33,0
18
1,00
6
A
ltern
ativ
e Ed
ucat
ion
Pro g
ram
- In
stru
ctio
n:
S
alar
ies o
f Tea
cher
s11
-423
-100
-100
50,0
00
(7,2
36)
42
,764
40,6
49
2,11
5
Oth
er S
alar
ies f
or In
stru
ctio
n11
-423
-100
-106
9,00
0
-
9,00
0
5,
393
3,60
7
Oth
er P
urch
ased
Ser
vice
s11
-423
-100
-500
7,05
0
-
7,05
0
5,
075
1,97
5
Gen
eral
Sup
plie
s11
-423
-100
-600
2,00
0
-
2,00
0
-
2,
000
T
otal
Alte
rnat
ive
Educ
atio
n Pr
o gra
m -
Inst
ruct
ion
68,0
50
(7,2
36)
60
,814
51,1
17
9,69
7
JUN
E 30
, '20
15
FOR
TH
E F
ISC
AL
YE
AR
EN
DE
D J
UN
E 3
0, 2
015
BU
DG
ET
AR
Y C
OM
PAR
ISO
N S
CH
ED
UL
E
CL
EA
RV
IEW
RE
GIO
NA
L H
IGH
SC
HO
OL
DIS
TR
ICT
GE
NE
RA
L F
UN
D
99

EXH
IBIT
C-1
(Pag
e 4
of 1
1)
POSI
TIV
E/(N
EGA
TIV
E)A
CC
OU
NT
OR
IGIN
AL
BU
DG
ETFI
NA
LFI
NA
L TO
NU
MB
ERS
BU
DG
ETTR
AN
SFER
SB
UD
GET
AC
TUA
LA
CTU
AL
A
ltern
ativ
e Ed
ucat
ion
Prog
ram
- Su
ppor
t Ser
vice
s:
S
alar
ies
11-4
23-2
00-1
0045
,750
-
45,7
50
37
,825
7,
925
T
otal
Alte
rnat
ive
Educ
atio
n Pr
o gra
m -
Supp
ort S
ervi
ces
45,7
50
-
45
,750
37,8
25
7,92
5
T
otal
Alte
rnat
ive
Educ
atio
n Pr
o gra
m11
3,80
0
(7,2
36)
10
6,56
4
88,9
42
17,6
22
O
ther
Su p
plem
enta
l/At-R
isk
Prog
ram
s - In
stru
ctio
n:
S
alar
ies
11-4
24-1
00-1
006,
000
-
6,
000
4,37
7
1,
623
T
otal
Oth
er S
u ppl
emen
tal/A
t-Ris
k Pr
ogra
m -
Inst
ruct
ion
6,00
0
-
6,00
0
4,
377
1,62
3
T
otal
Inst
ruct
ion
14,4
36,9
27
(87,
449)
14,3
49,4
78
14
,024
,280
32
5,19
8
Und
istri
bute
d Ex
pend
iture
s:
In
stru
ctio
n :
T
uitio
n to
Oth
er L
EAs W
ithin
t
he S
tate
- R
egul
ar11
-000
-100
-561
10,0
00
7,52
0
17,5
20
17
,520
-
T
uitio
n to
Oth
er L
EAs W
ithin
t
he S
tate
- Sp
ecia
l11
-000
-100
-562
56,3
68
(56,
368)
-
-
-
Tui
tion
to C
ount
y V
ocat
iona
l
D
istri
ct/R
egul
ar D
ay S
choo
ls11
-000
-100
-563
270,
000
69
,120
339,
120
33
8,39
1
729
T
uitio
n to
Cou
nty
Spec
ial S
ervi
ces
D
istri
ct/R
egio
nal D
ay S
choo
ls11
-000
-100
-565
1,39
4,82
0
(3
2,86
9)
1,
361,
951
1,35
9,43
8
2,
513
Tui
tion
to P
rivat
e Sc
hool
for
the
Han
dica
pped
- St
ate
11-0
00-1
00-5
661,
214,
612
(21,
203)
1,19
3,40
9
1,
096,
270
97,1
39
T
uitio
n to
Priv
ate
Scho
ol O
ther
LEA
s Out
side
Sta
te11
-000
-100
-567
-
-
-
-
-
T
uitio
n - S
tate
Fac
ilitie
s11
-000
-100
-568
32,3
06
-
32
,306
32,3
06
-
T
otal
Und
istri
bute
d Ex
pend
iture
s - In
stru
ctio
n2,
978,
106
(33,
800)
2,94
4,30
6
2,
843,
925
100,
381
A
ttend
ance
& S
ocia
l Wor
k Se
rvic
es:
Sal
arie
s11
-000
-211
-100
51,5
70
29,0
02
80
,572
80,5
72
-
T
otal
Atte
ndan
ce &
Soc
ial W
ork
Serv
ice s
51,5
70
29,0
02
80
,572
80,5
72
-
H
ealth
Ser
vice
s:
S
alar
ies
11-0
00-2
13-1
0023
1,42
3
5,99
6
237,
419
23
7,29
5
124
Pur
chas
ed P
rofe
ssio
nal &
Tech
nica
l Ser
vice
s11
-000
-213
-300
17,1
00
246
17,3
46
17
,342
4
Oth
er P
urch
ased
Ser
vice
s11
-000
-213
-500
-
-
-
-
-
Sup
plie
s and
Mat
eria
ls11
-000
-213
-600
5,85
0
(6
34)
5,21
6
4,
819
397
Oth
er O
bjec
ts11
-000
-213
-800
584
13
4
71
8
718
-
T
otal
Hea
lth S
ervi
ces
254,
957
5,
742
26
0,69
9
260,
174
52
5
JUN
E 30
, '20
15
BU
DG
ET
AR
Y C
OM
PAR
ISO
N S
CH
ED
UL
EFO
R T
HE
FIS
CA
L Y
EA
R E
ND
ED
JU
NE
30,
201
5
CL
EA
RV
IEW
RE
GIO
NA
L H
IGH
SC
HO
OL
DIS
TR
ICT
GE
NE
RA
L F
UN
D
100
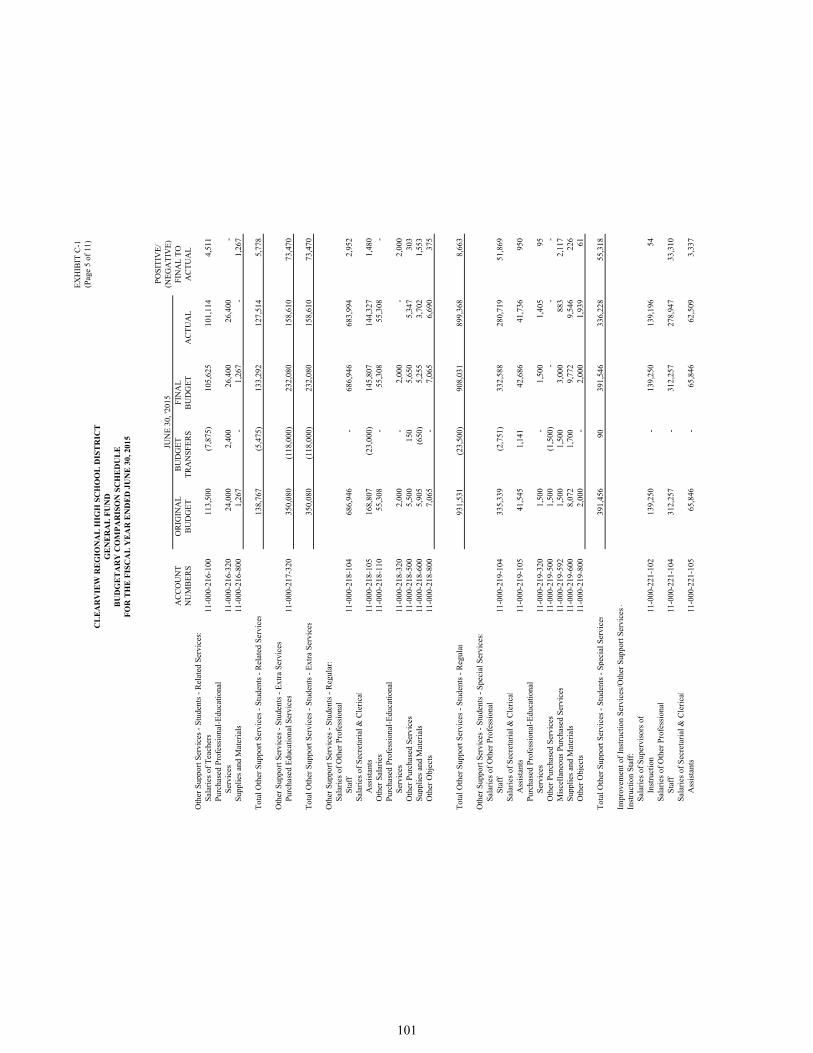
EXH
IBIT
C-1
(Pag
e 5
of 1
1)
POSI
TIV
E/(N
EGA
TIV
E)A
CC
OU
NT
OR
IGIN
AL
BU
DG
ETFI
NA
LFI
NA
L TO
NU
MB
ERS
BU
DG
ETTR
AN
SFER
SB
UD
GET
AC
TUA
LA
CTU
AL
O
ther
Sup
port
Serv
ices
- St
uden
ts -
Rel
ated
Ser
vice
s:
S
alar
ies o
f Tea
cher
s11
-000
-216
-100
113,
500
(7
,875
)
105,
625
10
1,11
4
4,51
1
Pur
chas
ed P
rofe
ssio
nal-E
duca
tiona
l
Se
rvic
es11
-000
-216
-320
24,0
00
2,40
0
26,4
00
26
,400
-
Sup
plie
s and
Mat
eria
ls11
-000
-216
-800
1,26
7
-
1,26
7
-
1,
267
T
otal
Oth
er S
u ppo
rt Se
rvic
es -
Stud
ents
- R
elat
ed S
ervi
ces
138,
767
(5
,475
)
133,
292
12
7,51
4
5,77
8
O
ther
Su p
port
Serv
ices
- St
uden
ts -
Extra
Ser
vice
s:
P
urch
ased
Edu
catio
nal S
ervi
ces
11-0
00-2
17-3
2035
0,08
0
(118
,000
)
232,
080
15
8,61
0
73,4
70
T
otal
Oth
er S
u ppo
rt Se
rvic
es -
Stud
ents
- Ex
tra S
ervi
ces
350,
080
(1
18,0
00)
23
2,08
0
158,
610
73
,470
O
ther
Su p
port
Serv
ices
- St
uden
ts -
Reg
ular
:
S
alar
ies o
f Oth
er P
rofe
ssio
nal
Staf
f11
-000
-218
-104
686,
946
-
686,
946
68
3,99
4
2,95
2
Sal
arie
s of S
ecre
taria
l & C
leric
al
A
ssis
tant
s11
-000
-218
-105
168,
807
(2
3,00
0)
14
5,80
7
144,
327
1,
480
O
ther
Sal
arie
s11
-000
-218
-110
55,3
08
-
55
,308
55,3
08
-
P
urch
ased
Pro
fess
iona
l-Edu
catio
nal
Serv
ices
11-0
00-2
18-3
202,
000
-
2,
000
-
2,00
0
Oth
er P
urch
ased
Ser
vice
s11
-000
-218
-500
5,50
0
15
0
5,
650
5,34
7
30
3
S
uppl
ies a
nd M
ater
ials
11-0
00-2
18-6
005,
905
(650
)
5,
255
3,70
2
1,
553
O
ther
Obj
ects
11-0
00-2
18-8
007,
065
-
7,
065
6,69
0
37
5
T
otal
Oth
er S
uppo
rt Se
rvic
es -
Stud
ents
- R
egul
ar93
1,53
1
(23,
500)
908,
031
89
9,36
8
8,66
3
O
ther
Su p
port
Serv
ices
- St
uden
ts -
Spec
ial S
ervi
ces:
Sal
arie
s of O
ther
Pro
fess
iona
l
St
aff
11-0
00-2
19-1
0433
5,33
9
(2,7
51)
33
2,58
8
280,
719
51
,869
S
alar
ies o
f Sec
reta
rial &
Cle
rical
Ass
ista
nts
11-0
00-2
19-1
0541
,545
1,
141
42
,686
41,7
36
950
Pur
chas
ed P
rofe
ssio
nal-E
duca
tiona
l
Se
rvic
es11
-000
-219
-320
1,50
0
-
1,50
0
1,
405
95
Oth
er P
urch
ased
Ser
vice
s11
-000
-219
-500
1,50
0
(1
,500
)
-
-
-
M
isce
llane
ous P
urch
ased
Ser
vice
s11
-000
-219
-592
1,50
0
1,
500
3,
000
883
2,
117
S
uppl
ies a
nd M
ater
ials
11-0
00-2
19-6
008,
072
1,70
0
9,77
2
9,
546
226
Oth
er O
bjec
ts11
-000
-219
-800
2,00
0
-
2,00
0
1,
939
61
T
otal
Oth
er S
u ppo
rt Se
rvic
es -
Stud
ents
- Sp
ecia
l Ser
vice
s39
1,45
6
90
391,
546
33
6,22
8
55,3
18
Im
prov
emen
t of I
nstru
ctio
n Se
rvic
es/O
ther
Sup
port
Serv
ices
-
Inst
ruct
ion
Staf
f:
S
alar
ies o
f Sup
ervi
sors
of
Inst
ruct
ion
11-0
00-2
21-1
0213
9,25
0
-
13
9,25
0
139,
196
54
S
alar
ies o
f Oth
er P
rofe
ssio
nal
Staf
f11
-000
-221
-104
312,
257
-
312,
257
27
8,94
7
33,3
10
Sal
arie
s of S
ecre
taria
l & C
leric
al
A
ssis
tant
s11
-000
-221
-105
65,8
46
-
65
,846
62,5
09
3,33
7
JUN
E 30
, '20
15
BU
DG
ET
AR
Y C
OM
PAR
ISO
N S
CH
ED
UL
EFO
R T
HE
FIS
CA
L Y
EA
R E
ND
ED
JU
NE
30,
201
5
CL
EA
RV
IEW
RE
GIO
NA
L H
IGH
SC
HO
OL
DIS
TR
ICT
GE
NE
RA
L F
UN
D
101

EXH
IBIT
C-1
(Pag
e 6
of 1
1)
POSI
TIV
E/(N
EGA
TIV
E)A
CC
OU
NT
OR
IGIN
AL
BU
DG
ETFI
NA
LFI
NA
L TO
NU
MB
ERS
BU
DG
ETTR
AN
SFER
SB
UD
GET
AC
TUA
LA
CTU
AL
Im
prov
emen
t of I
nstru
ctio
n Se
rvic
es/O
ther
Sup
port
Serv
ices
-
Inst
ruct
ion
Staf
f (co
ntin
ued)
:
O
ther
Pur
chas
ed S
ervi
ces
11-0
00-2
21-5
0018
,500
2,
600
21
,100
2,89
9
18
,201
S
uppl
ies a
nd M
ater
ials
11-0
00-2
21-6
0033
,000
(1
7,80
0)
15
,200
2,27
6
12
,924
T
otal
Impr
ovem
ent o
f Ins
truct
ion
Serv
ices
/Oth
er
S
uppo
rt Se
rvic
es
In
stru
ctio
nal S
taff
568,
853
(1
5,20
0)
55
3,65
3
485,
827
67
,826
E
duca
tiona
l Med
ia S
ervi
ces/
Scho
ol L
ibra
r y:
Sal
arie
s11
-000
-222
-100
198,
716
-
198,
716
19
8,71
6
-
O
ther
Pur
chas
ed S
ervi
ces
11-0
00-2
22-5
0035
,748
77
0
36
,518
36,4
97
21
Sup
plie
s and
Mat
eria
ls11
-000
-222
-600
33,3
31
(770
)
32
,561
23,0
95
9,46
6
Tota
l Edu
catio
nal M
edia
Ser
vice
s/Sc
hool
Lib
rar y
267,
795
-
267,
795
25
8,30
8
9,48
7
S
u ppo
rt Se
rvic
es In
stru
ctio
nal S
taff
Tra
inin
g Se
rvic
e
S
alar
ies o
f Oth
er P
rofe
ssio
nal
11-0
00-2
23-1
0431
,788
16
,856
48,6
44
48
,643
1
Pur
chas
ed P
rofe
ssio
nal-E
duca
tiona
l
Se
rvic
es11
-000
-223
-320
17,2
00
(3,0
40)
14
,160
2,82
5
11
,335
O
ther
Pur
chas
ed S
ervi
ces
11-0
00-2
23-5
0034
,200
(2
65)
33,9
35
10
,750
23
,185
O
ther
Obj
ects
11-0
00-2
23-8
006,
600
-
6,
600
4,40
8
2,
192
T
otal
Su p
port
Serv
ices
Inst
ruct
iona
l Sta
ff
T
rain
ing
Serv
ices
89,7
88
13,5
51
10
3,33
9
66,6
26
36,7
13
S
u ppo
rt Se
rvic
es G
ener
al A
dmin
istra
tion:
Sal
arie
s11
-000
-230
-100
237,
537
37
,000
274,
537
23
4,28
3
40,2
54
Leg
al S
ervi
ces
11-0
00-2
30-3
3120
,000
13
,500
33,5
00
31
,670
1,
830
A
udit
Serv
ices
11-0
00-2
30-3
3224
,500
-
24,5
00
24
,000
50
0
A
rchi
tect
ural
/Eng
inee
ring
Serv
ices
11-0
00-2
30-3
3410
,000
1,
252
11
,252
3,78
0
7,
472
O
ther
Pur
chas
ed P
rofe
ssio
nal
Serv
ices
11-0
00-2
30-3
3912
,000
8,
110
20
,110
20,1
08
2
C
omm
unic
atio
ns/T
elep
hone
11-0
00-2
30-5
3067
,500
(1
0,00
0)
57
,500
55,5
03
1,99
7
BO
E O
ther
Pur
chas
ed P
rofe
ssio
nal
Serv
ices
11-0
00-2
30-5
854,
750
(1,1
14)
3,
636
3,18
5
45
1
O
ther
Pur
chas
ed S
ervi
ces
11-0
00-2
30-5
9050
,975
4,
190
55
,165
51,7
85
3,38
0
Sup
plie
s & M
ater
ials
11-0
00-2
30-6
106,
800
(3,3
92)
3,
408
1,37
8
2,
030
B
OE
In-H
ouse
Tra
inin
g/M
eetin
g
Su
pplie
s11
-000
-230
-630
300
10
31
0
308
2
Jud
gem
ents
Aga
inst
Dis
trict
11-0
00-2
30-8
20-
-
-
-
-
M
isce
llane
ous E
xpen
ditu
res
11-0
00-2
30-8
9012
,200
(4
0)
12,1
60
4,
750
7,41
0
BO
E M
embe
rshi
p D
ues &
Fee
s11
-000
-230
-895
14,5
50
40
14,5
90
14
,588
2
T
otal
Su p
port
Serv
ices
Gen
eral
Adm
inis
tratio
n46
1,11
2
49,5
56
51
0,66
8
445,
338
65
,330
JUN
E 30
, '20
15
BU
DG
ET
AR
Y C
OM
PAR
ISO
N S
CH
ED
UL
EFO
R T
HE
FIS
CA
L Y
EA
R E
ND
ED
JU
NE
30,
201
5
CL
EA
RV
IEW
RE
GIO
NA
L H
IGH
SC
HO
OL
DIS
TR
ICT
GE
NE
RA
L F
UN
D
102

EXH
IBIT
C-1
(Pag
e 7
of 1
1)
POSI
TIV
E/(N
EGA
TIV
E)A
CC
OU
NT
OR
IGIN
AL
BU
DG
ETFI
NA
LFI
NA
L TO
NU
MB
ERS
BU
DG
ETTR
AN
SFER
SB
UD
GET
AC
TUA
LA
CTU
AL
S
uppo
rt Se
rvic
es S
choo
l Adm
inis
tratio
n:
S
alar
ies o
f Prin
cipa
ls &
Ass
ista
nt
Prin
cipa
ls11
-000
-240
-103
692,
645
14
8,50
0
84
1,14
5
729,
495
11
1,65
0
S
alar
ies o
f Oth
er P
rofe
ssio
nal
Staf
f11
-000
-240
-104
328,
352
9,
500
33
7,85
2
337,
768
84
S
alar
ies o
f Sec
reta
rial &
Cle
rical
Ass
ista
nts
11-0
00-2
40-1
0534
2,16
6
1,20
0
343,
366
30
4,98
6
38,3
80
Pur
chas
ed T
echn
ical
Ser
vice
s11
-000
-240
-300
44,5
00
-
44
,500
31,7
23
12,7
77
Oth
er P
urch
ased
Ser
vice
s11
-000
-240
-500
129,
520
(4
05)
129,
115
10
2,82
1
26,2
94
Sup
plie
s and
Mat
eria
ls11
-000
-240
-600
39,0
00
(843
)
38
,157
36,6
42
1,51
5
Oth
er O
bjec
ts11
-000
-240
-800
9,80
0
-
9,80
0
7,
157
2,64
3
T
otal
Su p
port
Serv
ices
Sch
ool A
dmin
istra
tion
1,58
5,98
3
15
7,95
2
1,
743,
935
1,55
0,59
2
19
3,34
3
C
entra
l Ser
vice
s:
S
alar
ies
11-0
00-2
51-1
0033
0,09
3
1,33
0
331,
423
33
1,08
5
338
Pur
chas
ed P
rofe
ssio
nal
Serv
ices
11-0
00-2
51-3
302,
000
-
2,
000
-
2,00
0
Pur
chas
ed T
echn
ical
Ser
vice
s11
-000
-251
-340
34,6
04
-
34
,604
29,7
73
4,83
1
Oth
er P
urch
ased
Ser
vice
s11
-000
-251
-592
14,5
50
-
14
,550
9,05
4
5,
496
S
uppl
ies &
Mat
eria
ls11
-000
-251
-600
10,0
00
-
10
,000
6,31
3
3,
687
I
nter
est o
n Le
ase
Purc
hase
Agr
eem
ents
11-0
00-2
51-8
321,
209
-
1,
209
1,20
9
-
Oth
er O
bjec
ts11
-000
-251
-890
2,02
5
-
2,02
5
1,
345
680
T
otal
Cen
tral S
ervi
ces
394,
481
1,
330
39
5,81
1
378,
779
17
,032
A
dmin
istra
tive
Info
rmat
ion
Tech
nolo
gy
S
alar
ies
11-0
00-2
52-1
0023
9,87
0
11,0
70
25
0,94
0
250,
861
79
O
ther
Pur
chas
ed S
ervi
ces
11-0
00-2
52-5
0010
4,67
7
50,9
09
15
5,58
6
146,
098
9,
488
S
uppl
ies &
Mat
eria
ls11
-000
-252
-600
62,7
86
(7,9
16)
54
,870
54,4
78
392
T
otal
Adm
inis
trativ
e In
form
atio
n Te
chno
logy
407,
333
54
,063
461,
396
45
1,43
7
9,95
9
A
llow
ance
Mai
nten
ance
for S
choo
l Fac
ilitie
s :
S
alar
ies
11-0
00-2
61-1
0016
3,70
1
2,07
0
165,
771
16
5,76
9
2
C
lean
ing,
Rep
air &
Mai
nten
ance
Serv
ices
11-0
00-2
61-4
2042
9,03
3
41,9
52
47
0,98
5
303,
482
16
7,50
3
G
ener
al S
uppl
ies
11-0
00-2
61-6
1012
1,90
0
2,17
0
124,
070
62
,014
62
,056
O
ther
Obj
ects
11-0
00-2
61-8
0050
0
-
50
0
-
500
T
otal
Allo
wan
ce M
aint
enan
ce fo
r Sch
ool F
acili
ties
715,
134
46
,192
761,
326
53
1,26
5
230,
061
JUN
E 30
, '20
15
BU
DG
ET
AR
Y C
OM
PAR
ISO
N S
CH
ED
UL
EFO
R T
HE
FIS
CA
L Y
EA
R E
ND
ED
JU
NE
30,
201
5
CL
EA
RV
IEW
RE
GIO
NA
L H
IGH
SC
HO
OL
DIS
TR
ICT
GE
NE
RA
L F
UN
D
103

EXH
IBIT
C-1
(Pag
e 8
of 1
1)
POSI
TIV
E/(N
EGA
TIV
E)A
CC
OU
NT
OR
IGIN
AL
BU
DG
ETFI
NA
LFI
NA
L TO
NU
MB
ERS
BU
DG
ETTR
AN
SFER
SB
UD
GET
AC
TUA
LA
CTU
AL
O
ther
Ope
ratio
n &
Mai
nten
ance
of P
lant
Ser
vice
s:
S
alar
ies
11-0
00-2
62-1
0077
4,73
5
(20,
767)
753,
968
69
4,87
0
59,0
98
Pur
chas
ed P
rofe
ssio
nal &
Tec
hnic
al S
ervi
ces
11-0
00-2
62-3
003,
000
-
3,
000
-
3,00
0
Cle
anin
g, R
epai
r & M
aint
enan
ce
Se
rvic
es11
-000
-262
-420
42,0
00
-
42
,000
27,2
46
14,7
54
Oth
er P
urch
ased
Pro
perty
Serv
ices
11-0
00-2
62-4
9069
,000
-
69,0
00
68
,855
14
5
I
nsur
ance
11-0
00-2
62-5
2015
9,92
8
-
15
9,92
8
155,
308
4,
620
O
ther
Pur
chas
ed S
ervi
ces
11-0
00-2
62-5
905,
200
-
5,
200
1,41
2
3,
788
G
ener
al S
uppl
ies
11-0
00-2
62-6
1014
3,20
0
3,88
7
147,
087
55
,555
91
,532
E
nerg
y (E
lect
ricity
)11
-000
-262
-622
610,
000
37
,330
647,
330
64
2,95
4
4,37
6
Ene
rgy
(Nat
ural
Gas
)11
-000
-262
-621
250,
000
(4
,330
)
245,
670
21
7,83
9
27,8
31
Mis
cella
neou
s Exp
endi
ture
s11
-000
-262
-800
2,00
0
-
2,00
0
18
2
1,81
8
T
otal
Oth
er O
pera
tion
& M
aint
enan
ce o
f Pla
nt S
ervi
ces
2,05
9,06
3
16
,120
2,07
5,18
3
1,
864,
221
210,
962
C
are
& U
pkee
p of
Gro
unds
:
S
alar
ies
11-0
00-2
63-1
0013
6,48
0
2,20
0
138,
680
13
8,65
6
24
Cle
anin
g, R
epai
r &-
Mai
nten
ance
Ser
vice
s11
-000
-263
-420
32,5
00
4,17
2
36,6
72
35
,446
1,
226
G
ener
al S
uppl
ies
11-0
00-2
63-6
1066
,500
(2
,771
)
63,7
29
46
,467
17
,262
T
otal
Car
e &
Upk
eep
of G
roun
ds23
5,48
0
3,60
1
239,
081
22
0,56
9
18,5
12
S
ecur
it y:
Sal
arie
s11
-000
-266
-100
78,4
16
2,53
6
80,9
52
80
,571
38
1
T
otal
Sec
urit y
78,4
16
2,53
6
80,9
52
80
,571
38
1
T
otal
Ope
ratio
n &
Mai
nten
ance
of P
lant
Ser
vice
s3,
088,
093
68,4
49
3,
156,
542
2,69
6,62
6
45
9,91
6
S
tude
nt T
rans
porta
tion
Serv
ices
:
S
alar
ies f
or P
upil
Tran
spor
tatio
n
(B
etw
een
Hom
e &
Sch
ool)
-
R
egul
ar11
-000
-270
-160
434,
356
(4
8,00
0)
38
6,35
6
360,
696
25
,660
S
alar
ies f
or P
upil
Tran
spor
tatio
n
(B
etw
een
Hom
e &
Sch
ool)
-
S
peci
al11
-000
-270
-161
350,
511
(1
03,7
10)
24
6,80
1
241,
928
4,
873
S
alar
ies f
or P
upil
Tran
spor
tatio
n
(O
ther
Tha
n B
etw
een
Hom
e
&
Sch
ool)
11-0
00-2
70-1
6212
0,00
0
5,02
0
125,
020
12
5,01
7
3
P
urch
ased
Pro
fess
iona
l &
Te
chni
cal S
ervi
ces
11-0
00-2
70-3
903,
000
-
3,
000
1,19
6
1,
804
JUN
E 30
, '20
15
BU
DG
ET
AR
Y C
OM
PAR
ISO
N S
CH
ED
UL
EFO
R T
HE
FIS
CA
L Y
EA
R E
ND
ED
JU
NE
30,
201
5
CL
EA
RV
IEW
RE
GIO
NA
L H
IGH
SC
HO
OL
DIS
TR
ICT
GE
NE
RA
L F
UN
D
104

EXH
IBIT
C-1
(Pag
e 9
of 1
1)
POSI
TIV
E/(N
EGA
TIV
E)A
CC
OU
NT
OR
IGIN
AL
BU
DG
ETFI
NA
LFI
NA
L TO
NU
MB
ERS
BU
DG
ETTR
AN
SFER
SB
UD
GET
AC
TUA
LA
CTU
AL
S
tude
nt T
rans
porta
tion
Serv
ices
(con
tinue
d):
Cle
anin
g, R
epai
r & M
aint
enan
ce
Ser
vice
s11
-000
-270
-420
190,
600
(1
8,54
6)
17
2,05
4
172,
053
1
Aid
in L
ieu
of P
aym
ents
-
N
onpu
blic
11-0
00-2
70-5
0314
2,90
4
(24,
127)
118,
777
11
4,28
1
4,49
6
Con
tract
ed S
ervi
ces
Bet
wee
n H
ome
& S
choo
l -
V
endo
rs11
-000
-270
-511
126,
309
(1
6,21
2)
11
0,09
7
106,
375
3,
722
C
ontra
cted
Ser
vice
s (O
ther
Than
Bet
wee
n H
ome
&
Sc
hool
) - V
endo
rs11
-000
-270
-512
5,00
0
(5
,000
)
-
-
-
C
ontra
cted
Ser
vice
s (O
ther
Than
Bet
wee
n H
ome
&
Sc
hool
) - Jo
int A
gree
men
ts11
-000
-270
-513
-
-
-
-
-
Con
tract
ed S
ervi
ces (
Spec
ial
Educ
atio
n St
uden
ts) -
Ven
dors
11-0
00-2
70-5
14-
12
8,30
6
12
8,30
6
128,
306
-
Con
tract
ed S
ervi
ces (
Spec
ial
Educ
atio
n St
uden
ts) -
Join
t
A
gree
men
ts11
-000
-270
-515
44,5
00
59,6
98
10
4,19
8
97,4
58
6,74
0
Con
tract
ed S
ervi
ces (
Oth
er T
han
Bet
wee
n
Hom
e &
Sch
ool)
- ESC
/CTS
A11
-000
-270
-517
-
44,1
27
44
,127
43,1
48
979
Con
tract
ed S
ervi
ces (
Spec
ial
Educ
atio
n St
uden
ts) -
ESC
/CTS
A11
-000
-270
-518
171,
803
(1
09,0
09)
62
,794
62,7
93
1
T
rave
l11
-000
-270
-580
-
1,40
0
1,40
0
-
1,
400
M
isce
llane
ous P
urch
ased
Serv
ices
- Tr
ansp
orta
tion
11-0
00-2
70-5
9359
,680
(1
,500
)
58,1
80
44
,100
14
,080
S
uppl
ies a
nd M
ater
ials
11-0
00-2
70-6
0020
0,00
0
(68,
000)
132,
000
10
6,87
3
25,1
27
Tra
nspo
rtatio
n Su
pplie
s11
-000
-270
-615
18,6
95
122,
035
140,
730
14
0,73
0
-
O
ther
Obj
ects
11-0
00-2
70-8
0080
0
517
1,31
7
91
0
407
-
Tot
al S
tude
nt T
rans
porta
tion
Serv
ices
1,86
8,15
8
(3
3,00
1)
1,
835,
157
1,74
5,86
4
89
,293
U
nallo
cate
d B
enef
its -
Empl
oyee
Ben
efits
:
S
ocia
l Sec
urity
11-0
00-2
91-2
2040
5,00
0
-
40
5,00
0
377,
205
27
,795
O
ther
Ret
irem
ent B
enef
its11
-000
-291
-241
551,
250
(6
6,88
8)
48
4,36
2
484,
322
40
W
orke
r's C
ompe
nsat
ion
11-0
00-2
91-2
6022
6,00
0
(2,5
26)
22
3,47
4
223,
474
-
Hea
lth B
enef
its11
-000
-291
-270
4,12
6,70
7
(5
,145
)
4,12
1,56
2
3,
609,
167
512,
395
Tui
tion
Rei
mbu
rsem
ent
11-0
00-2
91-2
8055
,000
-
55,0
00
44
,234
10
,766
O
ther
Em
ploy
ee B
enef
its11
-000
-291
-290
237,
739
(4
,000
)
233,
739
19
6,88
1
36,8
58
T
otal
Una
lloca
ted
Ben
efits
- Em
ploy
ee B
enef
its5,
601,
696
(78,
559)
5,52
3,13
7
4,
935,
283
587,
854
N
onbu
d get
ed:
On-
Beh
alf T
PAF
Pens
ion
Con
tribu
tion
-
-
-
72
3,52
8
(723
,528
)
O
n-B
ehal
f TPA
F Po
st-R
etire
men
t Med
ical
Con
tribu
tion
-
-
-
1,
148,
599
(1,1
48,5
99)
R
eim
burs
ed T
PAF
Soci
al S
ecur
ity C
ontri
butio
n-
-
-
1,02
6,34
5
(1
,026
,345
)
T
otal
Non
bud g
eted
-
-
-
2,
898,
472
(2,8
98,4
72)
T
otal
Und
istri
bute
d Ex
pend
iture
s19
,429
,759
72
,200
19,5
01,9
59
20
,619
,543
(1
,117
,584
)
Tota
l Ex p
endi
ture
s - C
urre
nt E
xpen
se33
,866
,686
(1
5,24
9)
33
,851
,437
34,6
43,8
23
(792
,386
)
JUN
E 30
, '20
15
BU
DG
ET
AR
Y C
OM
PAR
ISO
N S
CH
ED
UL
EFO
R T
HE
FIS
CA
L Y
EA
R E
ND
ED
JU
NE
30,
201
5
CL
EA
RV
IEW
RE
GIO
NA
L H
IGH
SC
HO
OL
DIS
TR
ICT
GE
NE
RA
L F
UN
D
105

EXH
IBIT
C-1
(Pag
e 10
of 1
1)
POSI
TIV
E/(N
EGA
TIV
E)A
CC
OU
NT
OR
IGIN
AL
BU
DG
ETFI
NA
LFI
NA
L TO
NU
MB
ERS
BU
DG
ETTR
AN
SFER
SB
UD
GET
AC
TUA
LA
CTU
AL
Cap
ital O
utla
y:
Equ
ipm
ent:
I
ncre
ase
in C
apita
l Res
erve
10-6
046,
000
-
6,
000
-
6,00
0
Reg
ular
Pro
gram
s - In
stru
ctio
n:
G
rade
s 6 -
812
-130
-100
-730
4,65
3
-
4,65
3
-
4,
653
G
rade
s 9 -
1212
-140
-100
-730
31,9
32
31,4
81
63
,413
37,7
39
25,6
74
Und
istri
bute
d Ex
pend
iture
s:
Su
ppor
t Ser
vice
s - R
egul
ar12
-000
-210
-730
-
5,70
0
5,70
0
5,
652
48
Adm
inis
tratio
n In
form
atio
n
Tec
hnol
ogy
12-0
00-2
52-7
3059
,906
58
,825
118,
731
11
2,76
2
5,96
9
Cus
todi
al S
ervi
ces
12-0
00-2
62-7
30-
26
,117
26,1
17
26
,117
-
Car
e an
d U
pkee
p of
Gro
unds
12-0
00-2
63-7
306,
000
30
6,03
0
6,
030
-
S
tude
nt T
rans
porta
tion:
Non
-inst
ruct
iona
l Equ
ipm
ent
12-0
00-2
70-7
32-
11
,738
11,7
38
7,
887
3,85
1
Scho
ol B
uses
- R
egul
ar12
-000
-270
-733
180,
000
(1
4,96
8)
16
5,03
2
165,
020
12
Sc
hool
Bus
es -
Spec
ial
12-0
00-2
70-7
34-
-
-
-
-
T
otal
Equ
ipm
ent
288,
491
11
8,92
3
40
7,41
4
361,
207
46
,207
F
acili
ties A
c qui
sitio
n &
Con
stru
ctio
n Se
rvic
es
A
sses
smen
t for
Deb
t Ser
vice
on
A
rchi
tect
ural
/Eng
inee
ring
Serv
ices
12-0
00-4
00-3
34-
77
,575
77,5
75
71
,512
6,
063
Con
stru
ctio
n Se
rvic
es12
-000
-400
-450
84,5
00
-
84
,500
70,0
49
14,4
51
S
DA
Fun
ding
12-0
00-4
00-8
9621
7,62
0
-
21
7,62
0
217,
620
-
T
otal
Fac
ilitie
s Ac q
uisi
tion
& C
onst
ruct
ion
Serv
ices
302,
120
77
,575
379,
695
35
9,18
1
20,5
14
T
otal
Ca p
ital O
utla
y59
0,61
1
196,
498
787,
109
72
0,38
8
66,7
21
A
dult
Educ
atio
n - L
ocal
- In
stru
ctio
n :
S
alar
ies o
f Tea
cher
s13
-602
-100
-101
3,00
0
-
3,00
0
2,
840
160
T
otal
Adu
lt Ed
ucat
ion
- Loc
al -
Inst
ruct
ion
3,00
0
-
3,00
0
2,
840
160
A
dult
Educ
atio
n - L
ocal
- Su
ppor
t Ser
vice
:
S
alar
ies
13-6
02-2
00-1
0022
,000
-
22,0
00
14
,927
7,
073
E
mpl
oyee
Ben
efits
13-6
02-2
00-2
002,
200
-
2,
200
1,33
3
86
7
P
urch
ased
Pro
fess
iona
l &
Te
chni
cal S
ervi
ces
13-6
02-2
00-3
0030
,000
(3
,667
)
26,3
33
26
,333
-
Oth
er P
urch
ased
Ser
vice
s13
-602
-200
-500
11,5
00
(33)
11
,467
5,77
0
5,
697
S
uppl
ies &
Mat
eria
ls13
-602
-200
-600
6,00
0
3,
705
9,
705
9,70
5
-
Mis
cella
neou
s Exp
endi
ture
s13
-602
-200
-800
300
(5
)
295
-
29
5
T
otal
Adu
lt Ed
ucat
ion
- Loc
al -
Supp
ort S
ervi
ces
72,0
00
-
72
,000
58,0
68
13,9
32
T
otal
Adu
lt Ed
ucat
ion
- Loc
al75
,000
-
75,0
00
60
,908
14
,092
Tot
al S
peci
al S
choo
ls75
,000
-
75,0
00
60
,908
14
,092
Tot
al E
xpen
ditu
res
34,5
32,2
97
181,
249
34,7
13,5
46
35
,425
,119
(7
11,5
73)
Exce
ss/(D
efic
ienc
y) o
f Rev
enue
s Ove
r/(U
nder
)
Exp
endi
ture
s(1
,583
,534
)
(181
,249
)
(1,7
64,7
83)
709,
574
2,
474,
357
JUN
E 30
, '20
15
CL
EA
RV
IEW
RE
GIO
NA
L H
IGH
SC
HO
OL
DIS
TR
ICT
GE
NE
RA
L F
UN
DB
UD
GE
TA
RY
CO
MPA
RIS
ON
SC
HE
DU
LE
FOR
TH
E F
ISC
AL
YE
AR
EN
DE
D J
UN
E 3
0, 2
015
106

EXH
IBIT
C-1
(Pag
e 11
of 1
1)
POSI
TIV
E/(N
EGA
TIV
E)A
CC
OU
NT
OR
IGIN
AL
BU
DG
ETFI
NA
LFI
NA
L TO
NU
MB
ERS
BU
DG
ETTR
AN
SFER
SB
UD
GET
AC
TUA
LA
CTU
AL
Oth
er F
inan
cin g
Sou
rces
/(Use
s):
Tra
nsfe
r to
Ente
r pris
e Fu
nd-
-
-
(194
,517
)
19
4,51
7
Tota
l Oth
er F
inan
cing
Sou
rces
/(Use
s)-
-
-
(194
,517
)
19
4,51
7
Exce
ss/(D
efic
ienc
y) o
f Rev
enue
s & O
ther
Fin
anci
ng S
ourc
es O
ver/(
Und
er) E
xpen
ditu
res &
Oth
er F
inan
cing
Sour
ces/
(Use
s)(1
,583
,534
)
(181
,249
)
(1,7
64,7
83)
515,
057
2,
668,
874
Fund
Bal
ance
s, Ju
ly 1
5,70
7,03
0
-
5,70
7,03
0
5,
707,
030
-
Fund
Bal
ance
s, Ju
ne 3
04,
123,
496
$
(181
,249
)$
3,
942,
247
$
6,22
2,08
7$
2,
668,
874
$
Prio
r Yea
r Enc
umbr
ance
s77
,071
$
Tr
ansf
er in
from
Ca p
ital R
eser
ve77
,575
Tran
sfer
in fr
om M
aint
enan
ce R
eser
v e26
,603
Tota
l18
1,24
9$
Res
trict
ed fo
r:C
apita
l Res
erve
2,37
7,41
0$
M
aint
enan
ce R
eser
v e26
1,27
7Ex
cess
Sur
plus
1,29
0,77
6Ex
cess
Sur
plus
Des
igna
ted
for S
ubse
quen
t Yea
r's E
xpen
ditu
res
1,28
1,95
7A
ssi g
ned
to:
Yea
r-En
d En
cum
bran
ces
120,
356
Des
i gna
ted
for S
ubse
quen
t Yea
r's E
xpen
ditu
res
150,
114
Una
ssi g
ned
Fund
Bal
ance
740,
197
S
ubto
tal
6,22
2,08
7
Rec
onci
liatio
n to
Gov
ernm
enta
l Fun
d St
atem
ents
(GA
AP)
: L
ast T
wo
Stat
e A
id P
aym
ents
Not
Rec
ogni
zed
on G
AA
P B
asis
(1,3
63,6
84)
Fund
Bal
ance
Per
Gov
ernm
enta
l Fun
ds (G
AA
P)4,
858,
403
$
JUN
E 30
, '20
15
BU
DG
ET
AR
Y C
OM
PAR
ISO
N S
CH
ED
UL
EFO
R T
HE
FIS
CA
L Y
EA
R E
ND
ED
JU
NE
30,
201
5
RE
CA
PIT
UL
AT
ION
OF
BU
DG
ET
TR
AN
SFE
RS
RE
CA
PIT
UL
AT
ION
OF
FUN
D B
AL
AN
CE
:
CL
EA
RV
IEW
RE
GIO
NA
L H
IGH
SC
HO
OL
DIS
TR
ICT
GE
NE
RA
L F
UN
D
107

EXHIBIT C-2
POSITIVE/BUDGET (NEGATIVE)
ORIGINAL TRANSFERS/ FINAL FINAL TOBUDGET ADJUSTMENTS BUDGET ACTUAL ACTUAL
Revenues: Federal Sources 527,054$ 243,420$ 770,474$ 647,587$ (122,887)$ State Sources 60,169 25,354 85,523 83,668 (1,855) Local Sources - 11,478 11,478 10,305 (1,173) Total Revenues 587,223 280,252 867,475 741,560 (125,915)
Expenditures: Instruction: Salaries of Teachers 30,000 9,473 39,473 36,965 2,508 Purchased Professional Technical Services - 8,713 8,713 8,713 - Other Professional Services 316,500 19,881 336,381 336,381 - General Supplies 57,890 (9,111) 48,779 46,193 2,586 Textbooks 11,000 3,001 14,001 3,999 10,002 Other Objects 5,000 (193) 4,807 4,747 60
Total Instruction 420,390 31,764 452,154 436,998 15,156
Support Services: Salaries 17,000 83,990 100,990 54,470 46,520 Salaries of Other Professional Staff 30,000 23,264 53,264 18,808 34,456 Salaries of Secretaries & Clerical Assistants 41,545 189 41,734 41,734 - Personal Services - Employee Benefits 13,690 12,690 26,380 16,832 9,548 Purchased Professional Services 24,800 47,135 71,935 69,789 2,146 Other Purchased Services 36,109 18,980 55,089 40,396 14,693 Travel - - - - - Supplies and Materials 3,689 12,331 16,020 12,624 3,396
Total Support Services 166,833 198,579 365,412 254,653 110,759
Facilities Acquisition & Construction Services: Instructional Equipment - 49,909 49,909 49,909 -
Total Facilities Acquisition & Construction Services - 49,909 49,909 49,909 -
Total Expenditures 587,223 280,252 867,475 741,560 125,915
Total Outflows 587,223 280,252 867,475 741,560 125,915
Excess/(Deficiency) of Revenues Over/(Under) Expenditures & Other Financing Sources/(Uses) -$ -$ -$ -$ -$
CLEARVIEW REGIONAL HIGH SCHOOL DISTRICTSPECIAL REVENUE FUND
BUDGETARY COMPARISON SCHEDULEFOR THE FISCAL YEAR ENDED JUNE 30, 2015
108

NOTES TO REQUIRED SUPPLEMENTARY INFORMATION - PART II
109

This page intentionally left blank
110

EXHIBIT C-3
GENERAL SPECIALFUND REVENUE
N-1 FUNDSources/Inflows of Resources: Actual Amounts (Budgetary Basis) "Revenue" From the Budgetary Comparison Schedule (C-Series) 36,134,693$ 741,560$
State aid payment recognized for GAAP statements in the current year, previously recognized for budgetary purposes. 1,370,735 -
State aid payment recognized for budgetary purposes, not recognized for GAAP statements until the subsequent year. (1,363,684) -
Total Revenues as Reported on the Statement of Revenues, Expenditures, and Changes in Fund Balances - Governmental Funds. (B-2) 36,141,744$ 741,560$
Uses/outflows of resources: Actual amounts (budgetary basis) "total expenditures" from the budgetary comparison schedule 35,425,119$ 741,560$
Differences - budget to GAAP Encumbrances for supplies and equipment ordered but not received is reported in the year the order is placed for budgetary purposes, but in the year the supplies are received for financial reporting purposes.
General Supplies - -
Total Expenditures as Reported on the Statement of Revenues, Expenditures, and Changes in Fund Balances - Governmental Funds (B-2) 35,425,119$ 741,560$
N-1 The general fund budget uses GAAP basis therefore no reconciliation is necessary.
Note A - Explanation of Differences between Budgetary Inflows and Outflows and GAAP Revenues and Expenditures
FOR FISCAL YEAR ENDED JUNE 30, 2015
CLEARVIEW REGIONAL HIGH SCHOOL DISTRICTREQUIRED SUPPLEMENTARY INFORMATION
BUDGETARY COMPARISON SCHEDULE NOTE TO RSI
111

This page intentionally left blank
112

REQUIRED SUPPLEMENTARY INFORMATION - PART III
113

This page intentionally left blank
114

L. Schedules Related to Accounting and Reporting for Pensions (GASB 68)
115

This page intentionally left blank
116

EXHIBIT L-1
2015 2014
District's proportion of the net pension liability(asset) 0.05609% 0.05636%
District's proportionate share of the netpension liability (asset) 10,501,040$ 10,771,945$
District's covered-employee payroll 3,686,581$ 3,894,596$
District's proportionate share of the netpension liability (asset) as a percentage of itscovered-employee payroll 284.84% 276.59%
Plan fiduciary net position as a percentage ofthe total pension liability 52.08% 48.72%
**This schedule is presented to illistrate the requirement to show information for 10 years. However, until a full 10-year trend is compiled, governments should present information for those years for which information is available.
CLEARVIEW REGIONAL HIGH SCHOOL DISTRICTSCHEDULE OF THE DISTRICT'S PROPORTIONATE SHARE OF THE NET PENSION LIABILITY
PUBLIC EMPLOYEES' RETIREMENT SYSTEMLAST TWO FISCAL YEARS
117

EXHIBIT L-2
2015 2014
Contractually required contribution 480,839$ 462,374$
Contributions in relation to thecontractually required contribution 480,839 462,374
Contribution deficiency (excess) -$ -$
District's covered-employee payroll 3,686,581$ 3,894,596$
Contributions as a percentage of covered-employee payroll 13.04% 11.87%
**This schedule is presented to illustrate the requirement to show information for 10 years. However, until a full 10-year trend is compiled, governments should present information for those years for which
CLEARVIEW REGIONAL HIGH SCHOOL DISTRICTSCHEDULE OF DISTRICT CONTRIBUTIONS
PUBLIC EMPLOYEES' RETIREMENT SYSTEMLAST TWO FISCAL YEARS
118

EXHIBIT L-3
2015 2014
District's proportion of the net pension liability(asset) 0.13636% 0.13568%
State's proportionate share of the netpension liability (asset) associated with the District 72,882,396$ 68,571,504$
District's covered-employee payroll 14,140,016$ 13,833,389$
District's proportionate share of the netpension liability (asset) as a percentage of itscovered-employee payroll 0.00% 0.00%
Plan fiduciary net position as a percentage ofthe total pension liability 33.64% 33.76%
CLEARVIEW REGIONAL HIGH SCHOOL DISTRICTSCHEDULE OF THE DISTRICT'S PROPORTIONATE SHARE OF THE NET PENSION LIABILITY
TEACHERS' PENSION AND ANNUITY FUNDLAST TWO FISCAL YEARS
**This schedule is presented to illustrate the requirement to show information for 10 years. However, until a full 10-year trend is compiled, governments should present information for those years for which information is
119

This page intentionally left blank
120

NOTES TO REQUIRED SUPPLEMENTARY INFORMATION - PART III
121

This page intentionally left blank
122

CLEARVIEW REGIONAL HIGH SCHOOL DISTRICT NOTES TO THE REQUIRED SUPPLEMENTARY INFORMATION
JUNE 30, 2015 Teachers Pension and Annuity Fund (TPAF) Changes of benefit terms. The vesting and benefit provisions are set by N.J.S.A. 18A:66. TPAF provides retirement, death and disability benefits. All benefits vest after ten years of service, except for medical benefits, which vest after 25 years of service or under the disability provisions of TPAF. Members are always fully vested for their own contributions and, after three years of service credit, become vested for 2% of related interest earned on the contributions. In the case of death before retirement, members’ beneficiaries are entitled to full interest credited to the members’ accounts. Changes of assumptions. Mortality rates were based on the RP-2000 Health Annuitant Mortality Table for Males or Females, as appropriate, with adjustments for mortality improvements based on Scale AA. Pre-retirement mortality improvements for active members are projected using Scale AA from the base year of 2000 until the valuation date plus 15 years to account for future mortality improvement. Post-retirement mortality improvements for non-disabled annuitants are projected using Scale AA from the base year of 2000 for males and 2003 for females until the valuation date plus 7 years to account for future mortality improvement. Public Employees' Retirement System (PERS) Changes of benefit terms. The vesting and benefit provisions are set by N.J.S.A. 43:15A. PERS provides retirement, death and disability benefits. All benefits vest after ten years of service, except for medical benefits, which vest after 25 years of service or under the disability provisions of PERS. Changes of assumptions. Mortality rates were based on the RP-2000 Combined Healthy Male and Female Mortality Tables (setback 1 year for females) with adjustments for mortality improvements from the base year of 2012 Based on Projection Scale AA.
123

This page intentionally left blank
124

OTHER SUPPLEMENTARY INFORMATION
125

This page intentionally left blank
126

D. School Based Budget Schedules
Not Applicable
127

This page intentionally left blank
128

E. Special Revenue Fund
129

This page intentionally left blank
130

EXHIBIT E-1(Page 1 of 4)
AUXILIARYAUXILIARY SERVICES
NONPUBLIC SERVICES NONPUBLIC NONPUBLIC NONPUBLICNURSING NONPUBLIC SUPPLEMENTAL COMPENSATORY EXAM &SERVICES TRANSPORTATION INSTRUCTION EDUCATIOIN CLASSIFICATION
Revenues: State Sources 22,384$ 1,695$ 4,787$ 11,287$ 7,566$
Total Revenues 22,384$ 1,695$ 4,787$ 11,287$ 7,566$
Expenditures: Support Services: Purchased Professional Services 22,384$ -$ -$ -$ -$ Other Purchased Services - 1,695 4,787 11,287 7,566
Total Support Services 22,384 1,695 4,787 11,287 7,566
Total Expenditures 22,384$ 1,695$ 4,787$ 11,287$ 7,566$
CLEARVIEW REGIONAL HIGH SCHOOL DISTRICTSPECIAL REVENUE FUND
COMBINING SCHEDULE OF REVENUES AND EXPENDITURES - BUDGETARY BASISFOR FISCAL YEAR ENDED JUNE 30, 2015
131

EXHIBIT E-1(Page 2 of 4)
TITLE II -TITLE II - PART APART A TEACHER &
TEACHER & PRINCIPALTITLE I - PRINCIPAL TRAINING &
TITLE I PART A TRAINING & RECRUITINGPART A CARRYOVER RECRUITING CARRYOVER
Revenues: Federal Sources 73,469$ 5,015$ 19,689$ 1,593$
Total Revenues 73,469$ 5,015$ 19,689$ 1,593$
Expenditures: Instruction: Salaries of Teachers 31,000$ -$ -$ -$ General Supplies 12,338 5,015 - -
Total Instruction 43,338 5,015 - -
Support Services: Salaries 20,054 - 10,585 1,480 Employee Benefits 9,244 - 809 113 Purchased Professional Services - - 5,000 - Other Purchased Services - - 3,295 - Supplies & Materials 833 - - - Other Objects - - - -
Total Support Services 30,131 - 19,689 1,593
Total Expenditures 73,469$ 5,015$ 19,689$ 1,593$
CLEARVIEW REGIONAL HIGH SCHOOL DISTRICTSPECIAL REVENUE FUND
COMBINING SCHEDULE OF REVENUES AND EXPENDITURES - BUDGETARY BASISFOR FISCAL YEAR ENDED JUNE 30, 2015
132

EXHIBIT E-1(Page 3 of 4)
I.D.E.A.PART B I.D.E.A. -BASIC PART B CARL D. NJ
REGULAR BASIC PERKINS NJSBAIG ACHIEVEMENTPROGRAM CARRYOVER SECONDARY SAFETY GRANT GRANT
Revenues: Federal Sources 456,502$ 41,913$ 46,766$ -$ -$ State Sources - - - - 23,219 Local Sources - - - 9,925 -
Total Revenues 456,502$ 41,913$ 46,766$ 9,925$ 23,219$
Expenditures: Instruction: Salaries of Teachers 4,700$ -$ -$ -$ 1,265$ Purchased Professional/ Technical Services - 6,417 2,296 - - Other Purchased Services 326,080 10,301 - - - General Supplies 9,727 3,025 16,088 Other Objects 3,970 777 - - -
Total Instruction 344,477 20,520 18,384 - 1,265
Support Services: Salaries - - - - 20,436 Salaries - Other Professional Staff 4,648 14,160 - - - Salaries - Secretarial & Clerical 41,734 - - - - Employee Benefits 3,919 1,083 - - 1,518 Purchased Professional Services 35,697 6,150 - - - Other Purchased Services 2,655 - - - - Travel - - - - - Supplies & Materials 11,770 - - - -
Total Support Services 100,423 21,393 - - 21,954
Facilities Acquisition & Construction Services: Instructional Equipment 11,602 - 28,382 9,925 -
Total Facilities Acquisition & Construction Services 11,602 - 28,382 9,925 -
Total Expenditures 456,502$ 41,913$ 46,766$ 9,925$ 23,219$
CLEARVIEW REGIONAL HIGH SCHOOL DISTRICTSPECIAL REVENUE FUND
COMBINING SCHEDULE OF REVENUES AND EXPENDITURES - BUDGETARY BASISFOR FISCAL YEAR ENDED JUNE 30, 2015
133

EXHIBIT E-1(Page 4 of 4)
NONPUBLICNONPUBLIC NONPUBLIC HOME DREXELTEXTBOOKS TECHNOLOGY INSTRUCTION GRANT 2015
Revenues: State Sources 3,619$ 7,351$ 1,760$ -$ 83,668$ Federal Sources - - - - 647,587 Local Sources - - - 380 10,305
Total Revenues 3,619$ 7,351$ 1,760$ 380$ 741,560$
Expenditures: Instruction: Salaries of Teachers -$ -$ -$ -$ 36,965$ Purchased Professional / Technical Services - - - - 8,713 Other Purchased Services - - - - 336,381 General Supplies - - - - 46,193 Textbooks 3,619 - - 380 3,999 Other Objects - - - - 4,747
Total Instruction 3,619 - - 380 436,998
Support Services: Salaries - - - - 54,470 Salaries - Other Professional Staff - - - - 18,808 Salaries - Secretarial & Clerical - - - - 41,734 Employee Benefits - - - - 16,832 Purchased Professional Services - - - - 69,789 Purchased Professional / Technical Services - - - - - Other Purchased Services - 7,351 1,760 - 40,396 Travel - - - - - Supplies & Materials - - - - 12,624
Total Support Services - 7,351 1,760 - 254,653
Facilities Acquisition & Construction Services: Instructional Equipment - - - - 49,909
Total Facilities Acquisition & Construction Services - - - - 49,909
Total Expenditures 3,619$ 7,351$ 1,760$ 380$ 741,560$
CLEARVIEW REGIONAL HIGH SCHOOL DISTRICTSPECIAL REVENUE FUND
COMBINING SCHEDULE OF REVENUES AND EXPENDITURES - BUDGETARY BASISFOR FISCAL YEAR ENDED JUNE 30, 2015
134

F. Capital Projects Fund
135

This page intentionally left blank
136

EXH
IBIT
F-1
UN
EXPE
ND
EDO
RIG
INA
LPR
IOR
CU
RR
ENT
TRA
NSF
ER T
OTR
AN
SFER
TO
BA
LAN
CE
PRO
JEC
T TI
TLE
DA
TEA
PPR
OPR
IATI
ON
SY
EAR
YEA
RD
EBT
SER
VIC
EG
ENER
AL
FUN
DJU
NE
30, 2
015
Ath
letic
Fie
lds
P
hase
II07
/01/
121,
025,
000
886,
579
$
-
$
80,0
00$
-$
58
,421
$
T
otal
886,
579
$
-
$
80,0
00$
-$
58
,421
$
CL
EA
RV
IEW
RE
GIO
NA
L H
IGH
SC
HO
OL
DIS
TR
ICT
SUM
MA
RY
SC
HE
DU
LE
OF
PRO
JEC
T E
XPE
ND
ITU
RE
SFO
R F
ISC
AL
YE
AR
EN
DE
D J
UN
E 3
0, 2
015
EXPE
ND
ITU
RES
137

EXHIBIT F-2
Expenditures & Other Financing Uses:Other Financing Sources/(Uses): Transfer to Debt Service (80,000)$
Total Other Financing Sources/(Uses) (80,000)
Total Expenditures & Other Financing Sources/(Uses) 80,000
Excess/(Deficiency) of Revenues Over/(Under) Expenditures (80,000)Fund Balance - Beginning 138,421
Fund Balance - Ending 58,421$
YEAR ENDED JUNE 30, 2015
CLEARVIEW REGIONAL HIGH SCHOOL DISTRICTCAPITAL PROJECTS FUND
SUMMARY SCHEDULE OF REVENUES, EXPENDITURES AND CHANGES INFUND BALANCE-BUDGETARY BASIS
138

EXHIBIT F-2a
REVISEDPRIOR CURRENT AUTHORIZED
PERIODS YEAR TOTALS COSTRevenues & Other Financing Sources: Bond Proceeds & Transfers 1,025,000$ -$ 1,025,000$ 1,025,000$
Total Revenues 1,025,000 - 1,025,000 1,025,000
Expenditures & Other Financing Uses: Construction Services 857,991 - 857,991 996,412 Supplies 1,675 - 1,675 1,675 Equipment 26,913 - 26,913 26,913 Transfer ot Debt Service - 80,000 80,000 -
Total Expenditures 886,579 80,000 966,579 1,025,000
Excess/(Deficiency) of Revenues Over/ (Under) Expenditures 138,421$ (80,000)$ 58,421$ -$
Project Number 0870-020-12-1000 Grant Date N/A Bond Authorization Date N/A Bonds Authorized N/A Bonds Issued N/A Original Authorized Cost $1,025,000 Additional Authorized Cost - Revised Authorized Cost 1,025,000
Percentage Increase Over Original Authorized Cost N/A Percentage Completion 86.50% Original Target Completion Date May 2013 Revised Target Completion Date
ADDITIONAL PROJECT INFORMATION
CLEARVIEW REGIONAL HIGH SCHOOL DISTRICTCAPITAL PROJECTS FUND
SCHEDULE OF REVENUES, EXPENDITURES, PROJECT BALANCE ANDPROJECT STATUS - BUDGETARY BASIS
ATHLETIC FIELDS PHASE IIYEAR ENDED JUNE 30, 2015
139

This page intentionally left blank
140

G. Proprietary Funds
141

This page intentionally left blank
142

Enterprise Funds
143

This page intentionally left blank
144

EXHIBIT G-1
FOODSERVICE SUMMER SCHOOL LITTLE
ASSETS FUND CAMPS STORE PIONEERS 2015
Current Assets: Cash & Cash Equivalents 245,830$ 16,549$ 46,275$ 27,321$ 335,975$ Accounts Receivable: State 365 - - - 365 Federal 5,864 - - - 5,864 Other 1,780 - - - 1,780 Interfund Receivable - - - 83 83 Inventory 3,484 - 19,915 - 23,399
Total Current Assets 257,323 16,549 66,190 27,404 367,466
Noncurrent Assets: Furniture, Machinery & Equipment 305,844 - - - 305,844 Less: Accumulated Depreciation (295,978) - - - (295,978)
Total Noncurrent Assets 9,866 - - - 9,866
Total Assets 267,189 16,549 66,190 27,404 377,332
LIABILITIES
Current Liabilities: Accounts Payable 104 805 - 272 1,181 Unearned Revenue 14,338 5,325 - - 19,663 Interfund Payable 65,310 - - - 65,310
Total Current Liabilities 79,752 6,130 - 272 86,154
Noncurrent Liabilities: Compensated Absences 60,237 - - - 60,237
Total Noncurrent Liabilities 60,237 - - - 60,237
Total Liabilities 139,989 6,130 - 272 146,391
NET POSITION
Net Investments in Capital Assets 9,866 - - - 9,866 Unrestricted 117,334 10,419 66,190 27,132 221,075
Total Net Position 127,200$ 10,419$ 66,190$ 27,132$ 230,941$
BUSINESS-TYPE ACTIVITIES
CLEARVIEW REGIONAL HIGH SCHOOL DISTRICTENTERPRISE FUND
COMBINING SCHEDULE OF NET POSITIONAS OF JUNE 30, 2015
145

EXHIBIT G-2
FOODSERVICE SUMMER SCHOOL LITTLE
FUND CAMPS STORE PIONEERS 2015
Local Sources: Daily Sales - Reimbursable Programs 238,264$ -$ -$ -$ 238,264$ Daily Sales Nonreimbursable Programs 362,080 - - - 362,080 Special Functions 12,456 - - - 12,456 Miscellaneous 800 6,568 25,119 23,142 55,629
Total Operating Revenue 613,600 6,568 25,119 23,142 668,429
Operating Expenses: Salaries 456,755 1,075 3,000 38,630 499,460 Employee Benefits 230,097 - 230 3,072 233,399 Supplies and Materials 39,523 - - 4,823 44,346 Other Purchased Services 10,511 - - - 10,511 Depreciation 2,147 - - - 2,147 Miscellaneous - - - - - Cost of Sales 287,711 - 12,378 - 300,089
Total Operating Expenses 1,026,744 1,075 15,608 46,525 1,089,952
Operating/(Loss)/Gain (413,144) 5,493 9,511 (23,383) (421,523)
Nonoperating Revenues/(Expenses): State Sources: State School Lunch Program 4,865 - - - 4,865 Federal Sources: National School Lunch Program 119,442 - - - 119,442 Food Distribution Program 33,539 - - - 33,539 Interest & Investment Revenue 525 - - - 525 Board Contribution 194,517 - - - 194,517 Capital Asset Adjustment 7,546 - - - 7,546
Total Nonoperating Revenues/ (Expenses) 360,434 - - - 360,434
Net Income/(Loss) (52,710) 5,493 9,511 (23,383) (61,089) Net Position - Beginning, 179,910 4,926 56,679 50,515 292,030
Total Net Position - Ending 127,200$ 10,419$ 66,190$ 27,132$ 230,941$
CHANGES IN FUND NET POSITIONAS OF JUNE 30, 2015
BUSINESS-TYPE ACTIVITIES
CLEARVIEW REGIONAL HIGH SCHOOL DISTRICTENTERPRISE FUND
COMBINING SCHEDULE OF REVENUES, EXPENSES AND
146
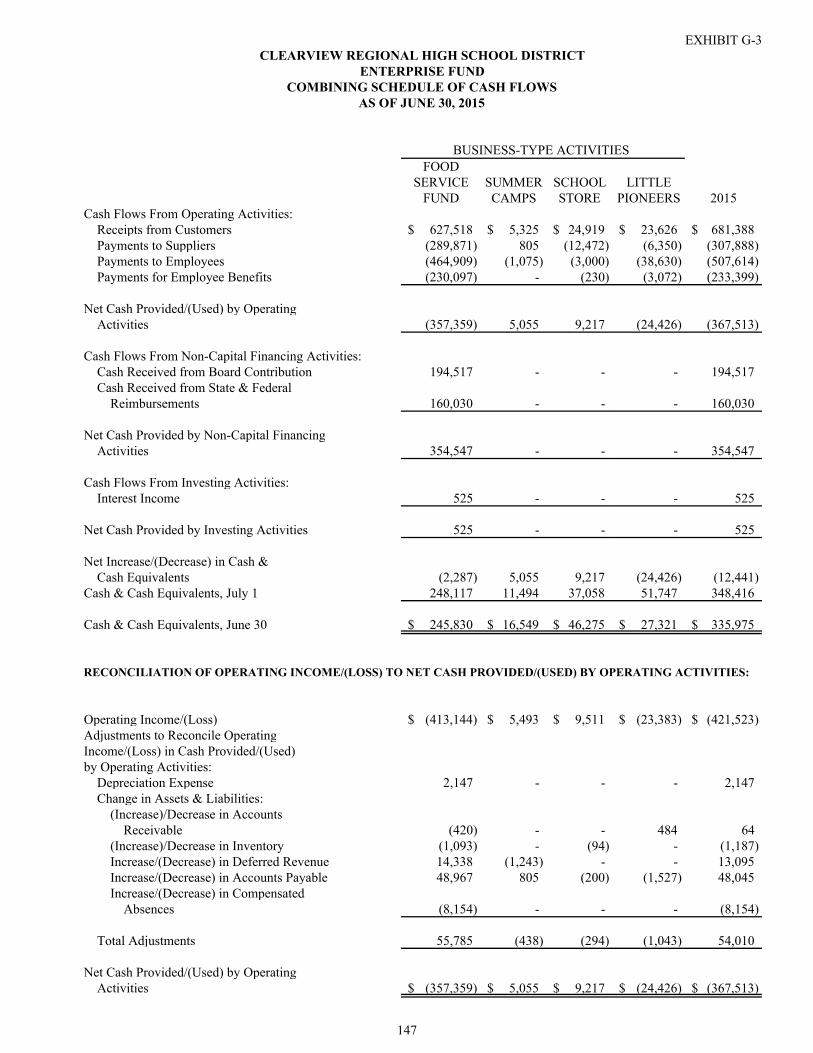
EXHIBIT G-3
FOODSERVICE SUMMER SCHOOL LITTLE
FUND CAMPS STORE PIONEERS 2015Cash Flows From Operating Activities: Receipts from Customers 627,518$ 5,325$ 24,919$ 23,626$ 681,388$ Payments to Suppliers (289,871) 805 (12,472) (6,350) (307,888) Payments to Employees (464,909) (1,075) (3,000) (38,630) (507,614) Payments for Employee Benefits (230,097) - (230) (3,072) (233,399)
Net Cash Provided/(Used) by Operating Activities (357,359) 5,055 9,217 (24,426) (367,513)
Cash Flows From Non-Capital Financing Activities: Cash Received from Board Contribution 194,517 - - - 194,517 Cash Received from State & Federal Reimbursements 160,030 - - - 160,030
Net Cash Provided by Non-Capital Financing Activities 354,547 - - - 354,547
Cash Flows From Investing Activities: Interest Income 525 - - - 525
Net Cash Provided by Investing Activities 525 - - - 525
Net Increase/(Decrease) in Cash & Cash Equivalents (2,287) 5,055 9,217 (24,426) (12,441) Cash & Cash Equivalents, July 1 248,117 11,494 37,058 51,747 348,416
Cash & Cash Equivalents, June 30 245,830$ 16,549$ 46,275$ 27,321$ 335,975$
RECONCILIATION OF OPERATING INCOME/(LOSS) TO NET CASH PROVIDED/(USED) BY OPERATING ACTIVITIES:
Operating Income/(Loss) (413,144)$ 5,493$ 9,511$ (23,383)$ (421,523)$ Adjustments to Reconcile OperatingIncome/(Loss) in Cash Provided/(Used)by Operating Activities: Depreciation Expense 2,147 - - - 2,147 Change in Assets & Liabilities: (Increase)/Decrease in Accounts Receivable (420) - - 484 64 (Increase)/Decrease in Inventory (1,093) - (94) - (1,187) Increase/(Decrease) in Deferred Revenue 14,338 (1,243) - - 13,095 Increase/(Decrease) in Accounts Payable 48,967 805 (200) (1,527) 48,045 Increase/(Decrease) in Compensated Absences (8,154) - - - (8,154)
Total Adjustments 55,785 (438) (294) (1,043) 54,010
Net Cash Provided/(Used) by Operating Activities (357,359)$ 5,055$ 9,217$ (24,426)$ (367,513)$
AS OF JUNE 30, 2015
BUSINESS-TYPE ACTIVITIES
CLEARVIEW REGIONAL HIGH SCHOOL DISTRICTENTERPRISE FUND
COMBINING SCHEDULE OF CASH FLOWS
147

This page intentionally left blank
148

Internal Service Fund
149

This page intentionally left blank
150

EXHIBIT G-4
GOVERNMENTALACTIVITIES
TRANSPORTATIONASSETS CONSORTIUM 2015
Current Assets: Receivables from Other Governments 298,151$ 298,151$
Total Assets 298,151 298,151
LIABILITIES
Cash Overdraft 271,630 271,630 Accounts Payable 26,521 26,521
Total Liabilities 298,151 298,151
NET POSITION
Unrestricted - - Total Net Position -$ -$
CLEARVIEW REGIONAL HIGH SCHOOL DISTRICTINTERNAL SERVICE FUND
COMBINING STATEMENT OF NET POSITIONAS OF JUNE 30, 2015
151

EXHIBIT G-5
GOVERNMENTALACTIVITIES
TRANSPORTATIONCONSORTIUM 2015
OPERATING REVENUES: Local Sources: Transportation Fees 952,617$ 952,617$
Total Operating Revenue 952,617 952,617
OPERATING EXPENSES: Salaries 464,595 464,595 Aid in Lieu 61,382 61,382 Contracted Services (Between Home & School) - Vendors 64,323 64,323 Contracted Services (Special Education Students) - Joint Agreements 18,461 18,461 Other Purchased Services 22,118 22,118 Cleaning, Repair & Maintenance Services 84,017 84,017 Supplies & Materials 119,400 119,400 Miscellaneous Expenditures 521 521 Benefits 139,688 139,688 Total Operating Expenses 974,505 974,505
Net Income/(Loss) (21,888) (21,888) Total Net Position - July 1 21,888 21,888
Total Net Position - June 30 -$ -$
AS OF JUNE 30, 2015
CLEARVIEW REGIONAL HIGH SCHOOL DISTRICTINTERNAL SERVICE FUND
COMBINING STATEMENT OF REVENUES, EXPENSES AND CHANGES IN FUND NET POSITION
152

EXHIBIT G-6
GOVERNMENTALACTIVITIES
TRANSPORTATIONCONSORTIUM 2015
Cash Flows From Operating Activities: Receipts from Customers 863,928$ 863,928$ Payments to Suppliers (370,222) (370,222) Payments to Employees (455,377) (455,377) Payments for Employee Benefits (139,688) (139,688)
Net Cash Provided/(Used) by Operating Activities (101,359) (101,359)
Net Increase/(Decrease) in Cash & Cash Equivalents (101,359) (101,359) Cash & Cash Equivalents, July 1 (170,271) (170,271)
Cash & Cash Equivalents, June 30 (271,630)$ (271,630)$
RECONCILIATION OF OPERATING INCOME/(LOSS) TO NET CASH PROVIDED/(USED) BY OPERATING ACTIVITIES
Reconciliation of Operating Income (Loss) (21,888)$ (21,888)$ to Cash Provided/(Used) by Operating Activities: Operating Income (Loss)Adjustments to Reconcile OperatingIncome/(Loss) in Cash Provided/(Used)by Operating Activities: Change in Assets & Liabilities: (Increase)/Decrease in Accounts Receivable (88,689) (88,689) Increase/(Decrease) in Accounts Payable 9,218 9,218
Total Adjustments (79,471) (79,471)
Net Cash Provided/(Used) by Operating Activities (101,359)$ (101,359)$
CLEARVIEW REGIONAL HIGH SCHOOL DISTRICTINTERNAL SERVICE FUND
COMBINING STATEMENT OF CASH FLOWSAS OF JUNE 30, 2015
153

This page intentionally left blank
154

H. Fiduciary Fund
155

This page intentionally left blank
156
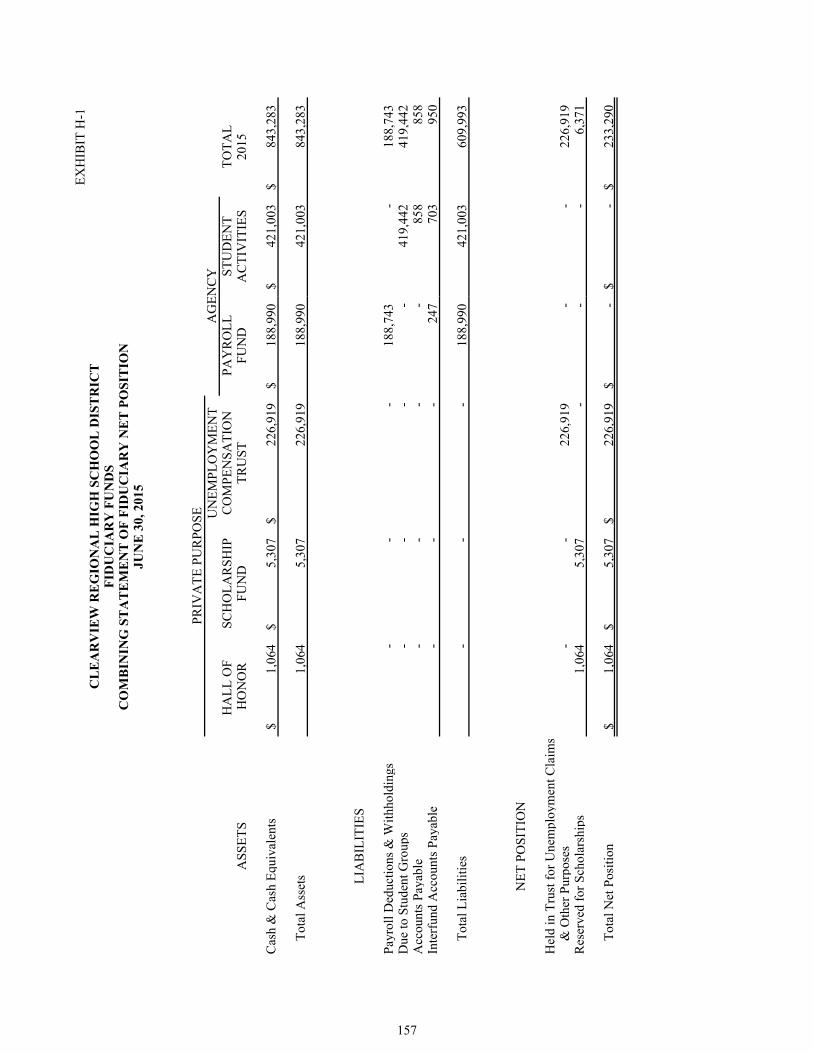
EXH
IBIT
H-1
UN
EMPL
OY
MEN
TH
ALL
OF
SCH
OLA
RSH
IPC
OM
PEN
SATI
ON
PAY
RO
LLST
UD
ENT
TOTA
LA
SSET
SH
ON
OR
FUN
DTR
UST
FUN
DA
CTI
VIT
IES
2015
Cas
h &
Cas
h E q
uiva
lent
s1,
064
$
5,30
7$
22
6,91
9$
18
8,99
0$
42
1,00
3$
84
3,28
3$
T
otal
Ass
ets
1,06
4
5,
307
226,
919
188,
990
421,
003
843,
283
LIA
BIL
ITIE
S
Payr
oll D
educ
tions
& W
ithho
ldin
gs-
-
-
18
8,74
3
-
188,
743
Due
to S
tude
nt G
rou p
s-
-
-
-
419,
442
419,
442
Acc
ount
s Pa y
able
-
-
-
-
85
8
85
8
In
terf
und
Acc
ount
s Pa y
able
-
-
-
247
703
950
T
otal
Lia
bilit
ies
-
-
-
188,
990
421,
003
609,
993
NET
PO
SITI
ON
Hel
d in
Tru
st fo
r Une
mpl
oym
ent C
laim
s
& O
ther
Pur
pose
s-
-
226,
919
-
-
226,
919
Res
erve
d fo
r Sch
olar
shi p
s1,
064
5,30
7
-
-
-
6,37
1
T
otal
Net
Pos
ition
1,06
4$
5,
307
$
226,
919
$
-$
-
$
233,
290
$
CL
EA
RV
IEW
RE
GIO
NA
L H
IGH
SC
HO
OL
DIS
TR
ICT
FID
UC
IAR
Y F
UN
DS
CO
MB
ININ
G S
TA
TE
ME
NT
OF
FID
UC
IAR
Y N
ET
PO
SIT
ION
JUN
E 3
0, 2
015
PRIV
ATE
PU
RPO
SEA
GEN
CY
157

EXHIBIT H-2
UNEMPLOYMENTHALL OF SCHOLARSHIP COMPENSATION TOTAL
ADDITIONS: HONOR FUND TRUST 2015
Contributions: Plan Member -$ -$ 33,428$ 33,428$ Other - 1,410 - 1,410
Total Contributions - 1,410 33,428 34,838
Investment Earnings: Interest - 25 449 474
Total Additions - 1,435 33,877 35,312
DEDUCTIONS:
Unemployment Claims - - 25,838 25,838 Scholarship Payments - 4,380 - 4,380
Total Deductions - 4,380 25,838 30,218
Change in Net Position - (2,945) 8,039 5,094 Net Position - Beginning 1,064 8,252 218,880 228,196
Net Position - End 1,064$ 5,307$ 226,919$ 233,290$
COMBINING STATEMENT CHANGES IN FIDUCIARY NET POSITIONJUNE 30, 2015
PRIVATE PURPOSE
CLEARVIEW REGIONAL HIGH SCHOOL DISTRICTFIDUCIARY FUNDS
158

EXHIBIT H-3
BALANCE BALANCEJULY 1, CASH CASH JUNE 30,
2014 RECEIPTS DISBURSEMENTS 2015ASSETS
Middle School 59,745$ 82,310$ 97,085$ 44,970$ High School 357,339 896,606 888,040 365,905Athletics 10,217 67,965 68,054 10,128
Total Assets 427,301$ 1,046,881$ 1,053,179$ 421,003$
EXHIBIT H-4
BALANCE BALANCEJULY 1, JUNE 30,
ASSETS 2014 ADDITIONS DELETIONS 2015
Cash & Cash Equivalents 253,672$ 27,005,937$ 27,070,619$ 188,990$ Interfunds Receivable - - - -
Total Assets 253,672$ 27,005,937$ 27,070,619$ 188,990$
LIABILITIES
Net Payroll Deductions & Withholdings 248,907$ 27,003,609$ 27,063,773$ 188,743$ Academic Banquet - - - - Interfunds Payable 4,765 2,328 6,846 247
Total Liabilities 253,672$ 27,005,937$ 27,070,619$ 188,990$
PAYROLL AGENCY FUNDSCHEDULE OF RECEIPTS AND DISBURSEMENTS
FOR FISCAL YEAR ENDED JUNE 30, 2015
CLEARVIEW REGIONAL HIGH SCHOOL DISTRICTSTUDENT ACTIVITY AGENCY FUND
SCHEDULE OF RECEIPTS AND DISBURSEMENTSFOR FISCAL YEAR ENDED JUNE 30, 2015
159

This page intentionally left blank
160

I. Long-Term Debt
161

This page intentionally left blank
162
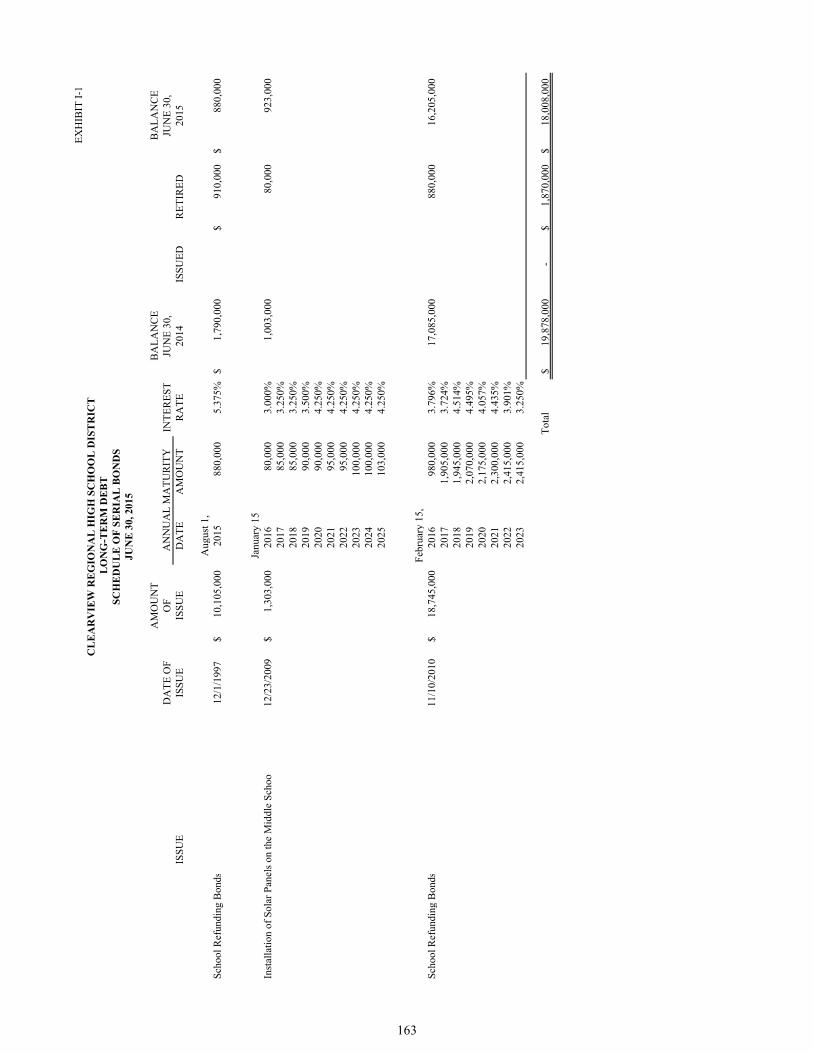
EXH
IBIT
I-1
AM
OU
NT
BA
LAN
CE
BA
LAN
CE
DA
TE O
FO
FIN
TER
EST
JUN
E 30
,JU
NE
30,
ISSU
EIS
SUE
ISSU
ED
ATE
AM
OU
NT
RA
TE20
14IS
SUED
RET
IRED
2015
Aug
ust 1
,Sc
hool
Ref
undi
ng B
onds
12/1
/199
710
,105
,000
$
20
1588
0,00
05.
375%
1,79
0,00
0$
91
0,00
0$
88
0,00
0$
Janu
ary
15In
stal
latio
n of
Sol
ar P
anel
s on
the
Mid
dle
Scho
ol12
/23/
2009
1,30
3,00
0$
20
1680
,000
3.00
0%1,
003,
000
80,0
00
92
3,00
0
2017
85,0
003.
250%
2018
85,0
003.
250%
2019
90,0
003.
500%
2020
90,0
004.
250%
2021
95,0
004.
250%
2022
95,0
004.
250%
2023
100,
000
4.25
0%20
2410
0,00
04.
250%
2025
103,
000
4.25
0%
Febr
uary
15,
Scho
ol R
efun
ding
Bon
ds11
/10/
2010
18,7
45,0
00$
2016
980,
000
3.79
6%17
,085
,000
88
0,00
0
16
,205
,000
20
171,
905,
000
3.72
4%20
181,
945,
000
4.51
4%20
192,
070,
000
4.49
5%20
202,
175,
000
4.05
7%20
212,
300,
000
4.43
5%20
222,
415,
000
3.90
1%20
232,
415,
000
3.25
0%
Tota
l19
,878
,000
$
-1,
870,
000
$
18
,008
,000
$
AN
NU
AL
MA
TUR
ITY
CL
EA
RV
IEW
RE
GIO
NA
L H
IGH
SC
HO
OL
DIS
TR
ICT
LO
NG
-TE
RM
DE
BT
SCH
ED
UL
E O
F SE
RIA
L B
ON
DS
JUN
E 3
0, 2
015
163

EXHIBIT I-3
POSITIVE/NEGATIVE
ORIGINAL BUDGET FINAL FINAL TOBUDGET TRANSFERS BUDGET ACTUAL ACTUAL
Revenues: Local Sources: Local Tax Levy 2,110,817$ -$ 2,110,817$ 2,110,817$ -$ Miscellaneous 80,000 - 80,000 80,000 - State Sources: Debt Service Aid Type II 475,946 - 475,946 475,946 -
Total Revenues 2,666,763 - 2,666,763 2,666,763 -
Expenditures: Regular Debt Service: Interest 796,765 - 796,765 796,765 - Principal 1,870,000 - 1,870,000 1,870,000 -
Total Expenditures 2,666,765 - 2,666,765 2,666,765 -
Excess/(Deficiency) of Revenues Over/(Under) Expenditures (2) - (2) (2) -
Fund Balance, July 1 2 - 2 2 -
Fund Balance, June 30 -$ -$ -$ -$ -$
CLEARVIEW REGIONAL HIGH SCHOOL DISTRICTDEBT SERVICE FUND
BUDGETARY COMPARISON SCHEDULEFOR THE FISCAL YEAR ENDED JUNE 30, 2015
JUNE 30, 2015
164

EXHIBIT I-4
OUTSTANDING OUTSTANDINGBALANCE BALANCE
2014 ADDITIONS DELETIONS 2015
Governmental Compensated Absences 1,012,987$ 23,586$ -$ 1,036,573$ Business-Type Compensated Absences 68,391 - (8,154) 60,237
Total Compensated Absences 1,081,378$ 23,586$ (8,154)$ 1,096,810$
CLEARVIEW REGIONAL HIGH SCHOOL DISTRICTLONG-TERM DEBT
SCHEDULE OF COMPENSATED ABSENCESJUNE 30, 2015
165

This page intentionally left blank
166

STATISTICAL SECTION (Unaudited)
167

This page intentionally left blank
168

EXH
IBIT
J-1
2015
2014
2013
2012
2011
2010
2009
2008
2007
2006
Gov
ernm
enta
l Act
iviti
es:
N
et In
vest
men
t in,
Cap
ital A
sset
s25
,823
,501
$
25,2
59,5
87$
25
,182
,966
$
24,1
07,1
26$
23
,014
,071
$
20,7
78,0
36$
20
,055
,146
$
19,2
01,3
38$
18
,703
,670
$
18,3
86,9
53$
Res
trict
ed5,
269,
841
4,82
9,64
84,
457,
608
4,68
0,04
02,
725,
737
2,89
0,24
05,
198,
085
2,22
8,32
81,
885,
766
1,64
1,78
5
Unr
estri
cted
(12,
750,
127)
(1,9
03,0
72)
(1,6
56,7
26)
(1,2
42,4
22)
15,5
34(1
,612
,410
)(3
,571
,905
)(1
,082
,671
)(2
56,7
26)
(504
,987
)
Tota
l Gov
ernm
enta
l Act
iviti
es
Net
Pos
ition
18,3
43,2
15$
28
,186
,163
$
27,9
83,8
48$
27
,544
,744
$
25,7
55,3
42$
22
,055
,866
$
21,6
81,3
26$
20
,346
,995
$
20,3
32,7
10$
19
,523
,751
$
Bus
ines
s-Ty
pe A
ctiv
ities
:
Net
Inve
stm
ent i
n,
C
apita
l Ass
ets
9,86
6$
4,46
7$
4,47
5$
6,91
3$
9,35
1$
-$
23
,418
$
38,9
39$
54,7
70$
70
,629
$
U
nres
trict
ed22
1,07
528
7,56
327
1,62
724
4,31
928
0,87
227
9,86
330
6,78
028
8,26
931
7,91
221
7,99
6
Tota
l Bus
ines
s-Ty
pe A
ctiv
ities
N
et P
ositi
on23
0,94
1$
29
2,03
0$
27
6,10
2$
25
1,23
2$
29
0,22
3$
27
9,86
3$
33
0,19
8$
32
7,20
8$
37
2,68
2$
28
8,62
5$
Dis
trict
-Wid
e:
Net
Inve
stm
ent i
n,
C
apita
l Ass
ets
25,8
33,3
67$
25
,264
,054
$
25,1
87,4
41$
24
,114
,039
$
23,0
23,4
22$
20
,778
,036
$
20,0
78,5
64$
19
,240
,277
$
18,7
58,4
40$
18
,457
,582
$
R
estri
cted
5,26
9,84
14,
829,
648
4,45
7,60
84,
680,
040
2,72
5,73
72,
890,
240
5,19
8,08
52,
228,
328
1,88
5,76
61,
641,
785
U
nres
trict
ed(1
2,52
9,05
2)(1
,615
,509
)(1
,385
,099
)(9
98,1
03)
296,
406
(1,3
32,5
47)
(3,2
65,1
25)
(794
,402
)61
,186
(286
,991
)
Tota
l Dis
trict
Net
Pos
ition
18,5
74,1
56$
28
,478
,193
$
28,2
59,9
50$
27
,795
,976
$
26,0
45,5
65$
22
,335
,729
$
22,0
11,5
24$
20
,674
,203
$
20,7
05,3
92$
19
,812
,376
$
FISC
AL
YEA
R E
ND
ING
JUN
E 30
,
CL
EA
RV
IEW
RE
GIO
NA
L H
IGH
SC
HO
OL
DIS
TR
ICT
NE
T P
OSI
TIO
N B
Y C
OM
PON
EN
TL
AST
TE
N F
ISC
AL
YE
AR
S(A
ccru
al B
asis
of
Acc
oun
tin
g)
169

EXH
IBIT
J-2
(Pag
e 1
of 3
)
2015
2014
2013
2012
2011
2010
2009
2008
2007
2006
Expe
nses
: G
over
nmen
tal A
ctiv
ities
In
struc
tion:
Reg
ular
10,5
45,7
51$
10,4
15,6
60$
10,3
96,5
48$
10,1
49,9
28$
9,91
5,99
7$
10,0
22,3
03$
9,72
4,63
2$
10,0
22,5
31$
8,91
8,94
6$
8,62
1,92
6$
Spe
cial
Edu
catio
n2,
857,
568
2,61
6,83
9
2,46
7,26
6
2,46
9,00
7
2,66
5,92
5
2,68
0,00
0
2,40
3,48
1
2,53
6,20
4
2,18
9,39
9
2,00
5,84
2
Oth
er S
peci
al In
struc
tion
-
-
-
-
-
-
-
-
-
20,7
64
Oth
er In
struc
tion
1,05
7,95
9
1,
036,
588
1,
043,
130
99
2,28
0
94
5,01
9
1,
040,
843
94
2,41
1
92
9,64
1
77
5,81
7
79
1,34
8
Sup
port
Serv
ices
:
T
uitio
n2,
843,
925
2,54
6,94
2
2,27
6,33
5
2,31
1,18
3
1,85
4,02
7
1,51
8,18
3
1,54
5,68
8
1,39
4,98
5
1,49
3,24
4
1,24
9,38
6
Stu
dent
& In
struc
tion
Rel
ated
Ser
vice
s2,
342,
772
2,47
9,14
5
2,33
9,32
2
2,15
6,42
1
2,00
8,69
8
2,08
1,12
2
1,98
3,24
6
2,32
2,90
5
2,10
8,72
3
2,20
1,65
2
Hea
lth S
ervi
ces
260,
174
25
0,42
6
24
3,16
4
22
7,52
7
22
2,49
2
21
0,69
4
19
0,89
0
-
-
-
Edu
catio
nal M
edia
Ser
vice
s/Sch
ool
Libr
ary
258,
308
25
7,70
3
25
6,45
7
24
8,43
9
23
7,33
4
25
2,29
9
24
6,98
8
-
-
-
Sch
ool A
dmin
istra
tive
Serv
ices
1,55
0,59
2
1,
440,
069
1,
380,
923
1,
347,
192
1,
344,
021
1,
384,
234
1,
396,
326
1,
281,
321
1,
224,
773
1,
195,
480
G
ener
al A
dmin
istra
tive
511,
964
51
8,84
5
51
8,65
7
60
9,31
3
48
0,87
0
51
3,15
4
53
5,25
5
54
7,61
7
50
8,47
3
44
7,20
3
C
entra
l Ser
vice
s37
8,77
9
380,
167
401,
679
360,
385
384,
884
385,
847
343,
512
318,
293
344,
542
302,
614
Adm
inist
rativ
e In
form
atio
n Te
chno
logy
451,
437
33
7,57
5
33
1,69
0
31
4,79
8
29
4,40
8
33
7,07
1
28
8,70
4
21
1,27
1
17
8,31
1
19
0,84
6
P
lant
Ope
ratio
ns &
Mai
nten
ance
2,70
1,35
4
2,
839,
811
2,
874,
443
2,
393,
098
2,
533,
372
3,
046,
405
2,
505,
800
3,
088,
083
2,
880,
766
2,
725,
302
P
upil
Tran
spor
tatio
n2,
720,
369
2,69
5,59
1
2,69
0,55
4
2,58
6,43
9
2,41
0,00
4
2,38
1,25
3
2,28
5,15
3
2,37
3,34
6
2,25
1,58
6
2,14
6,18
4
Em
ploy
ee B
enef
its11
,240
,782
8,
286,
479
8,
002,
781
6,
955,
585
6,
305,
315
6,
300,
479
6,
160,
832
6,
426,
994
6,
188,
658
5,
237,
119
S
peci
al S
choo
ls60
,908
72
,318
66
,383
85
,530
77
,868
85
,782
91
,834
69
,370
82
,704
11
1,46
4
A
djus
tmen
t to
Cap
ital A
sset
s-
-
(2,5
45)
(1
38,0
99)
(1,2
02,6
90)
88
5,56
3
15
,803
-
-
-
Int
eres
t on
Long
-Ter
m D
ebt
1,00
0,41
0
1,
071,
875
1,
049,
503
80
5,94
6
1,
397,
228
1,
218,
307
1,
266,
312
1,
351,
969
1,
404,
224
1,
450,
636
C
apita
l Out
lay
-
-
-
-
-
-
-
-
3,
490
67
,457
U
nallo
cate
d D
epre
ciat
ion
1,85
4,03
5
1,
870,
974
1,
855,
719
1,
823,
702
1,
812,
101
1,
847,
437
1,
463,
037
50
3,38
6
54
6,69
8
55
3,35
8
A
mor
tizat
ion
of D
ebt I
ssua
nce
Cos
ts-
-
20,1
78
20,1
77
20,1
77
38,6
78
38,6
77
-
-
-
R
educ
tion
of C
apita
l Lea
ses
-
-
-
-
(6
6,64
9)
(1
01,6
38)
(217
,634
)
-
-
-
Una
lloca
ted
Com
pens
ated
Abs
ence
s-
-
(18,
267)
25,3
09
(38,
973)
(40,
642)
(1
62,7
03)
-
-
-
T
otal
Gov
ernm
enta
l Act
iviti
es E
xpen
ses
42,6
37,0
87
39,1
17,0
07
38
,193
,920
35,7
44,1
60
33
,601
,428
36,0
87,3
74
33
,048
,244
33,3
77,9
16
31
,100
,354
29,3
18,5
81
Bus
ines
s-Ty
pe A
ctiv
ities
:
Foo
d Se
rvic
e1,
026,
744
865,
226
836,
903
891,
201
852,
813
920,
212
869,
871
919,
370
791,
018
808,
067
O
ther
Act
iviti
es63
,208
64
,683
73
,359
73
,791
80
,212
78
,507
91
,963
39
,851
28
,273
20
,139
Tota
l Bus
ines
s-Ty
pe A
ctiv
ities
Exp
ense
1,08
9,95
2
92
9,90
9
91
0,26
2
96
4,99
2
93
3,02
5
99
8,71
9
96
1,83
4
95
9,22
1
81
9,29
1
82
8,20
6
T
otal
Dist
rict E
xpen
ses
43,7
27,0
39$
40,0
46,9
16$
39,1
04,1
82$
36,7
09,1
52$
34,5
34,4
53$
37,0
86,0
93$
34,0
10,0
78$
34,3
37,1
37$
31,9
19,6
45$
30,1
46,7
87$
CL
EA
RV
IEW
RE
GIO
NA
L H
IGH
SC
HO
OL
DIS
TR
ICT
CH
AN
GE
S IN
NE
T P
OSI
TIO
N -
(AC
CR
UA
L B
ASI
S O
F A
CC
OU
NT
ING
)L
AST
TE
N F
ISC
AL
YE
AR
S
FISC
AL
YEA
R E
ND
ING
JUN
E 30
,
170

EXH
IBIT
J-2
(Pag
e 2
of 3
)
2015
2014
2013
2012
2011
2010
2009
2008
2007
2006
Prog
ram
Rev
enue
s: G
over
nmen
tal A
ctiv
ities
:
Cha
rges
for S
ervi
ces &
Ope
ratin
g G
rant
s
I
nstru
ctio
n (S
peci
al E
duca
tion)
436,
998
$
54
1,08
0$
49
5,43
0$
51
3,30
1$
68
3,17
7$
72
3,99
6$
442,
589
$
561,
416
$
377,
014
$
470,
982
$
Supp
ort S
ervi
ces:
Stu
dent
& In
struc
tion
& R
elat
ed S
ervi
ces
254,
653
28
6,60
4
26
5,41
8
20
3,47
3
20
6,59
4
28
3,75
1
22
2,62
6
22
7,28
9
20
8,91
7
20
5,25
1
P
upil
Tran
spor
tatio
n95
2,61
7
1,01
3,18
8
1,04
6,37
7
1,07
2,56
9
998,
489
921,
909
809,
862
788,
872
843,
111
785,
507
Em
ploy
ee B
enef
its6,
236,
389
169,
132
141,
811
133,
722
130,
394
129,
504
135,
262
156,
367
138,
583
130,
048
Int
eres
t on
Long
-Ter
m D
ebt
475,
946
50
0,11
7
52
2,11
3
54
5,63
7
56
9,69
9
63
3,75
9
60
6,18
5
-
-
-
Cap
ital O
utla
y-
-
-
-
-
-
-
-
-
50
,965
Tota
l Gov
ernm
enta
l Act
iviti
es P
rogr
am
Rev
enue
s8,
356,
603
2,51
0,12
1
2,47
1,14
9
2,46
8,70
2
2,58
8,35
3
2,69
2,91
9
2,21
6,52
4
1,73
3,94
4
1,56
7,62
5
1,64
2,75
3
Bus
ines
s-Ty
pe A
ctiv
ities
: C
harg
es fo
r Ser
vice
s:
F
ood
Serv
ice
613,
600
69
3,84
1
66
7,26
5
68
3,16
9
68
8,13
2
68
3,64
4
70
1,13
4
73
5,87
2
71
5,89
6
66
5,79
0
S
choo
l Sto
re54
,829
79
,368
97
,037
79
,794
10
0,86
0
92
,394
84
,255
38
,292
29
,790
25
,702
O
pera
ting
Gra
nts &
Con
tribu
tions
157,
846
16
9,41
5
17
0,01
6
16
0,51
8
14
9,49
6
16
5,28
5
14
1,56
1
12
4,08
6
11
7,12
2
10
4,30
8
Tota
l Bus
ines
s Typ
e A
ctiv
ities
Pro
gram
R
even
ues
826,
275
94
2,62
4
93
4,31
8
92
3,48
1
93
8,48
8
94
1,32
3
92
6,95
0
89
8,25
0
86
2,80
8
79
5,80
0
Tota
l Dist
rict P
rogr
am R
even
ues
9,18
2,87
8$
3,
452,
745
$
3,
405,
467
$
3,
392,
183
$
3,
526,
841
$
3,
634,
242
$
3,14
3,47
4$
2,63
2,19
4$
2,43
0,43
3$
2,43
8,55
3$
Net
/(Exp
ense
)/Rev
enue
:
Gov
ernm
enta
l Act
iviti
es(3
4,28
0,48
4)$
(36,
606,
886)
$
(35,
722,
771)
$
(33,
275,
458)
$
(31,
013,
075)
$
(33,
394,
455)
$
(30,
831,
720)
$
(31,
643,
972)
$
(29,
532,
729)
$
(27,
675,
828)
$
B
usin
ess-
Type
Act
iviti
es(2
63,6
77)
12,7
1524
,056
(41,
511)
5,46
3(5
7,39
6)(3
4,88
4)(6
0,97
1)43
,517
(32,
406)
T
otal
Dist
rict-W
ide
Net
Exp
ense
(34,
544,
161)
$
(3
6,59
4,17
1)$
(3
5,69
8,71
5)$
(3
3,31
6,96
9)$
(3
1,00
7,61
2)$
(3
3,45
1,85
1)$
(3
0,86
6,60
4)$
(3
1,70
4,94
3)$
(2
9,48
9,21
2)$
(2
7,70
8,23
4)$
LA
ST T
EN
FIS
CA
L Y
EA
RS
FISC
AL
YEA
R E
ND
ING
JUN
E 30
,
CL
EA
RV
IEW
RE
GIO
NA
L H
IGH
SC
HO
OL
DIS
TR
ICT
CH
AN
GE
S IN
NE
T P
OSI
TIO
N -
(AC
CR
UA
L B
ASI
S O
F A
CC
OU
NT
ING
)
171

EXH
IBIT
J-2
(Pag
e 3
of 3
)
2015
2014
2013
2012
2011
2010
2009
2008
2007
2006
Gen
eral
Rev
enue
s & O
ther
Cha
nges
in N
et P
ositi
on:
Gov
ernm
enta
l Act
iviti
es:
P
rope
rty T
axes
Lev
ied
for G
ener
al
P
urpo
ses,
Net
17,2
61,4
93$
16,5
77,5
79$
15,7
50,2
27$
15,4
41,3
99$
15,2
89,5
60$
14,7
01,5
00$
14,4
44,8
83$
14,0
36,4
26$
13,3
21,0
73$
11,7
74,9
79$
T
axes
Lev
ied
for D
ebt S
ervi
ce2,
110,
817
2,08
4,59
8
2,09
6,71
5
2,08
3,04
5
2,16
6,80
7
2,17
5,36
4
2,17
6,41
2
2,06
8,82
5
1,94
6,68
6
1,97
9,04
9
U
nres
trict
ed G
rant
s & C
ontri
butio
ns15
,298
,114
17
,685
,796
17,7
86,4
46
16
,915
,904
16,1
53,1
47
16
,182
,596
15,3
07,8
83
15
,084
,865
14,6
03,6
56
13
,708
,802
T
uitio
n R
ecei
ved
493,
235
36
7,14
6
28
5,69
8
16
9,24
3
18
5,41
1
13
8,00
2
17
1,44
4
14
5,05
7
12
4,38
9
74
,400
Tra
nspo
rtatio
n Fe
es-
-
-
-
-
-
-
-
10,6
37
25,5
11
In
vestm
ent E
arni
ngs
13,2
16
11,6
35
23,5
76
40,8
64
81,2
58
110,
040
75,7
69
133,
209
174,
665
133,
379
M
iscel
lane
ous I
ncom
e 22
7,12
3
238,
288
218,
504
415,
504
836,
528
611,
493
226,
205
197,
865
180,
008
350,
585
O
ther
-
-
-
-
-
-
-
(7,9
90)
-
-
Tra
nsfe
rs(1
94,5
17)
-
-
(1,0
99)
(1
60)
(150
,000
)
-
-
(1
9,42
6)
(3
7,05
0)
T
otal
Gov
ernm
enta
l
A
ctiv
ities
35,2
09,4
81
36,9
65,0
42
36
,161
,166
35,0
64,8
60
34
,712
,551
33,7
68,9
95
32
,402
,596
31,6
58,2
57
30
,341
,688
28,0
09,6
55
Bus
ines
s-Ty
pe A
ctiv
ities
:
Inve
stmen
t Ear
ning
s52
5
513
814
2,52
0
4,73
7
6,53
9
7,
371
15
,497
21
,114
13
,096
Cap
ital A
sset
Adj
ustm
ent
7,54
6
-
-
-
-
-
-
-
-
-
T
rans
fers
/Oth
er19
4,51
7
-
-
-
16
0
52
2
-
-
19,4
26
37,0
50
T
otal
Bus
ines
s-Ty
pe A
ctiv
ities
202,
588
51
3
81
4
2,
520
4,
897
7,
061
7,37
1
15,4
97
40,5
40
50,1
46
Tota
l Dist
rict-W
ide
35,4
12,0
69$
36,9
65,5
55$
36,1
61,9
80$
35,0
67,3
80$
34,7
17,4
48$
33,7
76,0
56$
32,4
09,9
67$
31,6
73,7
54$
30,3
82,2
28$
28,0
59,8
01$
Cha
nge
in N
et P
ositi
on:
G
over
nmen
tal A
ctiv
ities
928,
997
$
35
8,15
6$
43
9,10
4$
1,
789,
402
$
3,
699,
476
$
37
4,54
0$
1,57
0,87
6$
14,2
85$
808,
959
$
333,
827
$
B
usin
ess-
Type
Act
iviti
es(6
1,08
9)13
,228
24,8
70(3
8,99
1)10
,360
(50,
335)
(27,
513)
(45,
474)
84,0
5717
,740
T
otal
Dist
rict
867,
908
$
37
1,38
4$
46
3,97
4$
1,
750,
411
$
3,
709,
836
$
32
4,20
5$
1,54
3,36
3$
(31,
189)
$
89
3,01
6$
35
1,56
7$
CL
EA
RV
IEW
RE
GIO
NA
L H
IGH
SC
HO
OL
DIS
TR
ICT
CH
AN
GE
S IN
NE
T P
OSI
TIO
N -
(AC
CR
UA
L B
ASI
S O
F A
CC
OU
NT
ING
)L
AST
TE
N F
ISC
AL
YE
AR
S
FISC
AL
YEA
R E
ND
ING
JUN
E 30
,
172

EXH
IBIT
J-3
2015
2014
2013
2012
2011
2010
2009
2008
2007
2006
Gen
eral
Fun
d:
Res
trict
ed5,
211,
420
$
4,69
1,22
7$
1,
833,
600
$
4,85
1,55
6$
3,
491,
912
$
2,83
8,74
2$
3,
342,
513
$
2,08
7,35
3$
1,
877,
038
$
1,22
6,60
7$
Unr
estri
cted
(353
,017
)(3
54,9
32)
2,16
6,62
0(1
71,0
32)
(525
,713
)(7
72,1
53)
(522
,502
)54
,245
42,8
2213
,452
Tota
l Gen
eral
Fun
d4,
858,
403
$
4,33
6,29
5$
4,
000,
220
$
4,68
0,52
4$
2,
966,
199
$
2,06
6,58
9$
2,
820,
011
$
2,14
1,59
8$
1,
919,
860
$
1,24
0,05
9$
All
Oth
er G
over
nmen
tal F
unds
:
Res
trict
ed58
,421
$
13
8,42
3$
217,
920
$
-
$
-$
19
5,27
1$
-$
-
$
4,85
8$
87
,904
$
Unr
estri
cted
, Rep
orte
d in
:
C
apita
l Pro
ject
s Fun
d-
-
22
3,94
2
1,43
6,63
9
29
9,51
4
126,
214
23
9,68
9
279,
639
39
5,15
1
Deb
t Ser
vice
Fun
d-
-
-
89,6
41
1
1
-
1
3
Tota
l All
Oth
er G
over
nmen
tal
F
unds
58,4
21$
138,
423
$
21
7,92
0$
223,
942
$
1,
526,
280
$
494,
786
$
12
6,21
5$
239,
689
$
28
4,49
8$
483,
058
$
CL
EA
RV
IEW
RE
GIO
NA
L H
IGH
SC
HO
OL
DIS
TR
ICT
FUN
D B
AL
AN
CE
S A
ND
GO
VE
RN
ME
NT
AL
FU
ND
SL
AST
TE
N F
ISC
AL
YE
AR
S(M
odif
ied
Acc
rual
Bas
is o
f A
ccou
nti
ng)
FISC
AL
YEA
R E
ND
ING
JUN
E 30
,
173

EXH
IBIT
J-4
(Pag
e 1
of 2
)
2015
2014
2013
2012
2011
2010
2009
2008
2007
2006
Rev
enue
s:
Tax
es L
ocal
19,3
72,3
10$
18
,662
,177
$
17
,846
,942
$
17,5
24,4
44$
17,4
56,3
67$
16,8
76,8
64$
16
,621
,295
$
16
,105
,251
$
15
,267
,759
$
13
,754
,028
$
Tui
tion
Cha
rges
493,
235
36
7,14
6
285,
698
16
9,24
3
185,
411
13
8,00
2
171,
444
14
5,05
7
124,
389
74
,400
Tra
nspo
rtatio
n4,
942
4,28
7
49
,739
44,4
75
31,4
48
22,9
15
8,
037
-
10
,637
25
,511
Inte
rest
Ear
ning
s13
,216
11,6
35
23,5
76
40
,864
81
,258
11
0,04
0
75,7
69
133,
209
17
4,66
5
133,
379
Mis
cella
neou
s22
2,18
1
234,
001
16
8,76
5
371,
029
80
5,08
0
588,
578
21
8,16
8
197,
865
18
0,00
8
350,
585
Sta
te S
ourc
es18
,701
,827
18,3
09,6
21
18,4
17,9
19
17,0
37,6
63
16,7
89,9
52
14,6
35,5
81
15
,994
,794
15
,173
,779
14
,691
,318
13
,842
,691
Fed
eral
Sou
rces
662,
356
70
3,97
6
652,
197
1,
140,
652
822,
665
3,
188,
521
58
4,48
9
721,
075
51
9,18
7
610,
956
T
otal
Rev
enue
39,4
70,0
67
38
,292
,843
37
,444
,836
36
,328
,370
36
,172
,181
35
,560
,501
33,6
73,9
96
32,4
76,2
36
30,9
67,9
63
28,7
91,5
50
Expe
nditu
res:
Ins
truct
ion:
R
egul
ar In
stru
ctio
n10
,545
,751
10,4
15,6
60
10,3
96,5
48
10,1
49,9
28
9,91
5,99
7
10
,022
,303
9,72
4,63
2
9,
573,
755
8,96
7,74
8
8,
661,
551
S
peci
al E
duca
tion
Inst
ruct
ion
2,85
7,56
8
2,
616,
839
2,46
7,26
6
2,
469,
007
2,66
5,92
5
2,
680,
000
2,
403,
481
2,50
6,88
5
2,
188,
428
2,00
4,96
0
Oth
er S
peci
al In
stru
ctio
n-
-
-
-
-
-
-
-
-
30
,764
Oth
er In
stru
ctio
n1,
057,
959
1,03
6,58
8
1,
043,
130
992,
280
94
5,01
9
1,04
0,84
3
942,
411
92
7,23
2
773,
408
78
8,93
9
Und
istri
bute
d:
Tui
tion
2,84
3,92
5
2,
546,
942
2,27
6,33
5
2,
311,
183
1,85
4,02
7
1,
518,
183
1,
545,
688
1,39
4,98
5
1,
493,
244
1,24
9,38
6
Atte
ndan
ce &
Soc
ial W
ork
Serv
ices
80,5
72
78
,543
76
,630
74,9
91
70,7
10
83,8
60
82
,898
81
,856
78
,639
73
,419
Hea
lth S
ervi
ces
260,
174
25
0,42
6
243,
164
22
7,52
7
222,
492
21
0,69
4
190,
890
20
0,13
7
192,
000
22
1,36
5
R
elat
ed S
ervi
ces
382,
167
41
8,76
6
399,
308
31
8,36
6
294,
601
36
1,66
3
290,
260
51
,909
60
,360
54
,900
Ext
raod
inar
y Se
rvic
es15
8,61
0
173,
828
11
9,75
0
81,6
04
28,5
66
22,8
23
11
,043
20
,207
6,
904
200,
172
Su
ppor
t Ser
vice
s - S
tude
nts:
R
egul
ar
899,
368
90
3,11
1
911,
577
87
8,29
4
859,
004
85
1,84
5
852,
089
82
3,80
6
733,
441
73
1,89
8
S
peci
al33
6,22
8
375,
410
31
5,22
6
305,
270
28
9,25
1
308,
135
30
7,46
5
544,
087
51
3,42
9
505,
468
Im
prov
emen
t of I
nstru
ctio
n48
5,82
7
529,
487
51
6,83
1
497,
896
46
6,56
6
452,
796
43
9,49
1
296,
185
27
1,03
8
141,
783
Ed
ucat
iona
l Med
ia S
ervi
ces
258,
308
25
7,70
3
256,
457
24
8,43
9
237,
334
25
2,29
9
246,
988
24
8,00
3
245,
062
23
6,22
1
Inst
ruct
iona
l Sta
ff T
rain
ing
66,6
26
69
,266
76
,965
56,0
54
48,9
79
40,8
47
18
,601
9,
759
8,38
0
74
,847
G
ener
al A
dmin
istra
tion
445,
338
44
9,57
9
441,
692
55
3,25
9
431,
891
47
2,30
7
516,
654
51
7,04
3
480,
882
40
2,92
5
Scho
ol A
dmin
istra
tion
1,55
0,59
2
1,
440,
069
1,38
0,92
3
1,
347,
192
1,34
4,02
1
1,
384,
234
1,
396,
326
1,25
8,84
8
1,
229,
004
1,19
1,31
1
C
entra
l Adm
inis
tratio
n37
8,77
9
380,
167
40
1,67
9
360,
385
38
4,88
4
385,
847
34
3,51
2
317,
997
34
3,89
6
331,
739
CL
EA
RV
IEW
RE
GIO
NA
L H
IGH
SC
HO
OL
DIS
TR
ICT
CH
AN
GE
S IN
FU
ND
BA
LA
NC
ES,
GO
VE
RN
ME
NT
AL
FU
ND
S,L
AST
TE
N F
ISC
AL
YE
AR
S(M
odif
ied
Acc
rual
Bas
is o
f A
ccou
nti
ng)
174

EXH
IBIT
J-4
(Pag
e 2
of 2
)
Expe
nditu
res (
cont
inue
d):
2015
2014
2013
2012
2011
2010
2009
2008
2007
2006
Adm
inis
tratio
n In
form
atio
n Te
chno
logy
451,
437
33
7,57
5
331,
690
31
4,79
8
294,
408
33
7,07
1
288,
704
21
6,81
5
177,
744
18
8,95
1
Allo
wab
le M
aint
enan
ce fo
r Sch
ool F
acili
ties
531,
265
58
6,05
5
759,
324
42
4,60
5
460,
011
91
5,64
5
418,
131
30
9,70
6
309,
875
28
0,44
9
Ope
ratio
n &
Mai
nten
ance
of P
lant
Ser
vice
s2,
165,
361
2,25
1,05
6
2,
115,
119
1,96
8,49
3
2,
073,
361
2,13
0,76
0
2,08
7,66
9
1,
999,
859
1,86
3,12
2
1,
753,
913
Stud
ent T
rans
porta
tion
1,74
5,86
4
1,
682,
403
1,65
3,50
8
1,
515,
071
1,39
0,97
2
1,
488,
065
1,
477,
110
1,61
7,06
6
1,
569,
365
1,44
7,38
0
U
nallo
cate
d B
enef
its7,
833,
755
8,11
7,34
7
7,
860,
970
6,82
1,86
3
6,
174,
921
6,17
0,97
5
6,02
5,57
0
6,
267,
565
6,06
9,42
5
5,
121,
456
Cap
ital O
utla
y77
0,29
7
382,
915
1,
326,
861
1,12
8,19
6
84
6,62
1
3,07
2,25
2
625,
014
34
9,26
3
595,
614
1,
887,
402
Spec
ial S
choo
ls60
,908
72,3
18
66,3
83
85
,530
77
,868
85
,782
91,8
34
69,3
70
82,7
04
111,
464
D
ebt S
ervi
ce E
xend
iture
s:
Prin
cipa
l1,
870,
000
1,78
5,00
0
1,
740,
000
1,75
0,00
0
1,
880,
000
1,58
5,00
0
1,49
0,00
0
1,
345,
000
1,13
0,00
0
1,
135,
000
In
tere
st79
6,76
5
879,
212
95
3,82
6
1,03
5,05
3
98
3,48
8
1,22
4,12
3
1,29
2,59
6
1,
351,
969
1,40
4,22
4
1,
450,
636
T
otal
Ex p
endi
ture
s38
,833
,444
38,0
36,2
65
38,1
31,1
62
35,9
15,2
84
34,2
40,9
17
37,0
98,3
52
33
,109
,057
32
,299
,307
30
,787
,936
30
,278
,299
Exce
ss (D
efic
ienc
y) o
f Rev
enue
s
Ove
r/(U
nder
) Exp
endi
ture
s63
6,62
3
256,
578
(6
86,3
26)
413,
086
1,
931,
264
(1,5
37,8
51)
564,
939
17
6,92
9
180,
027
(1
,486
,749
)
Oth
er F
inan
cin g
Sou
rces
/(Use
s):
S
ale
of B
onds
-
-
-
-
1,30
3,00
0
-
-
-
-
Cap
ital L
ease
s (N
on-B
udge
ted)
-
-
-
-
-
320,
640
32
0,64
0
181,
290
48
8,33
3
T
rans
fers
Out
- Fo
od S
ervi
ce-
-
-
(1
60)
-
(19,
426)
(1
9,42
6)
(37,
050)
(3
5,12
4)
T
rans
fers
Out
- U
nem
ploy
men
t -
-
-
-
(1
50,0
00)
-
-
-
-
Tota
l Oth
er F
inan
cin g
Sou
rces
/(Use
s)-
-
-
-
(160
)
1,
153,
000
30
1,21
4
301,
214
14
4,24
0
453,
209
Net
Cha
n ge
in F
und
Bal
ance
s$6
36,6
23$2
56,5
78(6
86,3
26)
413,
086
1,93
1,10
4(3
84,8
51)
866,
153
478,
143
324,
267
(1,0
33,5
40)
Deb
t Ser
vice
as a
Per
cent
age
of
Non
capi
tal E
xpen
ditu
res
7.01
%7.
08%
7.32
%8.
01%
8.57
%8.
26%
8.57
%8.
44%
8.39
%9.
11%
Sour
ce: D
istri
ct R
ecor
d s
(Mod
ifie
d A
ccru
al B
asis
of
Acc
oun
tin
g)
CL
EA
RV
IEW
RE
GIO
NA
L H
IGH
SC
HO
OL
DIS
TR
ICT
CH
AN
GE
S IN
FU
ND
BA
LA
NC
ES,
GO
VE
RN
ME
NT
AL
FU
ND
S,L
AST
TE
N F
ISC
AL
YE
AR
S
175

EXH
IBIT
J-5
FISC
AL
YEA
RFA
CIL
ITY
PRIO
RPR
IOR
END
ING
USE
/EN
ERG
YC
OR
EY
EAR
INSU
RA
NC
EPA
YA
BLE
AD
ULT
SPO
RTS
SREC
GA
TEIN
SUR
AN
CE
JUN
E 30
,R
ENTA
LSA
VIN
GS
MIS
CR
ebat
eR
EFU
ND
SD
IVID
END
AD
JUST
MEN
TSC
HO
OL
PRO
GR
AM
SALE
SR
ECEI
PTS
SETT
LEM
ENT
TOTA
L
2015
1,37
0$
21,4
10$
5,
990
$
-
$
45
,472
$
-
$
1,
050
$
57,1
13$
-
$
50
,343
$
20
,628
$
8,
500
$
211,
876
$
20
14-
-
95,3
87
-
18
,725
-
-
56
,043
-
-
21
,360
-
191,
515
20
132,
268
-
22
,303
-
17,4
74
-
-
61,9
92
-
-
24,3
51
-
12
8,38
8
2012
1,85
6
-
41,1
41
-
14
7,26
6
-
-
76,1
12
-
-
17,2
64
-
28
3,63
9
2011
2,34
0
-
21,2
97
42
1,59
4
73,8
03
-
-
64,4
27
-
97
,413
23
,031
63
8
704,
542
20
103,
218
-
22
,484
-
57,9
58
-
1
74
,555
-
-
15
,461
40
6,81
9
17
3,67
7
2009
15,9
35
-
33,8
85
-
23
,438
33
,214
3,
285
80,8
49
-
-
27,5
62
-
21
8,16
8
2014
2,74
6
-
21,9
81
-
60
,196
-
-
91
,641
-
-
21
,301
-
197,
865
20
071,
863
-
1,
820
-
52
,128
-
-
10
0,74
7
-
-
23
,450
-
180,
008
20
0683
0
92
,708
466
-
81,1
05
39,3
13
-
99,3
37
12
,159
-
24,6
67
-
35
0,58
5
Sour
ce: D
istri
ct re
cord
s
CL
EA
RV
IEW
RE
GIO
NA
L H
IGH
SC
HO
OL
DIS
TR
ICT
GE
NE
RA
L F
UN
D -
OT
HE
R L
OC
AL
RE
VE
NU
E B
Y S
OU
RC
EL
AST
TE
N F
ISC
AL
YE
AR
S(M
odif
ied
Acc
rual
Bas
is o
f A
ccou
nti
ng)
176
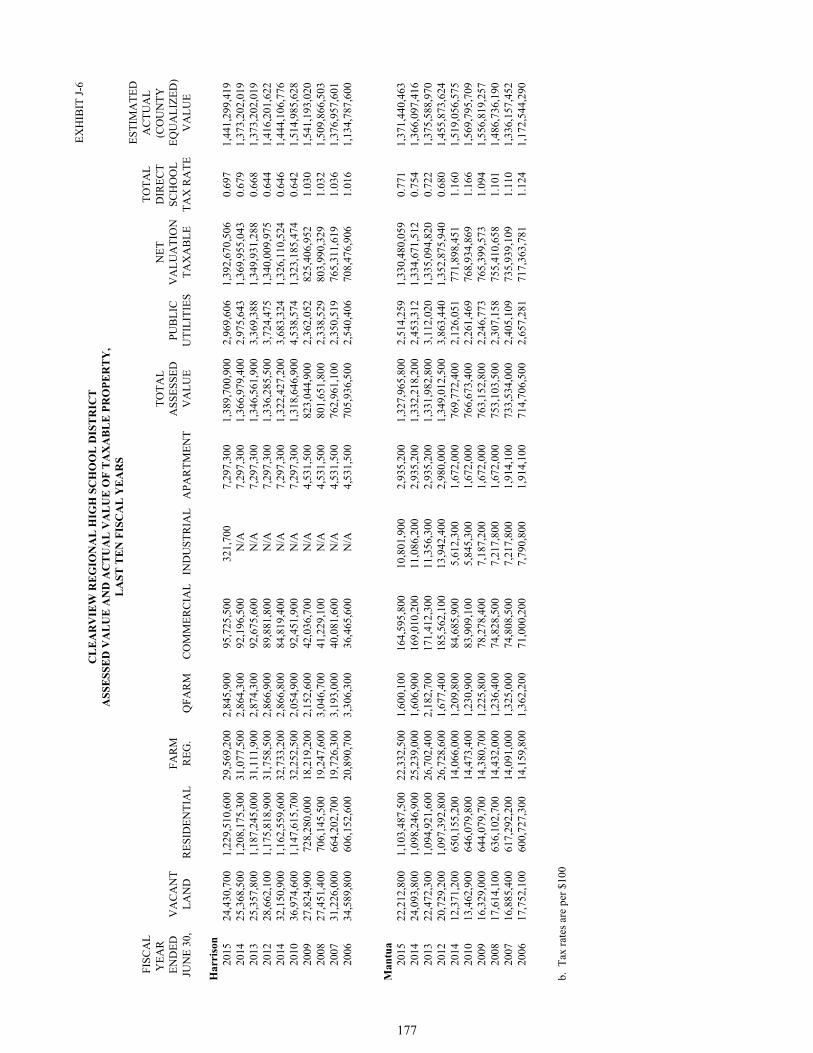
EXH
IBIT
J-6
ESTI
MA
TED
FISC
AL
TOTA
LA
CTU
AL
YEA
R
TOTA
LN
ETD
IREC
T(C
OU
NTY
END
EDV
AC
AN
TFA
RM
ASS
ESSE
DPU
BLI
CV
ALU
ATI
ON
SCH
OO
LEQ
UA
LIZE
D)
JUN
E 30
,LA
ND
RES
IDEN
TIA
LR
EG.
QFA
RM
CO
MM
ERC
IAL
IND
UST
RIA
LA
PAR
TMEN
TV
ALU
EU
TILI
TIES
TAX
AB
LETA
X R
ATE
VA
LUE
Har
riso
n20
1524
,430
,700
1,22
9,51
0,60
029
,569
,200
2,84
5,90
095
,725
,500
321,
700
7,29
7,30
01,
389,
700,
900
2,96
9,60
61,
392,
670,
506
0.69
71,
441,
299,
419
2014
25,3
68,5
001,
208,
175,
300
31,0
77,5
002,
864,
300
92,1
96,5
00N
/A7,
297,
300
1,36
6,97
9,40
02,
975,
643
1,36
9,95
5,04
30.
679
1,37
3,20
2,01
920
1325
,357
,800
1,18
7,24
5,00
031
,111
,900
2,87
4,30
092
,675
,600
N/A
7,29
7,30
01,
346,
561,
900
3,36
9,38
81,
349,
931,
288
0.66
81,
373,
202,
019
2012
28,6
62,1
001,
175,
818,
900
31,7
58,5
002,
866,
900
89,8
81,8
00N
/A7,
297,
300
1,33
6,28
5,50
03,
724,
475
1,34
0,00
9,97
50.
644
1,41
6,20
1,62
220
1432
,150
,900
1,16
2,55
9,60
032
,733
,200
2,86
6,80
084
,819
,400
N/A
7,29
7,30
01,
322,
427,
200
3,68
3,32
41,
326,
110,
524
0.64
61,
444,
106,
776
2010
36,9
74,6
001,
147,
615,
700
32,2
52,5
002,
054,
900
92,4
51,9
00N
/A7,
297,
300
1,31
8,64
6,90
04,
538,
574
1,32
3,18
5,47
40.
642
1,51
4,98
5,62
820
0927
,824
,900
728,
280,
000
18,2
19,2
002,
152,
600
42,0
36,7
00N
/A4,
531,
500
823,
044,
900
2,36
2,05
282
5,40
6,95
21.
030
1,54
1,19
3,02
020
0827
,451
,400
706,
145,
500
19,2
47,6
003,
046,
700
41,2
29,1
00N
/A4,
531,
500
801,
651,
800
2,33
8,52
980
3,99
0,32
91.
032
1,50
9,86
6,50
320
0731
,226
,000
664,
202,
700
19,7
26,3
003,
193,
000
40,0
81,6
00N
/A4,
531,
500
762,
961,
100
2,35
0,51
976
5,31
1,61
91.
036
1,37
6,95
7,60
120
0634
,589
,800
606,
152,
600
20,8
90,7
003,
306,
300
36,4
65,6
00N
/A4,
531,
500
705,
936,
500
2,54
0,40
670
8,47
6,90
61.
016
1,13
4,78
7,60
0
Man
tua
2015
22,2
12,8
001,
103,
487,
500
22,3
32,5
001,
600,
100
164,
595,
800
10,8
01,9
002,
935,
200
1,32
7,96
5,80
02,
514,
259
1,33
0,48
0,05
90.
771
1,37
1,44
0,46
320
1424
,093
,800
1,09
8,24
6,90
025
,239
,000
1,60
6,90
016
9,01
0,20
011
,086
,200
2,93
5,20
01,
332,
218,
200
2,45
3,31
21,
334,
671,
512
0.75
41,
366,
097,
416
2013
22,4
72,3
001,
094,
921,
600
26,7
02,4
002,
182,
700
171,
412,
300
11,3
56,3
002,
935,
200
1,33
1,98
2,80
03,
112,
020
1,33
5,09
4,82
00.
722
1,37
5,58
8,97
020
1220
,729
,200
1,09
7,39
2,80
026
,728
,600
1,67
7,40
018
5,56
2,10
013
,942
,400
2,98
0,00
01,
349,
012,
500
3,86
3,44
01,
352,
875,
940
0.68
01,
455,
873,
624
2014
12,3
71,2
0065
0,15
5,20
014
,066
,000
1,20
9,80
084
,685
,900
5,61
2,30
01,
672,
000
769,
772,
400
2,12
6,05
177
1,89
8,45
11.
160
1,51
9,05
6,57
520
1013
,462
,900
646,
079,
800
14,4
73,4
001,
230,
900
83,9
09,1
005,
845,
300
1,67
2,00
076
6,67
3,40
02,
261,
469
768,
934,
869
1.16
61,
569,
795,
709
2009
16,3
29,0
0064
4,07
9,70
014
,380
,700
1,22
5,80
078
,278
,400
7,18
7,20
01,
672,
000
763,
152,
800
2,24
6,77
376
5,39
9,57
31.
094
1,55
6,81
9,25
720
0817
,614
,100
636,
102,
700
14,4
32,0
001,
236,
400
74,8
28,5
007,
217,
800
1,67
2,00
075
3,10
3,50
02,
307,
158
755,
410,
658
1.10
11,
486,
736,
190
2007
16,8
85,4
0061
7,29
2,20
014
,091
,000
1,32
5,00
074
,808
,500
7,21
7,80
01,
914,
100
733,
534,
000
2,40
5,10
973
5,93
9,10
91.
110
1,33
6,15
7,45
220
0617
,752
,100
600,
727,
300
14,1
59,8
001,
362,
200
71,0
00,2
007,
790,
800
1,91
4,10
071
4,70
6,50
02,
657,
281
717,
363,
781
1.12
41,
172,
544,
290
b. T
ax ra
tes a
re p
er $
100
CL
EA
RV
IEW
RE
GIO
NA
L H
IGH
SC
HO
OL
DIS
TR
ICT
ASS
ESS
ED
VA
LU
E A
ND
AC
TU
AL
VA
LU
E O
F T
AX
AB
LE
PR
OPE
RT
Y,
LA
ST T
EN
FIS
CA
L Y
EA
RS
177

EXH
IBIT
J-7
FISC
AL
GEN
ERA
LTO
TAL
YEA
RO
BLI
GA
TIO
NTO
TAL
DIR
ECT
TOW
NSH
IPTO
WN
SHIP
TOW
NSH
IPD
IREC
T A
ND
END
EDB
ASI
CD
EBT
SCH
OO
L TA
XTO
WN
SHIP
OF
HA
RR
ISO
NO
F H
AR
RIS
ON
OF
HA
RR
ISO
NG
LOU
CES
TER
OV
ERLA
PPIN
GJU
NE
30,
RA
TESE
RV
ICES
RA
TEO
F H
AR
RIS
ON
SCH
OO
L D
ISTR
ICT
FIR
E D
ISTR
ICT
OPE
N S
PAC
EC
OU
NTY
TAX
RA
TE
Har
riso
n20
150.
6215
0.07
510.
697
0.44
400.
8930
0.08
200.
060
0.73
002.
906
2014
0.60
50.
074
0.67
90.
4116
0.87
780.
0830
0.06
00.
6759
2.78
720
130.
594
0.07
50.
668
0.36
560.
8777
0.09
680.
060
0.66
102.
730
2012
0.56
90.
075
0.64
40.
4070
0.85
900.
0970
0.04
30.
5840
2.63
420
140.
569
0.07
70.
646
0.28
700.
8600
0.09
800.
060
0.62
902.
580
2010
0.56
20.
080
0.64
20.
2720
0.86
500.
0970
0.06
00.
6750
2.61
120
090.
897
0.13
31.
030
0.33
301.
3180
0.14
900.
060
1.10
703.
997
2008
0.89
90.
133
1.03
20.
3210
1.34
900.
1500
0.06
01.
1130
4.02
520
070.
904
0.13
21.
036
0.29
901.
3940
0.14
900.
060
1.06
804.
006
2006
0.87
00.
146
1.01
60.
2660
1.41
500.
1360
0.06
01.
0160
3.90
9
Man
tua
2015
0.68
80.
083
0.77
10.
640
0.99
20.
0720
0.02
00.
724
3.21
920
140.
672
0.08
20.
754
0.61
60.
973
0.06
700.
020
0.68
13.
111
2013
0.68
30.
037
0.72
00.
596
0.95
90.
0590
0.02
00.
668
3.02
220
120.
600
0.08
00.
680
0.57
10.
978
0.06
000.
200
0.64
13.
130
2014
1.02
20.
138
1.16
00.
920
1.47
10.
0970
0.02
01.
146
4.81
420
101.
025
0.14
11.
166
0.92
01.
595
0.10
100.
020
1.20
65.
008
2009
0.95
30.
141
1.09
40.
919
1.56
90.
1000
0.02
01.
040
4.74
220
080.
960
0.14
11.
101
0.86
41.
534
0.09
700.
020
1.16
54.
781
2007
0.96
80.
142
1.11
00.
781
1.55
00.
0990
0.02
01.
078
4.63
820
060.
962
0.16
21.
124
0.17
11.
520
N/A
0.02
01.
038
3.87
3
CL
EA
RV
IEW
RE
GIO
NA
L H
IGH
SC
HO
OL
DIS
TR
ICT
DIR
EC
T A
ND
OV
ER
LA
PPIN
G P
RO
PER
TY
TA
X R
AT
ES
LA
ST T
EN
FIS
CA
L Y
EA
RS
(Rat
e pe
r $1
00 o
f A
sses
sed
Val
ue)
SCH
OO
L D
ISTR
ICT
DIR
ECT
RA
TEO
VER
LAPP
ING
RA
TES
178

EXHIBIT J-8
HARRISON TOWNSHIP% OF TOTAL % OF TOTAL
TAXABLE DISTRICT NET TAXABLE DISTRICT NETASSESSED ASSESSED ASSESSED ASSESSED
VALUE VALUATION VALUE VALUATION
AEW SCT Mullica Hill, LLC 14,000,000$ 1.01% -$ Madison/Canuso 8,170,000$ 0.59% 4,095,000 0.67%Mullica West Ltd. 6,224,000 0.45% 3,105,200 0.51%Mantec Associates 5,884,000 0.42% - Storage Quest 4,575,000 0.33% - Beazer Homes Corp 4,222,800 0.30% - Inspira Medical 4,200,000 0.30% - Woodland Four LLC 4,017,600 0.29% - Inspira Medical Center Woodbury, Inc. 3,969,600 0.29% - Mullica Hill Commons, LLC 3,200,000 0.23% - Bell Atlantic Property Tax Dept. - 3,335,530 0.55%Mullica Hill Self Storage - 1,640,900 0.27%Mullica Hill Plaza Associates - 1,233,400 0.20%Mullica Associates CVS - 990,400 0.16%Group Ten Associates - 864,000 0.14%Tunlaw, Inc. - 827,800 0.14%Holding Smith, Inc. - 817,200 0.13%Farmers National Bank - 798,000 0.13%
Total 58,463,000$ 4.21% 17,707,430$ 2.90%
MANTUA TOWNSHIP% OF TOTAL % OF TOTAL
TAXABLE DISTRICT NET TAXABLE DISTRICT NETASSESSED ASSESSED ASSESSED ASSESSED
VALUE VALUATION VALUE VALUATION
Target Corporation 14,676,900$ 1.11% -$ Lowes Home Center, Inc. 14,623,700 1.10% - Home Depot, U.S.A. Inc. 10,197,000 0.77% 6,535,000 0.10%Kohl's Department Store 9,200,000 0.69% - Route 553 Retail, LLC 6,713,900 0.51% - Wilkins Industrial Park 6,646,900 0.50% - Timberline Plaza 6,388,200 0.48% - Belina Dev & Brooklawn Out Lot LLC 6,260,300 0.47% - Spirit Master Funding 6,033,600 0.45% - Bristol Development Corp - 6,259,700 0.09%Wilkins Industrial Park - 4,624,800 0.07%Verizon - 4,355,210 0.06%Mantua Partners, NJ - 4,188,400 0.06%Frezza LLC 4,922,500 0.37% 3,965,800 0.06%K-Tron - 3,327,500 0.05%Campbell's Auto Express - 2,432,100 0.04%Public Storage, Inc. - 1,826,800 0.03%Eagles Nest Golf Club LLC - 1,561,900 0.02%
Total 85,663,000$ 6.45% 39,077,210 0.58%
TAXPAYER
CLEARVIEW REGIONAL HIGH SCHOOL DISTRICTPRINCIPAL PROPERTY TAX PAYERS,
CURRENT YEAR AND NINE YEARS AGO
2015
TAXPAYER
2015 2006
2006
179

EXHIBIT J-9
HARRISON TOWNSHIPTAXES LEVIED COLLECTIONS
YEAR ENDED FOR THE PERCENT OF IN SUBSEQUENTDECEMBER 31 FISCAL YEAR AMOUNT LEVY YEAR
2015 $8,299,314 8,299,314 100.00%2014 8,013,981 8,013,981 100.00% -2013 7,626,499 7,626,499 100.00% -2012 7,550,040 7,550,040 100.00% -2014 7,436,680 7,436,680 100.00% -2010 7,407,108 7,407,108 100.00% -2009 7,215,213 7,215,213 100.00% -2008 6,911,356 6,911,356 100.00% -2007 6,284,724 6,284,704 100.00% -2006 5,667,508 5,667,508 100.00% -
MANTUA TOWNSHIPTAXES LEVIED COLLECTIONS
YEAR ENDED FOR THE PERCENT OF IN SUBSEQUENTDECEMBER 31 FISCAL YEAR AMOUNT LEVY YEAR
2015 $8,962,179 8,962,179 100.00%2014 8,563,598 8,563,598 100.00% -2013 8,123,728 8,123,728 100.00% -2012 7,891,359 7,891,359 100.00% -2014 7,852,880 7,852,880 100.00% -2010 7,294,392 7,294,392 100.00% -2009 7,229,670 7,229,670 100.00% -2008 7,125,070 7,125,070 100.00% -2007 7,036,349 7,036,349 100.00% -2006 6,788,778 6,788,778 100.00% -
Source: District records including the Certificate and Report of School Taxes (A4F Form).
COLLECTED WITH THE FISCAL YEAR
COLLECTED WITH THE FISCAL YEAR
CLEARVIEW REGIONAL HIGH SCHOOL DISTRICTPROPERTY TAX LEVIES AND COLLECTIONS
LAST TEN FISCAL YEARS
180

EXHIBIT J-10
BUSINESS-FISCAL BOND TYPE PERCENTAGEYEAR GENERAL CERTIFICATES ANTICIPATION ACTIVITIES OF
ENDED OBLIGATION OF CAPITAL NOTES CAPITAL TOTAL PER CAPITAJUNE 20, BONDS PARTICIPATION LEASES (BANs) LEASES DISTRICT INCOME
2015 $18,008,000 N/A N/A N/A N/A 18,008,000 N/A2014 19,878,000 N/A N/A N/A N/A 19,878,000 N/A2013 19,923,000 N/A N/A N/A N/A 19,923,000 N/A2012 23,403,000 N/A N/A N/A N/A 23,403,000 N/A2014 25,153,000 N/A N/A N/A N/A 25,153,000 4.78%2010 27,255,000 N/A 66,649 N/A N/A 27,321,649 5.32%2009 27,537,000 N/A 168,287 N/A N/A 27,705,287 5.56%2008 29,027,000 N/A 385,922 N/A N/A 29,412,922 6.06%2007 30,372,000 N/A 685,491 N/A N/A 31,057,491 6.40%2006 31,502,000 N/A 734,824 N/A N/A 32,236,824 3.00%
Note: Details regarding the district's outstanding debt can be found in the notes to the financial statements
GOVERNMENTAL ACTIVITIES
CLEARVIEW REGIONAL HIGH SCHOOL DISTRICTRATIOS OF OUTSTANDING DEBT BY TYPE
LAST TEN FISCAL YEARS
181

EXHIBIT J-11
NET PERCENTAGEFISCAL GENERAL OF ACTUALYEAR GENERAL BONDED TAXABLE
ENDED OBLIGATION DEBT VALUE OFJUNE 30, BONDS DEDUCTIONS OUTSTANDING PROPERTY PER CAPITA
2015 $18,008,000 18,008,000 N/A N/A2014 19,878,000 19,878,000 N/A N/A2013 19,923,000 19,923,000 N/A N/A2012 23,403,000 23,403,000 1.75% N/A2014 25,153,000 25,153,000 1.90% 2,0202010 27,255,000 27,255,000 2.06% 2,1652009 27,537,000 27,537,000 3.34% 2,1882008 29,027,000 29,027,000 3.52% 2,3382007 30,372,000 30,372,000 3.98% 2,4812006 31,502,000 31,502,000 4.46% 2,668
GENERAL BONDED DEBT OUTSTANDING
CLEARVIEW REGIONAL HIGH SCHOOL DISTRICTRATIOS OF NET GENERAL BONDED DEBT OUTSTANDING
LAST TEN FISCAL YEARS
182

EXHIBIT J-12
DEBT PERCENTAGE OVERLAPPINGOUTSTANDING APPLICABLE DEBT
HarrisonDebt Repaid With Property Taxes: Harrison Township $37,980,493 100.000% $37,980,493 Gloucester County General Obligation Debt 247,990,608 5.693% 14,116,978 Regional School Debt 18,008,000 48.080% 8,658,246
Total Direct & Overlapping Debt $60,755,718
MantuaDebt Repaid With Property Taxes: Mantua Township $10,484,683 100.000% $10,484,683 Gloucester County General Obligation Debt 247,990,608 5.415% 13,429,472 Regional School Debt 18,008,000 51.920% 9,349,754
Total Direct & Overlapping Debt $33,263,908
Sources: Assessed value data used to estimate applicable percentages provided by the Burlington County Board of Taxation.
Debt outstanding data provided by each governmental unit.
NOTE - Overlapping governments are those that coincide, at least in part, with the geographic boundariesof the District.
This schedule estimates the portion of the outstanding debt of those overlapping governments that is borneby the residents and businesses of the above Townships. This process recognizes that, when considering theDistrict's ability to issue and repay Long-Term debt, the entire debt burden borne by the residents and businessesshould be taken into account. However, this does not imply that every taxpayer is a resident, and thereforeresponsible for repaying the debt, of each overlapping payment.
a. For debt repaid with property taxes, the percentage of overlapping debt applicable is estimated using taxableassessed property values. Applicable percentages were estimated by determining the portion of anothergovernment unit's taxable value that is within the District's boundaries and dividing it by each unit's totaltaxable value.
CLEARVIEW REGIONAL HIGH SCHOOL DISTRICTRATIOS OF OVERLAPPING GOVERNMENTAL ACTIVITIES DEBT
AS OF JUNE 30, 2015
GOVERNMENTAL UNIT
183

EXH
IBIT
J-13
2015
2014
2013
2012
2011
2010
2009
2008
2007
2006
Deb
t Lim
i t$9
6,68
1,48
3$9
7,34
0,09
599
,735
,831
103,
083,
916
105,
222,
596
104,
451,
175
98,9
07,4
2888
,869
,408
76,7
08,5
2765
,091
,200
Tota
l Net
Deb
t App
licab
le to
Lim
it18
,008
,000
19,8
78,0
0021
,663
,000
23,4
03,0
0025
,153
,000
27,2
55,0
0027
,537
,000
29,0
27,0
0030
,372
,000
31,5
02,0
00
Lega
l Deb
t Mar
gin
$78,
673,
483
$77,
462,
095
78,0
72,8
3179
,680
,916
80,0
69,5
9677
,196
,175
71,3
70,4
2859
,842
,408
46,3
36,5
2733
,589
,200
Tota
l Net
Deb
t App
licab
le to
the
Lim
it
as a
Per
cent
age
of D
ebt L
imit
18.6
3%20
.42%
21.7
2%22
.70%
23.9
0%26
.09%
27.8
4%32
.66%
39.5
9%48
.40%
Har
rison
Man
tua
Tota
l
2014
1,41
7,73
4,28
71,
375,
832,
077
2,79
3,56
6,36
420
131,
371,
663,
339
1,36
5,85
6,03
02,
737,
519,
369
2012
1,36
2,72
2,31
31,
393,
176,
185
2,75
5,89
8,49
8
$8,2
86,9
84,2
31
Ave
rage
Equ
aliz
ed V
alua
tion
of T
axab
le P
rope
rty$2
,762
,328
,077
Deb
t Lim
it (3
.5 %
of A
vera
ge E
qual
izat
ion
Val
ue)
$96,
681,
483
Net
Bon
ded
Scho
ol D
ebt
18,0
08,0
00
Lega
l Deb
t Mar
gin
$78,
673,
483
Sour
ce:
Equa
lized
val
uatio
n ba
ses w
ere
obta
ined
from
the
Ann
ual R
epor
t of t
he S
tate
of N
ew Je
rsey
Dep
artm
ent o
f Tre
asur
y, D
ivis
ion
of T
axat
ion
Equa
lized
Val
uatio
n B
asis
Le g
al D
ebt M
argi
n C
alcu
latio
n fo
r Fi
scal
Yea
r 20
14
CL
EA
RV
IEW
RE
GIO
NA
L H
IGH
SC
HO
OL
DIS
TR
ICT
LE
GA
L D
EB
T M
AR
GIN
INFO
RM
AT
ION
LA
ST T
EN
FIS
CA
L Y
EA
RS
184

EXHIBIT J-14
PER CAPITAPERSONAL PERSONAL UNEMPLOYMENT
YEAR POPULATION (a) INCOME INCOME (c) RATE (d)
Harrison2015 N/A N/A N/A N/A2014 12,818 N/A N/A 5.6%2013 12,705 573,872,145 45,169 6.4%2012 12,575 563,362,608 44,868 8.1%2014 * 12,513 525,865,284 42,228 7.9%2010 12,435 513,281,529 41,337 8.1%2009 12,587 498,331,917 39,591 7.6%2008 12,415 485,501,440 39,040 5.2%2007 12,224 456,558,130 37,331 4.0%2006 11,812 425,841,104 36,076 4.4%
Mantua2015 N/A N/A N/A N/A2014 15,150 N/A N/A 6.5%2013 15,090 681,600,210 45,169 6.8%2012 15,132 677,910,612 44,868 9.4%2014 * 15,183 644,357,052 42,228 9.2%2010 15,216 629,025,129 41,337 9.4%2009 15,216 602,416,656 39,591 8.9%2008 15,187 592,510,080 39,040 6.0%2007 15,204 567,468,531 37,331 4.7%2006 15,142 546,262,792 36,076 5.1%
Source: a Population information provided by the NJ Dept of Labor and Workforce Developmentb Personal incomec Per Capitad Unemployment data provided by the NJ Dept of Labor and Workforce Development* 2010 Census
CLEARVIEW REGIONAL HIGH SCHOOL DISTRICTDEMOGRAPHIC AND ECONOMIC STATISTICS
LAST TEN FISCAL YEARS
185

EXHIBIT J-15
PERCENTAGERANK OF TOTAL
EMPLOYER EMPLOYEES (OPTIONAL) EMPLOYMENT
Inspira Health 1,825 1 15.79%Kennedy Hospital 1,675 2 14.49%Washington Township School District 1,631 3 14.11%Rowan University 1,483 4 12.83%County of Gloucester 1,398 5 12.10%Missa Bay, LLC 950 6 8.22%Monroe Township School District 807 7 6.98%U.S. Food Services 725 8 6.27%Exxon Mobile Research & Development 540 9 4.67%LaBrea Bakery 525 10 4.54%
11,559 100.00%
Source: Information provided by the Gloucester County Office of Economic Development and Employer Directly.
CLEARVIEW REGIONAL HIGH SCHOOL DISTRICTPRINCIPAL EMPLOYERS
CURRENT YEAR AND NINE YEARS AGO
2015
2006
NOT AVAILABLE
186

Function/Program 2015 2014 2013 2012 2011 2010 2009 2008 2007 2006
Instruction: Regular 149.8 150.5 150.0 149.6 160.2 155.0 155.0 150.5 149.5 148.0 Special Education 46.8 35.7 37.1 37.9 26.5 36.0 36.0 40.5 39.5 37.0 Other Special Education Other Instruction 3.0 3.0 3.0 3.0 3.0 2.5 2.5 2.5 Adult/Continuing Education Program 0.5 0.5 0.5 0.5 0.5 0.5 0.5 0.5 0.5 0.5Support Services: Attendance & Social Work 2.7 2.7 2.7 2.7 3.0 3.0 3.0 3.0 3.0 3.0 Health Services 4.3 4.3 4.3 4.4 4.2 4.2 4.2 3.7 3.7 3.7 Related Services 2.0 2.0 2.0 1.6 1.6 1.6 1.6 1.0 1.0 1.0 Extraordinary Services Guidance Services 14.0 14.8 15.1 14.2 14.0 14.0 14.0 11.7 11.7 11.5 Child Study Team 6.4 6.0 5.4 5.2 6.0 6.0 6.0 6.0 6.0 6.5 Improvement of Instruction 5.0 5.0 4.9 5.0 5.0 5.0 5.0 3.0 3.0 2.0 Media Services 3.0 3.0 3.0 3.0 3.0 3.0 3.0 3.0 3.0 4.0 Professional Development 0.5 0.5 0.5 0.5 0.5 1.0 1.0 General Administration 2.0 2.0 2.0 2.0 2.0 2.0 2.0 2.0 2.0 2.0 School Administration 17.0 15.9 15.5 15.5 15.5 16.0 16.0 14.5 14.5 14.0 Central Services 5.0 5.0 5.0 5.0 5.0 5.0 5.0 5.2 5.2 5.0 Administrative Information Technology 4.5 4.5 4.5 4.5 4.5 4.5 4.5 3.0 3.0 3.0 Plants Operations & Maintenance 22.7 27.1 26.8 26.8 29.0 28.0 28.0 22.5 22.5 21.5 Pupil Transportation 24.5 26.8 26.8 23.9 40.0 37.0 37.0 38.2 38.2 38.0 Other Support Services 3.0 3.0 3.0 3.0 3.5 3.5 3.5 0.5 0.4 0.4Food Service 20.0 20.0 20.0 20.0 20.0 21.0 22.0 22.0 22.0 23.0
Total 333.7 329.3 332.1 328.3 347.0 349.3 350.3 333.3 331.2 326.6
Source: District Personnel Records
CLEARVIEW REGIONAL HIGH SCHOOL DISTRICTFULL-TIME EQUIVALENT DISTRICT EMPLOYEES BY FUNCTION/PROGRAM
LAST TEN FISCAL YEARS
EXHIBIT J-16
187

EXH
IBIT
J-17
AV
ERA
GE
AV
ERA
GE
% C
HA
NG
E IN
OPE
RA
TIN
GD
AIL
YD
AIL
YA
VER
AG
E ST
UD
ENT
FISC
AL
EXPE
ND
ITU
RES
CO
ST P
ERPE
RC
ENTA
GE
ENR
OLL
MEN
TA
TTEN
DA
NC
ED
AIL
Y
ATT
END
AN
CE
YEA
REN
RO
LLM
ENT
(a)
PUPI
LC
HA
NG
EST
AFF
R
ATI
OST
AFF
RA
TIO
(AD
A) (
c)(A
DA
) (c)
ENR
OLL
MEN
TPE
RC
ENTA
GE
2015
2,49
1 $
34,
704,
731
13,9
32
4.19
%65
12
.810
9 15
.22,
320.
7 2,
320.
7 -5
.01%
95.1
6%20
142,
516
3
4,16
1,45
4 13
,578
1.
54%
66
13.2
110
14.9
2,46
4.2
2,35
9.6
0.86
%95
.76%
2013
2,48
9
33,
282,
535
13,3
72
7.06
%65
13
.811
0 14
.32,
443.
2 2,
324.
8 -1
.00%
95.1
5%20
122,
498
3
1,19
9,73
1 12
,490
5.
64%
65
14.0
110
14.4
2,46
7.8
2,35
0.5
-1.0
5%95
.25%
2014
2,50
1
29,
563,
169
11,8
23
-4.2
0%65
13
.611
0 14
.72,
494.
0 2,
372.
0 2.
17%
95.1
1%20
102,
441
3
0,12
3,44
8 12
,341
4.
63%
65
13.6
115
13.5
2,44
1.0
2,31
1.3
2.15
%94
.69%
2009
2,45
4
28,
944,
398
11,7
95
-3.2
7%69
12
.011
9 13
.72,
389.
7 2,
257.
8 -0
.33%
94.4
8%20
082,
399
2
9,25
3,07
5 12
,194
5.
46%
67
12.9
111
13.8
2,39
7.5
2,29
0.3
0.26
%95
.53%
2007
2,39
2
27,
658,
098
11,5
63
2.39
%67
13
.311
6 13
.02,
391.
2 2,
282.
2 4.
36%
95.4
4%20
062,
285
2
5,80
5,26
1 11
,293
2.
74%
65
12.3
113
13.2
2,29
1.2
2,17
2.1
3.39
%94
.80%
Sour
ces:
D
istri
ct re
cord
sN
ote:
Enr
ollm
ent b
ased
on
annu
al O
ctob
er d
istri
ct c
ount
.
aO
pera
ting
expe
nditu
res e
qual
tota
l exp
endi
ture
s les
s deb
t ser
vice
and
cap
ital o
utla
yb
Teac
hing
staf
f inc
lude
s onl
y fu
ll-tim
e eq
uiva
lent
s of c
ertif
icat
ed st
aff
cA
vera
ge d
aily
enr
ollm
ent a
nd a
vera
ge d
aily
atte
ndan
ce a
re o
btai
ned
from
the
Scho
ol R
egis
ter S
umm
ary
(SR
S)
CL
EA
RV
IEW
RE
GIO
NA
L H
IGH
SC
HO
OL
DIS
TR
ICT
OPE
RA
TIN
G S
TA
TIS
TIC
SL
AST
TE
N F
ISC
AL
YE
AR
S
MID
DLE
SC
HO
OL
HIG
H S
CH
OO
LPU
PIL/
TEA
CH
ER R
ATI
O
188

EXH
IBIT
J-18
DIS
TRIC
T B
UIL
DIN
GS
2015
2014
2013
2012
2011
2010
2009
2008
2007
2006
Mid
dle
Scho
ol:
M
iddl
e Sc
hool
(196
8 &
200
3):
Squ
are
Feet
130,
715
130,
715
130,
715
130,
715
130,
715
130,
715
130,
715
130,
715
130,
715
130,
715
Cap
acity
(Stu
dent
s)76
476
476
476
476
476
476
476
476
476
4
E
nrol
lmen
t86
486
591
491
688
888
882
788
189
479
7H
igh
Scho
ol:
H
igh
Scho
ol (1
960,
199
6, 2
003)
:
S
quar
e Fe
et25
0,94
725
0,94
725
0,94
725
0,94
725
0,94
725
0,94
725
0,94
725
0,94
725
0,94
725
0,94
7
C
apac
ity (S
tude
nts)
1,46
21,
462
1,46
21,
462
1,46
21,
462
1,46
21,
462
1,46
21,
462
Enr
ollm
ent
1,62
71,
651
1,57
51,
582
1,61
31,
613
1,62
71,
555
1,49
81,
491
Adm
inis
tratio
n B
uild
ing:
S
quar
e Fe
et5,
260
5,26
05,
260
5,26
05,
260
5,26
05,
260
5,26
05,
260
5,26
0Tr
ansp
orta
tion
Bui
ldin
g:
Squ
are
Feet
1,40
01,
400
1,40
01,
400
1,40
01,
400
1,40
01,
400
1,40
01,
400
Mai
nten
ance
Bui
ldin
g/Fi
eld
Hou
se:
S
quar
e Fe
et2,
500
2,50
02,
500
2,50
02,
500
2,50
02,
500
2,50
02,
500
2,50
0
Num
ber o
f Sch
ools
at J
une
30, 2
013:
M
iddl
e Sc
hool
= 1
S
enio
r Hig
h Sc
hool
= 1
O
ther
= 0
Sour
ce: D
istri
ct F
acili
ties O
ffic
e
Not
e: Y
ear o
f orig
inal
con
stru
ctio
n is
show
n in
par
enth
eses
. In
crea
ses i
n sq
uare
foot
age
and
capa
city
are
the
resu
lt of
an
d ad
ditio
ns.
Enro
llmen
t is b
ased
on
the
annu
al O
ctob
er d
istri
ct c
ount
.
CL
EA
RV
IEW
RE
GIO
NA
L H
IGH
SC
HO
OL
DIS
TR
ICT
SCH
OO
L B
UIL
DIN
G IN
FOR
MA
TIO
NL
AST
TE
N F
ISC
AL
YE
AR
S
189

EXH
IBIT
J-19
UN
DIS
TRIB
UTE
D E
XPE
ND
ITU
RES
- R
EQU
IRED
M
AIN
TEN
AN
CE
FOR
SC
HO
OL
FAC
ILIT
IES
GR
OSS
SQU
AR
E*
FOO
TAG
E20
1520
1420
1320
1220
1120
1020
0920
0820
0720
06TO
TAL
Hig
h Sc
hool
250,
947
423,
860
$
425,
318
$
515,
605
$
270,
681
$
285,
734
$
328,
912
$
284,
615
$
203,
074
$
190,
088
$
160,
495
$
3,08
8,38
2$
Mid
dle
Scho
ol13
0,71
596
,411
129,
812
206,
869
134,
375
157,
258
565,
247
122,
455
97,7
9911
2,29
911
0,85
41,
733,
379
Adm
inis
tratio
n5,
260
10,9
9530
,925
36,8
5019
,549
17,0
1921
,486
10,6
828,
833
7,48
89,
100
172,
927
Tota
l Sch
ool
F
acili
ties
531,
266
$
586,
055
$
759,
324
$
424,
605
$
460,
011
$
915,
645
$
417,
753
$
309,
706
$
309,
875
$
280,
449
$
4,99
4,68
8$
* S
choo
l fac
ilitie
s as d
efin
ed u
nder
EFC
FA.
(N.J.
A.C
. 6A
:26-
1.2
and
N.J.
A.C
. 6A
:26A
-1.3
)
Sour
ce:
Dis
trict
reco
rds
CL
EA
RV
IEW
RE
GIO
NA
L H
IGH
SC
HO
OL
DIS
TR
ICT
SCH
ED
UL
E O
F R
EQ
UIR
ED
MA
INT
EN
AN
CE
LA
ST T
EN
FIS
CA
L Y
EA
RS
190

EXHIBIT J-20
COVERAGE DEDUCTIBLESchool Package Policy - Utica National Insurance Group Property - Blanket Building & Contents $79,189,042 1,000 Commercial General Liability General Aggregate Limit 3,000,000 None Products Completed Operations, Aggregate Limit 3,000,000 None Personal & Advertising Injury 1,000,000 None Fire Damage Limit Any One Fire 1,000,000 None Medical Expense - any One Person 10,000 None Commercial Automobile Liability Bodily Injury & Property Damage 1,000,000 1,000 Inland Marine Business Computers 675,893 250 Head of the Class Uni-Flex 100,000 500 Valuable Papers & Records 100,000 100 Signs 30,000 250 Musical Instruments & Related 500,000 250 Miscellaneous School Equipment 500,000 250 Educators Legal Liability 1,000,000 7,500 Umbrella General Liability 10,000,000 10,000 Excess Liability Policy - Fireman's Fund Indemnity Corp. 50,000,000 None Workmens' Compensation - Educational Risk Insurance Consortium South Bodily Injury - By Accident 2,000,000 None Bodily Injury - By Disease 2,000,000 None Student Accident - The Berkley LH&A Insurance Program Trust VariousPublic Employees' Faithful Performance Bonds - Selective Insurance Company of America Employee Bond - Esther R. Pennell, Business Administrator/Board Secretary 265,000 None
Source: District Records.
CLEARVIEW REGIONAL HIGH SCHOOL DISTRICTINSURANCE SCHEDULE
JUNE 30, 2015
191

This page intentionally left blank
192

SINGLE AUDIT SECTION
193

This page intentionally left blank
194

EXHIBIT K-1
INDEPENDENT AUDITOR’S REPORT ON INTERNAL CONTROL OVER FINANCIAL REPORTING AND ON COMPLIANCE AND OTHER MATTERS BASED ON AN AUDIT OF
FINANCIAL STATEMENTS PERFORMED IN ACCORDANCE WITH GOVERNMENT AUDITING STANDARDS
Honorable President and Members of the Board of Education Clearview Regional High School District County of Gloucester Mullica Hill, New Jersey 08062 We have audited, in accordance with the auditing standards generally accepted in the United States of America and the standards applicable to financial audits contained in Government Auditing Standards issued by the Comptroller General of the United States and audit requirements as prescribed by the Office of School Finance, Department of Education, State of New Jersey, the financial statements of the governmental and business-type activities, each major fund and the aggregate remaining fund information of the Clearview Regional High School District, as of and for the year ended June 30, 2015, and the related notes to the financial statements, which collectively comprise Clearview Regional High School District’s basic financial statements, and have issued our report thereon dated December 4, 2015. Internal Control Over Financial Reporting In planning and performing our audit of the financial statements, we considered Clearview Regional High School District's internal control over financial reporting (internal control) to determine the audit procedures that are appropriate in the circumstances for the purpose of expressing our opinions on the financial statements, but not for the purpose of expressing an opinion on the effectiveness of Clearview Regional High School District’s internal control. Accordingly, we do not express an opinion on the effectiveness of Clearview Regional High School District’s internal control. A deficiency in internal control exists when the design or operation of a control does not allow management or employees, in the normal course of performing their assigned functions, to prevent, or detect and correct, misstatements on a timely basis. A material weakness is a deficiency, or a combination of deficiencies, in internal control, such that there is a reasonable possibility that a material misstatement of the District’s financial statements will not be prevented, or detected and corrected on a timely basis. A significant deficiency is a deficiency, or a combination of deficiencies, in internal control that is less severe than a material weakness, yet important enough to merit attention by those charged with governance. Our consideration of internal control was for the limited purpose described in the first paragraph of this section and was not designed to identify all deficiencies in internal control that might be material weaknesses or significant deficiencies. Given these limitations, during our audit we did not identify any deficiencies in internal control that we consider to be material weaknesses. However, material weaknesses may exist that have not been identified.
195

Compliance and Other Matters As part of obtaining reasonable assurance about whether Clearview Regional High School District's financial statements are free from material misstatement, we performed tests of its compliance with certain provisions of laws, regulations, contracts, and grant agreements, noncompliance with which could have a direct and material effect on the determination of financial statement amounts. However, providing an opinion on compliance with those provisions was not an objective of our audit, and accordingly, we do not express such an opinion. The results of our tests disclosed no instances of noncompliance or other matters that are required to be reported under Government Auditing Standards and audit requirements as prescribed by the Office of School Finance, Department of Education, State of New Jersey. Purpose of this Report The purpose of this report is solely to describe the scope of our testing of internal control and compliance and the results of that testing, and not to provide an opinion on the effectiveness of the District’s internal control or on compliance. This report is an integral part of an audit performed in accordance with Government Auditing Standards and audit requirements as prescribed by the Office of School Finance, Department of Education, State of New Jersey, in considering the District’s internal control and compliance. Accordingly, this communication is not suitable for any other purpose.
Respectfully Submitted,
HOLMAN FRENIA ALLISON, P.C.
Michael Holt Public School Accountant Certified Public Accountant No. 1148
Medford, New Jersey December 4, 2015
196

EXHIBIT K-2
INDEPENDENT AUDITOR’S REPORT ON COMPLIANCE FOR EACH MAJOR PROGRAM AND ON INTERNAL CONTROL OVER COMPLIANCE REQUIRED BY OMB CIRCULAR A-
133 AND NEW JERSEY OMB CIRCULAR 04-04 AND/OR 15-08.
Honorable President and Members of the Board of Education Clearview Regional High School District County of Gloucester Mullica Hill, New Jersey 08062 Report on Compliance for Each Major Federal and State Program We have audited Clearview Regional High School District’s compliance with the types of compliance requirements described in the OMB Circular A-133 Compliance Supplement and the New Jersey Aid/Grant Compliance Supplement that could have a direct and material effect on each of the District’s major federal and state programs for the year ended June 30, 2015. The Clearview Regional High School District’s major federal and state programs are identified in the Summary of Auditor’s Results section of the accompanying Schedule of Findings and Questioned Costs. Management’s Responsibility Management is responsible for compliance with the requirements of laws, regulations, contracts, and grants applicable to its federal and state programs. Auditor’s Responsibility Our responsibility is to express an opinion on compliance for each of Clearview Regional High School District’s major federal and state programs based on our audit of the types of compliance requirements referred to above. We conducted our audit of compliance in accordance with auditing standards generally accepted in the United States of America; the standards applicable to financial audits contained in Government Auditing Standards, issued by the Comptroller General of the United States; and OMB Circular A-133, Audits of States, Local Governments, and Non-Profit Organizations; the New Jersey State Aid/Grant Compliance Supplement; the audit requirements prescribed by the Office of School Finance, Department of Education, State of New Jersey; and New Jersey OMB’s Circulars 04-04 and 15-08, Single Audit Policy for Recipients of Federal Grants, State Grants and State Aid. Those standards,
197

OMB Circular A-133 and New Jersey OMB’s Circulars 04-04 and 15-08, require that we plan and perform the audit to obtain reasonable assurance about whether noncompliance with the types of compliance requirements referred to above that could have a direct and material effect on a major federal or state program occurred. An audit includes examining, on a test basis, evidence about the Clearview Regional High School District’s compliance with those requirements and performing such other procedures as we considered necessary in the circumstances. We believe that our audit provides a reasonable basis for our opinion on compliance for each major federal and state program. However, our audit does not provide a legal determination of Clearview Regional High School District’s compliance with those requirements. Opinion on Each Major Federal and State Program In our opinion, Clearview Regional High School District complied, in all material respects, with the types of compliance requirements referred to above that could have a direct and material effect on each of its major federal and state programs for the year ended June 30, 2015. Report on Internal Control Over Compliance Management of Clearview Regional High School District is responsible for establishing and maintaining effective internal control over compliance with the types of compliance requirements referred to above. In planning and performing our audit of compliance, we considered Clearview Regional High School District’s internal control over compliance with the types of requirements that could have a direct and material effect on each major federal or state program to determine the auditing procedures that are appropriate in the circumstances for the purpose of expressing an opinion on compliance for each major federal or state program and to test and report on internal control over compliance in accordance with OMB Circular A-133 and New Jersey OMB’s Circular’s 04-04 and 15-08, but not for the purpose of expressing an opinion on the effectiveness of internal control over compliance. Accordingly, we do not express an opinion on the effectiveness of Clearview Regional High School District’s internal control over compliance. A deficiency in internal control over compliance exists when the design or operation of a control over compliance does not allow management or employees, in the normal course of performing their assigned functions, to prevent, or detect and correct, noncompliance with a type of compliance requirement of a federal or state program on a timely basis. A material weakness in internal control over compliance is a deficiency, or combination of deficiencies, in internal control over compliance, such that there is a reasonable possibility that material noncompliance with a type of compliance requirement of a federal or state program will not be prevented, or detected and corrected, on a timely basis. A significant deficiency in internal control over compliance is a deficiency, or a combination of deficiencies, in internal control over compliance with a type of compliance requirement of a federal or state program that is less severe than a material weakness in internal control over compliance, yet important enough to merit attention by those charged with governance. Our consideration of internal control over compliance was for the limited purpose described in the first paragraph of this section and was not designed to identify all deficiencies in internal control over compliance that might be material weaknesses or significant deficiencies. We did not identify any deficiencies in internal control over compliance that we consider to be material weaknesses. However, material weaknesses may exist that have not been identified.
198
The purpose of this report on internal control over compliance is solely to describe the scope of our testing of internal control over compliance and the results of that testing based on the requirements of OMB Circular A-133 and New Jersey OMB’s Circular(s) 04-04 and/or 15-08. Accordingly, this report is not suitable for any other purpose.
Respectfully Submitted,
HOLMAN FRENIA ALLISON, P.C.
Michael Holt Public School Accountant Certified Public Accountant No. 1148
Medford, New Jersey December 4, 2015
199

This page intentionally left blank
200

EXH
IBIT
K-3
SCH
EDU
LE A
GR
AN
T O
RB
ALA
NC
ER
EPA
YM
ENT
(AC
CO
UN
TSU
NEA
RN
EDD
UE
TOFE
DER
AL
GR
AN
TOR
FED
ERA
LST
ATE
AT
OF
PRIO
RR
ECEI
VA
BLE
)R
EVEN
UE
GR
AN
TOR
PASS
TH
RO
UG
H G
RA
NTO
RC
FDA
PRO
JEC
TA
WA
RD
GR
AN
TJU
NE
30,
CA
SHB
UD
GET
AR
YY
EAR
S'A
T JU
NE
30,
AT
JUN
E 30
,A
T JU
NE
30,
PRO
GR
AM
TIT
L EN
UM
BER
NU
MB
ERA
MO
UN
TPE
RIO
D20
14R
ECEI
VED
EXPE
ND
ITU
RES
BA
LAN
CES
2015
2015
2015
U.S
. DE
PAR
TM
EN
T O
F A
GR
ICU
LT
UR
E P
ASS
ED
-TH
RO
UG
HST
AT
E D
EPA
RT
ME
NT
OF
ED
UC
AT
ION
: E
nter
pris
e Fu
nd:
F
ood
Dis
tribu
tion
Prog
ram
10.5
6533
,539
7/1/
14-6
/30/
15-
$
33,5
39$
(3
3,53
9)$
-
$
-
$
-$
-$
N
atio
nal S
choo
l Lun
ch P
rogr
am10
.555
123,
700
7/1/
13-6
/30/
14(7
,780
)
7,78
0
-
-
-
-
-
N
atio
nal S
choo
l Lun
ch P
rogr
am10
.555
119,
442
7/1/
14-6
/30/
15-
113,
578
(1
19,4
42)
-
(5
,864
)
-
-
To
tal U
.S. D
e par
tmen
t of E
duca
tion
(7,7
80)
15
4,89
7
(152
,981
)
-
(5,8
64)
-
-
U.S
. DE
PAR
TM
EN
T O
F A
GR
ICU
LT
UR
E P
ASS
ED
-TH
RO
UG
HST
AT
E D
EPA
RT
ME
NT
OF
ED
UC
AT
ION
:
Gen
eral
Fun
d:
Med
ical
Ass
ista
nce
Prog
ram
93.7
7814
,769
7/1/
14-6
/30/
15-
14,7
69
(14,
769)
-
-
-
-
To
tal G
ener
al F
und
-
14
,769
(1
4,76
9)
-
-
-
-
Spe
cial
Rev
enue
Fun
d:
Titl
e I -
Par
t A84
.010
NC
LB08
7015
84,1
977/
1/14
-6/3
0/15
-
61
,037
(7
3,46
9)
-
(1
2,43
2)
-
-
Titl
e I -
Par
t A84
.010
NC
LB08
7014
67,0
027/
1/13
-6/3
0/14
(9,3
99)
14
,414
(5
,015
)
-
-
-
T
itle
I - P
art A
84.0
10N
CLB
0870
1377
,541
9/1/
12-8
/31/
13(1
6,16
2)
16
,162
-
-
-
-
Titl
e II
- Pa
rt A
84.3
67N
CLB
0870
1527
,225
7/1/
14-6
/30/
15-
13,5
64
(19,
689)
-
(6,1
25)
-
-
T
itle
II -
Part
A84
.367
NC
LB08
7014
25,2
167/
1/13
-6/3
0/14
(11,
612)
12,3
45
(1,5
93)
-
(8
60)
-
-
Titl
e II
- Pa
rt A
84.3
67N
CLB
0870
1325
,770
9/1/
12-8
/31/
13(6
84)
684
-
-
-
-
-
T
itle
II -
Part
D84
.318
NC
LB08
7010
659
9/1/
09-8
/31/
10(2
01)
-
-
-
(2
01)
-
-
Titl
e II
I84
.365
AN
CLB
0870
152,
869
7/1/
14-6
/30/
15-
2,86
9
(2
,640
)
-
-
229
-
I.D
.E.A
. Par
t B, B
asic
Re g
ular
84.0
27ID
EA08
7015
539,
390
7/1/
14-6
/30/
15-
303,
179
(4
56,5
02)
-
(1
53,3
23)
-
-
I.D
.E.A
. Par
t B, B
asic
Re g
ular
84.0
27ID
EA08
7014
489,
631
7/1/
13-6
/30/
14(2
06,2
79)
24
8,19
2
(41,
913)
-
-
-
-
I.
D.E
.A. P
art B
, Bas
ic R
e gul
ar84
.027
IDEA
0870
1349
4,42
29/
1/12
-8/3
1/13
(9,9
21)
9,
921
-
-
-
-
-
Car
l D. P
erki
ns -
Seco
ndar
y84
.048
N/A
46,7
937/
1/14
-6/3
0/15
-
46
,766
(4
6,76
6)
-
-
-
-
Car
l D. P
erki
ns -
Seco
ndar
y84
.048
N/A
51,1
157/
1/13
-6/3
0/14
(3,4
29)
3,
429
-
-
-
-
-
Car
l D. P
erki
ns -
Seco
ndar
y84
.048
N/A
66,8
587/
1/12
-6/3
0/13
(1)
1
-
-
-
-
-
To
tal S
peci
al R
even
ue F
und
(257
,688
)
732,
563
(6
47,5
87)
-
(1
72,9
41)
22
9
-
Tota
l Fed
eral
Fin
anci
al A
ssis
tanc
e(2
65,4
68)
$
902,
229
$
(8
15,3
37)
$
-
$
(1
78,8
05)
$
22
9$
-
$
CL
EA
RV
IEW
RE
GIO
NA
L H
IGH
SC
HO
OL
DIS
TR
ICT
SCH
ED
UL
E O
F FE
DE
RA
L F
INA
NC
IAL
ASS
IST
AN
CE
FOR
FIS
CA
L Y
EA
R E
ND
ED
JU
NE
30,
201
5
201

EXH
IBIT
K-4
SC
HED
ULE
B
BA
LAN
CE
REP
AY
MEN
T(A
CC
OU
NTS
DU
E TO
GR
AN
T O
RA
TO
FR
ECEI
VA
BLE
)G
RA
NTO
RC
UM
ULA
TIV
E
S
TATE
GR
AN
TOR
/ST
ATE
PR
OJE
CT
AW
AR
DG
RA
NT
JUN
E 30
,C
ASH
BU
DG
ETA
RY
PRIO
R Y
EAR
AT
JUN
E 30
,A
T JU
NE
30,
BU
DG
ETA
RY
TOTA
L
P
RO
GR
AM
TIT
LEN
UM
BER
AM
OU
NT
PER
IOD
2014
REC
EIV
EDEX
PEN
DIT
UR
ESB
ALA
NC
ES20
1520
15R
ECEI
VA
BLE
EXPE
ND
ITU
RES
Stat
e D
epar
tmen
t of E
duca
tion:
G
ener
al F
und:
Equ
aliz
atio
n A
id15
-495
-034
-512
0-07
8$1
2,72
5,86
07/
1/14
-6/3
0/15
-$
12,7
25,8
60$
(12,
725,
860)
$
-
$
-
$
-$
(1
,164
,488
)$
12,7
25,8
60$
Cat
e gor
ical
Tra
nspo
rtatio
n A
id15
-495
-034
-512
0-01
440
9,46
47/
1/14
-6/3
0/15
-
409,
464
(4
09,4
64)
-
-
-
(37,
468)
40
9,46
4
Spe
cial
Edu
catio
n C
ateg
oric
al A
id15
-495
-034
-512
0-08
91,
397,
198
7/1/
14-6
/30/
15-
1,
397,
198
(1,3
97,1
98)
-
-
-
(127
,851
)
1,
397,
198
C
ate g
oric
al S
ecur
ity A
id15
-495
-034
-512
0-08
419
5,11
67/
1/14
-6/3
0/15
-
195,
116
(1
95,1
16)
-
-
-
(17,
854)
19
5,11
6
Und
er A
dequ
acy
Aid
15-4
95-0
34-5
120-
083
124,
697
7/1/
14-6
/30/
15-
12
4,69
7
(124
,697
)
-
-
-
(1
1,41
1)
124,
697
P
er P
u pil
Gro
wth
Aid
15-4
95-0
34-5
120-
097
25,2
007/
1/14
-6/3
0/15
-
25,2
00
(25,
200)
-
-
-
(2
,306
)
25,2
00
PA
RC
C R
eadi
ness
Ai d
15-4
95-0
34-5
120-
098
25,2
007/
1/14
-6/3
0/15
-
25,2
00
(25,
200)
-
-
-
(2
,306
)
25,2
00
Ext
raor
dina
r y A
id14
-100
-034
-512
0-47
327
6,71
17/
1/13
-6/3
0/14
(276
,711
)
276,
711
-
-
-
-
-
-
Ext
raor
dina
r y A
id15
-100
-034
-512
0-47
329
2,38
37/
1/14
-6/3
0/15
-
-
(292
,383
)
-
(292
,383
)
-
-
292,
383
N
onbu
d get
ed:
Rei
mbu
rsed
TPA
F So
cia l
S
ecur
ity C
ontri
butio
n15
-495
-034
-509
5-00
21,
026,
345
7/1/
14-6
/30/
15-
97
6,18
8
(1,0
26,3
45)
-
(5
0,15
7)
-
-
1,02
6,34
5
Rei
mbu
rsed
TPA
F So
cia l
S
ecur
ity C
ontri
butio
n14
-495
-034
-509
5-00
21,
023,
383
7/1/
13-6
/30/
14(5
0,09
7)
50,0
97
-
-
-
-
-
-
On-
Beh
alf T
PAF
Pens
ion
Con
tribu
tion s
14-4
95-0
34-5
095-
001
723,
528
7/1/
14-6
/30/
15-
72
3,52
8
(723
,528
)
-
-
-
-
723,
528
On-
Beh
alf T
PAF
Post
-Ret
irem
ent M
edic
a l14
-495
-034
-509
5-00
11,
148,
599
7/1/
14-6
/30/
15-
1,
148,
599
(1,1
48,5
99)
-
-
-
-
1,
148,
599
N
on-P
ublic
Tra
nspo
rtatio
n A
id
15-4
95-0
34-5
120-
473
41,5
727/
1/14
-6/3
0/15
-
-
(41,
572)
-
(41,
572)
-
-
41
,572
N
on-P
ublic
Tra
nspo
rtatio
n A
id
14-4
95-0
34-5
120-
473
64,2
237/
1/13
-6/3
0/14
(64,
223)
64
,223
-
-
-
-
-
-
Hom
eles
s Tui
tion
N\A
11,0
007/
1/13
-6/3
0/14
(11,
000)
11
,000
-
-
-
-
-
-
Hom
eles
s Tui
tion
N\A
4,69
07/
1/14
-6/3
0/15
-
-
(4,6
90)
-
(4
,690
)
-
-
4,
690
S
peci
al R
even
ue F
und:
Pass
ed-S
tate
De p
artm
ent o
f Edu
catio
n:
N
.J. A
chie
vem
ent G
rant
N/A
70,0
007/
1/14
/6/3
0/15
-
-
(23,
220)
-
(23,
220)
-
-
23
,220
N
.J. N
onpu
blic
Aid
:
Te
xtbo
ok A
i d15
-100
-034
-512
0-06
414
,001
7/1/
14-6
/30/
15-
14
,001
(3
,619
)
-
-
10
,382
-
3,
619
Text
book
Ai d
14-1
00-0
34-5
120-
064
14,0
977/
1/13
-6/3
0/14
4,71
5
-
-
(4
,715
)
-
-
-
-
Nur
sin g
Ser
vice
s15
-100
-034
-512
0-07
022
,384
7/1/
14-6
/30/
15-
22
,384
(2
2,38
4)
-
-
-
-
22
,384
Te
chno
logy
15-1
00-0
34-5
120-
373
7,52
07/
1/14
-6/3
0/15
-
7,52
0
(7
,351
)
-
-
16
9
-
7,35
1
Te
chno
logy
14-1
00-0
34-5
120-
373
5,14
07/
1/13
-6/3
0/14
25
-
-
(2
5)
-
-
-
-
Aux
iliar
y Se
rvic
es:
C
ompe
nsat
ory
Educ
atio
n15
-100
-034
-512
0-06
719
,719
7/1/
14-6
/30/
15-
19
,719
(1
1,28
7)
-
-
8,43
2
-
11
,287
Com
pens
ator
y Ed
ucat
ion
14-1
00-0
34-5
120-
067
21,4
007/
1/13
-6/3
0/14
7,44
9
-
-
(7
,449
)
-
-
-
-
H
ome
Inst
ruct
ion
14-1
00-0
34-5
120-
067
6,55
87/
1/13
-6/3
0/14
(6,5
59)
6,55
9
-
-
-
-
-
-
H
ome
Inst
ruct
ion
15-1
00-0
34-5
120-
067
1,76
07/
1/14
-6/3
0/15
-
-
(1,7
60)
-
(1
,760
)
-
-
1,
760
T
rans
porta
tion
14-1
00-0
34-5
120-
068
6,28
67/
1/13
-6/3
0/14
1,34
5
-
-
(1
,345
)
-
-
-
-
T
rans
porta
tion
15-1
00-0
34-5
120-
068
2,82
37/
1/14
-6/3
0/15
-
2,82
3
(1
,695
)
-
-
1,
128
-
1,69
5
H
andi
capp
ed S
ervi
ces:
C
orre
ctiv
e S p
eech
15-1
00-0
34-5
120-
066
2,65
07/
1/14
-6/3
0/15
-
2,65
0
-
-
-
2,
650
-
-
C
orre
ctiv
e S p
eech
14-1
00-0
34-5
120-
066
2,34
47/
1/13
-6/3
0/14
782
-
-
(7
82)
-
-
-
-
E
xam
inat
ion
& C
lass
ifica
tion
15-1
00-0
34-5
120-
066
9,37
27/
1/14
-6/3
0/15
-
9,37
2
(7
,566
)
-
-
1,
806
-
7,56
6
Exa
min
atio
n &
Cla
ssifi
catio
n14
-100
-034
-512
0-06
615
,765
7/1/
13-6
/30/
141,
596
-
-
(1,5
96)
-
-
-
-
Su p
plem
enta
ry In
stru
ctio
n15
-100
-034
-512
0-06
67,
054
7/1/
14-6
/30/
15-
7,
054
(4,7
87)
-
-
2,26
7
-
4,
787
S
u ppl
emen
tary
Inst
ruct
ion
14-1
00-0
34-5
120-
066
6,80
07/
1/13
-6/3
0/14
556
(5
56)
-
-
-
-
S
ubto
tal S
tate
Fin
anci
al A
ssis
tanc
e(3
92,1
22)
18
,245
,163
(1
8,22
3,52
1)
(16,
468)
(4
13,7
82)
26,8
34
(1
,363
,684
)
18,2
23,5
21
Stat
e D
epar
tmen
t of E
duca
tion:
D
ebt S
ervi
ce F
und:
Deb
t Ser
vice
Aid
Typ
e II
15-4
95-0
34-5
120-
075
475,
946
7/1/
14-6
/30/
15-
47
5,94
6
(475
,946
)
-
-
-
-
475,
946
St
ate
Dep
artm
ent o
f Agr
icul
ture
:
Ent
erpr
ise
Fund
:
N
atio
nal S
choo
l Lun
ch P
rogr
am
(St
ate
Shar
e)14
-100
-010
-336
0-06
75,
578
7/1/
13-6
/30/
14(6
33)
63
3
-
-
-
-
-
-
N
atio
nal S
choo
l Lun
ch P
rogr
am
(St
ate
Shar
e)15
-100
-010
-336
0-06
74,
865
7/1/
14-6
/30/
15-
4,
500
(4,8
65)
-
(3
65)
-
-
4,
865
Subt
otal
Sta
te F
inan
cial
Ass
ista
nce
(633
)
481,
079
(4
80,8
11)
-
(3
65)
-
-
48
0,81
1
G
rand
Tot
al S
tate
Fin
anci
al A
ssis
tanc
e(3
92,7
55)
$
18
,726
,242
$
(1
8,70
4,33
2)
(16,
468)
$
(4
14,1
47)
$
26,8
34$
(1
,363
,684
)$
18,7
04,3
32$
Less
: Gra
nts N
ot S
ubje
ct to
New
Jers
ey O
MB
Circ
ular
04-
04:
O
n-B
ehal
f TPA
F Pe
nsio
n C
ontri
butio
ns15
-495
-034
-509
5-00
172
3,52
87/
1/14
-6/3
0/15
723,
528
On-
Beh
alf T
PAF
Post
-Ret
irem
ent M
edic
a l15
-495
-034
-509
5-00
11,
148,
599
7/1/
14-6
/30/
151,
148,
599
Tota
l Sta
te F
inan
cial
Ass
ista
nce
subj
ect t
o N
ew Je
rsey
OM
B C
ircul
ar 0
4-04
(16,
832,
205)
$
MEM
O
CL
EA
RV
IEW
RE
GIO
NA
L H
IGH
SC
HO
OL
DIS
TR
ICT
SCH
ED
UL
E O
F ST
AT
E F
INA
NC
IAL
ASS
IST
AN
CE
FOR
FIS
CA
L Y
EA
R E
ND
ED
JU
NE
30,
201
5
202

EXHIBIT K-5 (Page 1 of 2)
CLEARVIEW REGIONAL HIGH SCHOOL DISTRICT NOTES TO THE SCHEDULES OF FINANCIAL ASSISTANCE
JUNE 30, 2015 Note 1. General The accompanying schedules of expenditures of federal awards and state financial assistance include federal and state award activity of the Board of Education, Clearview Regional High School District. The Board of Education is defined in Note 1 to the Board’s basic financial statements. All federal and state awards received directly from federal and state agencies, as well as federal awards and state financial assistance passed through other government agencies is included on the schedule of expenditures of federal awards and state financial assistance. Note 2. Basis of Accounting The accompanying schedules of expenditures of awards and financial assistance are presented on the budgetary basis of accounting with the exception of programs recorded in the food service fund, which are presented using the accrual basis of accounting. These basis of accounting are described in Note 1 to the Board’s basic financial statements. Note 3. Relationship to Basic Financial Statements The basic financial statements present the general fund and special revenue fund on a GAAP basis. Budgetary comparison statements or schedules (RSI) are presented for the general fund and special revenue fund to demonstrate finance related legal compliance in which certain revenue is permitted by law or grant agreement to be recognized in the audit year, whereas for GAAP reporting, revenue is not recognized until the subsequent year or when expenditures have been made. The general fund is presented in the accompanying schedules on the modified accrual basis with the exception of the revenue recognition of the last state aid payment in the current budget year, which is mandated pursuant to N.J.S.A.18A:22-44.2. For GAAP purposes that payment is not recognized until the subsequent budget year due to the state deferral and recording of the last state aid payment in the subsequent year. The special revenue fund is presented in the accompanying schedules on the grant accounting budgetary basis, which recognizes encumbrances as expenditures and also recognizes the related revenues, whereas the GAAP basis does not. The special revenue fund also recognizes the last state aid payment in the current budget year, consistent with N.J.S.A.18A:22-4.2. The net adjustment to reconcile from the budgetary basis to the GAAP basis is $7,051 for the general fund and $0 for the special revenue fund. See Exhibit C-3 for a reconciliation of the budgetary basis to the modified accrual basis of accounting for the general and special revenue funds. Awards and financial assistance revenues are reported in the Board’s basic financial statements on a GAAP basis as presented as follows:
203

EXHIBIT K-5 (Page 2 of 2)
CLEARVIEW REGIONAL HIGH SCHOOL DISTRICT NOTES TO THE SCHEDULES OF FINANCIAL ASSISTANCE
JUNE 30, 2015 Note 3. Relationship to Basic Financial Statements (continued): Federal State Total General Fund $ 14,769 $18,142,213 $18,156,982 Special Revenue Fund 647,587 83,668 731,255 Food Service Fund 152,981 4,865 157,846 Debt Service Fund - 475,946 475,946 Total Financial Assistance $815,337 $18,706,692 $19,522,029 Note 4. Relationship to Federal and State Financial Reports Amounts reported in the accompanying schedules agree with the amounts reported in the related federal and state financial reports. Note 5. Other Revenues and expenditures reported under the Food Distribution Program represents current year value received and current year distributions respectively. The amount reported as TPAF Pension Contributions represents the amount paid by the state on behalf of the District for the year ended June 30, 2015. TPAF Social Security Contributions represents the amount reimbursed by the state for the employer’s share of social security contributions for TPAF members for the year ended June 30, 2015. Note 6. Federal and State Loans Outstanding The Clearview Regional High School Board of Education had no loan balances outstanding at June 30, 2015.
204

EXHIBIT K-6 (Page 1 of 3)
CLEARVIEW REGIONAL HIGH SCHOOL DISTRICT SCHEDULE OF FINDINGS & QUESTIONED COSTS
For the Fiscal Year Ended June 30, 2015
Section I – Summary of Auditor’s Results Financial Statements Type of auditor’s report issued: Unmodified Internal control over financial reporting: 1) Material weakness(es) identified? No 2) Significant deficiencies identified that are not considered to be material weaknesses? None Reported Noncompliance material to basic financial Statements noted? None Reported Federal Awards Internal Control over major programs: 1) Material weakness(es) identified? No 2) Significant deficiencies identified that are not considered to be material weaknesses? None Reported Type of auditor’s report issued on compliance for major programs Unmodified Any audit findings disclosed that are required to be reported in accordance With Section .510(a) of Circular A-133? No Identification of major programs: CFDA Number(s) Name of Federal Program or Cluster
84.027 I.D.E.A. B, Regular
Dollar threshold used to distinguish between type A and type B programs: $300,000 Auditee qualified as low-risk auditee? Yes
205
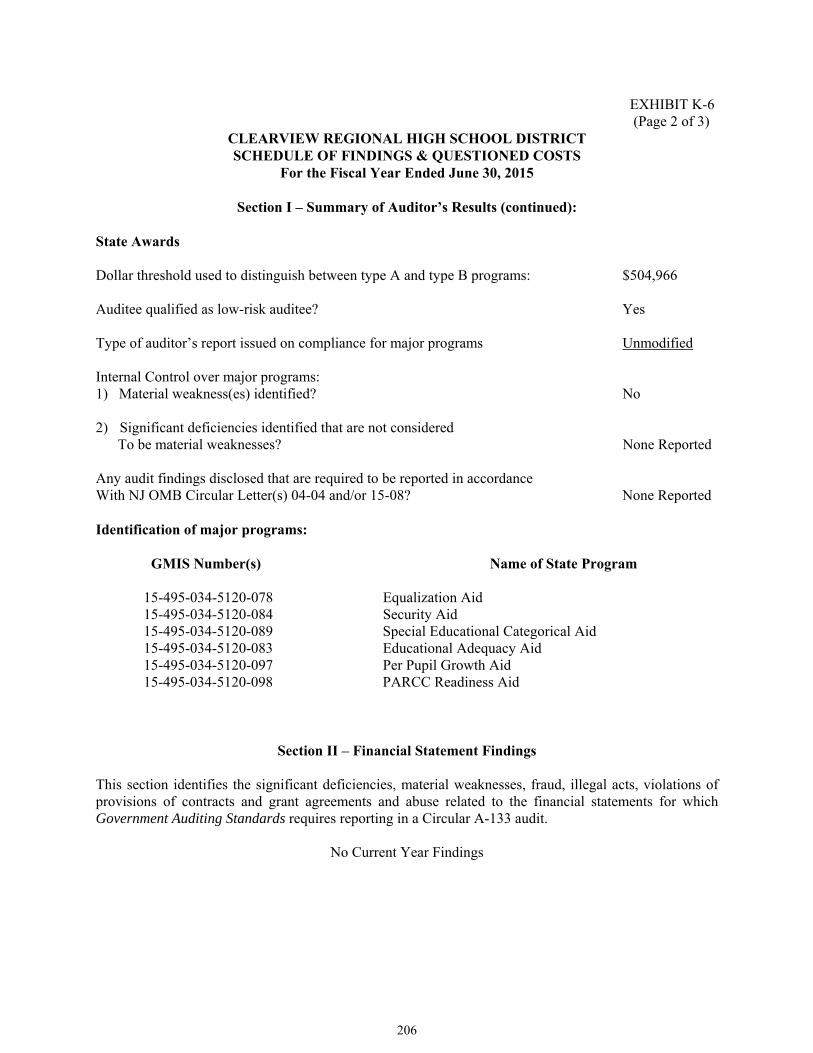
EXHIBIT K-6 (Page 2 of 3)
CLEARVIEW REGIONAL HIGH SCHOOL DISTRICT SCHEDULE OF FINDINGS & QUESTIONED COSTS
For the Fiscal Year Ended June 30, 2015
Section I – Summary of Auditor’s Results (continued): State Awards Dollar threshold used to distinguish between type A and type B programs: $504,966 Auditee qualified as low-risk auditee? Yes Type of auditor’s report issued on compliance for major programs Unmodified Internal Control over major programs: 1) Material weakness(es) identified? No 2) Significant deficiencies identified that are not considered To be material weaknesses? None Reported Any audit findings disclosed that are required to be reported in accordance With NJ OMB Circular Letter(s) 04-04 and/or 15-08? None Reported Identification of major programs: GMIS Number(s) Name of State Program
15-495-034-5120-078 Equalization Aid 15-495-034-5120-084 Security Aid 15-495-034-5120-089 Special Educational Categorical Aid 15-495-034-5120-083 Educational Adequacy Aid 15-495-034-5120-097 Per Pupil Growth Aid 15-495-034-5120-098 PARCC Readiness Aid
Section II – Financial Statement Findings This section identifies the significant deficiencies, material weaknesses, fraud, illegal acts, violations of provisions of contracts and grant agreements and abuse related to the financial statements for which Government Auditing Standards requires reporting in a Circular A-133 audit.
No Current Year Findings
206

EXHIBIT K-6 (Page 3 of 3)
CLEARVIEW REGIONAL HIGH SCHOOL DISTRICT SCHEDULE OF FINDINGS & QUESTIONED COSTS (continued):
For the Fiscal Year Ended June 30, 2015
Section III – Federal Awards & State Financial Assistance Finding & Questioned Costs This section identifies audit findings required to be reported by section .510(a) of Circular A-133 and New Jersey OMB’s Circular Letter(s) 04-04 and/or 15-08.
No Current Year Findings
207

EXHIBIT K-7 CLEARVIEW REGIONAL HIGH SCHOOL DISTRICT SUMMARY SCHEDULE OF PRIOR AUDIT FINDINGS
AND QUESTIONED COSTS AS PREPARED BY MANAGEMENT For the Fiscal Year Ended June 30, 2015
This section identifies the status of prior-year findings related to the basic financial statements and federal and state awards that are required to be reported in accordance with Chapter 6.12 of Government Auditing Standards, U.S. OMB Circular A-133 (section .315 (a)(b)) and New Jersey OMB’s Circular 04-04.
No Prior Year Findings
208