Embed Size (px)
DESCRIPTION
Contains statistics and analysis on rubbish picked up during Clean Up Australia Day 2009 held on Sunday 1st March 2009.
Citation preview
Clean Up Australia DayRubbish Report 2009
Clean Up Australia Day - Rubbish Report 2009Page Clean Up Australia Day - Rubbish Report 2009Page Clean Up Australia Day - Rubbish Report 2009Page 2
Contents
Introduction......................................................................Overall Trends.................................................................Executive Summary.........................................................Methodology....................................................................Surveyed Sites................................................................. Returned Valid Surveys By State.......................... Returned Valud Surveys By Site Type..................Major Sources of Rubbish................................................Historical Comparison......................................................Major Sources of Rubbish................................................ Plastic.................................................................... Miscellaneous........................................................ Metal & Aluminium................................................. Glass...................................................................... Paper & Cardboard................................................ Polystyrene............................................................ Wood..................................................................... Rubber...................................................................Top Ten Rubbish Items....................................................Most ‘Polluted’ Sites........................................................Site Rubbish Composition...............................................A First in 2009: The Great Northern Clean Up.................Container Deposits - the incentive to recycle..................
345788910111213141516171818192021222324
With thanks to our Sponsors and Supporters:
MAJOR SPONSORS
SPONSORS SUPPLIERS

Clean Up Australia Day - Rubbish Report 2009 Page Clean Up Aust Dayralia Day - Rubbish Report 2009 Page Clean Up Australia Day - Rubbish Report 2009 Page 3
Introduction
The success of Clean Up Australia Day is quite astonishing.
There are not many community events which stand the test of
time, continue to remain relevant and continue to inspire action.
Over the years, volunteer numbers have grown, as has the
amount of rubbish collected. The diversity of the type of groups
who are involved has also grown and so too has the longevity
of these groups’ involvement. Clean Up Australia would like
specially acknowledge those dedicated site coordinators and
volunteers who give up their time to plan, prepare and implement
their Clean Up Day activities.
There are a number of environmental issues which Clean Up
Australia has addressed through the campaign over the years.
These have included cigarette butts, illegal dumping, plastic
bags, mobile phones, waste stewardship, packaging, recycling,
e-waste and climate change.
Many of these issues form part of Clean Up Australia’s year
round activities and campaigning.
Our aim is to ensure that the awareness raised from highlighting
particular issues on Clean Up Australia Day resonates with
people throughout the year in their daily lives..
In 2009, the focus was on recycling. Rather than sending plastic,
metal, glass and paper to landfill, diverting these materials back
into the manufacturing mix brings huge energy savings and
reduces the need for virgin material.
We are only at the beginning of our journey in adapting to and
fighting climate change; and simple practical solutions such as
recycling will become increasingly critical over the coming years.
Through the introduction of yellow bags rubbish removed by
volunteers this year was sorted for recycling. From the results
in this Report, it can be seen just how much of the rubbish
we throw away is recyclable. The provision of yellow bags for
recycling at Clean Up sites is proving to be a success in both
environmental outcomes and raising community awareness on
how valuable resources are being wasted.
Almost all local Councils across the country now have the
facilities to recycle rubbish and most make it as easy as
separating into two bins when you take the rubbish to the kerb.
Councils also actively support Clean Up Australia Day and their
contribution is greatly appreciated by all involved.
Over 600,000 volunteers cleaned up just under 7,000 sites in
2009, and the result was over 8,300 tonnes of rubbish removed
from the environment. Around one in eight sites participated
in the survey which produces this Rubbish Report, sampling
around 10% or more of the rubbish they removed.
This is the 19th annual Rubbish Report providing us a snapshot
of rubbish trends over time.
Clean Up Australia Day - Rubbish Report 2009Page
Overall Trends
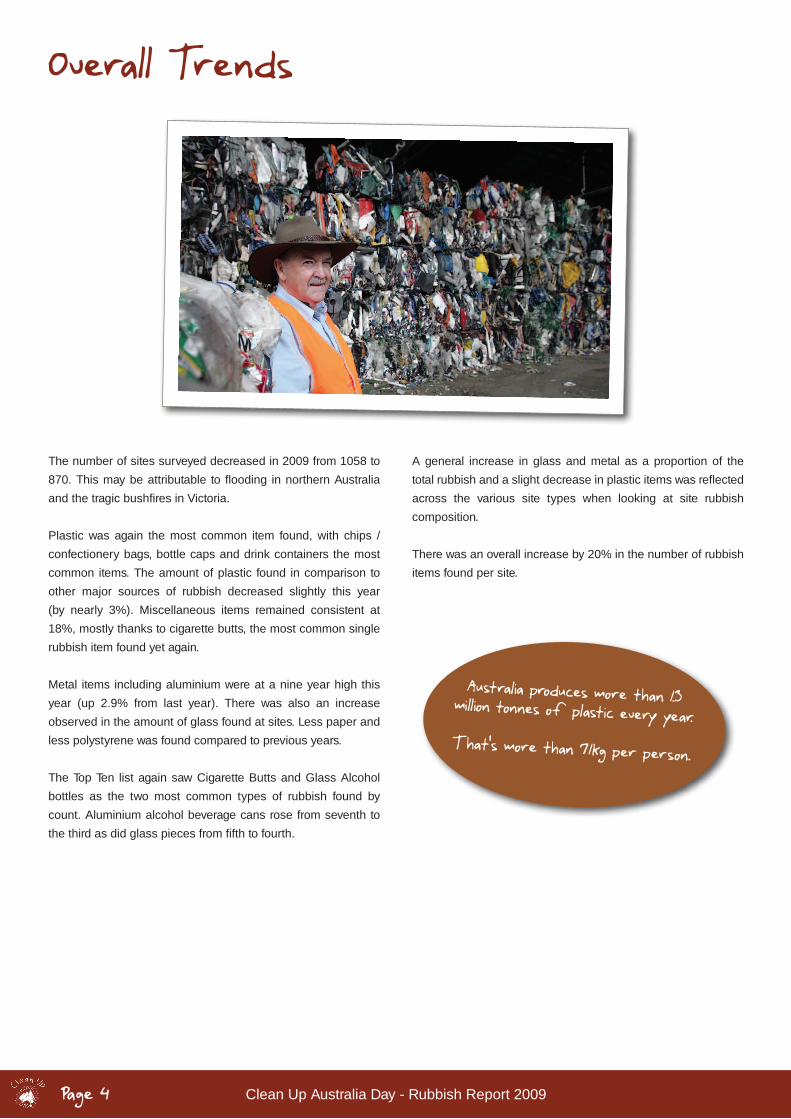
The number of sites surveyed decreased in 2009 from 1058 to
870. This may be attributable to flooding in northern Australia
and the tragic bushfires in Victoria.
Plastic was again the most common item found, with chips /
confectionery bags, bottle caps and drink containers the most
common items. The amount of plastic found in comparison to
other major sources of rubbish decreased slightly this year
(by nearly 3%). Miscellaneous items remained consistent at
18%, mostly thanks to cigarette butts, the most common single
rubbish item found yet again.
Metal items including aluminium were at a nine year high this
year (up 2.9% from last year). There was also an increase
observed in the amount of glass found at sites. Less paper and
less polystyrene was found compared to previous years.
The Top Ten list again saw Cigarette Butts and Glass Alcohol
bottles as the two most common types of rubbish found by
count. Aluminium alcohol beverage cans rose from seventh to
the third as did glass pieces from fifth to fourth.
A general increase in glass and metal as a proportion of the
total rubbish and a slight decrease in plastic items was reflected
across the various site types when looking at site rubbish
composition.
There was an overall increase by 20% in the number of rubbish
items found per site.
Australia produces more than 1.3 million tonnes of plastic every year.
That’s more than 71kg per person.
4

Clean Up Australia Day - Rubbish Report 2009 Page
Executive Summary
The Clean Up Australia Rubbish Report is a snapshot of the rubbish collected on Clean Up Australia Day. First produced in 1991, the Rubbish Report has proven to be an invaluable resource in identifying trends in the types and dispersal of rubbish throughout Australia and highlights the importance of avoiding, reducing, re-using and recycling rubbish.
SITES SURVEYED
• Of the registered 6,909 Clean Up sites, 870 or 12.6% were analysed for this report.
• With the recent integration of both the End of Clean Up Report and the Rubbish Report, the data being provided is more robust and can be more consistently analysed.
• This year, the total number of End of Clean Up and Rubbish reports submitted was 2,856, representing 41% of all sites.
• 345,100 rubbish items were surveyed at sites across the country.
• A total of 14,459 bags, representing 27% of rubbish at survey sites were counted. This is above and beyond the requested 10% that the volunteers survey.
• New South Wales (NSW) once again returned the highest number of surveys (354), and this year Victoria returned the second highest (176) overtaking Queensland (155).
• Shops / Malls and River / Creeks increased their proportion of submitted surveys/rubbish items per site. All other site
types decreased.
• Of the 870 surveys returned, almost 23.7% (or 206) were from Rivers / Creeks and just over 1% were from Shops / Malls.
• There was an overall increase by 20% in the number of rubbish items found per site, from 344 pieces to 397 pieces.
RUBBISH SOURCES
Plastic was the most common item representing 29% of all rubbish items removed (a slight decrease from 32% in 2008). This is the 15th year that Plastic has dominated the Major Sources of Rubbish.
Chips / confectionery bags, bottle caps and drink containers were the most common plastic items found yet again.
Miscellaneous items were the second most common source of rubbish at 18% of the total. Cigarette Butts fall into the Miscellaneous category influencing the placement of thiscategory as a major source of rubbish.
Metal (including Aluminium), Glass and Paper all remained in similar proportion within the major sources of rubbish at 17%, 16% and 13% respectively – consistent in order with 2008, though showing a slight increase in percentage.
Polystyrene, Wood and Rubber made up the three smallest sources of rubbish again in 2009 at 4%, 2% and 1% of the total.
5

Clean Up Australia Day - Rubbish Report 2009Page
• Cigarette Butts were the most commonly found item for the fourteenth year in a row. They represented 27% of the top ten, and 15.7% of all rubbish.
• Glass alcoholic beverage containers retained their 2nd place in 2009, representing 11% of the top ten and 6.3% of the total rubbish found.
• Aluminium alcohol beverage ranked third this year, up from 7th in 2008.
• Glasspiecesrosetofourthfromfifththisyear.
• Six of the Top Ten items were related to beverage containers including bottle caps and glass pieces. These beverage container related items made up 29.7% of the top ten items including glass pieces.
• These items which are related to beverage containers also are the majority of the recyclable items among the Top Ten.
• Eight out of the Top Ten items were packaging materials, including packaging for food or beverages. This makes up 65.4% of all of the Top 10 Items found.
• Single use singlet style plastic bags ranked 16th this year, an elevation of 2 places from 2008.
Consistent with 2008, Outdoor Transport sites again had the highest average number of rubbish pieces per site (512).
Beach / Coastal areas surged ahead of other site types this year to become the second most polluted site type with an average of 462 pieces per site.
In 2008, Roadways were the second most polluted site, but this year dropped to the second least polluted site with an average of 260 items per site.
Shops / Malls were the least polluted with 207 pieces per site.
Since 2004 when there was an average of 592 pieces per site, there has been a general decline in the number of pieces per site. Inconsistent with this decline was this year’s results which saw a spike in the volume of rubbish at each site.
Executive Summary - continued
Most Polluted Site Types
1. Outdoor Transport2. Beach / Coastal3. School Grounds4. River / Creeks5. Public Bushland6. Parks 7. Roadways8. Shops / Malls
Interesting items found in
2009 included: an anchor, a
Korean flag, a waterbed,
half a boat, an antique pick
axe and a rubber snake!
Top 10 Rubbish Items
1. Cigarette Butts
2. Glass Alcohol Bottles
3. Aluminium Alcohol Cans
4. Glass Pieces5. Plastic Chips & Confectionary Bags
6. Plastic bottle caps
7. Small Paper Pieces
8. Aluminium Soft Drink Cans
9. Plastic PET Drink Containers
10.. Foil confectionery wrappers
6
Clean Up Australia Day - Rubbish Report 2009 Page
Methodology
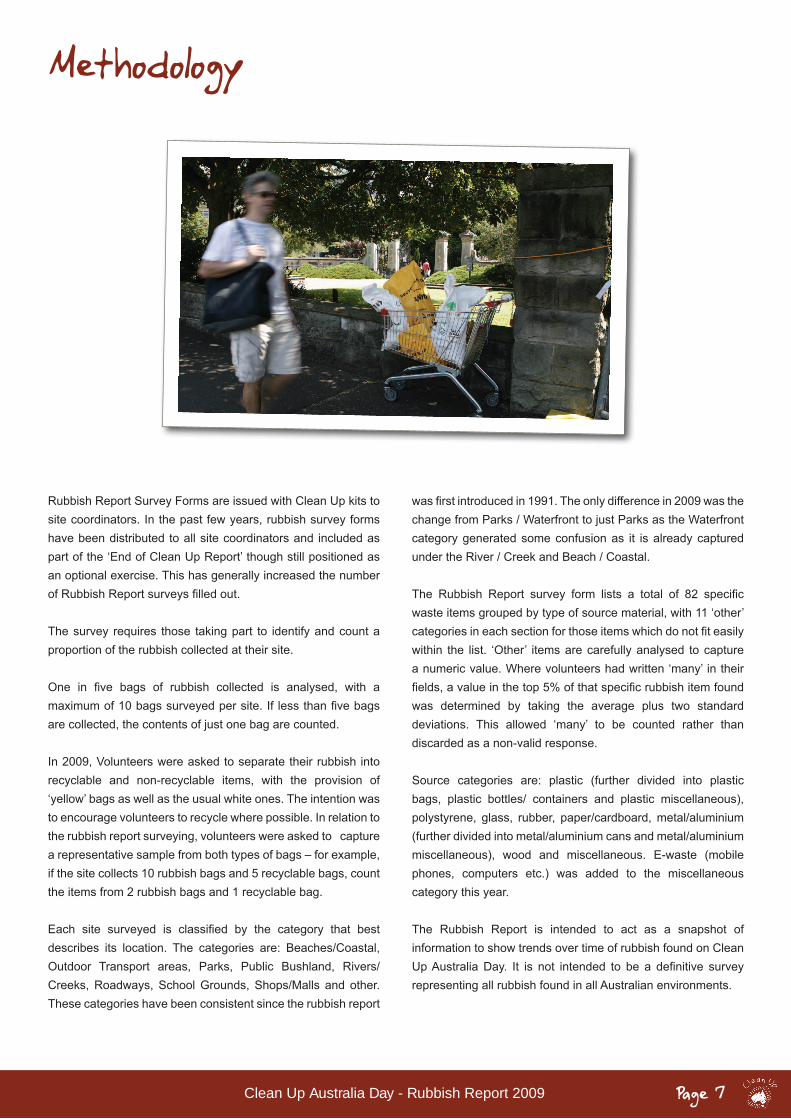
Rubbish Report Survey Forms are issued with Clean Up kits to site coordinators. In the past few years, rubbish survey forms have been distributed to all site coordinators and included as part of the ‘End of Clean Up Report’ though still positioned as an optional exercise. This has generally increased the number ofRubbishReportsurveysfilledout. The survey requires those taking part to identify and count a proportion of the rubbish collected at their site.
One in five bags of rubbish collected is analysed, with amaximumof10bagssurveyedpersite.If lessthanfivebagsare collected, the contents of just one bag are counted. In 2009, Volunteers were asked to separate their rubbish into recyclable and non-recyclable items, with the provision of ‘yellow’ bags as well as the usual white ones. The intention was to encourage volunteers to recycle where possible. In relation to the rubbish report surveying, volunteers were asked to capture a representative sample from both types of bags – for example, if the site collects 10 rubbish bags and 5 recyclable bags, count the items from 2 rubbish bags and 1 recyclable bag.
Each site surveyed is classified by the category that bestdescribes its location. The categories are: Beaches/Coastal, Outdoor Transport areas, Parks, Public Bushland, Rivers/Creeks, Roadways, School Grounds, Shops/Malls and other. These categories have been consistent since the rubbish report
wasfirstintroducedin1991.Theonlydifferencein2009wasthechange from Parks / Waterfront to just Parks as the Waterfront category generated some confusion as it is already captured under the River / Creek and Beach / Coastal.
The Rubbish Report survey form lists a total of 82 specificwaste items grouped by type of source material, with 11 ‘other’ categoriesineachsectionforthoseitemswhichdonotfiteasilywithin the list. ‘Other’ items are carefully analysed to capture a numeric value. Where volunteers had written ‘many’ in their fields,avalueinthetop5%ofthatspecificrubbishitemfoundwas determined by taking the average plus two standard deviations. This allowed ‘many’ to be counted rather than discarded as a non-valid response.
Source categories are: plastic (further divided into plastic bags, plastic bottles/ containers and plastic miscellaneous), polystyrene, glass, rubber, paper/cardboard, metal/aluminium (further divided into metal/aluminium cans and metal/aluminium miscellaneous), wood and miscellaneous. E-waste (mobile phones, computers etc.) was added to the miscellaneous category this year.
The Rubbish Report is intended to act as a snapshot of information to show trends over time of rubbish found on Clean UpAustraliaDay. It is not intended to be a definitive surveyrepresenting all rubbish found in all Australian environments.
7

Clean Up Australia Day - Rubbish Report 2009Page
In 2009, there were 2,856 ‘End of Clean Up’ forms returned to Clean Up Australia out of the estimated 6,909 participating sites. This represents 41% of all sites.
Since 1991, Clean Up Australia has been asking Site Supervisors to not only return information about their site i.e. no. of volunteers, interesting items etc. but also to complete the ‘Rubbish Survey’ – an inventory of approximately 10% of the rubbish they collected on the day. This data, once returned to Clean Up Australia culminates in the annual ‘Rubbish Report’.
In 2009, there were 870 surveys returned with correctly completed ‘Rubbish Surveys’: that is, approximately one third of forms returned. The sample size for this report is 12.6% of all sites participating in the Clean Up Australia Day campaign. This was a slight decrease from 17.7% from 2008.
Data on all rubbish items surveyed has been collated and analysed for this report. To see all of the results organised by both State and Site Type, please refer to separate data tables ‘Surveyed Items by Site Type’ and ‘Surveyed Items by State’ – these tables are too large to include in this document.
Surveyed Sites
Returned Valid Surveys By State
The ‘Returned Valid Surveys by State’ chart shows the number of valid Rubbish Report surveys received from each State.
New South Wales (NSW) once again returned the highest number of surveys (354). This year Victoria returned the second most (176) overtaking Queensland (155).
Three States increased their proportion of returned valid surveys compared to other States (ACT, Tasmania and Western Australia) andtherestdecreasedslightly.NSW,VictoriaandQueenslandreturnedthemostnumberofsurveysreflectiveofthehigherproportion
Of the 2,856 surveys which were returned containing site information only (not an analysis of the rubbish collected) the majority of these were also from NSW (41%) followed by Victoria and Queensland (20%, 18%). The table below shows the returned valid surveys by State – these are forms which had their rubbish surveys completed and analysed for this report.
8
NSW
VIC
QLD
SA
WA
TAS
ACT
NT
Sta
te
0 50 100 150 200 250 300 350 400
Number of Surveys
354
176
155
63
62
40
16
4
Clean Up Australia Day - Rubbish Report 2009 Page
Returned Valid Surveys By Site Type
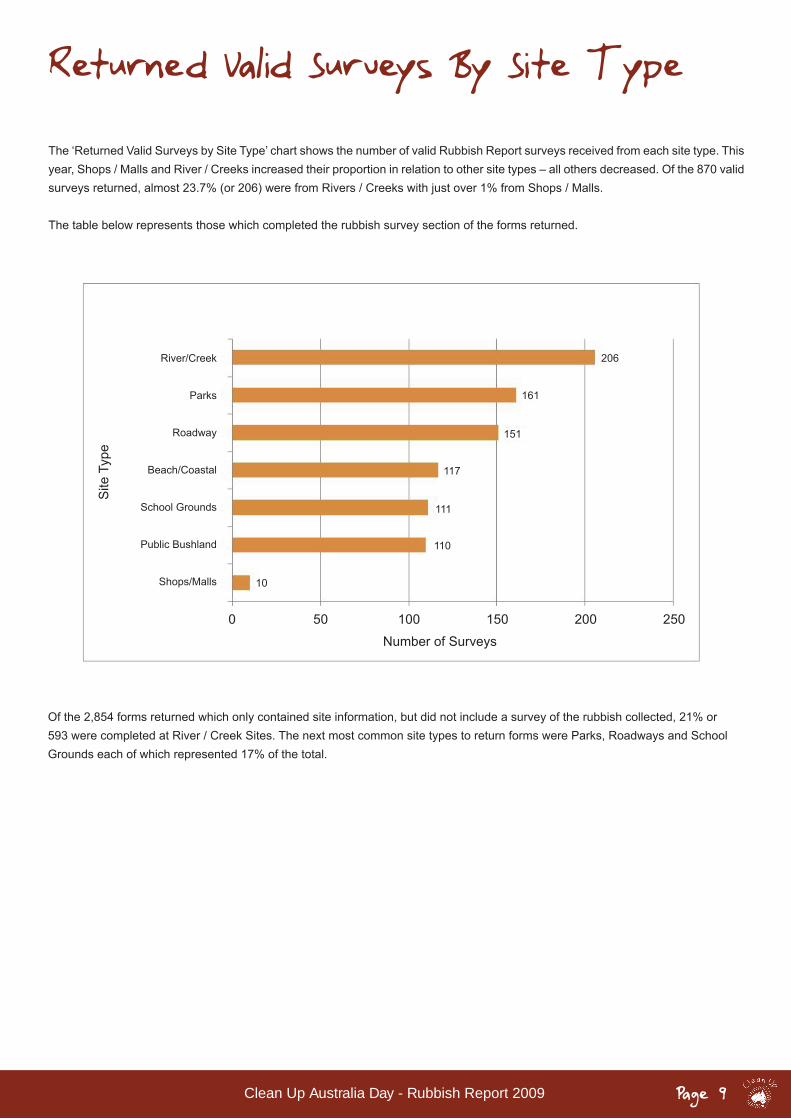
The ‘Returned Valid Surveys by Site Type’ chart shows the number of valid Rubbish Report surveys received from each site type. This year, Shops / Malls and River / Creeks increased their proportion in relation to other site types – all others decreased. Of the 870 valid surveys returned, almost 23.7% (or 206) were from Rivers / Creeks with just over 1% from Shops / Malls.
The table below represents those which completed the rubbish survey section of the forms returned.
Of the 2,854 forms returned which only contained site information, but did not include a survey of the rubbish collected, 21% or 593 were completed at River / Creek Sites. The next most common site types to return forms were Parks, Roadways and School Grounds each of which represented 17% of the total.
9
River/Creek
Parks
Roadway
Beach/Coastal
School Grounds
Public Bushland
Shops/Malls
Site
Typ
e
0 50 100 150 200 250Number of Surveys
206
161
151
117
111
110
10

Clean Up Australia Day - Rubbish Report 2009Page
Major Sources of RubbishThe ‘Major Sources of Rubbish’ chart shows the types of rubbish surveyed and the proportion they represent of the total rubbish surveyed.
SummaryPLASTICPlastic was yet again the most common type of rubbish found on Clean Up Australia Day. This has consistently been the dominant rubbish category found in Clean Up Australia Day rubbish surveys. This year, it made up 29% of all rubbish found, which compares to 31.7% in 2008.
MISCELLANEOUSMiscellaneous items were the second largest source of rubbish in 2009 next to Plastics, consistent with 2008’s results. These items represented 17.8% of the total items found at sites. There were 61,514 miscellaneous items found at sites, 88% of which were cigarette butts. There was an average of 71 items found per site.
METAL AND ALUMINIUMMetal and aluminium represented 17.5% of all the rubbish surveyed on Clean Up Australia Day, a marked increase on 2008 at 14.6%. This shows a steady trend of increasing over the last eight years, with 2009 the highest since 2000.
GLASSGlass accounted for 16.4% of all rubbish surveyed in 2009. This is an increase of 3.3% from 2008. Glass appears to be on an upward trend, slowly increasing from 10.1% in 2000 to its current peak of 16.4%, with the exception of 2008 when it sat at 13.1%. Within this category, alcohol beverage bottles continue to dominate representing 48.2% of the total glass rubbish found, almost 7% more than last year.
PAPER AND CARDBOARDPaper and cardboard accounted for 12.7% of the total rubbish surveyed in 2009, consistent with 2008’s 12.6%. There were 43,684 paper rubbish items surveyed, showing an average of 50 pieces per site.
POLYSTYRENEPolystyrene accounted for 3.5% of all rubbish found, a decrease from 4.8% in 2008. There were 12,140 pieces of polystyrene counted in this survey, approximately 5,000 less pieces than last year. There was an average of 14 pieces of polystyrene were found at each site.
WOODWood made up the second lowest percentage of rubbish surveyed on Clean Up Australia Day again in 2009, with just 2.2% of the total. This was a decline of 1.6% from last year’s results. There were 7,650 pieces of wood surveyed for this report, almost half the amount of pieces surveyed in 2008. There was an average of nine wood pieces found per site in 2009. RUBBERRubber retained its spot as the smallest source of rubbish in 2009 at 1.4% (down 0.3% from 2008). There were 4,664 pieces of rubber found with an average of 5 pieces per site. This revealed a decline in the average number of rubber items found in 2008 (6%) and 2007 (9%).
10
Plastic29%
Misc18%
Metal17%
Glass16%
Paper13%
Polystyrene4%
Wood2%
Rubber1%
Clean Up Australia Day - Rubbish Report 2009 Page
Historical Comparison
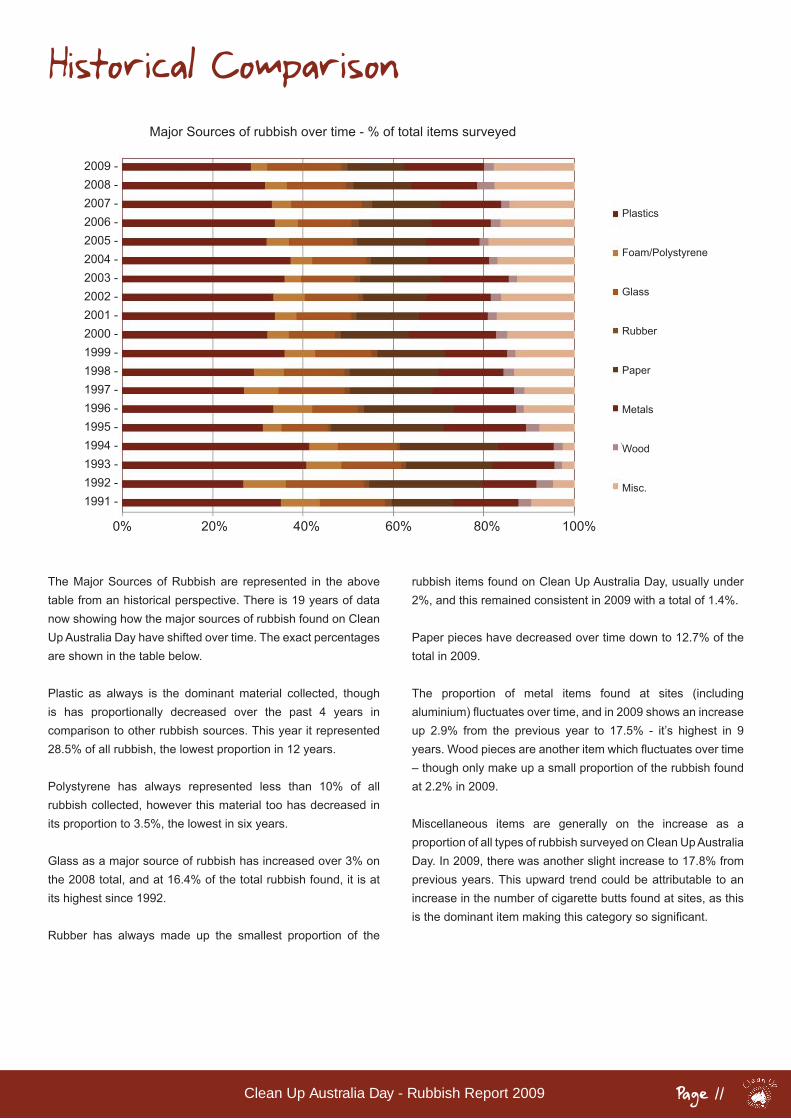
The Major Sources of Rubbish are represented in the above table from an historical perspective. There is 19 years of data now showing how the major sources of rubbish found on Clean Up Australia Day have shifted over time. The exact percentages are shown in the table below.
Plastic as always is the dominant material collected, though is has proportionally decreased over the past 4 years in comparison to other rubbish sources. This year it represented 28.5% of all rubbish, the lowest proportion in 12 years.
Polystyrene has always represented less than 10% of all rubbish collected, however this material too has decreased in its proportion to 3.5%, the lowest in six years.
Glass as a major source of rubbish has increased over 3% on the 2008 total, and at 16.4% of the total rubbish found, it is at its highest since 1992.
Rubber has always made up the smallest proportion of the
rubbish items found on Clean Up Australia Day, usually under 2%, and this remained consistent in 2009 with a total of 1.4%.
Paper pieces have decreased over time down to 12.7% of the total in 2009.
The proportion of metal items found at sites (including aluminium)fluctuatesovertime,andin2009showsanincreaseup 2.9% from the previous year to 17.5% - it’s highest in 9 years.Woodpiecesareanotheritemwhichfluctuatesovertime– though only make up a small proportion of the rubbish found at 2.2% in 2009.
Miscellaneous items are generally on the increase as a proportion of all types of rubbish surveyed on Clean Up Australia Day. In 2009, there was another slight increase to 17.8% from previous years. This upward trend could be attributable to an increase in the number of cigarette butts found at sites, as this isthedominantitemmakingthiscategorysosignificant.
11
2009 -2008 -2007 -2006 -2005 -2004 -2003 -2002 -2001 -2000 -1999 -1998 -1997 -1996 -1995 - 1994 -1993 -1992 -1991 -
Major Sources of rubbish over time - % of total items surveyed
Plastics
Foam/Polystyrene
Glass
Rubber
Paper
Metals
Wood
Misc.
0% 20% 40% 60% 80% 100%
Clean Up Australia Day - Rubbish Report 2009Page
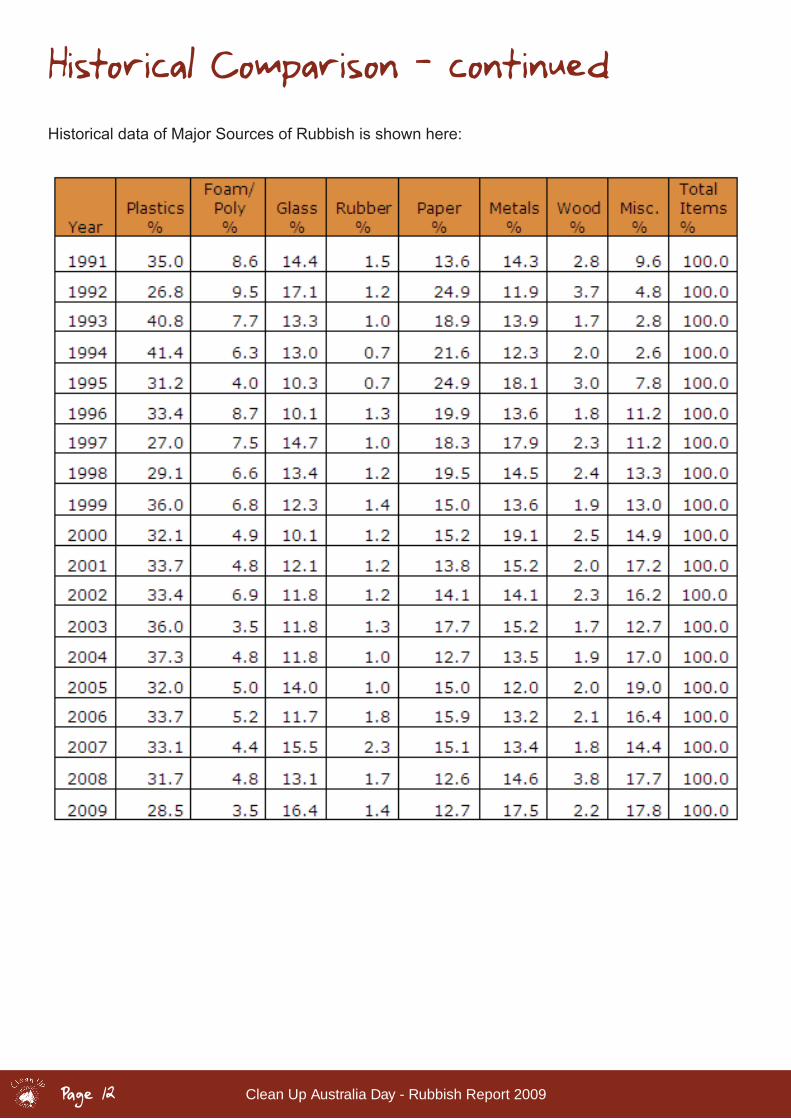
Historical data of Major Sources of Rubbish is shown here:
Historical Comparison - continued
12

Clean Up Australia Day - Rubbish Report 2009 Page
Major Sources of RubbishPLASTIC
Plastic was again the most common type of rubbish found on Clean Up Australia Day. This has been the dominant rubbish category found in Clean Up Australia Day rubbish surveys. This year, it made up 29% of all rubbish found.
Plastic is a versatile and commonly used material which is why it has the most categories in the rubbish survey (31). The most common item is the chip / confectionary bag, comprising 16.9% of the total – that is 16,617 bags littered across the country.
Plastic bottle caps / lids were the second most common item found, also consistent with previous years at 14.2%. PET drink containers ranked third at 11.1%.
As well as chip / confectionery bags, other types of plastic bags make up a large proportion of the plastic found at Clean Up Australia Day sites. This includes garbage / rubbish bags (9.4%), single use singlet style shopping bags (4.9%) and food
bags (3.3%).
Fruit juice bottles, cling wrap and other items made up the rest of the plastic items found at sites.
There was a total of 98,421 plastic items found at sites surveyed.
There was an overall average of 113 pieces of plastic per site. Most commonly, plastic pieces were found at Beach / Coastal areas with an average of 155 items per site.
There was an average of 40 plastic bags found at each site, 25 plastic bottles and 48 miscellaneous pieces of plastic. Miscellaneous items include plastic cups, utensils, nappies, milk crates, PVC piping and other containers.
The overall amount of plastic found at sites in 2009 was slightly higher than 2008, though still less than 2007.
13
chips & confectionary bags16.9%
bottle caps & lids14.2%
pet drink containers11.1%
garbage/rubbish bags 9.4%
straws 6.9%
other 21.3%
supermarket/retail bags 4.9%
fruit juice bottles4.4%
cling wrap 3.9%
packaging 3.6%
plastic food bags 3.3%
Clean Up Australia Day - Rubbish Report 2009Page
MISCELLANEOUS
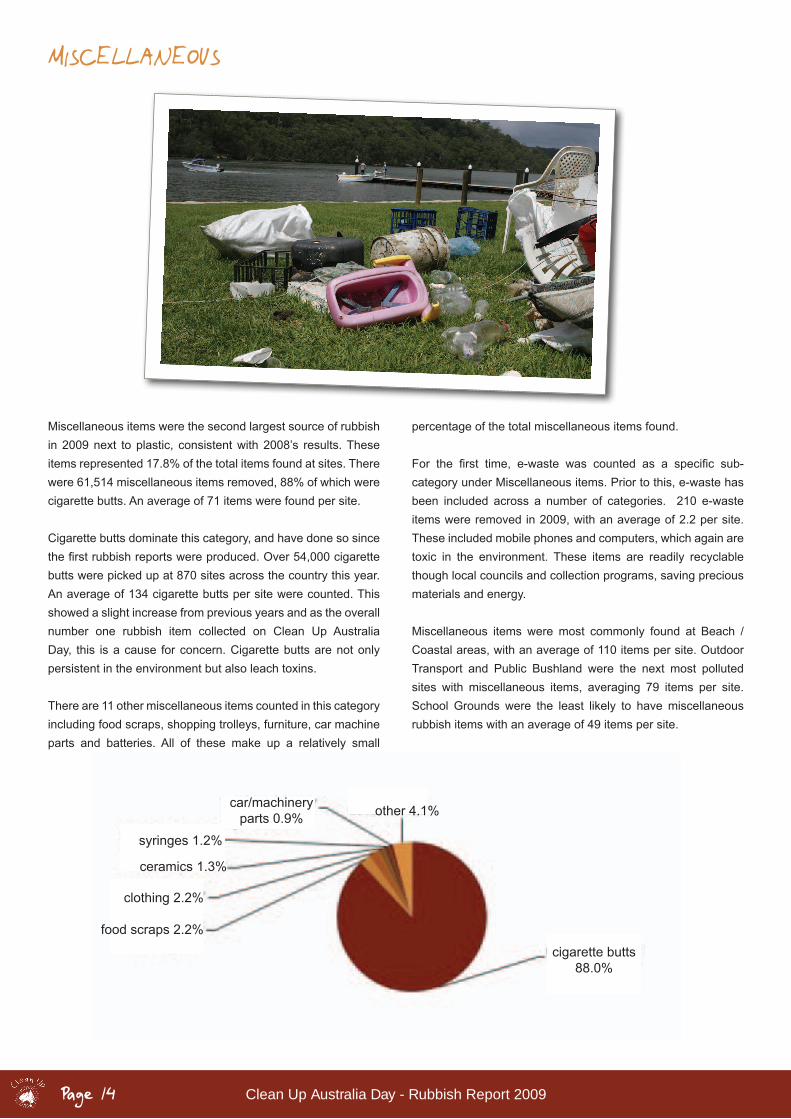
Miscellaneous items were the second largest source of rubbish in 2009 next to plastic, consistent with 2008’s results. These items represented 17.8% of the total items found at sites. There were 61,514 miscellaneous items removed, 88% of which were cigarette butts. An average of 71 items were found per site.
Cigarette butts dominate this category, and have done so since thefirstrubbishreportswereproduced.Over54,000cigarettebutts were picked up at 870 sites across the country this year. An average of 134 cigarette butts per site were counted. This showed a slight increase from previous years and as the overall number one rubbish item collected on Clean Up Australia Day, this is a cause for concern. Cigarette butts are not only persistent in the environment but also leach toxins.
There are 11 other miscellaneous items counted in this category including food scraps, shopping trolleys, furniture, car machine parts and batteries. All of these make up a relatively small
percentage of the total miscellaneous items found.
For the first time, e-waste was counted as a specific sub-category under Miscellaneous items. Prior to this, e-waste has been included across a number of categories. 210 e-waste items were removed in 2009, with an average of 2.2 per site. These included mobile phones and computers, which again are toxic in the environment. These items are readily recyclable though local councils and collection programs, saving precious materials and energy.
Miscellaneous items were most commonly found at Beach / Coastal areas, with an average of 110 items per site. Outdoor Transport and Public Bushland were the next most polluted sites with miscellaneous items, averaging 79 items per site. School Grounds were the least likely to have miscellaneous rubbish items with an average of 49 items per site.
14
cigarette butts88.0%
other 4.1%car/machineryparts 0.9%
syringes 1.2%
ceramics 1.3%
clothing 2.2%
food scraps 2.2%

Clean Up Australia Day - Rubbish Report 2009 Page
METAL & ALUMINIUM
Metal and aluminium represented 17.5% of all the rubbish surveyed on Clean Up Australia Day, a marked increase on 2008 at 14.6%. This shows a steady trend of increasing over the last eight years, with 2009 the highest since 2000.
There were 60,319 pieces of metal / aluminium rubbish surveyed for this Report with an average of 69 pieces found per site. Over 35,000 of these items were metal / aluminium cans with an average of 41 cans per site.
Alcoholic beverage cans made up 36.3% of the total metal items removedonCleanUpAustraliaDay,asignificant13%increase from 2008. Soft drink cans decreased slightly to 18.2% (from 22% in 2008). Foil / confectionary wrappers increased slightly to 15.6% in 2009 whereas metal bottle caps declined significantlybyapproximately7%thisyear.
The ‘other’ category here has been grouped together and represents ten other types of metal items, all of which comprised 12.6% of the total. These items include metal pipe, wire, aerosol cans, food tins, paint tins and appliances. Metal construction
materials stood out this year from the many ‘other’ metal items, contributing 4% of the total metal rubbish items removed.
Roadways were the site of the most number of metal items with an average of 102 per site. Following Roadways, Beach /Coastal and Public Bushland were site where metal/aluminium were most frequently found with averages of 83 and 77 pieces per site respectively.
When looking at just metal / aluminium cans, the most polluted sites were again Roadways (average 70 cans) and Beach / Coastal areas (average 60 cans). It is likely that the high number of aluminium cans found along roadways are a result of people directly littering from their cars. At Beach / Coastal areas, the high number of littered cans could potentially be reduced by providing more recycling bins at these locations.
As with glass, aluminium is a high energy intensive product; which means that a lot of carbon dioxide is emitted to produce the material. Recycling aluminium saves up to 95% of the energy required to produce the primary material.
15
other 12.6%
constructionmaterials 4.0%
bottle caps13.3%
foil/confectionarywrappers 15.6%
alcoholicbeverage cans
36.3%
soft drink cans18.2%
Clean Up Australia Day - Rubbish Report 2009Page
GLASS
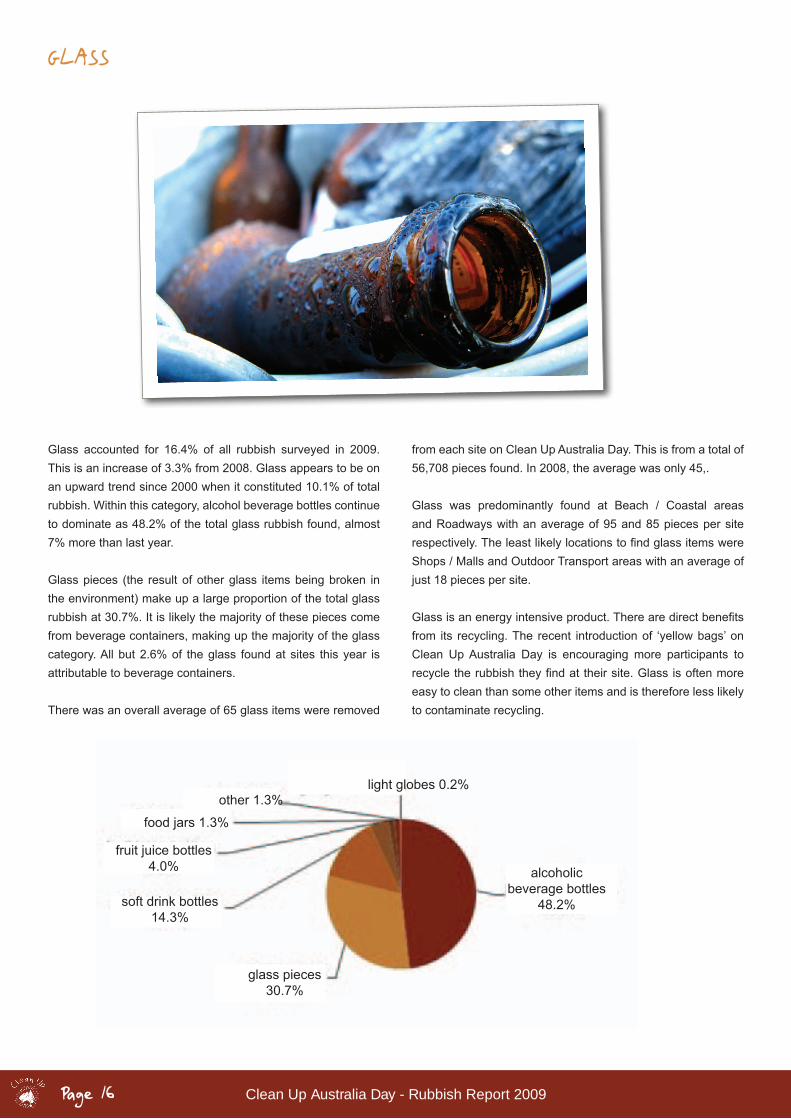
Glass accounted for 16.4% of all rubbish surveyed in 2009. This is an increase of 3.3% from 2008. Glass appears to be on an upward trend since 2000 when it constituted 10.1% of total rubbish. Within this category, alcohol beverage bottles continue to dominate as 48.2% of the total glass rubbish found, almost 7% more than last year.
Glass pieces (the result of other glass items being broken in the environment) make up a large proportion of the total glass rubbish at 30.7%. It is likely the majority of these pieces come from beverage containers, making up the majority of the glass category. All but 2.6% of the glass found at sites this year is attributable to beverage containers.
There was an overall average of 65 glass items were removed
from each site on Clean Up Australia Day. This is from a total of 56,708 pieces found. In 2008, the average was only 45,.
Glass was predominantly found at Beach / Coastal areas and Roadways with an average of 95 and 85 pieces per site respectively.TheleastlikelylocationstofindglassitemswereShops / Malls and Outdoor Transport areas with an average of just 18 pieces per site.
Glassisanenergyintensiveproduct.Therearedirectbenefitsfrom its recycling. The recent introduction of ‘yellow bags’ on Clean Up Australia Day is encouraging more participants to recycletherubbishtheyfindattheirsite.Glassisoftenmoreeasy to clean than some other items and is therefore less likely to contaminate recycling.
16
alcoholicbeverage bottles
48.2%soft drink bottles14.3%
fruit juice bottles4.0%
food jars 1.3%
other 1.3%light globes 0.2%
glass pieces30.7%

Clean Up Australia Day - Rubbish Report 2009 Page
PAPER & CARDBOARD
Paper and cardboard accounted for 12.7% of the total rubbish surveyed in 2009, consistent with 2008’s 12.6%. There were 43,684 paper rubbish items surveyed, showing an average of 50 pieces per site.
The majority of this was small paper pieces, making up 31.9% ofthetotalpaperitemsfound.Thisisasignificantincreasefrom2008 where paper pieces made up just 21.6% of the total.
Fast food packaging contributed 11.5% to the total paper in 2009. This second highest category showed a decline of 5% from 2008. Also decreasing slightly in percentage was cigarette
packets, though along with paper pieces consistently make up the top three paper items removed.
There are many paper categories counted in this survey, some of which are grouped together under ‘other’. These include milk cartons, wine casks and egg cartons.
Roadways, School Grounds and Public Bushland were the most common types of locations to have paper rubbish with an average of 67, 63 and 60 pieces per site respectively. Shops / Malls were the least likely with 25 pieces per site.
17
small paperpieces 31.9%
fast foodpackaging 11.5%
cigarette packets9.5%
other 8.1%cardboard boxes3.8%
paper cups 4.5%
drink cartons 5.3%
newspapers/books/magazine
7.3%
paper bags 8.9%
napkins &tissues.2%

Clean Up Australia Day - Rubbish Report 2009Page
POLYSTYRENE
Polystyrene accounted for 3.5% of all rubbish found, a decrease from 4.8% in 2008. There were 12,140 pieces of polystyrene counted in this survey, approximately 5,000 less pieces than last year. There was an average 14 pieces of polystyrene found at each site. Fast food containers were the most commonly found polystyrene item this year, moving up from second place in 2008 – comprising 32.6% of the total polystyrene rubbish. Polystyrene pieces declined by approximately 7% from 2008. Polystyrene packaging remained consistent at 14.9% of this type of rubbish.
Roadways and Beach / Coastal areas were most popular locations for polystyrene pieces with an average of around 16 pieces per site. Outdoor transport sites were the locations of the least pieces of polystyrene with an average of 4.5 pieces per site.
The proportion of Polystyrene rubbish making up total rubbish removed on Clean Up Australia Day is declining. This trend has been observed over the 19 year history of rubbish reports and might be attributable to better packaging practices by manufacturers producing less polystyrene.
WOOD
Wood made up the second lowest percentage of rubbish surveyed on Clean Up Australia Day again in 2009, at just 2.2% of the total. This was a decline of 1.6% from last year’s results. There were 7,650 pieces of wood surveyed for this report, almost half the amount of pieces surveyed in 2008. There was an average of nine wood pieces found per site in 2009.
The majority of the wood pieces of rubbish removed at sites wereconstructionmaterials(40.8%).Thisisasignificantshiftin proportion to the last few years, when construction materials made up no more than 20% of the total. Ice cream sticks comprised 34.7% of the total, fairly consistent with 2007 after a decline in 2008. Wood pieces showed a small decline in 2009 to represent 13.2% of total wood rubbish.
A notable change in the amount of bottle corks found at sites (dropping from 55.8% in 2008 to just 4.1% in 2009) might be attributable to the increasing popularity of screw-top wine bottles, however the small sample size of wood items can cause the results to skew drastically from year to year.
Public Bushland and River / Creeks were the most likely type of site to contain wood rubbish, with an average of 14 and 10 pieces per site respectively. The least likely location to findwood pieces was shops / malls with an average of just 2.2 pieces per site.
18
constructionmaterials 40.8%
ice cream sticks34.7%
wood pieces13.2%
other 7.1%
bottle corks 4.1%
polystyrenepieces 30.6%
fast foodcontainers
32.6%cups/plates
19.4%
other 2.4%
packaging 14.9%

Clean Up Australia Day - Rubbish Report 2009 Page
RUBBER
Rubber retained its spot as the smallest source of rubbish in 2009 at 1.4% (down 0.3% from 2008). There were 4,664 pieces of rubber found with an average of 5 pieces per site. This revealed a decline in the average number of rubber items found in 2008 (6%) and 2007 (9%).
Rubber gloves were the most commonly found item in 2008, but this year saw a decline of almost 30% to make up just 15.7% of the 2009 total. Condoms increased by 10% to make up 28.1% of the total, and thongs / shoes increased by approximately 5%.
Other rubber items made up just 6.8% of the total.
In 2009, the most common rubber item found was rubber tyres. Over 1400 were removed at sites across the country, a few sitesfindingover100dumpedintheenvironmentinonearea.
School Grounds, Beach / Coastal areas and Roadways were themostcommonlocationstofindrubberrubbish,withOutdoorTransport and Shops / Malls the least likely to have rubber items removed.
19
other 6.8%
gloves 15.7%
thongs/shoes19.2% condoms
28.1%
tyres 30.2%

Clean Up Australia Day - Rubbish Report 2009Page
The Top Ten Rubbish Items
The Top Ten rubbish items found at surveyed sites across the country are shown in this chart.
Thefirstfigure iseach itemasapercentageofTopTen.Thesecondfigureshowseachitem’spercentageamongall itemssurveyed. The Top Ten made up 57% of the total rubbish items surveyed. This is an increase from 2008, where the Top Ten have made up 49% of the total.
Cigarette Butts were the most commonly found item for the fourteenth year in a row. In 2009, these items contributed 27% of the Top Ten, and 15.7% of all rubbish.
Glass alcoholic beverage containers retained their 2nd place in 2009, representing 11% of the Top Ten and 6.3% of the total rubbish found.
Aluminium alcohol beverage cans made their way to number three this year, up from 7th in 2008, representing 11% of the top ten.
Glasspiecesrosetofourthfromfifththisyear,representing9%of the Top Ten and 5% of all rubbish surveyed.
Close behind was plastic chip and confectionery bags, with 4.8% of all items found.
Plastic bottle caps & lids ranked sixth in 2009, contributing 7% of the top ten items and 4.1% of all rubbish items found. Similar to this at seventh place was small paper pieces.
Aluminium soft drink cans were the 8th most commonly found item at sites (6% of Top Ten). This was consistent with 2008 results. Plastic PET drink containers also made up 6% of the Top Ten items, and ranked ninth place.
At number 10, foil / confectionery wrappers made up 5% of the top ten and 2.7% of all rubbish surveyed.
Plastic garbage bags and glass soft drink bottles narrowly missed out on a Top Ten ranking this year, coming in at 11th and 12th respectively.
Six of the Top Ten items were related to beverage containers including bottle caps and glass pieces. These beverage container related items made up 29.7% of the Top Ten items if you include glass pieces.
Eight out of the Top Ten items were packaging materials, including packaging for food or beverages, this makes up 65.4% of the total.
Single use singlet style plastic bags ranked 16th this year, an elevation of 2 places from 2008.
20
1. cigarette butts27%
(15.7% of total rubbish)
2. glass alcohol bottle14%
(7.9% of total rubbish)
3. aluminium alcoholbeverage cans
11%(6.3% of total rubbish)
4. glass pieces9%
(5% of total rubbish)
5. plastic chips &confectionary bags
8%(4.8% of total rubbish)
6. plastic bottlecaps & lids
7%(4.1% of total rubbish)
7. small paper pieces7%
(4% of total rubbish)
8. aluminiumsoft drink cans 6%
(3.2% of total rubbish)
9. plastic PET drink containers 6%
(3.2% of total rubbish)
10. foil/confectionarywrappers 5%
(2.7% of total rubbish)

Clean Up Australia Day - Rubbish Report 2009 Page
Most ‘Polluted’ SitesThe'TotalRubbishDistribution'chartbelowidentifiesthemost‘polluted’sitessurveyedaccordingtoaveragenumberofrubbishitems found per site type surveyed.
TOTAL RUBBISH DISTRIBUTION
Average no. of pieces found per site
There was a 20% increase in the average number of rubbish items found at sites surveyed in 2009, from 344 pieces to 397 pieces.
As with 2008, this year recorded Outdoor Transport sites with the highest average number of rubbish pieces per site (512).
Beach / Coastal areas surged ahead of other site types this year to become the second most polluted site type with an average of 462 pieces per site.
Roadways were the second most polluted site last year, but
dropped in 2009 to the second least polluted site with an average of 260 items per site.
Shops / Malls were the least rubbished with 207 pieces per site.
Since 2004 when there was an average of 592 pieces per site, there has been a general decline in the number of pieces per site observed. Inconsistent with this decline was this year’s results which saw a spike in the frequency of rubbish at each site.
Glass is 100% recyclable. Over 30% of the raw material used in glass
production now comes from recycled glass.
21
0 100 200 300 400 500 600
Shops/Malls
School Grounds
Roadways
River/Creeks
Public Bushland
Parks/Waterfront
Outdoor Transport
Beach/Coastal
207
379
260
376
342
341
512
462

Clean Up Australia Day - Rubbish Report 2009Page
Site Rubbish Composition
The ‘Site Rubbish Composition’ chart details the proportions of different types of rubbish removed from each site.
Shops / Malls saw a great increase of the proportion of rubbish foundatthissitetype.Therewasalsoasignificantdecreaseinthe amount of plastic and miscellaneous items removed from this site type. Schools had a dramatic increase in the number of miscellaneous items and also showed a slight decrease in the amount of plastic, however these were still the main sources of rubbish found. Roadways saw an increase in the proportion of plastic found at this site type as did Public Bushland. River / Creeks still had plastic as the dominant item removed, however
more glass, metal and miscellaneous items were found this year. Parks / Waterfront sites recorded more glass than last year and less plastic. The opposite was true for Outdoor Transport areas. Beach / Coastal sites remained fairly consistent with a large proportion of plastic at these sites, however more glass and more metal was removed this year, and less miscellaneous items.
For a more detailed analysis of rubbish distribution across different site categories, please see the ‘Number of Surveyed Items by Site Type’ table which is a separate document accompanying this report.
SITE RUBBISH COMPOSITION CHART
22
6 of the Top Ten items are related to beverage containers: all 6 items are
recyclable.
Shops Malls
School Grounds
Roadways
River Creeks
Public Bushland
Parks
Outdoor Transport
Beach Coastal
Glass Metal Miscellaneous Plastic Polystyrene Rubber WoodPaper
0% 10% 20% 30% 40% 50% 60% 70% 80% 90% 100%

Clean Up Australia Day - Rubbish Report 2009 Page
A first in 2009: The Great Northern Clean Up
Clean Up Australia is always looking for solutions to inspire the community to take practical action to help the environment.
Across our great country there are many different environments, the diversity of which we embrace and celebrate. The challenge for many living above the Tropic of Capricorn has been the unfavourable timing of Clean Up Australia Day.
March is the wet season and the conditions do not allow for the most successful outcomes of a Clean Up event. After consultation with councils across northern Australia Clean Up Australia piloted the ‘Great Northern Clean Up’ in October 2009.
The event saw the coming together of many top-end local councils and groups across Western Australia, the Northern Territory and Queensland. The focus was to clean up rubbish before the arrival of the wet season rains which push rubbish deeper into our natural environment.
Promoted through radio, television and print across the region, communities responded very favourably to a second day of action.
Almost 1,800 volunteers removed an estimated 90 tonnes or rubbish across more than 70 registered sites. A large proportion of these sites were also registered for the national Clean Up Australia Day in March.
Clean Up thanks the councils and communities of:•ShireofBroome•BurdekinShireCouncil•CairnsRegionalCouncil•DarwinCityCouncil•HinchinbrookShireCouncil•PortHedlandCouncil•TablelandsRegionalCouncil•TownsvilleCityCouncil•WhitsundayRegionalCouncil•ShireofRoebourne•KatherineTownCouncil
The Great Northern Clean Up will not replace Clean Up Australia Day in participating regions, it is designed to be a second day of action.
The positive response by councils and the community has meant the clean up will now become an annual event.
23

Container Deposits – the incentive to recycle
When State and Federal Environment Ministers met in Perth in November, a solution to one of Australia’s biggest waste problems was staring them in the face – container refunds.
Tonnes of bottles and cans are dumped in our environment every year – and our growing obsession with bottled water means the problem is only going to get bigger. Never before has it been so crucial we do something as a nation to address the issue.
The introduction of a national container deposit scheme was on the agenda at the Environment Protection and Heritage Council meeting – the council made up of our State and Federal EnvironmentMinisters.Itwasn’tthefirsttimeit’sbeenontheagenda, and unfortunately nor is it the last.
Whether it is the fear of retribution from the beverage industry or a lack of leadership that is making reaching a consensus betweenthestatesdifficult,actionhasagainstalled.
Each year on Clean Up Australia Day, volunteers findthemselves removing tonnes and tonnes of beverage containers and related rubbish from our environment – all of which could, and should, be recycled. About 40% of all rubbish collected by the estimated 630,000 volunteers that pulled on their gloves and lent a hand during this year’s Clean Up Australia Day was beverage related.
Recycling rates in Australia are improving – about half of all household waste is now recycled – but where we fall down is when we’re out in public places. It’s when we head to the beach, the park, the shops – away from our household recycling bins. What we need to encourage is recycling away from our homes through an incentive – and while protecting our environment for our future generations should be incentive enough, it’s clear we
need more.
South Australia has already taken the lead and introduced its own 10-cent refund, with great success. SA enjoys a recycling rate of cans and bottles of between 75-85% while the rate in otherstatesislessthanhalfthis.Thebenefitsarethereforalltosee;anationalschemewouldseeasignificant increaseinrecycling and recovery of beverage containers, a 25% reduction in our total volume of rubbish; a 6% reduction in municipal waste tolandfill,nottomentionthejobcreationandgreenhousegasreductions.
The scheme would also complement council-run kerbside recycling schemes. Areas currently without recycling services in place would get the opportunity to recycle their containers, it would provide councils with an income stream from the container refunds collected in kerbside systems, and it would reducelandfillandtheassociatedcosts.Thelistofindisputablebenefitsseemsendless.
Combine all those benefits with the fact that a recent pollcommissioned by Clean Up Australia found that 87% of Australians want a national container refund scheme introduced and it defies belief that our leaders aren’t jumping at theopportunity.
So obvious is the need for a system to deal with our beverage container rubbish that some Australian communities have even decided to go it alone. Port Hedland in Western Australia recently introduced its own beverage container refund scheme, giving local residents a 10 cent refund on their cans and bottles, and Bundanoon in NSW introduced a town-wide ban on bottled water in order to cut down their environmental footprint.
Clean Up applauds their leadership.
24 Clean Up Australia Day - Rubbish Report 2009Page 24

Clean Up Australia LtdPO Box R725 Royal Exchange NSW 1225
Ph: 02 8197 3400 | Fax: 02 9251 6249 | Web: www.cleanup.org.au | Email: [email protected]