Embed Size (px)
Citation preview
CLEAN POWER PLAN PROPOSAL
Reducing Carbon Pollution From Existing Power Plants
Josh Tapp, Chief
Air Planning Branch
EPA Region 7
July 14, 2014
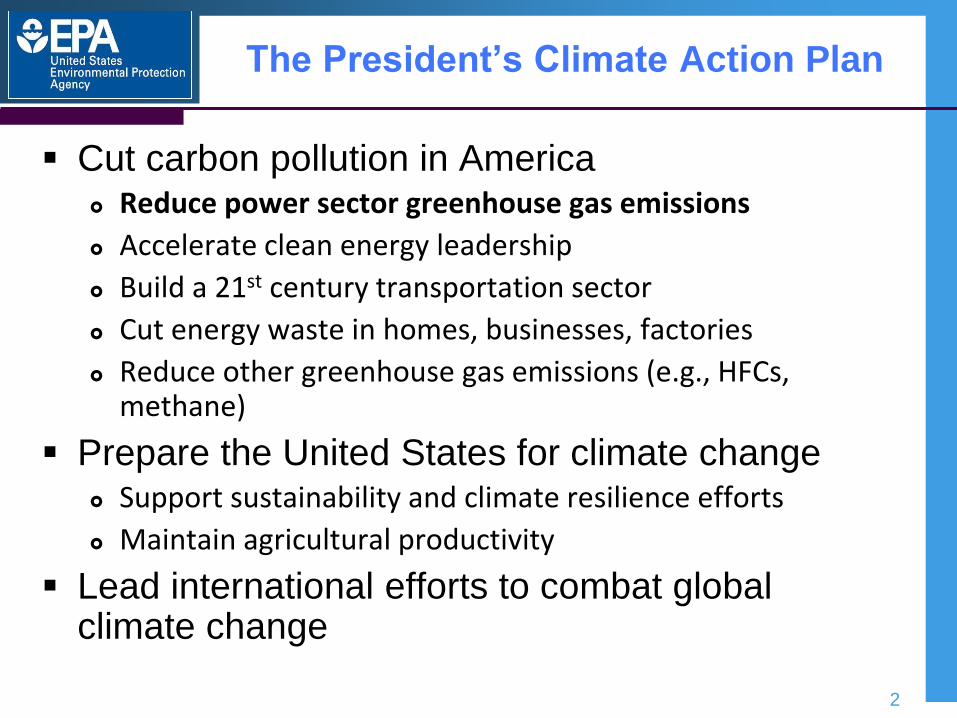
The President’s Climate Action Plan
Cut carbon pollution in America Reduce power sector greenhouse gas emissions
Accelerate clean energy leadership
Build a 21st century transportation sector
Cut energy waste in homes, businesses, factories
Reduce other greenhouse gas emissions (e.g., HFCs, methane)
Prepare the United States for climate change Support sustainability and climate resilience efforts
Maintain agricultural productivity
Lead international efforts to combat global climate change
2
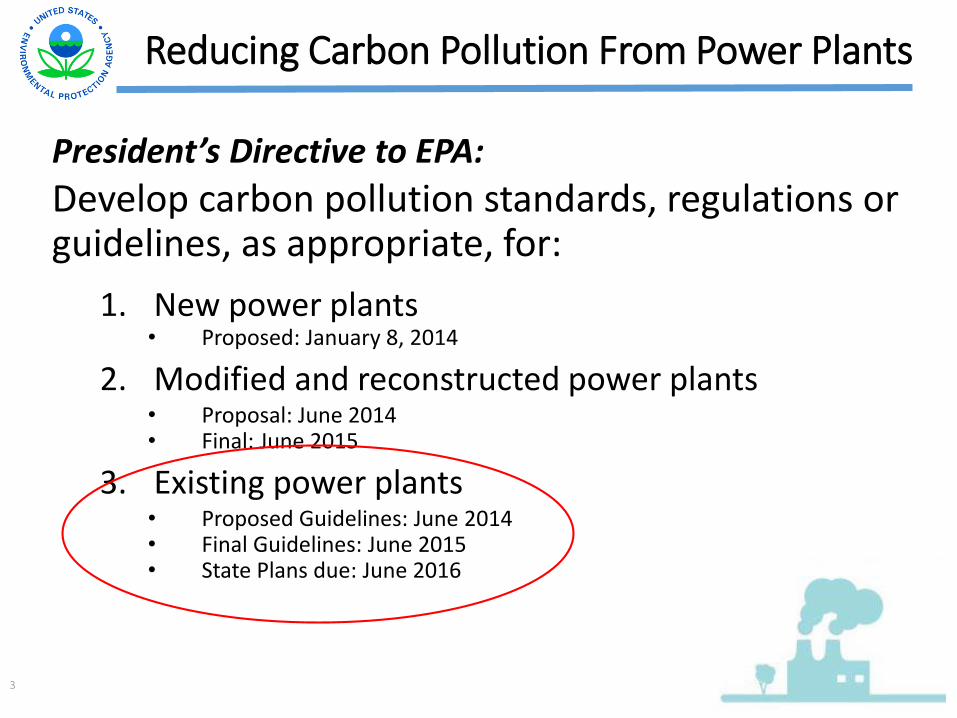
Reducing Carbon Pollution From Power Plants
President’s Directive to EPA:
Develop carbon pollution standards, regulations or guidelines, as appropriate, for:
1. New power plants• Proposed: January 8, 2014
2. Modified and reconstructed power plants• Proposal: June 2014• Final: June 2015
3. Existing power plants• Proposed Guidelines: June 2014• Final Guidelines: June 2015• State Plans due: June 2016
3
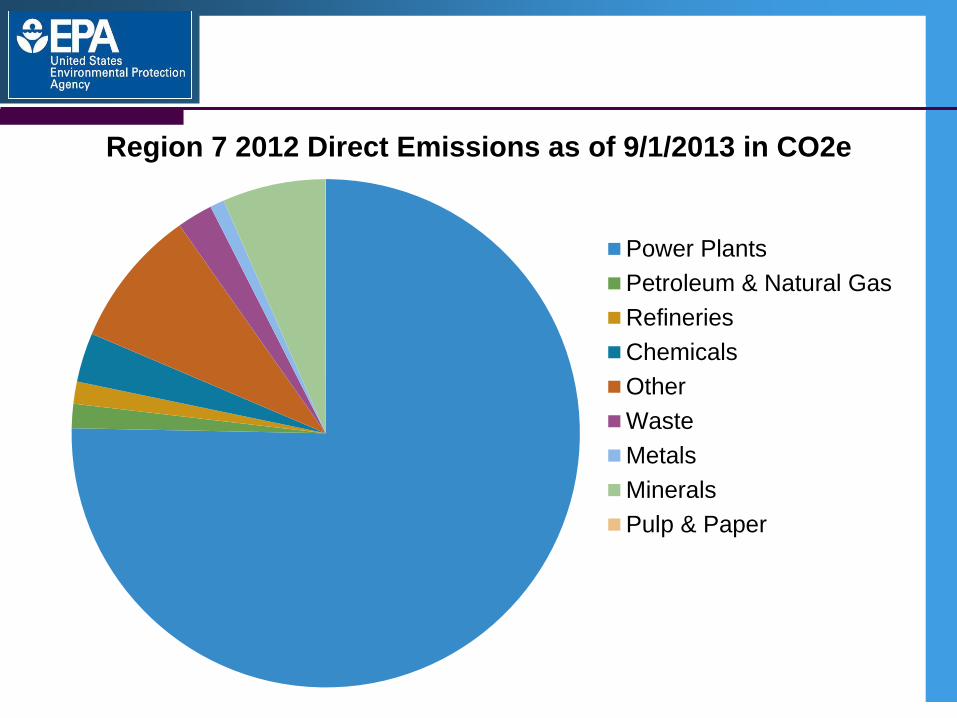
Region 7 2012 Direct Emissions as of 9/1/2013 in CO2e
Power Plants
Petroleum & Natural Gas
Refineries
Chemicals
Other
Waste
Metals
Minerals
Pulp & Paper
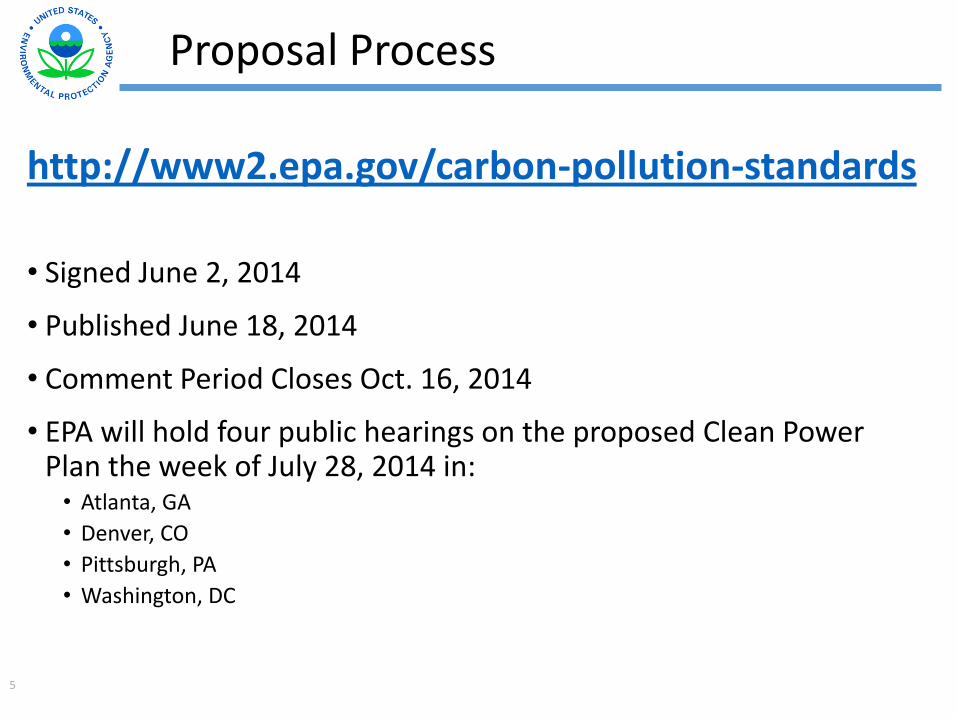
Proposal Process
http://www2.epa.gov/carbon-pollution-standards
• Signed June 2, 2014
• Published June 18, 2014
• Comment Period Closes Oct. 16, 2014
• EPA will hold four public hearings on the proposed Clean Power Plan the week of July 28, 2014 in:• Atlanta, GA
• Denver, CO
• Pittsburgh, PA
• Washington, DC
5
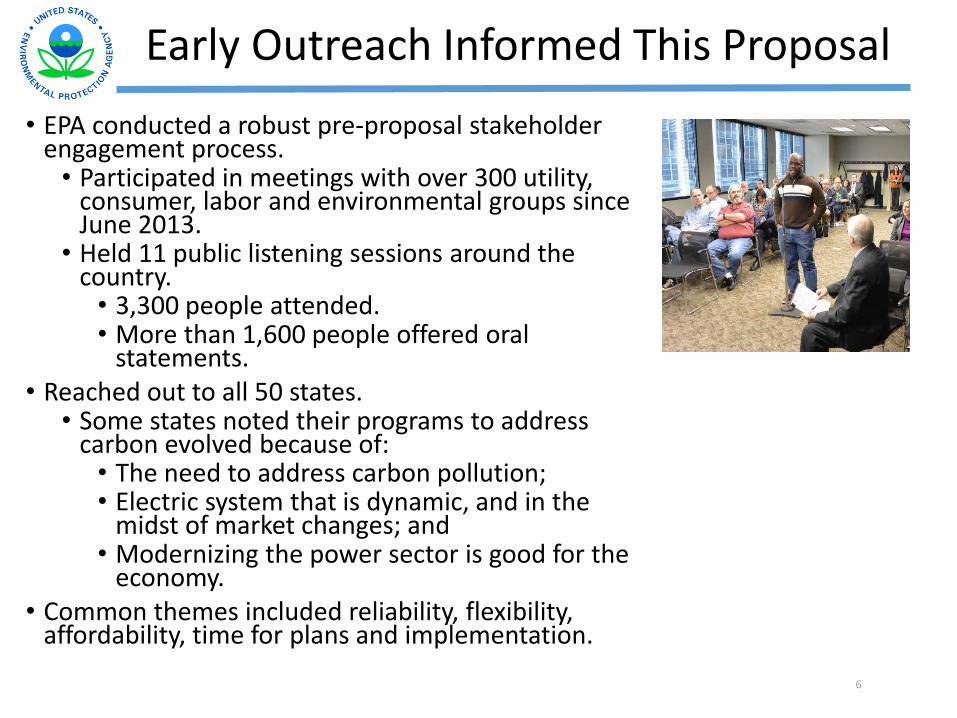
• EPA conducted a robust pre-proposal stakeholder engagement process.• Participated in meetings with over 300 utility,
consumer, labor and environmental groups since June 2013.
• Held 11 public listening sessions around the country.• 3,300 people attended.• More than 1,600 people offered oral
statements.• Reached out to all 50 states.
• Some states noted their programs to address carbon evolved because of:• The need to address carbon pollution;• Electric system that is dynamic, and in the
midst of market changes; and• Modernizing the power sector is good for the
economy.• Common themes included reliability, flexibility,
affordability, time for plans and implementation.
6
Early Outreach Informed This Proposal
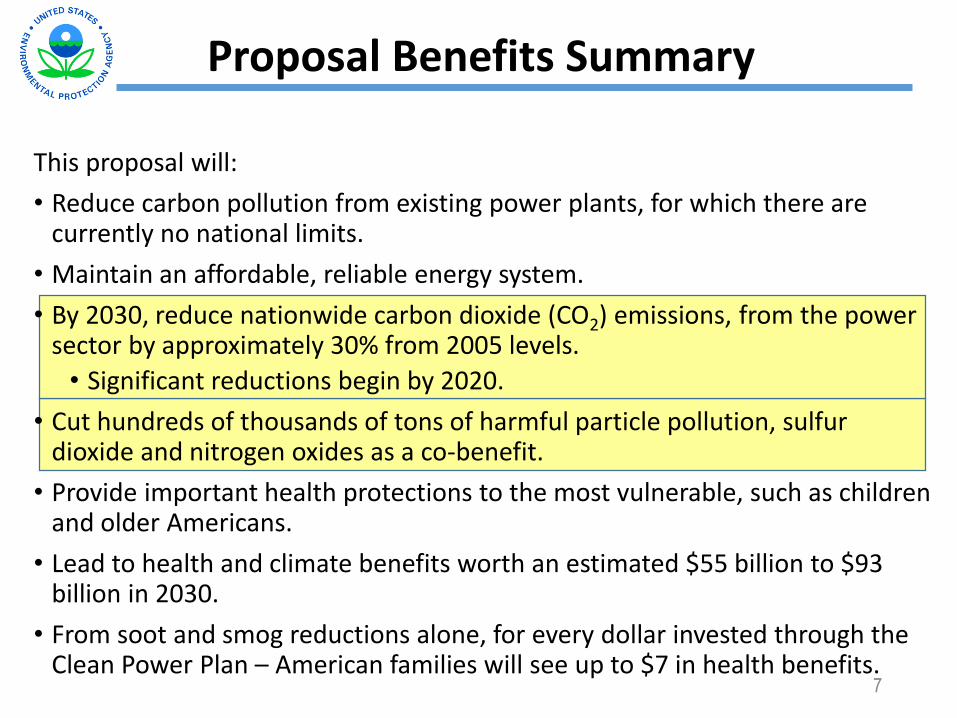
This proposal will:
• Reduce carbon pollution from existing power plants, for which there are currently no national limits.
• Maintain an affordable, reliable energy system.
• By 2030, reduce nationwide carbon dioxide (CO2) emissions, from the power sector by approximately 30% from 2005 levels.
• Significant reductions begin by 2020.
• Cut hundreds of thousands of tons of harmful particle pollution, sulfur dioxide and nitrogen oxides as a co-benefit.
• Provide important health protections to the most vulnerable, such as children and older Americans.
• Lead to health and climate benefits worth an estimated $55 billion to $93 billion in 2030.
• From soot and smog reductions alone, for every dollar invested through the Clean Power Plan – American families will see up to $7 in health benefits.
7
Proposal Benefits Summary

EPA Sets the Goals
8
Deliberative – Do Not Cite or Quote
General Overview of Proposal
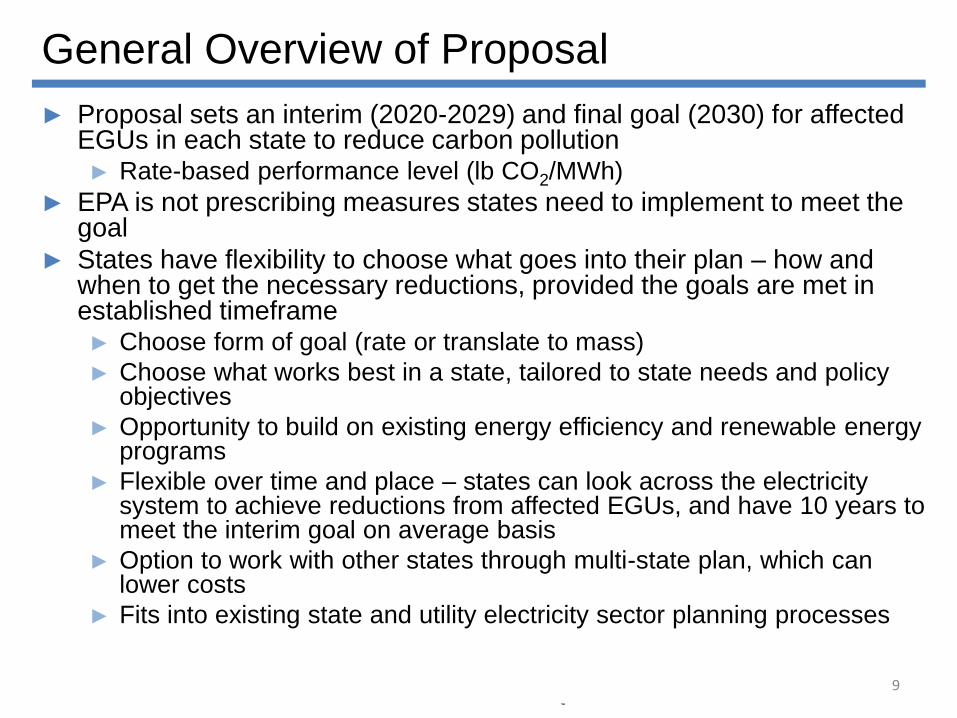
► Proposal sets an interim (2020-2029) and final goal (2030) for affected EGUs in each state to reduce carbon pollution► Rate-based performance level (lb CO2/MWh)
► EPA is not prescribing measures states need to implement to meet the goal
► States have flexibility to choose what goes into their plan – how and when to get the necessary reductions, provided the goals are met in established timeframe► Choose form of goal (rate or translate to mass)
► Choose what works best in a state, tailored to state needs and policy objectives
► Opportunity to build on existing energy efficiency and renewable energy programs
► Flexible over time and place – states can look across the electricity system to achieve reductions from affected EGUs, and have 10 years to meet the interim goal on average basis
► Option to work with other states through multi-state plan, which can lower costs
► Fits into existing state and utility electricity sector planning processes
9
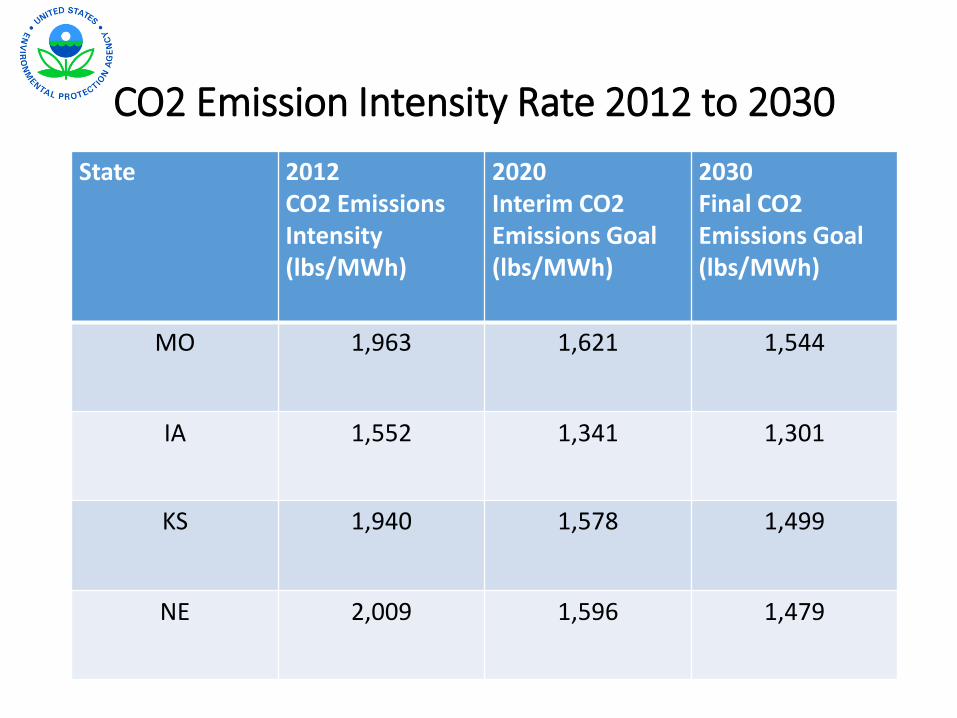
CO2 Emission Intensity Rate 2012 to 2030
State 2012 CO2 Emissions Intensity(lbs/MWh)
2020Interim CO2 Emissions Goal (lbs/MWh)
2030Final CO2 Emissions Goal(lbs/MWh)
MO 1,963 1,621 1,544
IA 1,552 1,341 1,301
KS 1,940 1,578 1,499
NE 2,009 1,596 1,479
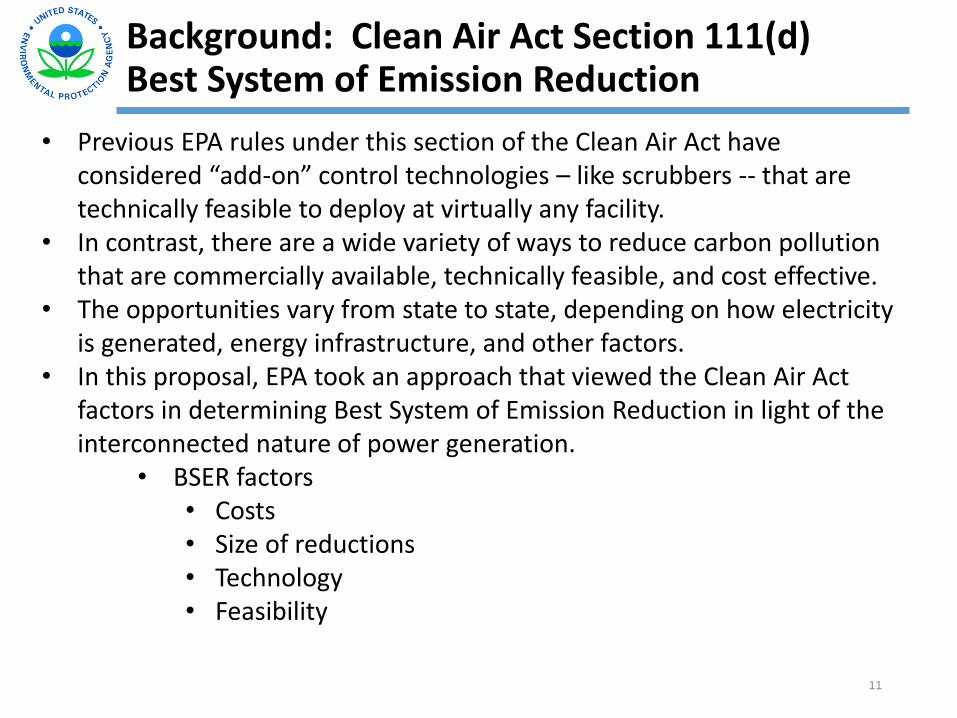
Background: Clean Air Act Section 111(d)Best System of Emission Reduction
11
• Previous EPA rules under this section of the Clean Air Act have considered “add-on” control technologies – like scrubbers -- that are technically feasible to deploy at virtually any facility.
• In contrast, there are a wide variety of ways to reduce carbon pollution that are commercially available, technically feasible, and cost effective.
• The opportunities vary from state to state, depending on how electricity is generated, energy infrastructure, and other factors.
• In this proposal, EPA took an approach that viewed the Clean Air Act factors in determining Best System of Emission Reduction in light of the interconnected nature of power generation.
• BSER factors• Costs• Size of reductions • Technology• Feasibility
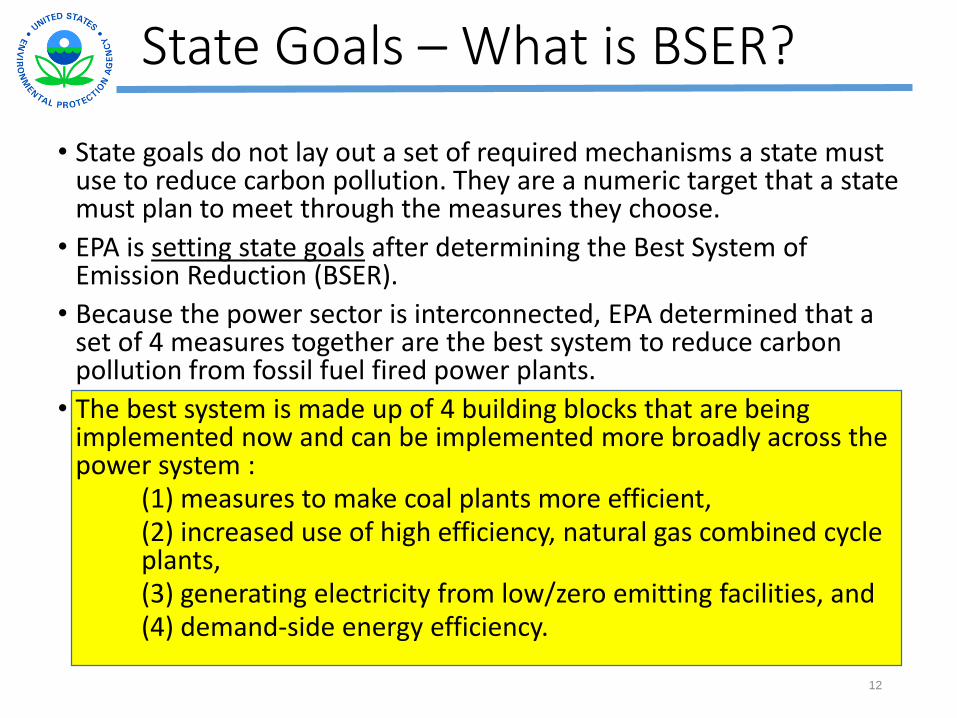
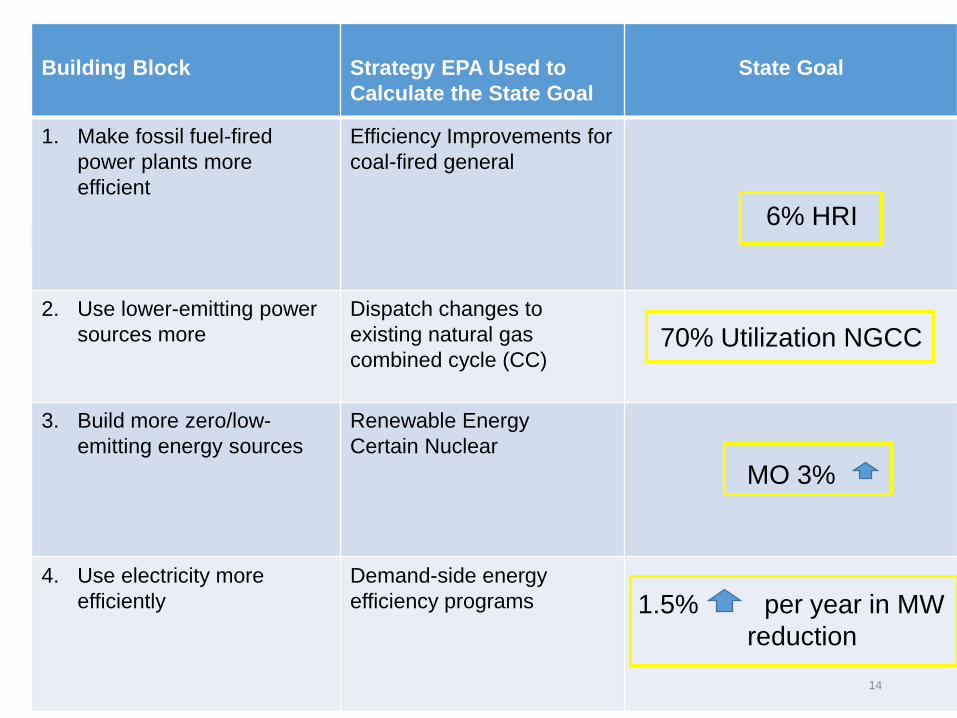
State Goals – What is BSER?
• State goals do not lay out a set of required mechanisms a state must use to reduce carbon pollution. They are a numeric target that a state must plan to meet through the measures they choose.
• EPA is setting state goals after determining the Best System of Emission Reduction (BSER).
• Because the power sector is interconnected, EPA determined that a set of 4 measures together are the best system to reduce carbon pollution from fossil fuel fired power plants.
• The best system is made up of 4 building blocks that are being implemented now and can be implemented more broadly across the power system :
(1) measures to make coal plants more efficient,(2) increased use of high efficiency, natural gas combined cycle plants,(3) generating electricity from low/zero emitting facilities, and (4) demand-side energy efficiency.
12
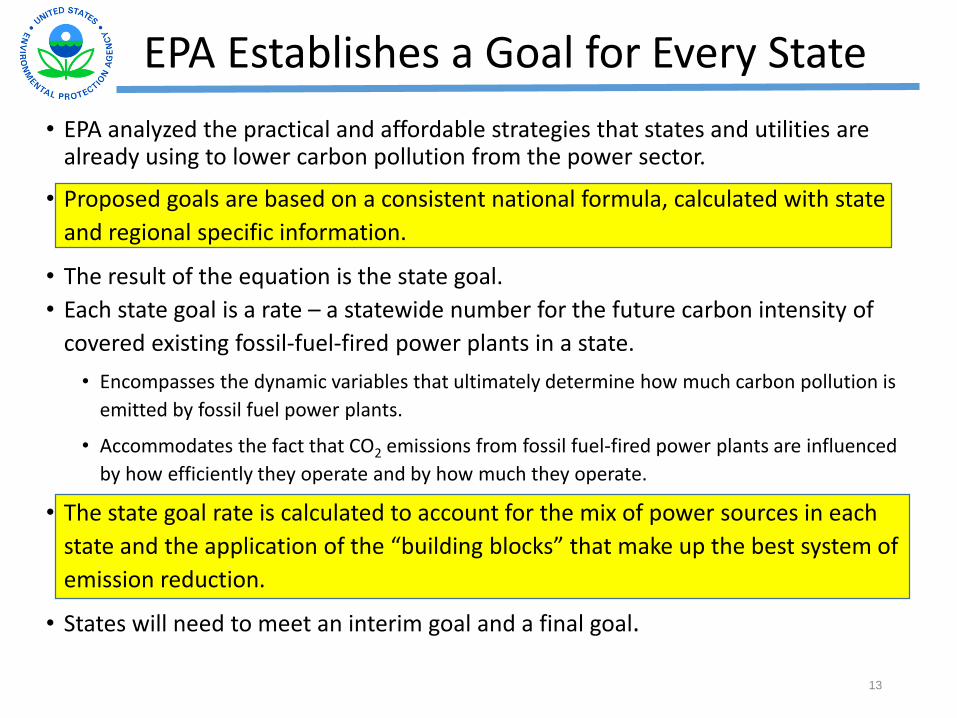
EPA Establishes a Goal for Every State
• EPA analyzed the practical and affordable strategies that states and utilities are already using to lower carbon pollution from the power sector.
• Proposed goals are based on a consistent national formula, calculated with state
and regional specific information.
• The result of the equation is the state goal.
• Each state goal is a rate – a statewide number for the future carbon intensity of
covered existing fossil-fuel-fired power plants in a state.
• Encompasses the dynamic variables that ultimately determine how much carbon pollution is
emitted by fossil fuel power plants.
• Accommodates the fact that CO2 emissions from fossil fuel-fired power plants are influenced
by how efficiently they operate and by how much they operate.
• The state goal rate is calculated to account for the mix of power sources in each
state and the application of the “building blocks” that make up the best system of
emission reduction.
• States will need to meet an interim goal and a final goal.
13
Building Block Strategy EPA Used to
Calculate the State Goal
State Goal
1. Make fossil fuel-fired
power plants more
efficient
Efficiency Improvements for
coal-fired general
6% HRI
2. Use lower-emitting power
sources more
Dispatch changes to
existing natural gas
combined cycle (CC)70% Utilization NGCC
3. Build more zero/low-
emitting energy sources
Renewable Energy
Certain Nuclear
MO 3%
4. Use electricity more
efficiently
Demand-side energy
efficiency programs 1.5% per year in MW
reduction
14
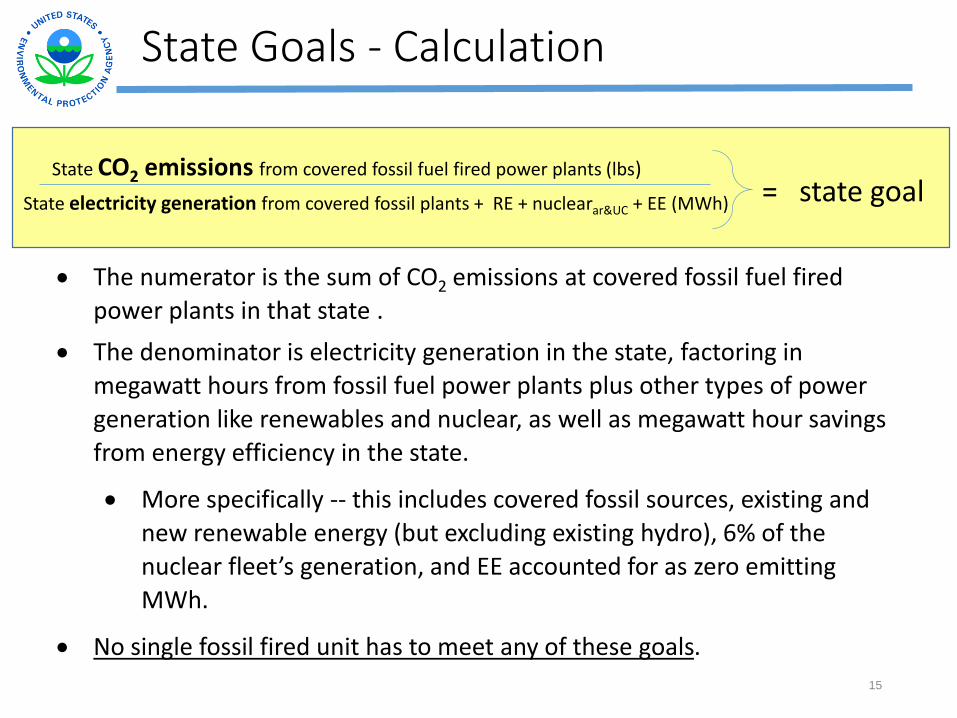
State Goals - Calculation
The numerator is the sum of CO2 emissions at covered fossil fuel fired
power plants in that state .
The denominator is electricity generation in the state, factoring in
megawatt hours from fossil fuel power plants plus other types of power
generation like renewables and nuclear, as well as megawatt hour savings
from energy efficiency in the state.
More specifically -- this includes covered fossil sources, existing and
new renewable energy (but excluding existing hydro), 6% of the
nuclear fleet’s generation, and EE accounted for as zero emitting
MWh.
No single fossil fired unit has to meet any of these goals.
15
State CO2 emissions from covered fossil fuel fired power plants (lbs)
State electricity generation from covered fossil plants + RE + nuclearar&UC + EE (MWh) = state goal
State Flexibility – States Get to Decide
• Goals are unique to every state because they reflect the diversity of how states produce and consume electricity.• For example, some states have more coal-fired generators
and therefore more potential for heat rate improvements.
• State goals do not define or limit states compliance choices• States can choose to meet their goal using more or less of
any of the compliance options in the four building blocks.• They can also use compliance options not included in the
building blocks such as new NGCC, transmission improvements and retrofit CCS.
• State goals were not derived using any 2005 data• EPA described the overall, nationwide reduction target in
reference to 2005, because that is a common year to consider when evaluating GHG emission reductions
16
State Goals – Learning More
•EPA calculated the goal based on the specific actions EPA has defined as BSER under the Clean Air Act– not on a particular compliance approach. •The proposal provides significant flexibility for states
to achieve reduction in any number of ways, therefore state goals are not prescriptions for any specific actions in any state.•Each state has substantial flexibility to determine how
to meet its goal.•A state can employ all, some, or none of the
strategies EPA used to calculate the goal in its state plan as long as the state can demonstrate how the plan’s actions will get them to its goal and achieve real reductions in carbon pollution from power plants.
17
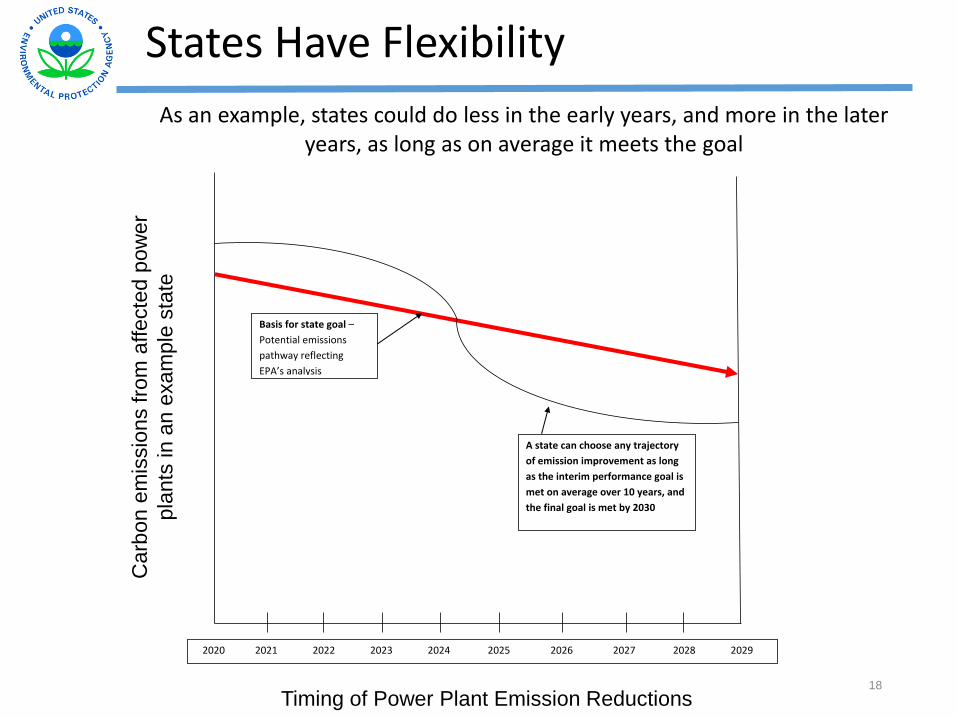
States Have Flexibility
Basis for state goal –
Potential emissions
pathway reflecting
EPA’s analysis
2020 2021 2022 2023 2024 2025 2026 2027 2028 2029
A state can choose any trajectory
of emission improvement as long
as the interim performance goal is
met on average over 10 years, and
the final goal is met by 2030
18
Carb
on e
mis
sio
ns fro
m a
ffecte
d p
ow
er
pla
nts
in a
n e
xam
ple
sta
te
As an example, states could do less in the early years, and more in the later years, as long as on average it meets the goal
Timing of Power Plant Emission Reductions

Strategies to Meet the Goals
19
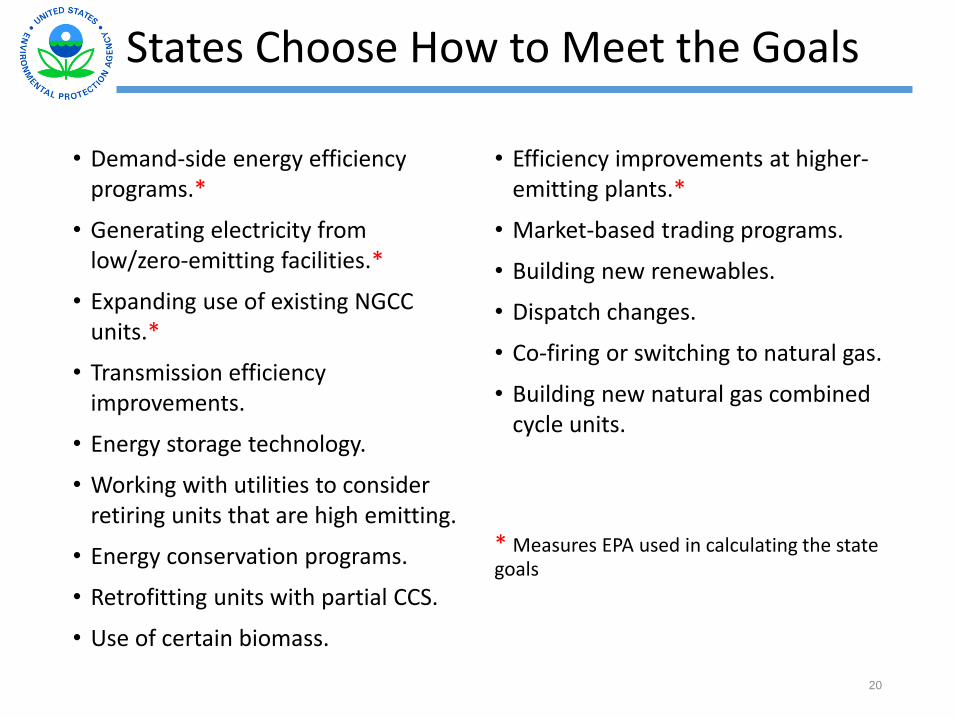
States Choose How to Meet the Goals
• Demand-side energy efficiency programs.*
• Generating electricity from low/zero-emitting facilities.*
• Expanding use of existing NGCC units.*
• Transmission efficiency improvements.
• Energy storage technology.
• Working with utilities to consider retiring units that are high emitting.
• Energy conservation programs.
• Retrofitting units with partial CCS.
• Use of certain biomass.
• Efficiency improvements at higher-emitting plants.*
• Market-based trading programs.
• Building new renewables.
• Dispatch changes.
• Co-firing or switching to natural gas.
• Building new natural gas combined cycle units.
* Measures EPA used in calculating the state goals
20
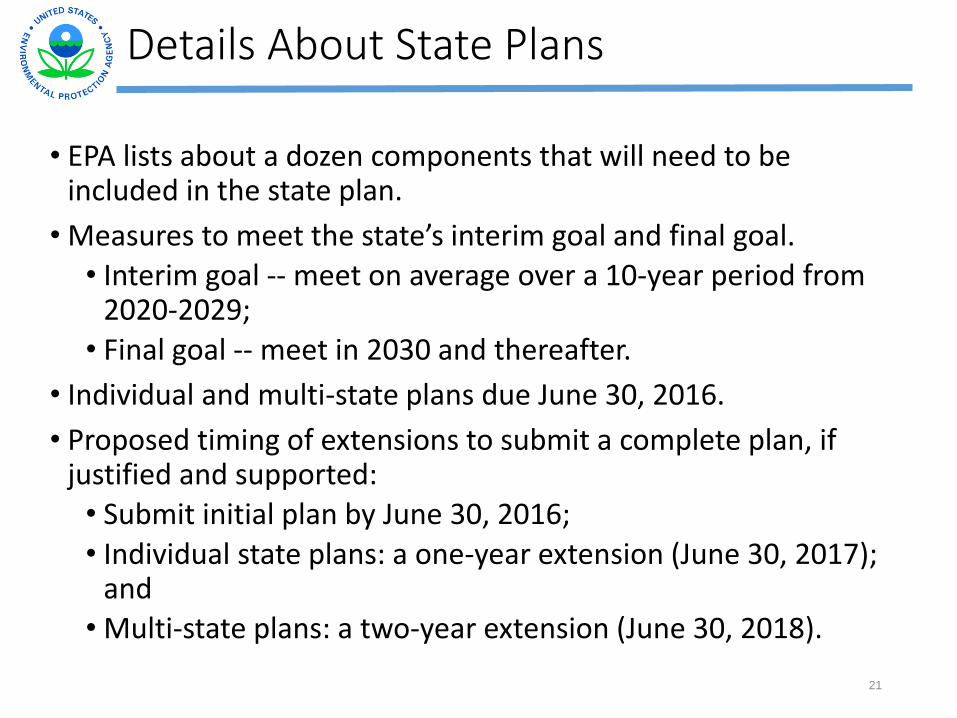
Details About State Plans
• EPA lists about a dozen components that will need to be included in the state plan.
• Measures to meet the state’s interim goal and final goal.• Interim goal -- meet on average over a 10-year period from
2020-2029;• Final goal -- meet in 2030 and thereafter.
• Individual and multi-state plans due June 30, 2016.
• Proposed timing of extensions to submit a complete plan, if justified and supported:• Submit initial plan by June 30, 2016;• Individual state plans: a one-year extension (June 30, 2017);
and• Multi-state plans: a two-year extension (June 30, 2018).
21
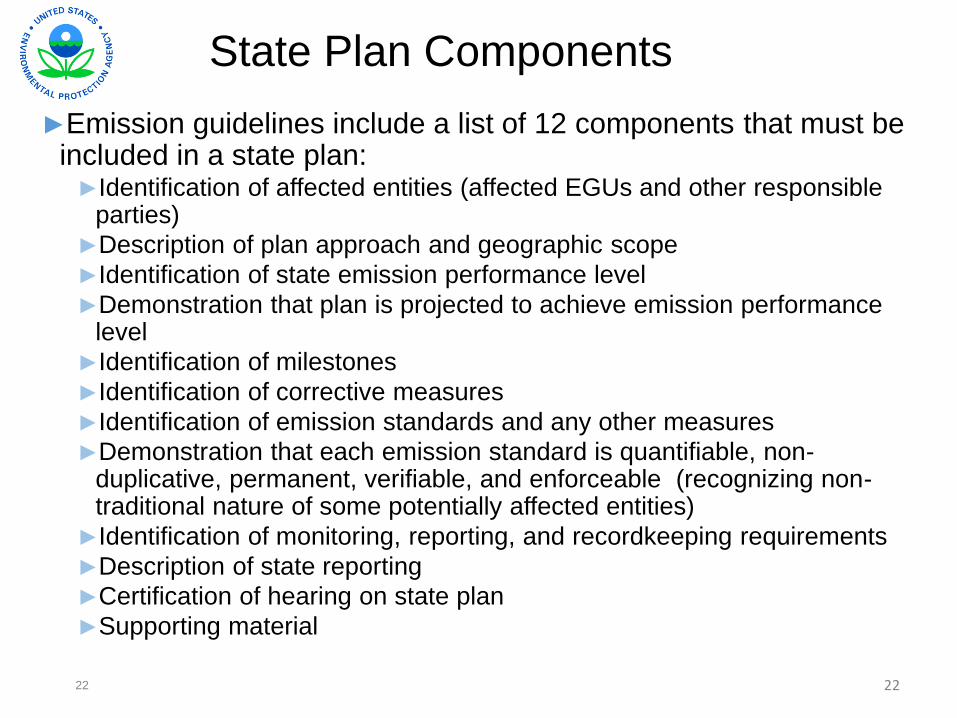
State Plan Components
►Emission guidelines include a list of 12 components that must be included in a state plan:►Identification of affected entities (affected EGUs and other responsible
parties)
►Description of plan approach and geographic scope
►Identification of state emission performance level
►Demonstration that plan is projected to achieve emission performance level
►Identification of milestones
►Identification of corrective measures
►Identification of emission standards and any other measures
►Demonstration that each emission standard is quantifiable, non-duplicative, permanent, verifiable, and enforceable (recognizing non-traditional nature of some potentially affected entities)
►Identification of monitoring, reporting, and recordkeeping requirements
►Description of state reporting
►Certification of hearing on state plan
►Supporting material
2222
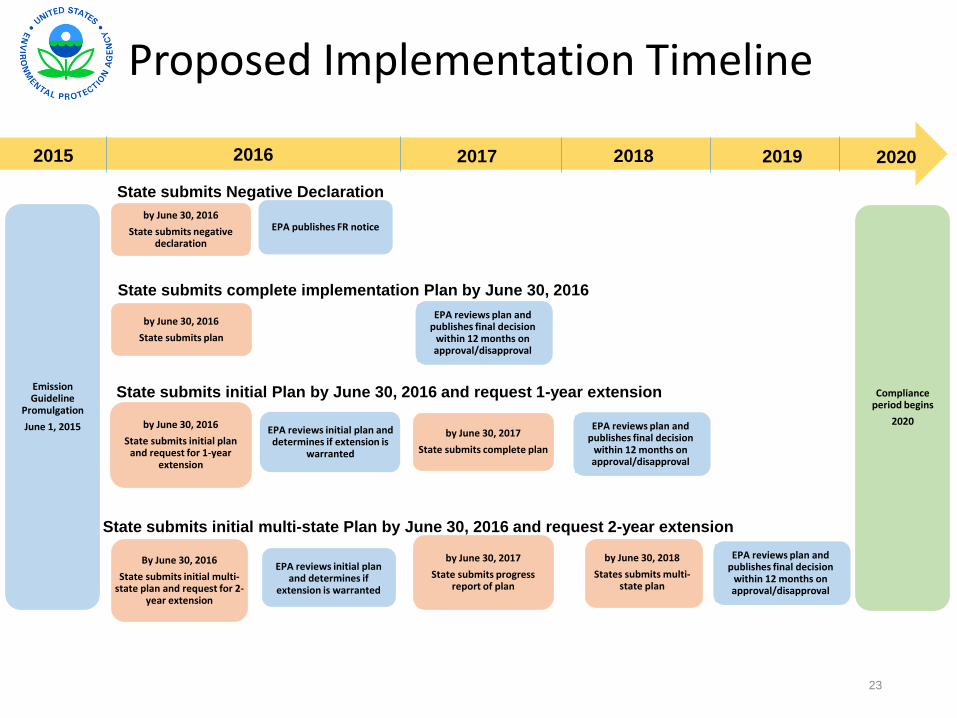
23
By June 30, 2016
State submits initial multi-state plan and request for 2-
year extension
EPA reviews initial plan and determines if
extension is warranted
by June 30, 2017
State submits progress report of plan
by June 30, 2018
States submits multi-state plan
State submits Negative Declaration
State submits complete implementation Plan by June 30, 2016
State submits initial Plan by June 30, 2016 and request 1-year extension
State submits initial multi-state Plan by June 30, 2016 and request 2-year extension
Emission Guideline
Promulgation
June 1, 2015
by June 30, 2016
State submits negative declaration
EPA publishes FR notice
by June 30, 2016
State submits plan
by June 30, 2016
State submits initial plan and request for 1-year
extension
EPA reviews initial plan and determines if extension is
warranted
by June 30, 2017
State submits complete plan
2015 2019
Proposed Implementation Timeline
Compliance period begins
2020
2020
EPA reviews plan and publishes final decision
within 12 months on approval/disapproval
EPA reviews plan and publishes final decision
within 12 months on approval/disapproval
EPA reviews plan and publishes final decision
within 12 months on approval/disapproval
2016 2017 2018
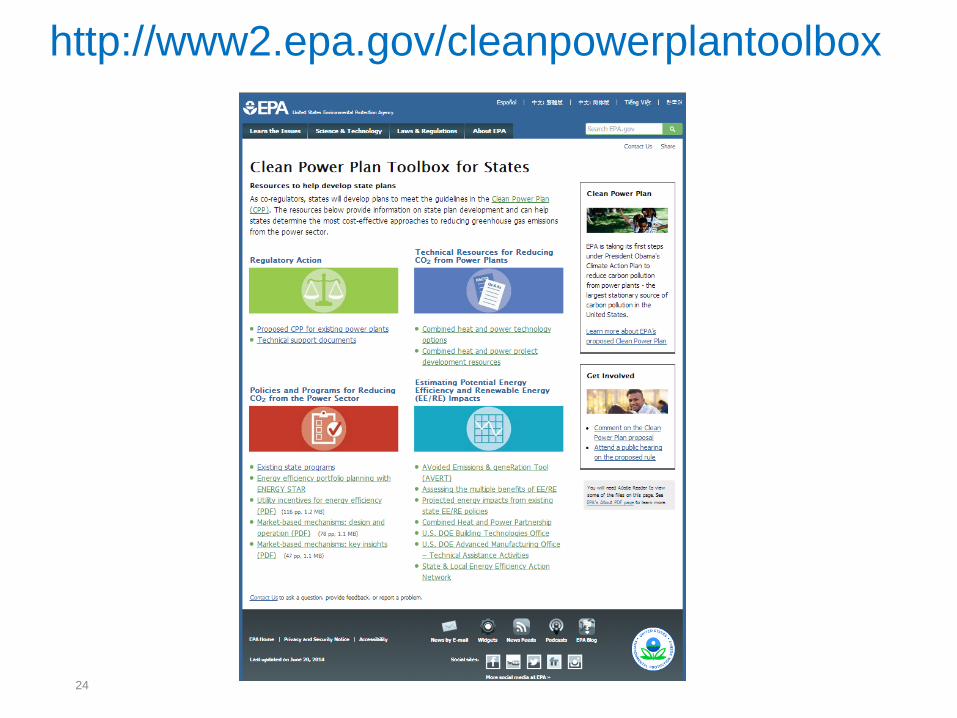
http://www2.epa.gov/cleanpowerplantoolbox
24
Questions?Josh Tapp
Air Planning Branch Chief
EPA Region 7
913.551.7606
25
This presentation is provided solely for informational purposes. It does not provide legal advice, have legally binding effect, or expressly or implicitly create, expand, or limit any legal rights, obligations, responsibilities, expectations, or benefits in regard to any person.

26

Appendix
27
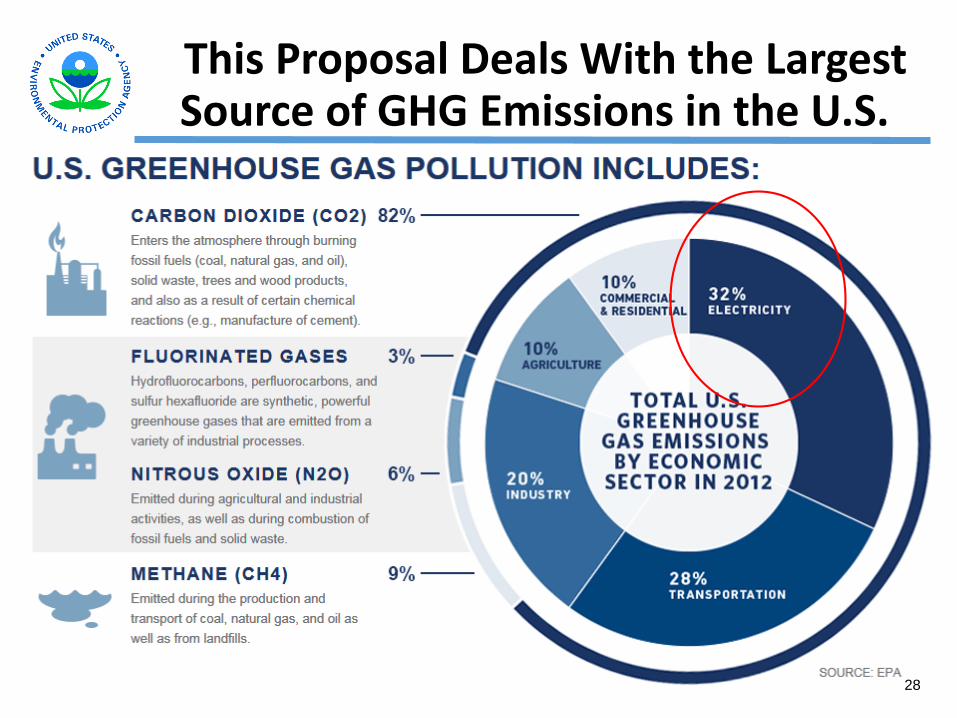
This Proposal Deals With the Largest Source of GHG Emissions in the U.S.
28
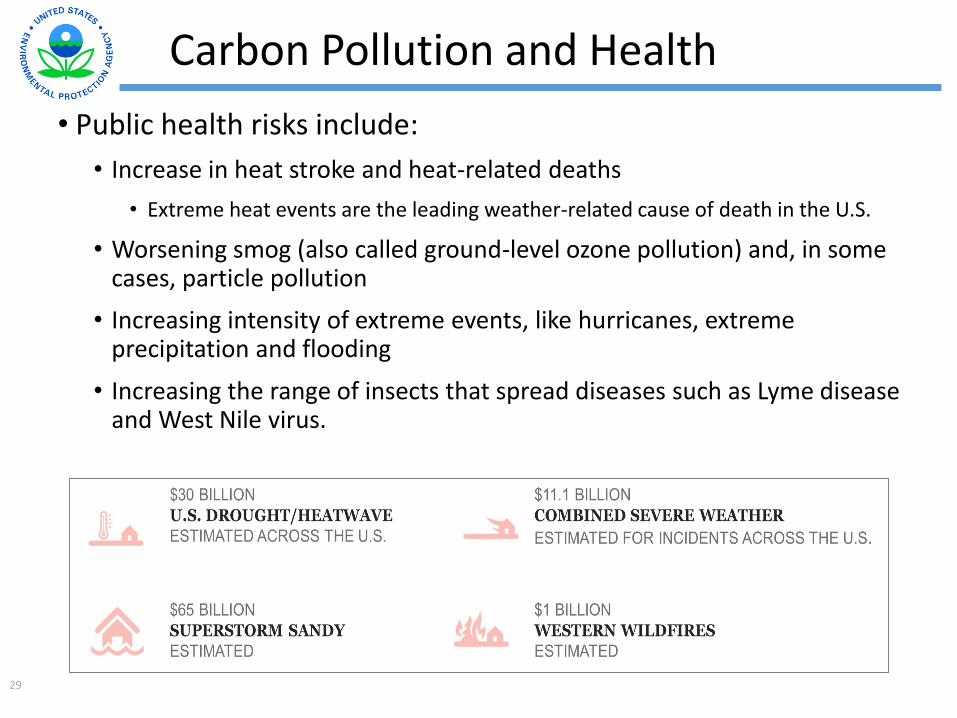
Carbon Pollution and Health
• Public health risks include:
• Increase in heat stroke and heat-related deaths
• Extreme heat events are the leading weather-related cause of death in the U.S.
• Worsening smog (also called ground-level ozone pollution) and, in some cases, particle pollution
• Increasing intensity of extreme events, like hurricanes, extreme precipitation and flooding
• Increasing the range of insects that spread diseases such as Lyme disease and West Nile virus.
29
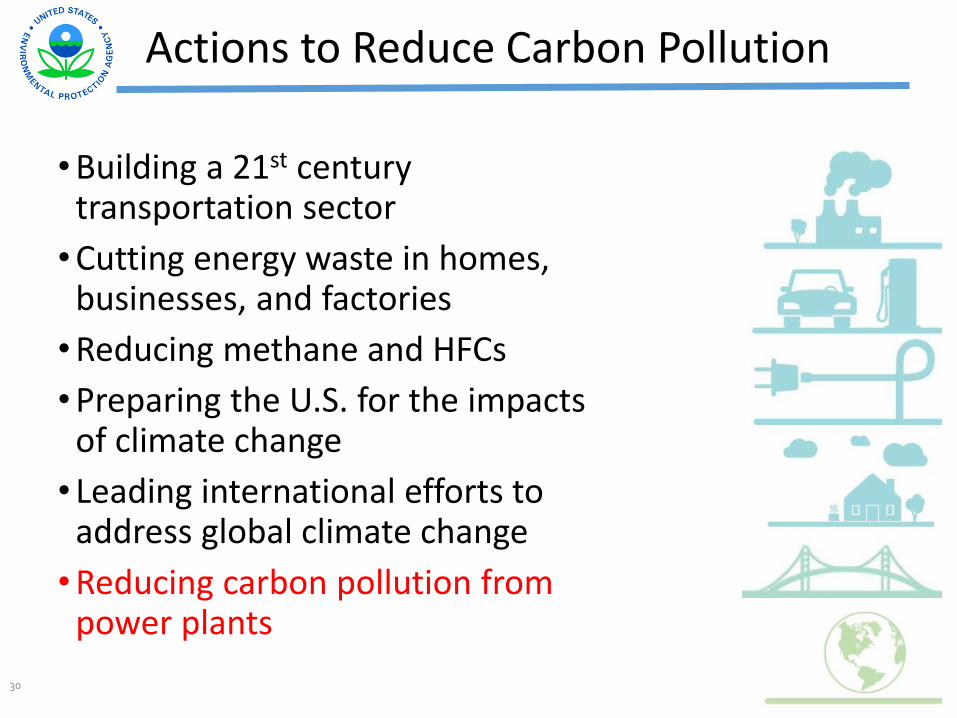
Actions to Reduce Carbon Pollution
•Building a 21st century transportation sector
•Cutting energy waste in homes, businesses, and factories
•Reducing methane and HFCs
•Preparing the U.S. for the impacts of climate change
• Leading international efforts to address global climate change
•Reducing carbon pollution from power plants
30
State Goals – Why They Are Different?
• State goals are unique to each state factoring in the amount of reductions that can be achieved through the 4 building blocks:
• Key factors that influence an individual state goal include:
• The ratio of coal to existing natural gas combined cycle units
• Magnitude of state RPS’s within region
• Energy demand (which impacts the potential for reductions from energy efficiency)
• Because the key factors that influence individual state goals are different for every state, each state’s goal (and reduction percentage) is different.
• The percentage reduction in emission rate implied by the 2012 actual rate (adjusted for RE) and the targets in other years is not the same as a required percentage reduction in mass emissions.
• This can be easily seen because increases in EE and RE can be accompanied by varying decreases in emissions.
• Overall, the 2012 rate to 2030 State goal comparison suggest a 33% reduction between the adjusted emission rate and the state goals, but this is achieved via a 17% reduction in emissions over that same time period.
31
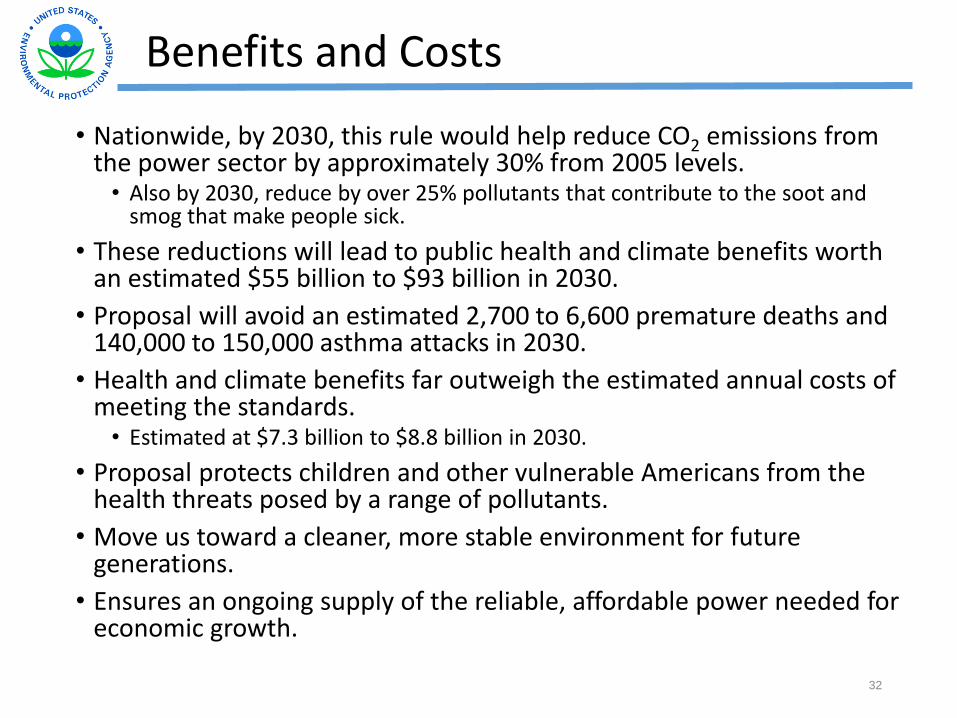
Benefits and Costs
• Nationwide, by 2030, this rule would help reduce CO2 emissions from the power sector by approximately 30% from 2005 levels.• Also by 2030, reduce by over 25% pollutants that contribute to the soot and
smog that make people sick.
• These reductions will lead to public health and climate benefits worth an estimated $55 billion to $93 billion in 2030.
• Proposal will avoid an estimated 2,700 to 6,600 premature deaths and 140,000 to 150,000 asthma attacks in 2030.
• Health and climate benefits far outweigh the estimated annual costs of meeting the standards.• Estimated at $7.3 billion to $8.8 billion in 2030.
• Proposal protects children and other vulnerable Americans from the health threats posed by a range of pollutants.
• Move us toward a cleaner, more stable environment for future generations.
• Ensures an ongoing supply of the reliable, affordable power needed for economic growth.
32
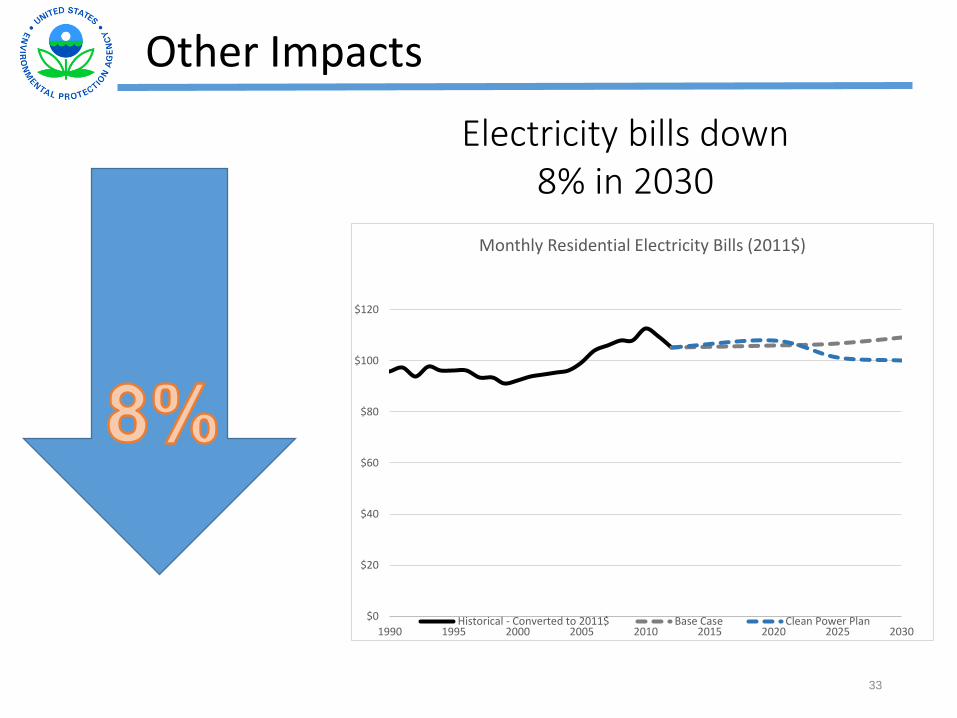
Other Impacts
33
Electricity bills down 8% in 2030
$0
$20
$40
$60
$80
$100
$120
1990 1995 2000 2005 2010 2015 2020 2025 2030
Monthly Residential Electricity Bills (2011$)
Historical - Converted to 2011$ Base Case Clean Power Plan
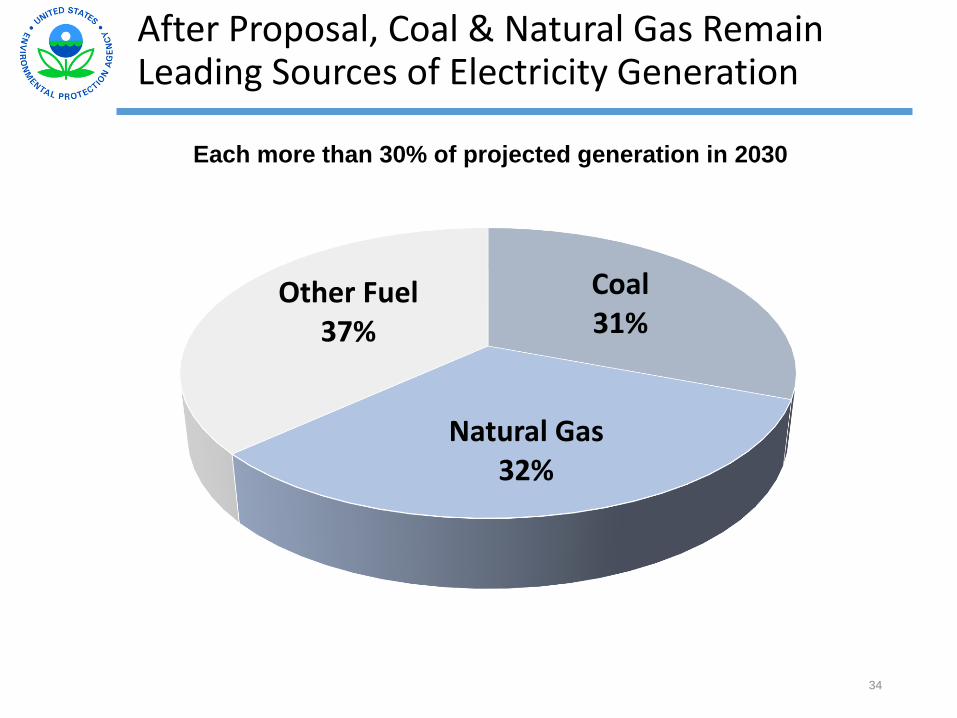
After Proposal, Coal & Natural Gas Remain Leading Sources of Electricity Generation
34
Each more than 30% of projected generation in 2030
Coal31%
Natural Gas32%
Other Fuel37%
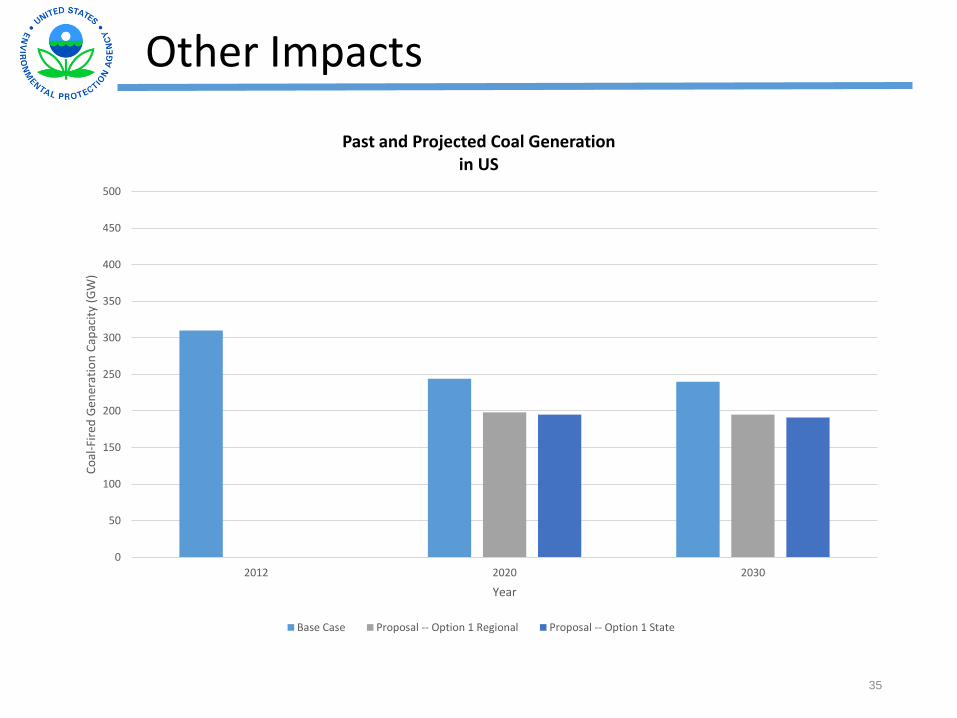
Other Impacts
35
0
50
100
150
200
250
300
350
400
450
500
2012 2020 2030
Co
al-F
ired
Gen
erat
ion
Cap
acit
y (G
W)
Year
Past and Projected Coal Generation in US
Base Case Proposal -- Option 1 Regional Proposal -- Option 1 State
36
For More State-By-State Information
http://www.epa.gov/cleanpowerplan
Next Steps
• The proposed rule, as well as information about how to comment and supporting technical information, are available online at: http://www.epa.gov/cleanpowerplan
• EPA will hold 4 public hearings the week of July 28th in Denver, Atlanta, Pittsburgh and Washington, D.C.
• There will be a 120-day public comment period on the proposal.
• Comments on the proposal should be identified by Docket ID No.
EPA-HQ-OAR-2013-0602.
37
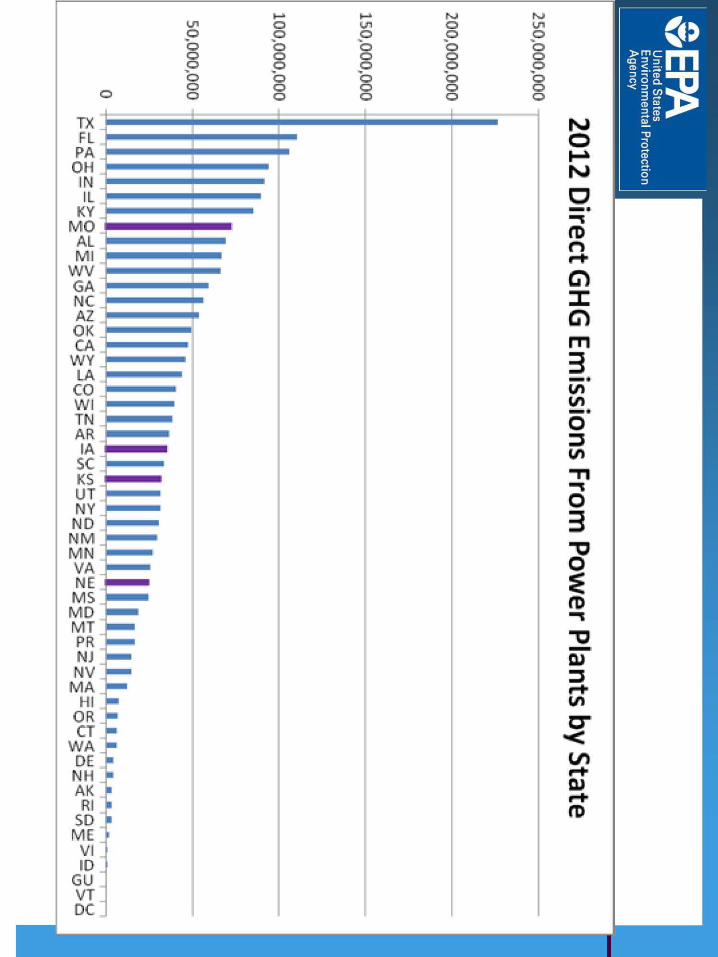
l.n 0 b 0 0 b
0 0 0
TX - :1 FL I PA _ :1
OH _ IN _ IL _
KY _ 'I
MO _ :I
AL l Ml _
WV _ :1 GA NC _ AZ OK _ CA
WY _ LA co -WI TN --~~ -SC -. KS _ UT NY _ ND NM _ MN . VA _ NE MS _ MD _ -Ml ... PR -....... NJ . -NV ----MA -HI -• OR _ • Cl • WA _ • DE . • NH _ .. AK • RI • so -. -ME I
VI ~ ID _
GU Vl DC
.- ~ i'-.1 N C) l.n e l..n C) 0 e 0 b o , b
0 b 0
b 0
0 ' 0 0 0 .. b b b O • c , 0 0 0
0 0 0 0 . -- -- --
I
I
N 0 ~ N c -· -,; tD t'\ ,... Ci) :c ~ m 3 -· "" {Iii -· 0 = {Iii
"T1 -.: 0 3 "]:I 0 =e tD -,;
-g - · I» ::::s ,.. ~
CJ"" < V) ,.. DJ ,..... CD
0) )>mcm <C ::::l ::::l (I) !S. ;:::;:
~g~ 3-(1) Q)
~CD Q) "'
-0
0 -(I)
~ 5 · ::::l

State Goals – Why They Are Different?
• State goals are unique to each state factoring in the amount of reductions that can be achieved through the 4 building blocks:
• Key factors that influence an individual state goal include:
• The ratio of coal to existing natural gas combined cycle units
• Magnitude of state RPS’s within region
• Energy demand (which impacts the potential for reductions from energy efficiency)
• Because the key factors that influence individual state goals are different for every state, each state’s goal (and reduction percentage) is different.
• The percentage reduction in emission rate implied by the 2012 actual rate (adjusted for RE) and the targets in other years is not the same as a required percentage reduction in mass emissions.
• This can be easily seen because increases in EE and RE can be accompanied by varying decreases in emissions.
• Overall, the 2012 rate to 2030 State goal comparison suggest a 33% reduction between the adjusted emission rate and the state goals, but this is achieved via a 17% reduction in emissions over that same time period.
39
Flexibilities Available To States
• Timing:
• Up to 15-year window in which to plan for and achieve reductions in carbon pollution.
• Up to two or three years to submit final plans.
• Form of goal: States can use either a rate-based or mass-based goal.
• Single or multi-state plans: States can collaborate and develop plans on a multi-state basis.
• Selection of measures:
• States will choose how to meet the goal through whatever collection of measures reflects its particular circumstances and policy objectives.
• State measures may impact and, in fact may be explicitly designed to reduce, CO2emissions from utilities on a regional basis.
• EPA would support building off existing reduction programs.
40
• Build on actions states, cities and businesses across the country are already taking to address the risks of climate change.
• Spur investment in cleaner and more efficient technologies, creating jobs and driving innovation.
• Require a reasonable emission reduction glidepath starting in 2020.
• Provide a flexible timeline—up to 15 years from guideline issuance—for
all emission reduction measures to be fully implemented in 2030.
• Recognizing that investments in infrastructure can take time to put in
place and
• Avoiding stranded assets.
• Provide an array of tools states can use to formulate approvable plans.
Summary (Cont’d)
41
Treatment of Interstate Emission Effects
► For Energy Efficiency (EE) programs and measures:
► A state may take into account in its plan only those CO2 emission reductions from
affected EGUs occurring in the state that result from demand-side energy efficiency
programs and measures implemented in the state
► States participating in multi-state plans would have the flexibility to attribute the CO2
emission reductions from EE programs among states in the multi-state area
► States could jointly demonstrate CO2 emission performance by affected EGUs
through a multi-state plan in a contiguous electric grid region
► For Renewable Energy (RE) programs and measures:
► Consistent with existing state RPS policies, a state could take into account all of the
CO2 emision reductions from affected EGUs due to renewable energy programs and
measures implemented by the state, whether they occur in the state and/or in other
states
► States participating in multi-state plans would have the flexibility to attribute the CO2
emission reductions among states in the multi-state area.
► States could jointly demonstrate CO2 emission performance by affected EGUs through
a multi-state plan in a contiguous electric grid region, in which case attribution among
states of emission reductions from renewable energy measures would not be
necessary
► See discussion in State Plan Considerations TSD for more information
42
►A stationary combustion turbine, steam
generating unit or IGCC that is (1) capable of
combusting more than 250 MMBtu/h heat input
of fossil fuel and (2) constructed for the purpose
of supplying one-third or more of its potential
net-electric output capacity and more than
219,000 MWh to any utility power distribution
system for sale (to the grid). In addition, for a
stationary combustion turbine to be considered
an EGU the heat input must consist of over 90%
natural gas.
“Covered” EGU
43


![[Metro] 60 Second Interview: Luke Tapp](https://img.pdfslide.us/doc/110x75/563db788550346aa9a8bf627/metro-60-second-interview-luke-tapp.jpg)