Embed Size (px)
Citation preview

Clean Marina Survey 2013
Anna Townshend,Marina Dock Age editor

Why Surveys?
• Not a lot of marina data out there!
• Overall, those outside the industry, especially investors, need benchmarks and numbers for comparison.
• For those inside the industry, you can gauge the overall health of the industry/program.• Gauge your own health, in comparison to others.
Be an advocate for the marina industry data! MDA surveys are conducted online, and can be found in e-newsletters and our website.
If you do not receive our surveys by email, please see me, or email me at [email protected].

Clean Marina Survey StatisticsNon-CM Spring 2013
MDA April issue
Topics
Clean Marina Procedures/PracticesMost Challenging/EasiestPurchasing EquipmentInfrastructure ChangesCost SavingsCertification/Annual CostsTime Investment
Why are you not a CM?Where do you need improvement?
Cross-tabulation
RegionalFacility SizeType of Facility

Respondent Profile – Regional/States
5%
13%
3%
6%
36%
2%
4%
27%
4%
Regional –Northeast 9% Midwest 18% South 42%
West 31%
Top States
California 16%Florida 13%Washington 8%Maryland 7%Virginia 6%Minnesota 5%South Carolina 5%Michigan 4%Wisconsin 4%

Respondent Profile – Type of Facility
Marina (wet slips only)49%
Marina (wet slips and dry storage
11%
Dry Storage
only1%
Boat-yard/
service center
(no slips/
storage)1%
Boatyard/slips and/or storage)
38%
Boatyard 39%
Marinas 60%
Storage vs. Service
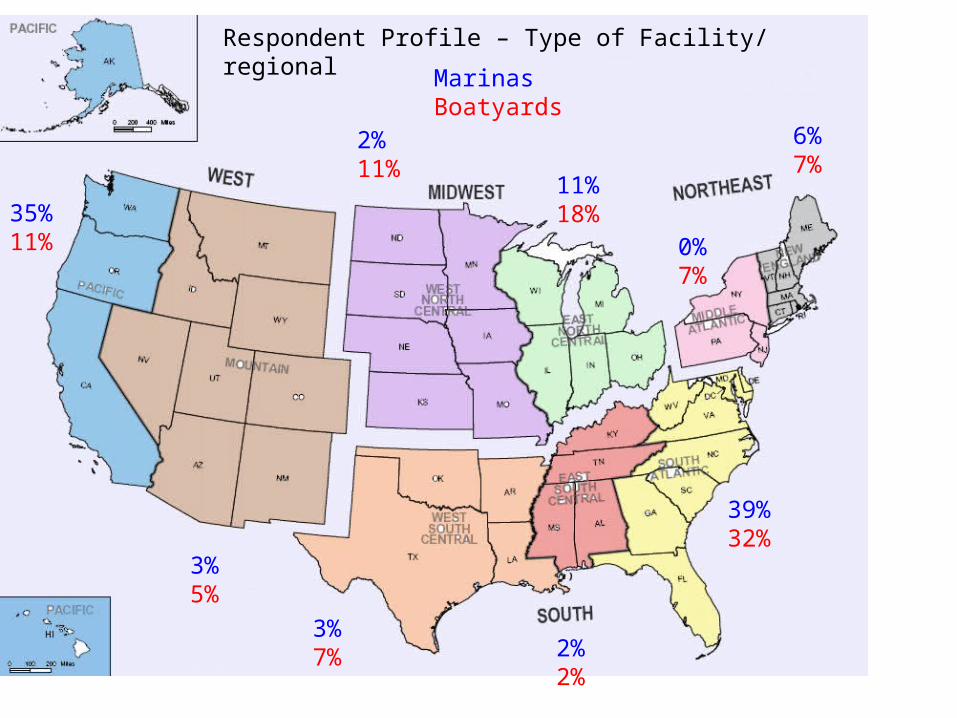
Respondent Profile – Type of Facility/ regional
6%7%
MarinasBoatyards
39%32%
2%2%
3%7%
3%5%
35%11% 0%
7%
11%18%
2%11%
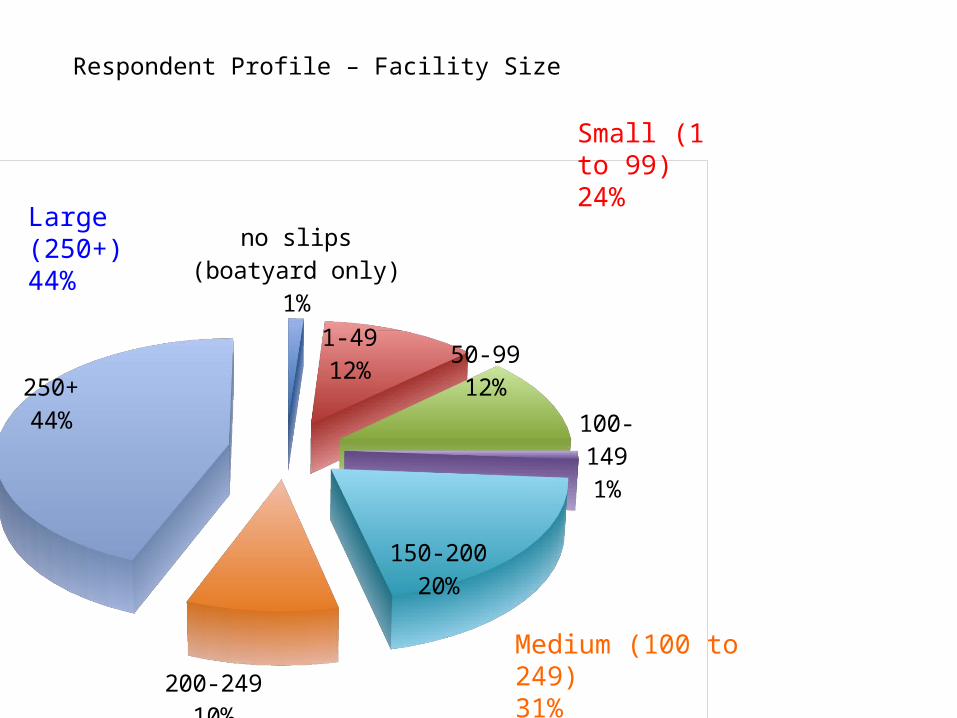
Respondent Profile – Facility Size
no slips (boatyard only)1%
1-4912% 50-99
12%
100-1491%
150-20020%
200-24910%
250+44%
Large (250+)44%
Small (1 to 99)24%
Medium (100 to 249)31%

Clean Marina Procedures/Practices – OverallIn what areas, did you implement procedures or practices as part of the Clean Marina program?
Recycling
Documentation, paperwork, recordkeeping
Emergency Response Plans
Waste containment and disposal/hazardous waste management
Petroleum control, oil spill response, SPCC
Boater Education
Stormwater, SWPPP
Sewage Handling
Vessel Maintenance and Repair
Wastewater, powerwashing, NPDES
Contractually binding customers and service providers
Fish Cleaning
Creating, restoring or protecting shoreline habitat
69%
68%
66%
65%
64%
59%
58%
57%
49%
43%
38%
33%
28%

Clean Marina Procedures/Practices – By Facility Type
Recycling
Documentation, paperwork, recordkeeping
Emergency Response Plans
Waste containment and disposal/hazardous waste management
Petroleum control, oil spill response, SPCC
Boater Education
Stormwater, SWPPP
Sewage Handling
Vessel Maintenance and Repair
Wastewater, powerwashing, NPDES
Contractually binding customers and service providers
Fish Cleaning
Creating, restoring or protecting shoreline habitat
68%
64%
68%
67%
59%
59%
51%
61%
42%
33%
38%
36%
30%
67%
73%
62%
62%
64%
56%
67%
49%
60%
58%
33%
24%
22%MarinasBoatyards
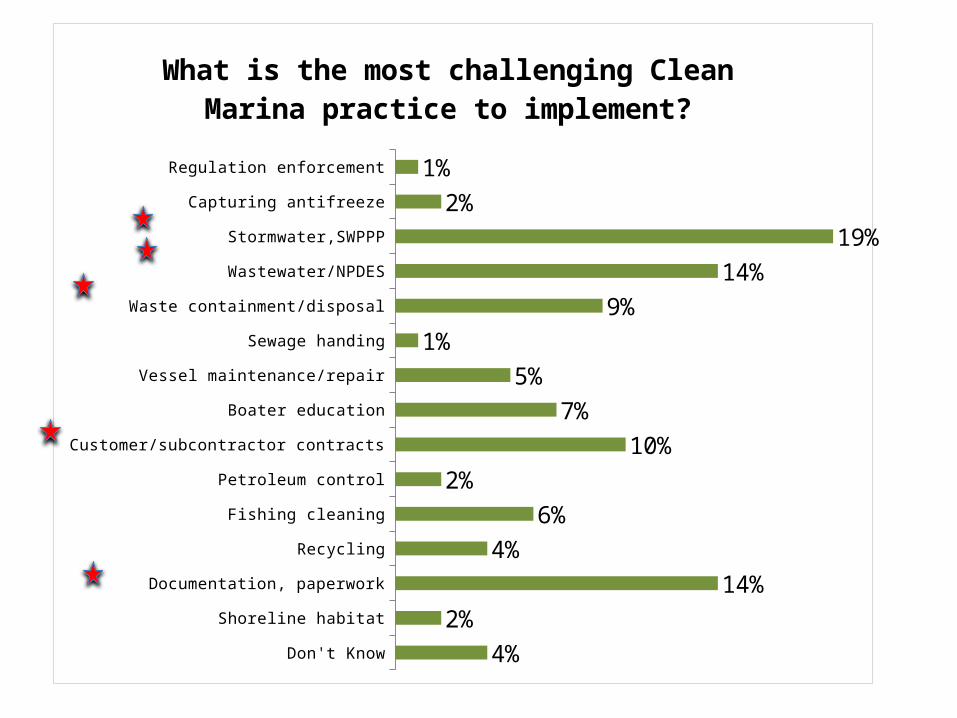
Don't Know
Shoreline habitat
Documentation, paperwork
Recycling
Fishing cleaning
Petroleum control
Customer/subcontractor contracts
Boater education
Vessel maintenance/repair
Sewage handing
Waste containment/disposal
Wastewater/NPDES
Stormwater,SWPPP
Capturing antifreeze
Regulation enforcement
4%2%
14%4%
6%2%
10%7%
5%1%
9%14%
19%2%
1%
What is the most challenging Clean Marina practice to implement?

Most Challenging Clean Marina Procedures/Practices -- REGIONAL
Storm
water,S
WPPP
Wast
ewate
r/NPDES
Wast
e contai
nment/d
isposal
Sewag
e han
ding
Vessel
mainten
ance
/repair
Boater e
ducation
Customer/
subco
ntracto
r contra
cts
Petroleu
m contro
l
Fishing c
leaning
Recyc
ling
Documen
tation, p
aperw
ork
Shorel
ine hab
itat
Capturin
g antifre
eze
Regulati
on enforce
ment
30%
10% 10%
30%
10% 10%
7%
27%
13%
7%
7%
27%
12%
29%
15%
8% 3% 3%
6%
3%
8%3%
12%
3%
8%
8%
17%
12%
12%
8%
4%
4%
12%
4%4%
WestSouthMidwestNortheast

Most Challenging Clean Marina Procedures/Practices – By Facility Size
Stormwater, SWPPP (19%)
Wastewater/NPDES (14%)
Waste containment/disposal (9%)
Sewage Handling (1%)
Vessel maintenance/repair (5%)
Boater education (7%)
Customer/subcontractor contracts (10%)
Petroleum control (2%)
Fish cleaning (6%)
Recycling (4%)
Documentation, paperwork (14%)
Shoreline habitat (2%)
Capturing antifreeze (1%)
0.44
0.11
0.11
0.11
0.19
0.14
0.16
0.03
0.03
0.05
0.03
0.14
0.14
0.03
0.05
0.14
0.17
0.03
0.03
0.1
0.14
0.14
0.14
LargeMediumSmall

Most Challenging Clean Marina Procedures/Practices – By Facility Type
Storm
water,S
WPPP
Wast
ewater/N
PDES
Wast
e contai
nment/disp
osal
Sewag
e handing
Vessel m
aintenan
ce/re
pair
Boater e
ducation
Customer/s
ubcontra
ctor c
ontracts
Petroleum co
ntrol
Fishing c
leaning
Recycli
ng
Documentati
on, pap
erwork
Shorelin
e habita
t
22%
6%
12%
6%4% 4%
2%
8%6%
18%
2%
15%
26%
3% 3% 3%6%
15%
3% 3%
9%
3%
MarinaBoatyard

Easiest Clean Marina Procedures/Practices
Stormwater,SWPPP5%
Waste con-tainment/disposal
8%Waste con-tainment/disposal
8%Sewage handing
12%Vessel main-
tenance/repair2%Boater education
19%Petroleum control
3%
Fish cleaning1%
Recycling24%
Documenta-tion, pa-perwork
8%
Shoreline habitat
1%
Emergency Response Plat
5% None4%
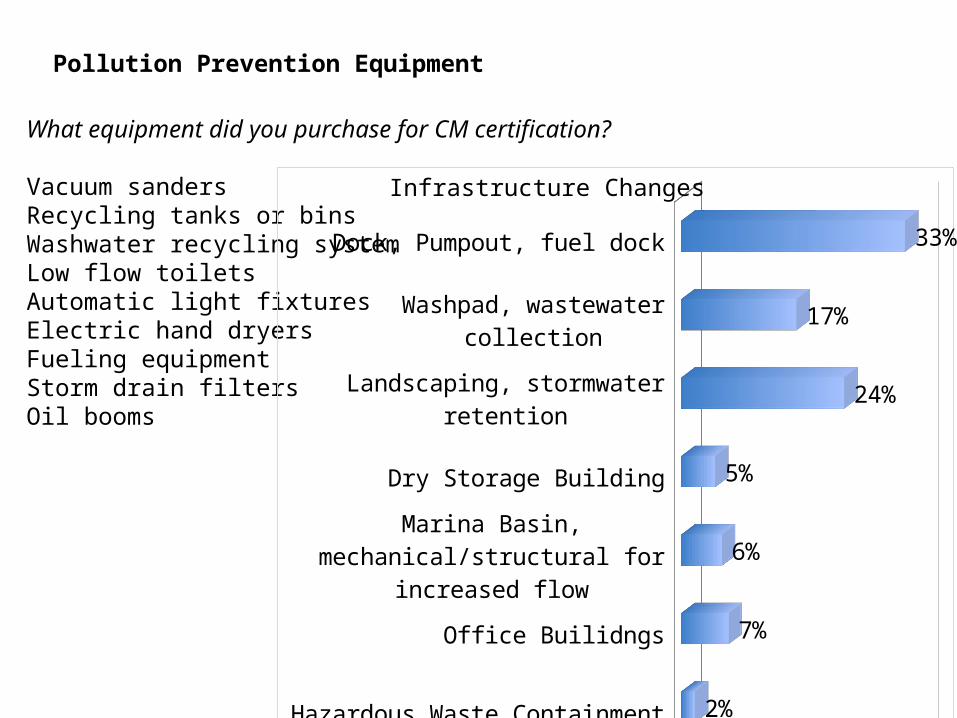
Pollution Prevention Equipment
What equipment did you purchase for CM certification? Vacuum sandersRecycling tanks or binsWashwater recycling systemLow flow toiletsAutomatic light fixturesElectric hand dryersFueling equipmentStorm drain filtersOil booms
Hazardous Waste Containment
Office Builidngs
Marina Basin, mechanical/structural for increased flow
Dry Storage Building
Landscaping, stormwater retention
Washpad, wastewater collection
Dock, Pumpout, fuel dock
2%
7%
6%
5%
24%
17%
33%
Infrastructure Changes

Infrastructure Changes – by sizePercentage of facilities (small, medium and large) that made infrastructure changes in each category
Hazardous Waste Con-
tainment (2%)
Office Builidngs
(7%)
Marina Basin (6%)
Dry Storage Building (5%)
Landscaping, stormwater
retention (24%)
Washpad, wastewater collection
(17%)
Docks. Pumpout, fuel
dock (33%)
1%
5%2%
25%
20%
38%
1%
5%
10%
5%
20%
15%
34%
9% 9%
45%
8% 9%
Small Medium Large

Total initial certification cost: $31,765
Annual Environmental Costs: $7,286
Clean Marina Costs/Time Investment
Northeast $71,438 Midwest $30,038South $42,468 West $1,925
Northeast $1,816 Midwest $30,038South $42,468 West $3,368
Estimate the total time investment from initial interest until final certification: 11 months
Annual Environmental Costs for non-CMs – $30,482
Northeast: 12 Midwest: 13South: 12 West: 5
Small Medium Large$201,000 $16,158 $26,629
Small Medium Large$51,375 $3,223 $6,521
Marinas$14,493Boatyards$52,553
Marinas$4,129Boatyards$11,406
Small Medium Large22 10
8

Clean Marina Cost SavingsDid you experience cost savings after being certified a Clean Marina?
Yes17%
No, costs have gone
up.31%
No, costs have stayed the same.
52%REGIONAL
Northeast Midwest South West
11%
23%
34%37%
89%
38% 46% 52%
38%20% 11%
No, costs stayed the sameNo, costs went upYes
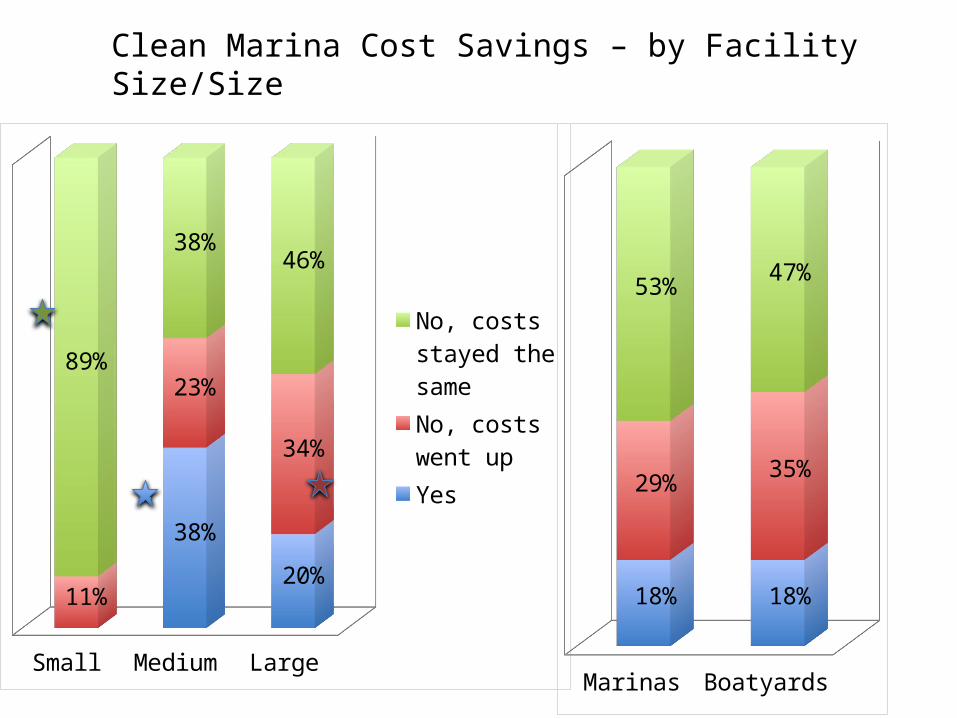
Clean Marina Cost Savings – by Facility Size/Size
Small Medium Large
11%
23%
34%
89%
38%46%
38%
20%
No, costs stayed the sameNo, costs went upYes
Marinas Boatyards
18% 18%
29%35%
53%47%

Yes, only for certification11%
Yes, for certifica-tion and contin-
ued compli-
ance11%
Yes, after certifica-tion, for contin-
ued compli-
ance11%
No grant funding67%
Grant Funding for Certification or Compliance About 1//3 used
funding
CVA Funds (pumpout)BIG Funds (transient vessels)State/municipal funds

Northeast
Midwest
South
West
10%
6%
20%
4%
30%
6%
11%
7%
60%
81%
63%
63%
6%
6%
26%
For Certification Only For certification and complianceAfter certification, for compliance No funding
Funded Facilities (1/3) – REGIONAL

Clean Marina Questions?
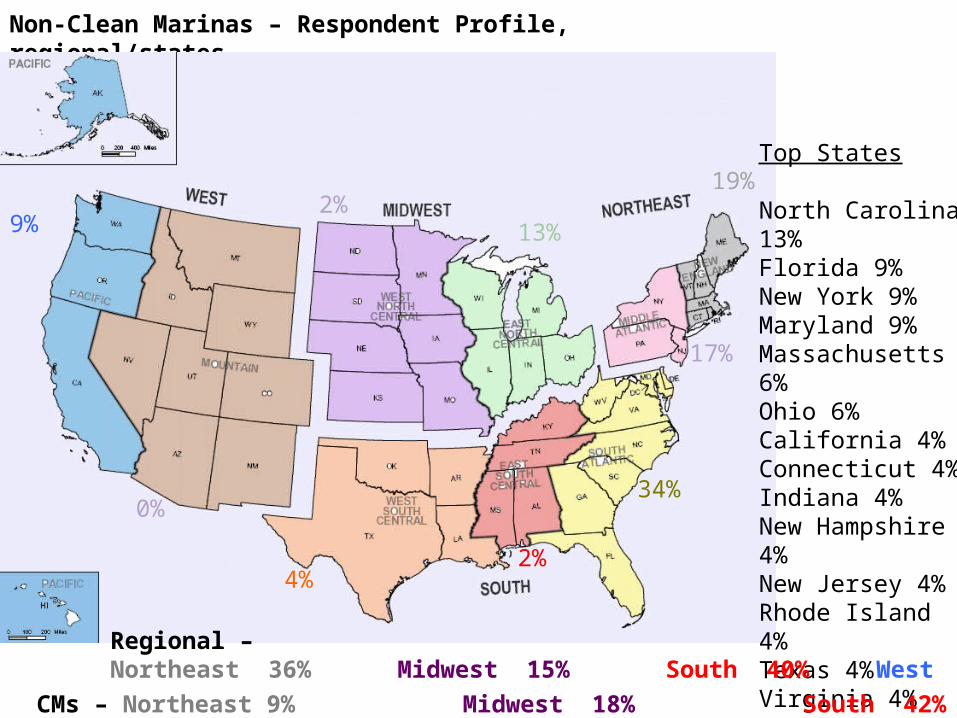
Non-Clean Marinas – Respondent Profile, regional/states
2%13%
17%
19%
34%
2%
0%
9%
4%
Top States
North Carolina 13%Florida 9%New York 9%Maryland 9%Massachusetts 6%Ohio 6%California 4%Connecticut 4%Indiana 4%New Hampshire 4%New Jersey 4%Rhode Island 4%Texas 4%Virginia 4%
Regional –Northeast 36% Midwest 15% South 40%
West 9%CMs – Northeast 9% Midwest 18% South 42% West 31%

What’s the number one reason why are you NOT a Clean Marina?
No state certi-fication pro-
gram24%
Don't know about Clean
Marina9%
Cost27%
Time20%
Inadequate staffing
12%
Unsupportive boaters
2%No pumpout
6%
Clean Marina Costs vs. the Cost of Not Being a Clean Marina

Procedures/Practices for Pollution Control and/or Environmental Regulations for non-CMs
Recycling
Documentation, paperwork, recordkeeping
Emergency Response Plans
Waste containment and disposal/hazardous waste management
Petroleum control, oil spill response, SPCC
Boater Education
Stormwater, SWPPP
Sewage Handling
Vessel Maintenance and Repair
Wastewater, powerwashing, NPDES
Contractually binding customers and service providers
Fish Cleaning
Emergency Response Plans
Creating, restoring or protecting shoreline habitat
60%
45%
66%
68%
74%
32%
55%
68%
57%
43%
38%
34%
53%
28%
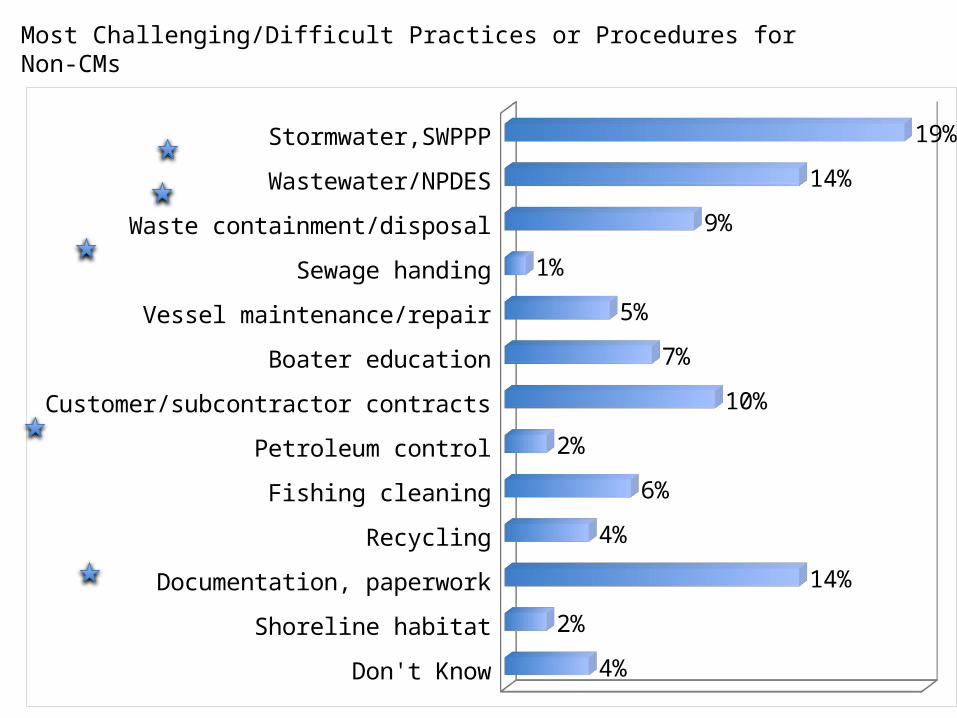
Most Challenging/Difficult Practices or Procedures for Non-CMs
Don't Know
Shoreline habitat
Documentation, paperwork
Recycling
Fishing cleaning
Petroleum control
Customer/subcontractor contracts
Boater education
Vessel maintenance/repair
Sewage handing
Waste containment/disposal
Wastewater/NPDES
Stormwater,SWPPP
4%
2%
14%
4%
6%
2%
10%
7%
5%
1%
9%
14%
19%

In what areas, do you most need improvement?
None13%
Recycling6%Documenta-
tion, paper-work,
recordkeep-ing
13%Emergency Response
Plans7%Boater Educa-
tion3%
Stormwater, SWPPP10%
Sewage Handling3%
Vessel Main-tenance and
Repair7%
Wastewater, pow-erwashing, NPDES
26%
Emergency Response
Plans7%
Creating, restoring or protect-ing shoreline habitat
6%

Infrastructure Changes for Pollution Control or Regulation Standards – overall Non-CMs
Office Builidngs
Marina Basin, mechanical/structural changes to increase flow
Dry Storage Building
Landscaping, stormwater retention
Washpad, wastewater collection
Docks. Pumpout, fuel dock
17%
6%
11%
40%
38%
43%

Thank you!
Watch for MDA surveys all year round!
Questions, comments, concerns,contact Anna Townshend,[email protected]