Embed Size (px)
Citation preview

LETTER
Clean energy deployment: addressing financingcostTo cite this article: Nadia Ameli and Daniel M Kammen 2012 Environ. Res. Lett. 7 034008
View the article online for updates and enhancements.
Related contentDiffusion of environmentally-friendlyenergy technologies: buy versus leasedifferences in residential PV marketsVarun Rai and Benjamin Sigrin
-
Energy benchmarking of commercialbuildings: a low-cost pathway towardurban sustainabilityMatt Cox, Marilyn A Brown and XiaojingSun
-
Implementing nationally determinedcontributions: building energy policies inIndia’s mitigation strategySha Yu, Meredydd Evans, Page Kyle et al.
-
Recent citationsHow to finance energy renovation ofresidential buildings: Review of currentand emerging financing instruments in theEUPaolo Bertoldi et al
-
Renewable electricity finance in the UnitedStates: A state-of-the-art reviewJoel Krupa and Danny Harvey
-
Innovations in financing that drive costparity for long-term electricitysustainability: An assessment of Italy,Europe's fastest growing solar photovoltaicmarketNadia Ameli and Daniel M. Kammen
-
This content was downloaded from IP address 115.23.121.76 on 14/09/2021 at 06:12

IOP PUBLISHING ENVIRONMENTAL RESEARCH LETTERS
Environ. Res. Lett. 7 (2012) 034008 (12pp) doi:10.1088/1748-9326/7/3/034008
Clean energy deployment: addressingfinancing cost
Nadia Ameli1,2,3 and Daniel M Kammen2
1 Fondazione Eni Enrico Mattei, Italy2 Energy and Resources Group, University of California, Berkeley, USA
E-mail: [email protected]
Received 20 February 2012Accepted for publication 30 May 2012Published 13 July 2012Online at stacks.iop.org/ERL/7/034008
AbstractNew methods are needed to accelerate clean energy policy adoption. To that end, this studyproposes an innovative financing scheme for renewable and energy efficiency deployment.Financing barriers represent a notable obstacle for energy improvements and this isparticularly the case for low income households. Implementing a policy such asPACE—property assessed clean energy—allows for the provision of upfront funds forresidential property owners to install electric and thermal solar systems and make energyefficiency improvements to their buildings. This paper will inform the design of better policiestailored to the creation of the appropriate conditions for such investments to occur, especiallyin those countries where most of the population belongs to the low–middle income rangefacing financial constraints.
Keywords: financing barriers, energy efficiency, solar photovoltaic, energy investments
1. Introduction
The diffusion of energy efficiency and renewable energytechnologies and their contribution to meeting the world’senergy needs hinges critically on how rapidly these marketscan be scaled-up. This expansion, in turn, depends criticallyon the strength of government support. The IntergovernmentalPanel on Climate Change notes that the future share ofrenewable energy applications will heavily depend on climatechange mitigation goals and supporting policies (IPCC 2011).Energy improvements have a crucial role in moving towardsa more sustainable energy path and with prevailing energypractices, the potential is large. At the household level,electricity and fuel prices have risen dramatically, pressuringthe budgets of the poorest families. In Italy, prices forelectricity have increased by more than 25% in the lastfive years while prices for heating gas have increased byapproximately 16% since 2009 (AEEG 2010). An importantpart of the energy equation is determined by the residentialsector, given that housing structures account for more than
3 Address for correspondence: Corso Magenta 63, 20123 Milan, Italy.
35% of total energy use and almost 23% of electricityconsumption in Italy (Department of Economic Development2010). Italy is among the largest electricity consumers inEurope with structural dependency of 14% over the last10 years as reflected in Italy’s primary energy import (seenote (i) in the appendix) being approximately 87.7% in2009, compared to an EU average of 56% (AEEG 2010).From an economic point of view, the total energy importcost represents 3.3% of national GDP (see note (ii) in theappendix). According to Union Oil projections, in 2011energy costs are expected to surpass 60 billion euros, the peakenergy import cost for the country.
Reducing building energy consumption would changethe picture significantly; energy standards and codes for newconstructions have been effective tools in increasing energyefficiency levels in new buildings constructed. However,improving the efficiency of energy use in the existing buildingstock, which accounts for approximately 33 million units(Department of Treasury 2011) is also important. It is likelythat 2020 European targets will be feasible with specificpolicies directed at reducing energy consumption in theexisting stock of buildings and the promotion of renewable
11748-9326/12/034008+12$33.00 c© 2012 IOP Publishing Ltd Printed in the UK

Environ. Res. Lett. 7 (2012) 034008 N Ameli and D M Kammen
Figure 1. Lorenz curve for Italy in 2010.
energy deployment as well. Despite the effort made, thereis a substantial ‘efficiency gap’ between a consumer’s actualinvestment in energy efficiency and those that appear to bemade in the consumer’s own interest (Golove and Eto 1996).This efficiency gap is defined as the difference between thehighest implicit discount rate and the market rate of returnassociated with similar investments. Although most of theenergy efficiency measures are cost-effective with a positivenet present value, they are not implemented. Various reasonssuch as financial barriers, insufficient information/knowledgeand analytical capacity (Sanstad and Howarth 1994), lowpriority of energy issues, transaction costs, uncertainty ofsavings, split incentives, liquidity constraints in capitalmarkets (Blumstein et al 1980), and the need for investmentsin upfront costs explain the existence of an energy efficiencygap.
This paper discusses the potential application of PACEto the Italian context. To ensure the high impact of anypolicy, a key step is to identify the potential populationwhich would benefit from it. We referred to Lorenz curveand Gini index to quantify the households belonging to thelow–middle income (figure 1, see note (iii) in the appendix).The average income per capita is 18 900 e (taxpayer) and22 700 e (owner taxpayer), consequently a typical energyinvestment with a value of 16 000 e would represent 85% and70% of their annual income, respectively. The Gini coefficient(presented within figure 1 in the legend in parenthesis, seenote (iv) in the appendix) in both cases analyzed in figure 1,exceeds 0.4 showing that income inequality is reasonably highin Italy. It is also important to keep in mind that Italy ischaracterized by north–south dualism, which reflects also inenergy investments. The point in case is that the income gapbetween the average household in northern and southern Italy,accounts approximately 32% (ISTAT 2010, see note (v) in theappendix). For instance, the highest (Trentino Alto Adige) andthe lowest (Campania) average household income accountedapproximately 21.465 e and 12.432 e, respectively.
With regards to energy investments, the Italian NationalAgency for New Technologies, Energy and SustainableEconomic Development (ENEA 2010a, 2010b) reportedthat 71% of energy retrofits (e.g. windows replacement,solar thermal, building envelope and energy retrofits) were
Figure 2. Households loan market, percentage trend. Blue lineshows percentage reduction registered over 3 months and red lineshows annual percentage reduction. Reproduced with permissionfrom Bank of Italy (2010).
completed in the north whereas 16% and 13% were located incenter and south, respectively (see note (vi) in the appendix).Similarly, the solar photovoltaic (PV) investments hadcomparable trend: the north leading with 56% of installations,followed by 17% and 27% in central and south, respectively(GSE 2011, see note (vii) in the appendix). The evidencereported suggests that the typical household investing inenergy improvement is located in the well off economicregions in Italy predominantly found in the northern areas.The trend illustrated conflicts with the abundant insolationin southern Italy e.g. daily average equals to 5 kWh/m2
compared to 4 kWh/m2 in northern, ENEA database (seenote (viii) in the appendix), which results in higher solarPV system performance as well as net present value (NPV)results, making investments in those regions more attractive.Thus, to address this economic dualism in relation to energyefficiency investments, it is imperative to move away fromnorth to south, and appropriate financing policies are relevantto overcome the dichotomy in economic well being.
These features need to be considered with referenceto the Italian credit context. The financial crisis, whichstarted in August 2007, has worsened credit supply conditionsin the country. Referring to the household data available,access to credit has decelerated from 2006 to 2009. Since2006 consumers credit supply went down by 7.5% points(figure 2). The slowdown recorded has coincided with boththe economic crisis and the deterioration of consumers’ ‘creditworthiness’ in addition to the decrease of consumer spendingand investments (Bank of Italy 2010). Such concurrenceof events tightened consumers credit supply (Bank of Italy2012).
Lower financing barriers in a country characterized bylow income level (particularly relevant in southern Italy),high inequality and worsening consumers credit access,will potentially enable energy efficiency and renewabledeployment on a large scale. A key issue emerging within thedebate in previous years, is how policy can create the rightconditions for such investments to occur.
This paper is structured as follows. Section 2 providesan overview of the proposed property assessed cleanenergy—PACE—policy with different scenarios modeled.Within section 3 we compare financing solutions relevant for
2

Environ. Res. Lett. 7 (2012) 034008 N Ameli and D M Kammen
residential energy projects. Section 4 is then used to draw anoverall assessment of the findings presented in the paper.
2. PACE property assessed clean energy
A property assessed clean energy (PACE) policy focuses onthe upfront cost in energy improvements and renewable en-ergy deployment. It is structured to enable local governmentsto raise money through the issuance of bonds to fund cleanenergy projects. This program allows residential propertyowners to install energy efficiency measures, solar thermaland solar PV, while paying for the cost over a 20 year periodthrough a special tax, which is collected as a line item on theproperty tax bill. If the property is sold before the end of therepayment period, the new owner takes over the remainingspecial tax payments as part of the property’s annual taxbill. The long repayment period and transferability of thepayments allow property owners to invest in deeper energysavings and renewable projects that pay back over a longerperiod than many existing financing options allow (Fuller et al2009b). In the United States, 27 states enacted legislation andprograms that have been implemented through city, countyand state-level initiatives (see note (ix) in the appendix).Significantly, local governments determine the eligible energyefficiency or renewable energy technologies for financing(see note (x) in the appendix). For instance, take the caseof two cities: city of Berkeley (California) allowing solarPV installation and city of Babylon (New York) permittingsolar PV, solar thermal and energy efficiency measures. Inboth cases, the program has diverse approaches accordingto the area and design. Indeed, the primary goal of PACEis to address financial barriers to energy investments andto encourage regional and national governments to integrateenergy efficiency and renewable energy planning.
To assess the impact of PACE financing on residentialcustomers, we have created a model to compare the netpresent value of annual cash flows over 25 years for energyretrofits (see note (xi) in the appendix). The financingcalculator was designed in close collaboration betweenthe University of California, Berkeley and the PolytechnicUniversity of Marche, Italy. The following results are basedon modeled data. In this respect, we designed a user-friendlytool to support homeowners in understanding the potentialfinancial impact of financing solar PV, solar thermal, andenergy efficiency (see note (xii) in the appendix). Modelassumptions are summarized in table 1. Data for theMarche region are used as the baseline for the scenariosmodeled. The final results obtained by the financing calculatorare based on Marche average energy consumption andsavings as well as the prevailing energy prices, solarirradiation and technological performances for that region.The Marche region was chosen because energy efficiencysavings are greater in North Italy (due to energy consumptionbeing significantly higher compared to other areas), whilephotovoltaic electricity production is higher in South Italy dueto the better insolation. It is important to note that this casedoes not take into account differences among climate areas. At
the same time Marche region has values similar to the averagevalues across all of Italy (AEEG 2010).
For an average household in Italy, the net present valuewas computed for solar PV installation only and then forcombined energy efficiency improvements and solar PVinstallation. Different scenarios are modeled and we took intoaccount the year of installation (relevant to compute the solarPV incentive) as well as the electricity and gas price escalation(tables 2 and 3). Between 2005 and 2011, Italian nominalelectricity rates rose by 25% and gas rates registered anincrease of 16% in the last three years (AEEG 2010). Based onthese changes, forecast scenarios including gas and electricityprice escalation have a high probability of occurrence.Our analyses assumed the gas heating system, as the highelectricity price in Italy makes electric heating in this countryunlikely. The NPV values computed for combined energyefficiency improvements and solar photovoltaic installationare affected by gas price as energy efficiency improvements(e.g. windows replacement) impact on heating consumption.The main results obtained are sensitive to the cost of solar,which is influenced by PV module price as it is the maincost driver, representing 60% of total investment according toEPIA and Rocky Mountain Institute data (EPIA 2010, RockyMountain Institute 2010). Price escalation represents anothersensitive variable in the assessment provided by the meter.
A version of the calculator used for the models ismaintained online with the possibility to enter more updatedassumptions and values summarized in table 1 (i.e. PV moduleprice).
NPV results presented in table 2 have been computedusing the following formula (1):
NPV =N∑
i=0
ACFn
(1+ d)n(1)
where ACF, annual cash flow; d, discount rate.The annual cash flow is given by equation (2):
ACF = energy savings EE+ energy savings PV+ FiT
+ net metering+ tax credit− FC− OM (2)
where energy savings EE, gas bill savings from energyefficiency; energy savings PV, electricity bill savings fromsolar PV; FiT, feed-in tariff incentive; net metering, netmetering incentive; tax credit, tax credit rebate allowed forenergy efficiency upgrades; FC, financing cost; OM, operationand maintenance costs. Those values are expressed by thefollowing equations ((3)–(6)):
energy savings EE = expected gas saved
× gas price (e/m3) (3)
energy savings PV = expected electricity
saved× electricity price (e/kWh) (4)
FiT = kWh from solar PV× Tariff (e/kWh) of FiT
(see note (xiv) in the appendix) (5)
Net metering = min[Ee;Ef] + CsEn (6)
where Ee, electricity exported to the grid (electricitywithdrawn from the grid); Ef, electricity fed into grid
3

Environ. Res. Lett. 7 (2012) 034008 N Ameli and D M Kammen
Table 1. Model assumptions (Marche region’s data baseline). (Note: a version of the calculator used for the models is maintained online forpublic use at http://rael.berkeley.edu/financing-italy-IV.)
Model assumptions—Italy
Energy consumption For the Marche case, consumption is based on 2009 ISTAT (see note (xiii)in the appendix) Environmental Data. Family (2–3 people) averageconsumption is 2700 kWh/yr and 1497 m3/yr of natural gas.
Electricity price The electricity price is based on AEEG residential rate of 0.1583 e/kWh(average rate for 2700 kWh/yr consumption)
Gas prices The gas price is based on AEEG residential rate of 0.7234 e/m3 (averagerate for 1497 m3/yr consumption)
Solar PV system • Solar size depends on percentage supplied by solar PV with an installedcost of 4.00 e/W• Operation and maintenance costs are assumed 0.1%/year of installed cost
Solar power production • According to UNI 10349 and UNI 8477—solar radiation• Default correction for Azimuth South and 30◦ tilt• Increase production of 20% relative to fixed system• General system losses of 20%
Solar performance PV system life of 25 years, with a performance degradation of 0.83%/year
Inverter Inverter replacement in year 12 for approximately 600 e/kW
Solar thermal system Solar thermal size depends on the household size with an installed cost of1000 e/m2
Solar thermal production • According to UNI 10349—solar radiation• Default correction for Azimuth South and 30◦ tilt• Designed according to Itaca Protocol• Inlet and outlet water temperature ranging from 15 to 40 ◦C, according toUNI 11300:2008
Solar thermal performance Solar thermal system life of 25 years, with a performance degradation of0.83%/year
Rebate (see note (xiv) in the appendix) andrevenues (see note (xv) in the appendix)
• Feed-in tariff is paid for electricity produced by solar PV over a period of20 years• ‘Net metering incentive’ is paid for energy exported to the grid•Minimum prices for electricity sold are guaranteed by law (GSE)
Tax credit (see note (xvi) in the appendix) Tax rebate of 55% improvement cost is allowed for energy efficiency
Financial parameters • Average inflation rate of electricity price of 3%• Average inflation rate of gas price of 5%• General inflation rate is not considered (zero)• Discount rate of 5%• Interest rate of 5.5% with a term of 20 years
(electricity injected into grid); Cs, service cost (distribution);En, net energy exchanged to the grid (see note (xiv)in the appendix). Under ‘the net metering scheme’, theelectricity generated by solar PV system and injected intothe grid can be used to offset the electricity withdrawnfrom the grid. The Italian Energy Agency (GSE, Gestoredei servizi elettrici) provides a contribution to the customerbased on injections and withdrawals of electricity. Table 2provides more information concerning electricity producedby solar PV, electricity consumed (e.g. average householdconsumption), electricity fed (electricity injected into thegrid), electricity exported (electricity withdrawn from thegrid) and electricity self-consumed (electricity consumed atthe time of production). We assumed three time-ranges duringthe day in which the household consumes electricity (seenote (xvii) in the appendix) (e.g. 7 am–9 am; 11 am–2 pm;6 pm–10 pm). Electricity consumption is assumed to beconstant in these time-ranges (a version of the financingcalculator is maintained online with the possibility to enter
more different time-ranges consumptions) (see note (xviii) inthe appendix). Consequently, the electricity exported and fedinto the grid derives from these assumptions (equations (7)and (8)):
Electricity exported (withdrawn)
= electricity produced− electricity consumed (7)
(If electricity produced ≥ electricity consumed);
Electricity fed (injected)
= electricity consumed− electricity produced (8)
(If electricity consumed ≥ electricity produced).All the values needed to compute the feed-in tariff
incentive are listed in table 1 and in the correspondingnotes. Electricity produced by solar PV is awarded by tariffincentives over a period of 20 years (see note (xiv) inthe appendix). Electricity fed and exported to the grid arequantified according to a net metering scheme over a periodof 20 years (see notes (xiv) and (xv) in the appendix). Values
4

Environ. Res. Lett. 7 (2012) 034008 N Ameli and D M Kammen
Table 2. Electricity produced by solar PV, electricity consumed and grid compensation.
Year
Electricityproduced(kWh)
Averageelectricityconsumed (kWh)
Electricity fedinto the grid(kWh)
Electricityexported to thegrid (kWh)
Electricityself-consumed(kWh)
2012 3985 2721 2792 1528 11932013 3952 2721 2762 1532 11902014 3919 2721 2732 1535 11862015 3885 2721 2703 1539 11832016 3852 2721 2673 1542 11792017 3819 2721 2643 1546 11762018 3786 2721 2614 1549 11722019 3753 2721 2584 1553 11692020 3719 2721 2554 1557 11652021 3686 2721 2525 1560 11612022 3653 2721 2495 1564 11582023 3620 2721 2466 1567 11542024 3587 2721 2436 1571 11502025 3553 2721 2407 1575 11472026 3520 2721 2377 1578 11432027 3487 2721 2348 1582 11392028 3454 2721 2319 1586 11352029 3420 2721 2289 1590 11312030 3387 2721 2261 1595 11272031 3354 2721 2232 1599 11222032 3321 2721 2203 1603 11182033 3288 2721 2174 1608 11142034 3254 2721 2145 1612 11092035 3221 2721 2117 1617 11042036 3188 2721 2088 1622 1100
Table 3. Net present value comparison, basic scenario (see note (xix) in the appendix). (Note: parenthesis indicate negative value.)
Year of installation
I semester 2012 I semester 2013 I semester 2014 I semester 2015 I semester 2016
Solar PV 8199 e 5493 e 2299 e (862) e (4270) eSolar PV and EE 8474 e 5768 e 2574 e (587) e (3995) e
are reported for 25 years as we assumed a PV system life of25 years, relevant to assess electricity saved.
As shown in tables 3–5 and figures 3 and 4, most ofthe projected scenarios have a positive net present value,especially when energy improvements are completed in 2012and 2013. It is important to note that the key factor affectingthis result is a feed-in tariff scheme. Forecast scenariosunder the highest tariff incentive (2012–13) will tend toprovide positive net present values (the feed-in tariff schemedeclines monthly in 2011 and every six months thereafter).A study conducted on the sensitivity of NPV to feed-intariff rates highlights a huge effect. In 2013 feed-in tariff(tariff e/kWh produced) and net metering scheme willbe replaced by the all-comprehensive tariff, which allowsspecific rates for electricity feed into a grid and differenttariffs for electricity self-consumed. With the previous schemethe entire electricity produced by the solar PV system isincentivized and additional contribution is recognized to offsetthe net electricity exchanged with the grid (net meteringscheme). The introduction of the all-comprehensive tariffwill negatively affect NPV projects (figure 3 and tables 4and 5). The analysis showed that the introduction of theall-comprehensive scheme resulted in an NPV reduction of
60% for years 2013/2014 and 2014/2015 and an impressiveerosion of NPV value in 2016 getting negative value (solarPV case). In the case of solar PV installation and windowsreplacement, the NPV value will decrease by 55% and 77%,in 2013/2014 and 2014/2015 respectively, and an impressiveerosion of NPV value will occur in 2016. In addition, theimpact of a potential electricity and gas price escalation wasstudied (table 5). A projected increase in electricity and gasprices by 2%/yr resulted in an NPV value increase of 27%for solar PV only and of 42% for solar PV and EE (resultscomputed derived from average increase registered in NPVproject values).
Figure 4 shows the cash flow for the base caseover 25 years. The high cash flow is mainly due to the‘Conto Energia’ (see note (xx) in the appendix) incentive,corresponding to 0.274 e/kWh for the first semester in 2012and the negative drop is driven by the cost of purchasing anew inverter (these inverters are expected to be replaced atthis time). Income in the last five years is a direct consequenceof the financing being repaid in 20 years. While interpretingthese results, one should keep in mind that the Marche data isused as baseline and therefore the values provided are typicalfor central Italy.
5

Environ. Res. Lett. 7 (2012) 034008 N Ameli and D M Kammen
Figure 3. NVP comparison based on year of installation.
Figure 4. Annual cash flow projections for solar PV and EE installed first semester 2012.
Table 4. NPV and feed-in tariff comparison (2013–6). (Note: in 2013 the feed-in tariff scheme will be replaced by an all-comprehensivetariff. Consequently we are unable to compute the percentage tariff reduction of two different supporting schemes. Percentage reductionsare computed referring to the first semester of each year. The NPV results presented have been computed using previous equations ((1) and(2)).)
NPV and tariff % reduction with respect to solar PV installation in theprevious year
2012/2013 (%) 2013/2014 (%) 2014/2015 (%) 2015/2016 (%)
NPV solar PV −33.00 −58.15 −62.51 −395.36NPV solar PV and EE −31.93 −55.37 −77.20 −580.58Tariff — −20.80 −25.93 −40.45
Table 5. Scenario for electricity and gas price escalation. (Note: NPV results presented have been computed using previous equations(equations (1) and (2)).)
Year of installation
I semester2012
I semester2013
I semester2014
I semester2015
I semester2016
Electricity price(%)
Gas price(%)
Solar PV 7855 e 5184 e 1955 e (1207) e (4615) e +2 —Solar PV and EE 7422 e 4716 e 1522 e (1639) e (5047) e +2 +2Solar PV 8597 e 5891 e 2697 e (465) e (3873) e +4 —Solar PV and EE 8602 e 5895 e 2702 e (460) e (3868) e +4 +4
3. Comparison of financing solutions
Homeowners can opt for different solutions to finance energyimprovements. To select the most cost-effective optionswe compared the NPV and the profitability index (whichquantifies the amount of value created per unit of investment)(see note (xxi) in the appendix) for a typical energy package(figures 5–7). The NPV is the main financial tool for the
evaluation of budgeting investment projects (Ross et al 1996).Quantifying in a single value the investment benefit allowscomparisons with diverse options. Economic evaluation is aworthy method to select the most cost-effective way to financeour energy investments. This energy package has an assumedvalue of 16 000 e depending on how it is financed and itincludes the solar PV and EE options (see note (xxii) inthe appendix). We assumed an average investment value of
6
Environ. Res. Lett. 7 (2012) 034008 N Ameli and D M Kammen
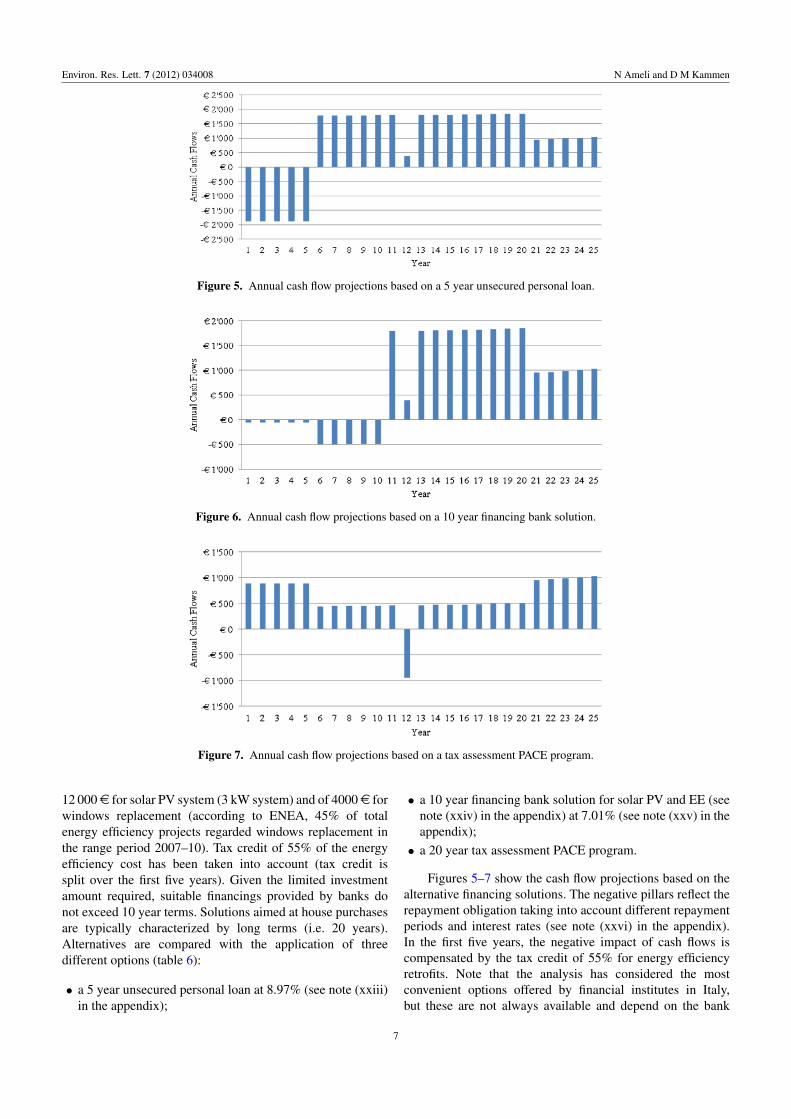
Figure 5. Annual cash flow projections based on a 5 year unsecured personal loan.
Figure 6. Annual cash flow projections based on a 10 year financing bank solution.
Figure 7. Annual cash flow projections based on a tax assessment PACE program.
12 000 e for solar PV system (3 kW system) and of 4000 e forwindows replacement (according to ENEA, 45% of totalenergy efficiency projects regarded windows replacement inthe range period 2007–10). Tax credit of 55% of the energyefficiency cost has been taken into account (tax credit issplit over the first five years). Given the limited investmentamount required, suitable financings provided by banks donot exceed 10 year terms. Solutions aimed at house purchasesare typically characterized by long terms (i.e. 20 years).Alternatives are compared with the application of threedifferent options (table 6):
• a 5 year unsecured personal loan at 8.97% (see note (xxiii)in the appendix);
• a 10 year financing bank solution for solar PV and EE (seenote (xxiv) in the appendix) at 7.01% (see note (xxv) in theappendix);• a 20 year tax assessment PACE program.
Figures 5–7 show the cash flow projections based on thealternative financing solutions. The negative pillars reflect therepayment obligation taking into account different repaymentperiods and interest rates (see note (xxvi) in the appendix).In the first five years, the negative impact of cash flows iscompensated by the tax credit of 55% for energy efficiencyretrofits. Note that the analysis has considered the mostconvenient options offered by financial institutes in Italy,but these are not always available and depend on the bank
7

Environ. Res. Lett. 7 (2012) 034008 N Ameli and D M Kammen
Figure 8. Annual cash flow projections based on loan for use. (Note: in this specific case, annual cash flows correspond to the electricitybill savings from solar PV. ACF = energy savings PV.)
Table 6. Comparison of financing options. (Note: NPV results presented have been computed using the previous equations (equations (1)and (2)).)
Difference frombest case
Financing options NPV PI NPV PI
PACE program 8474 e 0.53 — —Unsecured personal loan 7364 e 0.46 1110 e 0.07Bank package for solar PV and EE 7561 e 0.47 913 e 0.06
or financial institute’s location. Our findings show that awell-designed PACE program is always superior to the otherfinancing mechanisms as it provides a higher NPV andprofitability index (PI). The closest option to PACE is the10 year financing bank solution, where the gap accounts forabout 913 e in NPV terms and 0.06 regarding the PI. Thebreak-even interest rate, which is the value where the NPVof PACE program equals the NPV of other financing options,corresponds to 6.1% for the bank package and to 6.3% in thecase of the unsecured personal loan.
Considering the financing solutions provided by theprivate sector, many companies (see note (xxvii) in theappendix) introduced the loan for use contract to support solarPV installations. In civil law, a loan for use agreement isdefined as a free concession of anything, either movable ornot movable, under a certain timeframe with the obligationto return the good received (Civil Code art. 1803-1812). It isimportant to note that this type of contract is available onlyfor solar PV. Companies are responsible for all the project’saspects in terms of cost, installation and maintenance as wellas beneficiaries’ incentives. The homeowner will benefit fromthe electricity produced by the solar system. This formulais very attractive for companies which take advantage ofgenerous feed-in tariff schemes over a period of 20 years. EEis not supported by a similar policy, and consequently it is lessattractive business for firms. Greater uncertainty in savingsadded to limited profit margins are key issues in discouragingcompanies from designing suitable financial products for EE.
To provide a complete analysis of the financing solutionsavailable on the market, we considered the ‘typical loan foruse contract’ offered by some private companies (figure 8).This formula ensures positive cash flows given by the energysaved on monthly utility bills and the net present value derivedis about 4175 e. Comparing this result to NPV based onPACE tax assessment (table 3), we registered a difference ofabout 4024 e. The gap computed is mainly due to the ‘Conto
Energia’ incentive. The feed-in tariff scheme contributes forabout 50–55% to positive annual cash flows and consequentlyto the NPV value. With respect to previous financing solutions(bank loan and PACE program), homeowners would be thebeneficiaries of the feed-in tariff. In the case of privatecompanies providing financial solutions, firms will profit bythis incentive. Even though the financing formula provided bythe private sector addresses upfront cost, it does not maximizeNPV for customers.
4. Conclusion
A key issue emerging within the debate in previous years ishow policy and programs may influence consumer perceptionand enable investment in energy efficiency. The aim of thisstudy was to underline the importance and the need fornew financing models to address the initial financing risksand cash flow barriers of clean energy projects. Given thehigh energy-saving opportunities in the residential sector,we referred to the Lorenz curve and Gini index to analyzethe distribution of property owner wealth. Income inequalityis reasonably high in Italy, where the Gini index assumesa value of 0.40 regarding owner taxpayers and 0.42 fortaxpayers overall. This corresponds to 72% and 80% ofthe investigated population with an income lower than26 000 e/yr, suggesting that due to the overall condition ofItalians households, investment in energy projects is unlikely.A typical energy investment with a value of 16 000 e wouldrepresent 85% and 70% of their annual income. In addition,the financial crisis started in August 2007 has worsenedthe country’s credit supply conditions. Lower financingbarriers in a country characterized by low income levels(particularly relevant in southern Italy), high inequality andworsening consumer credit access, will potentially enableenergy efficiency and renewable deployment on a large scale.
8

Environ. Res. Lett. 7 (2012) 034008 N Ameli and D M Kammen
Table A.1. Source: Department of Treasury and ISTAT 2010.
Taxpayers Owner taxpayers
Income range(e, euro)
Taxpayersnumber
Averageincome
Relativefrequency
Owner taxpayersnumber
Averageincome
Relativefrequency
<10 000 14 112 749 4 656 0.340 6 210 707 4 946 0.25610 000–26 000 18 914 233 17 458 0.456 11 299 196 17 820 0.46526 000–55 000 6 970 245 34 349 0.168 5 460 127 34 631 0.22555 000–75 000 734 919 63 689 0.018 623 904 63 737 0.026
>75 000 790 908 129 973 0.019 696 533 130 249 0.029
Total 41 523 054 1.000 24 290 467 1.000
The implementation of a PACE program could representthe most cost-effective way to finance energy improvements.If well-designed, it could in principle ensure higher NPVto consumers than the other market options. Consideringa break-even interest rate as the value where the NPV ofPACE program equals the NPV of other financing options,it corresponds to 6.1% for the bank package and to 6.3% inthe case of an unsecured personal loan. We also provided ananalysis of the financing solutions available on the privatemarket, considering a typical one loan for use contract offeredby some companies. Even if private mechanisms address theupfront cost, they do not maximize NPV for consumers.
Unlocking the investment potential of the private sectorand of individual consumers presents one of the majorchallenges for the country. A PACE program can be apowerful policy for regional governments in order to increasethe accessibility of energy-saving measures. The economicbenefits of energy cost savings are distributed over time, butan upfront cost is required to begin these improvements. Thismodel corrects this disconnection and allows the costs of theclean energy installation to be distributed over time just as thebenefits are. Local governments play a key role in creating theright framework conditions to improve energy performance instock buildings. Meeting national energy needs and achievingclimate targets will be possible only with a true understandingof clean energy investments and the methods that can beapplied to finance them.
Acknowledgments
The research leading to these results was partly financedthrough the European Research Council under the EuropeanCommunity’s Seventh Framework Programme (FP7/2007-2013)/ERC grant agreement no. 240895—project ICARUS‘Innovation for Climate Change Mitigation: a Study of EnergyR&D, its Uncertain Effectiveness and Spillovers’.
Appendix. Notes
(i) Primary energy import = (net imports/final consumption).(ii) Union Oil, Data Book 2011.(iii) The Lorenz curve is based on the data listed in table A.1.(iv) Mathematically it is based on the Lorenz curve by takingthe ratio between the area enclosed by the line of perfectequality and the Lorenz curve and dividing this by the total
area under the hypothetical line of equality. To compute theGini index we used the following discretized formula.
G = 1−n∑
i=1
(Xi − Xi−1)(Yi + Yi−1).
(v) Average household income by region (ISTAT 2010) (seetable A.2).(vi) Data on energy efficiency investments are shown infigure A.1 (ENEA database 2010a, 2010b).(vii) Data on solar PV installations are shown in table A.3(GSE database 2011).(viii) ENEA database http://www.solaritaly.enea.it/.(ix) Database of states incentives for renewable and efficiency,updated October 2011.(x) There are no restrictions to special subset of population.The program aims to have the higher participation ratepossible. According to Fuller’s analysis (Fuller 2009) arelevant issue related to energy programs is the lowparticipation rate. Despite the 150+ loan programs forresidential energy efficiency in the United States, only a tiny
Table A.2. Note: regions are clustered in northern, central andsouthern Italy.
RegionsAverage householdsincome (e/year)
Piemonte 19 717Valle d’Aosta–Vallee d’Aoste 20 814Lombardia 20 122Bolzano-Bozen 21 465Trento 19 285Veneto 19 123Friuli-Venezia Giulia 20 254Liguria 19 999Emilia–Romagna 21 014
Toscana 19 472Umbria 17 716Marche 18 215Lazio 18 833
Abruzzo 14 861Molise 14 987Campania 12 432Puglia 13 159Basilicata 14 187Calabria 13 130Sicilia 13 063Sardegna 14 421
9

Environ. Res. Lett. 7 (2012) 034008 N Ameli and D M Kammen
Figure A.1. Energy retrofits completed by region, 2010 (Italy).
Table A.3. Solar photovoltaic installations by region, 2011 (Italy).
Regions No. installationsInstalled capacity(MW)
Lombardia 48.692 1.322Veneto 44.997 1.157Piemonte 24.095 1.071Emilia–Romagna 31.010 1.267Friuli-VeneziaGiulia
17.291 296
Liguria 3.212 54Trentino AltoAdige
14.968 300
Toscana 17.479 469Lazio 17.954 861Marche 12.048 787Umbria 8.007 319Puglia 22.926 2.186Campania 10.071 376Sicilia 19.862 866Sardegna 14.629 403Abruzzo 7.346 452Calabria 8.770 237Basilicata 3.716 222Val d’Aosta 1.118 14Molise 1.605 117
Total 329.796 12.773
fraction of the population has been reached. She found a rateless than 0.1% of their ‘potential’ customers.(xi) A version of the calculator used for the models ismaintained online for public use at http://rael.berkeley.edu/financing-italy-IV. The financing calculator provides anestimate of the net present value of annual cash flows over25 years of energy investments (solar PV, solar thermal andenergy efficiency) selected by the user (PACE financing isincluded). The financing calculator deploys Marche data inrelation to:
• Electricity and gas consumption. The user has to providehis energy (electricity and/or gas) monthly consumption.In the case the user is unable to provide data for theentire year, he has to at least enter energy consumptionvalues for one month. The financing calculator willsimulate the overall user energy consumption deployingthe ratio between the monthly consumption provided and
the corresponding monthly consumption based on theaverage household in Marche region according to ISTAT2010, National Statistical System, Environmental Data.• Solar PV electricity production. To compute electricity
produced by solar system we considered Marche regionirradiation.
(xii) The scenarios modeled in this paper do not consider thesolar thermal system. A version of the calculator used for themodels is maintained online for public use with the possibilityto enter more assumptions. In this respect, users interestedin solar thermal installation can include its assessment in theresults provided by the meter. Assumptions related to solarthermal installation are listed in table 1.(xiii) ISTAT is the national statistical system.(xiv) Italian Energy Agency (GSE, Gestore Servizi Elettrici)supports photovoltaic solar electricity generation under afeed-in tariff scheme (‘Conto Energia’). The scheme isregulated by the Interministerial Decree of 19 February 2007.In March 2011, the Department of Economic Developmentauthorized the ‘IV Conto Energia’ that regulates the newtariffs and mechanism for solar photovoltaic production forthe period June 2011–6 (table A.4).
In 2013, feed-in tariff and net metering will be replacedby the all-comprehensive tariff. The mechanism will be basedon two different tariffs (e/kWh): tariff for energy feed intogrid and tariff for energy consumed (table A.5).Reduction tariff (computed on tariff listed in table A.4):
II semester 2013: −9%I semester 2014: −13%; II semester 2014: −13%I semester 2015: −15%; II semester 2015: −15%I semester 2016: −30%; II semester 2016: −30%
Additional premium (calculated on basic tariff):
• Removing asbestos (0.05 e/kWh)• Installation on special area (5% )• 60% of components EU manufactured (10%)• Premium for energy performance (10%)• Local government <5000 people (5%)
(xv) Net metering scheme for photovoltaic system owner hastaken in place in Italy. The scheme is regulated by ‘ARG/elt74/2008’, Attachment A—Testo integrato dello scambio sulposto (TISP). This incentive is mathematically computed bythe following formula:
min[Ee;Ef] + CsEn
where:
Ee, electricity exported to the grid (electricity withdrawn(kWh)× electricity price (e/kWh));Ef, electricity fed into the grid (electricity injected into thegrid (kWh)× electricity price (e/kWh));Cs, service cost (distribution cost (e/kWh));En, net energy exchanged to the grid (kWh).
(xvi) Tax credit is given up of 55% of the energy efficiencycost investment (National Act law 27 December 2006 no.296):
10

Environ. Res. Lett. 7 (2012) 034008 N Ameli and D M Kammen
Table A.4. Feed-in tariff scheme (June 2011–6).
Feed-in tariff in Italy (period June 2011–6)
June 2011 July 2011 August 2011
Size (kW)On building(e/kWh)
Other(e/kWh)
On building(e/kWh)
Other(e/kWh)
On building(e/kWh)
Other(e/kWh)
1 ≤ P ≤ 3 0.387 0.344 0.379 0.337 0.368 0.3273 < P ≤ 20 0.356 0.319 0.349 0.312 0.339 0.30320 < P ≤ 200 0.338 0.306 0.331 0.300 0.321 0.291200 < P ≤ 1000 0.325 0.291 0.315 0.276 0.303 0.2631000 < P ≤ 5000 0.314 0.277 0.298 0.264 0.280 0.250P > 5000 0.299 0.264 0.284 0.251 0.269 0.238
September 2011 October 2011 November 2011
1 ≤ P ≤ 3 0.361 0.316 0.345 0.302 0.320 0.2813 < P ≤ 20 0.325 0.289 0.310 0.276 0.288 0.25620 < P ≤ 200 0.307 0.271 0.293 0.258 0.272 0.240200 < P ≤ 1000 0.298 0.245 0.285 0.233 0.265 0.2101000 < P ≤ 5000 0.278 0.243 0.256 0.223 0.233 0.201P > 5000 0.264 0.231 0.243 0.212 0.221 0.191
December 2011 I semester 2012 II semester 2012
1 ≤ P ≤ 3 0.298 0.261 0.274 0.240 0.252 0.2213 < P ≤ 20 0.268 0.238 0.247 0.219 0.227 0.20220 < P ≤ 200 0.253 0.224 0.233 0.206 0.214 0.189200 < P ≤ 1000 0.246 0.189 0.224 0.172 0.202 0.1551000 < P ≤ 5000 0.212 0.181 0.182 0.156 0.164 0.140P > 5000 0.199 0.172 0.171 0.148 0.154 0.133
Table A.5. All-comprehensive tariff in Italy (period 2013–6).
On building Other
Size (kW)Energy feed(e/kWh)
Energy consumed(e/kWh)
Energy feed(e/kWh)
Energy consumed(e/kWh)
1 ≤ P ≤ 3 0.375 0.230 0.346 0.2013 < P ≤ 20 0.352 0.207 0.329 0.18420 < P ≤ 200 0.299 0.195 0.276 0.172200 < P ≤ 1000 0.281 0.183 0.239 0.1411000 < P ≤ 5000 0.227 0.149 0.205 0.127P > 5000 0.218 0.140 0.199 0.121
• energy retrofits, maximum cost allowed e 181 818.18 andmaximum tax credit e 100 000;
• building envelope, maximum cost allowed e 109 090.90and maximum tax credit e 60 000;
• solar thermal system, maximum cost allowed e109 090.90and maximum tax credit e 60 000;
• replacement HVAC, maximum cost allowed e54 545.45and maximum tax credit e 30 000.
Tax credit is split over the first five years.(xvii) Consumption is based on 2009 National StatisticalSystem (ISTAT)—Environmental Data. Family (2–3 people)average consumption is 2700 kWh/yr.(xviii) We used the normal distribution to describe the dailysolar production trend. The normal distribution is definedby two parameters, i.e. the mean, µ and the standarddeviation σ . These parameters represent, respectively, factorsof location and scale. Normal distribution is a very simple
way to model solar PV daily production and it has beenused in order to compute the net metering contribution,which covers part of the charges incurred by the customerfor withdrawing electricity from the grid. This contributionranges approximately from 300 to 350 e/yr, depending:
• time-ranges consumption;• different values of normal distribution (e.g. mean and
variance).
(xix) NPV calculations that assume the solar PV is installedin years 2013, 2014 or 2015 is calculated as a 25 year NPVstarting from the year of installation.(xx) Italy feed-in tariff scheme.(xxi) PI quantifies the amount of value created per unitof investment. (Present value of future cash flows/initialinvestment.)(xxii) Fuller et al (2009a).(xxiii) Average interest rate applied by 20 banks.
11

Environ. Res. Lett. 7 (2012) 034008 N Ameli and D M Kammen
(xxiv) After the introduction of feed-in tariff scheme, manybanks offered specific packages for solar PV.(xxv) Average interest rate applied by 10 banks whichprovided a specific energy package.(xxvi) The cost of purchasing a new inverter is about 952 e.When we consider an ‘unsecured loan’ and ‘financing banksolution’ (figures 3 and 4), the repayment obligation periodends before year 12 when the inverter is expected to bereplaced. Annual payments for the unsecured loan are about4110 e and for the financing bank solution are about 2279 e.In both cases the annual payment is larger than the cost of theinverter. The charts (both cases) do not show negative pillarsbecause revenues (feed-in tariff, net metering incentive) andenergy bill savings compensate for these costs.(xxvii) Private companies: Enel Green Power, Sorgenia,Enfinity.
References
AEEG—Italian Energy Authority 2010 Database (www.autorita.energia.it/it/dati/elenco dati.htm)
Bank of Italy 2010 Domanda e offerta di credito in Italia durante lacrisi finanziaria Working Paper No. 63 April 2010 (available atwww.bancaditalia.it/pubblicazioni/econo/quest ecofin 2/QF63)
Bank of Italy 2012 Access to credit in times of crisis: measures tosupport firms and households Working Paper No. 111 January2012 (available at www.bancaditalia.it/pubblicazioni/econo/quest ecofin 2/QF 111;internal&action= setlanguage.action?LANGUAGE=en)
Blumstein C, Krieg B, Schipper L and York C 1980 Overcomingsocial and institutional barriers to energy conservation Energy5 355–71
Brown M 2001 Market failures and barriers as a basis for cleanenergy policies Energy Policy 29 1197–207
Department of Economic Development 2010 Database andNational Budget (http://dgerm.sviluppoeconomico.gov.it/dgerm/ben.asp)
Department of Treasury 2011 Database (www.finanze.gov.it/export/finanze/Per conoscere il fisco/studi statistiche/index.htm)
ENEA—Agenzia Nazionale per le nuove tecnologie, l’energia e losviluppo economico sostenibile 2010a Analisi sull’impattosocio-economico delle detrazioni fiscali del 55% per lariqualificazione energetica del patrimonio edilizio esistenteTechnical Report (available at http://efficienzaenergetica.acs.enea.it/doc/rapporto%20mercato%20v3p.pdf)
ENEA—Agenzia Nazionale per le nuove tecnologie, l’energia e losviluppo economico sostenibile 2010b Rapporto annualeefficienza energetica Technical Report (available athttp://efficienzaenergetica.acs.enea.it/opus/rapporto%20ee%202010.pdf)
EPIA—European Photovoltaic Industry Association 2010 Globalmarket outlook for photovoltaics until 2015 Technical Report(available at http://www.epia.org/publications/epiapublications/globalmarketoutlookforphotovoltaicsuntil2016.html)
Fuller M 2009 Enabling investments in energy efficiency TechnicalReport (available at http://uc.ciee.org/downloads/Resfinancing.pdf)
Fuller M, Portis S and Kammen D M 2009a Towards a low-carboneconomy: municipal financing for energy efficiency and solarpower Environment 51 22–32
Fuller M, Kunkel C and Kammen D 2009b Guide to energyefficiency and renewable energy financing districts for localgovernments (available at http://rael.berkeley.edu/sites/default/files/old-site-files/berkeleysolar/HowTo.pdf)
Golove W H and Eto J H 1996 Market barriers to energy efficiency:a critical reappraisal of the rationale for public policies topromote energy efficiency Lawrence Berkeley NationalLaboratory Report (available at http://eetd.lbl.gov/EA/EMP/reports/38059.pdf)
GSE (Gestore Servizi Energetici) 2011 Rapporto Statistico 2011(available at www.gse.it/it/Dati%20e%20Bilanci/Osservatorio%20statistico/Pages/default.aspx)
IEA (International Energy Agency) 2010 World Energy Outlook(Paris: OECD/IEA)
IPCC (Intergovernmental Panel Climate Change) 2011 SpecialReport on Renewable Energy Sources and Climate ChangeMitigation
ISTAT (National Statistical System) 2010 Environmental Data(available at www.istat.it/it/archivio/ambiente-ed-energia)
Jaffe A B and Stavins R N 1994 The energy efficiency gap: whatdoes it mean? Energy Policy 22 804–10
Kammen D 2009 Financing energy efficiency Sci. Am. specialedition ‘Earth 3.0’
Lorenz M 1905 Methods of measuring concentration of wealthJ. Am. Stat. Assoc. 9 209–19
Ranchod S, Yung J E and Hart G E 2010 The constitutionality ofproperty assessed clean energy (PACE) programs underFederal and California law White Paper (available at www.paulhastings.com/publicationdetail.aspx?publicationld=1622)
Rocky Mountain Institute 2010 Achieving low-cost solar PV:balance of system cost reductions Institute Report (http://rmi.org/Content/Files/BOSReport.pdf)
Ross S A et al 1996 Fundamentals of Corporate Finance (Boston,MA: McGraw-Hill/Irwin)
Sanstad A H and Howarth R B 1994 Normal markets, marketsimperfections and energy efficiency Energy Policy 22 811–8
12