Embed Size (px)
Citation preview

The race to the top of the global cleantech market
Clean Economy, Living Planet
StudyArnoud van der Slot, Ward van den Berg and Gijs Berkhout

This report was commissioned by WWF-Netherlands (Wereld Natuur Fonds)
The race to the top of the global cleantech market
Clean Economy, Living Planet
StudyArnoud van der Slot, Ward van den Berg and Gijs Berkhout

Clean Economy, Living Planet - The race to the top of the global cleantech market2

Contents
Executive summary 5
0. Preface 7
1 Introduction 91.1 Cutting CO
2 emissions will preserve ecosystems and wildlife 9
1.2 Clean Energy Technology cuts CO2 emissions by reducing fossil fuel demand and
by replacing fossil fuels with renewables 10
1.3 In 2009, WWF-NL set a course for the Netherlands to reach a top-10 position in cleantech 11
2 Cleantech market 142.1 The global cleantech market continues to exceed expectations
– especially in solar PV 14
2.2 Despite global growth, the Netherlands dropped one place to number 18 16
2.3 Cleantech growth in the Netherlands lags behind global developments 19
3 Leading cleantech nations: pointing the way towards accelerated growth 213.1 A coherent and supportive industrial policy enables cleantech companies to grow 22
3.1.1. Renewable energy vision 23
3.1.2. Deployment and domestic market development 23
3.1.3. Supportive infrastructure 24
3.1.4. R&D and demonstration projects 24
3.2 Access to capital powers cleantech growth 25
3.3 Large companies drive cleantech sales growth 27
3.4 The lessons reaffirm the 2009 WWF-NL recommendations 28
4 Barriers in the Dutch cleantech sector and recommendations for overcoming them 304.1 Five barriers inhibit the acceleration of the Dutch cleantech sector 30
4.2 Three recommendations will help the Dutch cleantech sector accelerate growth 33
Clean Economy, Living Planet - The race to the top of the global cleantech market3

4 Clean Economy, Living Planet - The race to the top of the global cleantech market
5 Getting the Netherlands back on track towards a top-10 position in the global cleantech industry 375.1 The Netherlands can grow its cleantech business to EUR 3-4 billion 37
5.2 Ambitious and successful companies prove the feasibility of the top 10 ambition 38
6 Conclusions and recommendations 40
Appendix A Methodology 42
Appendix B Literature 51
Appendix C Contributors 55Expert committee 55
Sounding Board 55
Jury 55

5 Clean Economy, Living Planet - The race to the top of the global cleantech market
Executive summary
This report investigates the progress of the cleantech industry in the Nether-lands and worldwide. Cleantech includes all technologies that save energy or generate renewable energy. In the 2009 report for The World Wide Fund forNature Netherlands (WWF-NL), Roland Berger ranked countries by their economic value added from manufacturing cleantech products and formulated recommendations to advance the sector’s growth. This follow-up report shows the increase in cleantech sales worldwide and the progress of countries within the ranking. Lessons drawn from the top-performing countries in this new ranking confirm and underscore the recommendations from the 2009 report. Progress on these recommendations in the Netherlands, however, has been mixed. In a survey, Dutch cleantech companies have listed the barriers they face in expanding their businesses. Based on the lessons and the barriers, stake-holders in the Dutch cleantech sector have developed three recommendations for accelerating its growth.
The market for cleantech grew by 31% per annum between 2008 and 2010 and now stands at EUR 179 billion. Wind energy is the largest segment in the cleantech sector with a 30% market share. Solar PV has grown by 100%, with sales now totaling EUR 45 billion. Denmark leads both the 2009 and 2011 ran-kings. China, at number two, is growing at 77% per annum. The Netherlands, however, has dropped a position and now ranks 18th. Although the Netherlands has grown by 15% since the 2009 report, this growth is insufficient to keep pace with global market growth.
The top-performing countries reveal three main best practices. First, a country must develop a coherent and integrated industrial policy, setting targets on the future fuel mix, developing a domestic market and investing in supportive infrastructure and R&D in line with the country’s strengths. Second, a country must provide access to capital. And third, it must foster the presence of large companies in cleantech.

6 Clean Economy, Living Planet - The race to the top of the global cleantech market
Dutch cleantech companies mention that unstable regulation and the absence of stable market development are the main barriers to cleantech growth. These barriers also stand out in an international perspective. At the WNF cleantech symposium on May 9, 2011, cleantech stakeholders formulated three recom-mendations that will accelerate Dutch cleantech sector growth, overcoming the barriers companies face and implementing the lessons from top-performing countries:
• The government must make a clear-cut choice for renewable energy and then base its industrial policy on best practices, from R&D to deployment• Financial institutions must cooperate with each other and with government in devising financial solutions to support the cleantech
sector • Large cleantech companies must work with smaller cleantech companies
Implementation of these recommendations will help get the Netherlands back on track towards a top-10 position in the global cleantech industry. If the Ne-therlands grows between 18% and 24% to reach a total value added of EUR 3-4 billion, it will achieve a top-10 position by 2015. Dutch companies alone aim to grow by 25-30%, which means that this ambition is feasible.

7 Clean Economy, Living Planet - The race to the top of the global cleantech market
0 Preface
This report is a follow-up to the 2009 report on Clean Energy Technology for the World Wide Fund for Nature. That report investigated the rationale and potential for challenges of building a strong Dutch industry in Clean Energy Technology. As a starting point, Roland Berger ranked countries based on na-tional total value added weighted by real GDP. The report concluded that the Netherlands should strive for at least a top-10 position in the cleantech industry in 2015. In this follow-up report, Roland Berger reevaluates the global data and compares the current status of the Dutch cleantech sector with its 2009 results, revealing a sector that is growing steadily but which is lagging behind global developments.
WWF-NL turns to Clean Energy Technology because energy efficiency and renewables are the best options for reducing energy-related CO2 emissions and for mitigating the serious impacts of climate change. Recent studies indicate that an average global warming of 2° C will have dangerous and irreversible ef-fects on humans and wildlife, and that these effects will rapidly worsen should warming exceed 2° C. Ecosystems cannot adapt to these changes and more than 30% of species may disappear. WWF-NL wants to see swift and large-scale application of solutions that reduce CO2 emissions, and finds that this is best achieved by stimulating cleantech business and by implementing binding CO2 targets on the national and international levels. A business focus can leverage WWF-NL’s efforts to realize its CO2 emissions reduction objectives, as business innovation and technology development can offer cost-effective solutions that can be rolled out on a large scale.
This new report is structured in five chapters and an epilogue. The first chapter explains the threat of global warming and cleantech’s potential to reduce CO2 emissions. It also defines cleantech for the purposes of this report. Chapter 2 looks at the economic attractiveness of this upcoming industry and illustrates its current and future pace of growth. The current standing of the Dutch clean-tech industry in the global ranking is detailed, both in absolute terms (i.e. total value added) and in relative terms (i.e. total value added weighted by GDP). Chapter 3 responds to these concerns with lessons from the top-performing countries in cleantech, and lists those factors that will lead to accelerated growth. Chapter 4 deals with the barriers that obstruct the growth of Dutch industrial activities in cleantech, findings which are based on an extensive poll that was taken among a representative number of players in the industry. Chap-ter 5 takes a close look at the companies active in the Dutch cleantech sector and introduces the company that won the 2011 WNF cleantech Star, which recognizes the contribution that promising Cleantech enterprises make to the

8 Clean Economy, Living Planet - The race to the top of the global cleantech market
transition towards renewable energy. The chapter concludes by explaining the pace of growth required if the Dutch cleantech industry is to rank 10th in the 2015 ranking. The conclusions and recommendations briefly summarize the main findings.
Appendix A describes the methodology of the cleantech country ranking. The report draws on many sources for its data and insights. A complete list can be found in appendix B. Appendix C introduces the expert group that supervised the report, the sounding board and the jury that selected the WNF Cleantech Star nominees and winner.
June 2011

9 Clean Economy, Living Planet - The race to the top of the global cleantech market
1 Introduction
Temperature increases due to global warming can be limited to 1.5° C if clean energy technologies (cleantech) are deployed rapidly and worldwide. The 2009 report for the World Wide Fund for Nature Netherlands (WWF-NL) set a course for the Netherlands to become a top-10 player in the growing cleantech sector. The report ranked countries according to their cleantech production and made three recommendations to position the Netherlands at the forefront of cleantech developments. Progress since that first report, however, has been mixed.
1.1 Cutting CO2 emissions will preserve ecosystems and wildlife
Global warming is threatening global ecosystems and wildlife. For example, melting ice caps are diminishing the habitat of polar bears. Higher tempera-tures affect sea water quality and are bleaching coral reefs, one of the most diverse ecosystems in the world1. The majority of the world’s population lives in coastal areas threatened by storms and flooding. The pace of climate change is alarming. To preserve life on our planet as we know it, the reduction of CO2 emissions is vital.
If current national policies remain unchanged, the World Energy Outlook of the International Energy Agency demonstrates that the increase in CO2 emissions will continue and global warming will exceed 6° C. If the policies that have been announced are implemented, global warming will still exceed 3.5° C. In its most optimistic “450 ppm” energy scenario2, the probability that global warming will exceed 2° C is still 50%3.
WWF developed a scenario for a renewable energy future and outlined this scenario in its Energy Report4. WWF’s scenario establishes the feasibility of replacing all fossil and nuclear fuels and limiting the temperature increase to 1.5° C. Total energy demand must and can be reduced through the more effi-cient use of energy. By 2050, efficient energy use can shrink almost 50% of the baseline energy demand. While the current share of renewable electricity, heat and fuels is only 13% of total energy supply5, by 2050 this share can increase to 100% – and global warming can be limited to 1.5° C.
1 IPCC Fourth Assessment Report: Climate Change 20072 In IEA’s 450 ppm scenario, the concentration of CO2 in the atmosphere will stabilize at 450 parts per
million3 IEA, World Energy Outlook 20104 WWF/Ecofys, The Energy Report, 20115 IEA, World Energy Outlook 2010

10 Clean Economy, Living Planet - The race to the top of the global cleantech market
Figure 1 - Fuel mix scenario put forward in WWF’s Energy Report 2011
1.2 Clean Energy Technology cuts CO2 emissions by reducing fossil fuel demand and by replacing fossil fuels with renewables
To realize its vision of a 100% renewable energy future and to preserve ecosystems and wildlife, WWF advocates the rapid deployment of cleantech. Cleantech will help utilities, industry, households and governments reduce energy use and will enable the switch to renewable resources. In addition to realizing important climate objectives, cleantech offers major societal benefi ts, including employment (through green-collar jobs) and economic growth. The environmental and economic advantages of cleantech reinforce each other, create incentives to innovate and improve technologies, and warrant its large-scale deployment.
For the purposes of this report, cleantech is defi ned as those technologies that contribute directly to reducing CO2 emissions. There are two segments of the cleantech industry which specifi cally reduce fossil fuel use: energy effi ciency and renewable energy.
Energy effi ciency is the most cost-effective way to reduce CO2 emissions. Simply put, using less energy saves fossil fuels and money. Investments in this sector are offset by lower energy bills; effi cient energy use means falling energy demand, which means lesser volumes and lower total energy costs. Cleantech contributes to energy effi ciency by enabling, for example, low-energy lighting, better insulation and electric cars.
A large part of cleantech also involves renewable energy solutions. Solar, wind and biomass sources replace fossil fuels that cause global warming. Solar and wind can be used to generate heat and electricity, and biomass has the
2000 2010 2020 2050 2040 2030
Cleantech
Baseline demand Renewable heat Fossil & nuclear
Renewable electricity
Fuel mix by 2050 [EJ]
> Renewable energy technology replaces current fossil and nuclear energy use
> Energy efficiency products enable global decrease in energy demand

11 Clean Economy, Living Planet - The race to the top of the global cleantech market
additional advantage that it contains molecules that can be converted to liquid form to replace fossil-based transport fuels. Cleantech enables these solutions by developing solar cells, wind turbines and biofuels, more effective energy storage, and more.
Clearly, there are other technologies that are equally necessary and valuable in the struggle against global warming and environmental destruction, such as the recycling of fossil-based materials, using material more effi ciently, and carbon capture and storage. These, however, have an indirect effect on CO2 emissions, or, in the case of carbon capture and storage, only solve the symptoms of excess emissions, not the root causes.
Figure 2 - Scope of Clean Energy Technology as defi ned in this report
1.3 In 2009, WWF-NL set a course for the Netherlands to reach a top-10 position in cleantech
In 2009, the fi rst report on building the Dutch Clean Energy Technology indus-try has been published6. In that report, WWF-NL made known its ambition that Dutch cleantech claims a global top-10 position by 2015. The 2009 report also included a ranking of countries by their value added in cleantech in 2008. The size of the cleantech industry in the Netherlands at the time put the country at number 17.
The ambition was a challenging but realistic one, based on competences and resources prevalent in the Netherlands. The Netherlands has the capital, labor and knowledge to support the acceleration of global cleantech7. In particular, as one of the world’s wealthiest countries, the Netherlands has the fi nancial means to invest in cleantech R&D, product development and production capa-city, and for these investments to reverberate worldwide. Through its economy, the Netherlands can make a major contribution to reducing climate change.
6 WWF, Clean economy, living planet – building the Dutch clean energy technology industry, 20097 At EUR 35,600 in 2010, the Netherlands has one of the world’s highest GDP per capita (Eurostat);
36.1% of the working population (25-64 years old) has a tertiary education (ISCED); Dutch resear-chers fi led for 3364 patents in environmental technologies in 2007 (OECD)
Scope of report
Energy efficiency and e-mobility
Renewable energy generation and energy storage
Clean Energy Technology
Energy application contributes to a reduction in CO2 emissions
Other Clean Technology
Sustainable water management
Material efficiency
Waste management & recycling
Non-energy application contributes to a reduction in CO2 emissions
Sustainable mobility - other
Carbon capture and storage
Other Clean TechnologyTechnologyT
Sustainable water management
Material efficiency fficiency f
Waste management & recycling
Non-energy application contributes to a reduction in CO2 emissions
Sustainable mobility - other
Carbon capture and storage

12 Clean Economy, Living Planet - The race to the top of the global cleantech market
The ambition, however, was also based on a grim reality. Dutch CO2 emissions per capita are among the highest in the world, roughly three times higher than the global average8. As a heavy contributor to global warming, the report chal-lenged the Netherlands to take the reigns of a sustainable future, both for its own citizens and for the world as a whole.
The report made three recommendations for Dutch cleantech growth. The implementation of these recommendations would create favorable conditions for the entire industry, from start-ups to maturing companies.
• The Dutch government should provide foundational support starting in the early stages of the innovation cycle and continuing through market launch.
• Make more funding available to cleantech companies in the seed stage of their development
• Develop a home market
Since the publication of the 2009 report, the Clean Energy Technology sector has garnered much attention, but activities to stimulate its growth have been mixed. The Dutch government acknowledged the sector’s importance and, via the Innovation Platform, confirmed the economic advantages of the renewable energy industry for the Netherlands9. The Social and Economic Council (SER) also advised the government to develop the biobased economy, a position endorsed by Minister Verhagen10. The government invested in a few pilot pro-jects, like Plant One in Delft or the offshore wind program FLOW, and regional initiatives were established, such as Solaris. However, no coherent policy to support the innovation cycle has been developed11.
To answer the call for more seed funding, WWF-NL and Rabobank established the Dutch Green Fund. This venture capital fund provides financing to new cleantech companies and is a first to step towards expanding the capital avai-lable in this sector. Nevertheless, investments in energy and the environment have dropped to EUR 6 m12. The Holland Financial Centre13 is currently inves-tigating the feasibility of a green investment fund. The green investment fund should accelerate financing for energy transition projects and may contribute to sustainable economic growth.
8 In OECD Europe, the Netherlands has the third highest amount of CO2 emissions per unit GDP (IEA CO2 emissions from fossil fuel combustion)
9 Innovatieplatform/Roland Berger, Stimulering van de economische potentie van duurzame energie voor Nederland, 2010
10 SER, Meer chemie tussen groen en groei, 201011 For instance, measures to support energy efficiency in housing were temporary12 NVP, Ondernemend Vermogen 201013 Holland Financial Centre is is a public-private initiative set up by organizations throughout the
financial sector, the government and regulators. These include banks, insurers, trading firms, pension funds, asset managers, audit firms and law firms

13 Clean Economy, Living Planet - The race to the top of the global cleantech market
The government’s replacement of the two-year old SDE with a new SDE+ sup-port program for renewable energy initiatives has again led to uncertainty in the market. Similarly, the partial abolition of tax advantages in the Green Fund scheme will reduce domestic cleantech investments. The reduction in the renewable energy target for 2020 inhibits large-scale deployment of cleantech and home market development.
Dutch progress on the implementation of these recommendations has been mixed. The government has not improved its activities in terms of the first and third recommendations. And though the financial sector has shown some initia-tive, total seed investments have not risen significantly.

14 Clean Economy, Living Planet - The race to the top of the global cleantech market
2 Clean Energy Technology market
In WWF’s vision, renewable energy and energy effi ciency technology must be applied on a large scale. The production and utilization of such technology is more than an environmental necessity – it is also a business opportunity. From manufacturing component parts to fi nancing renewable energy projects, the development of cleantech is a global economic stimulus. Since the 2009 study, the global cleantech market has soared. The 2011 ranking reveals the strong and rapid growth of cleantech, but unfortunately also uncovers the fact that the Netherlands is not keeping up with the pace of global developments.
2.1 The global cleantech market continues to exceed expectations – especially in solar PV
In 2009 report, Roland Berger estimated the size of the global Clean Energy Technology market in 2008 at EUR 104 billion with an annual growth rate fo-recasted at only 12%, or EUR 131 bn by 2010. In reality, the demand for Clean Energy Technology grew by a spectacular 31% per annum. At EUR 179 bn in 2010, the global market exceeded the forecast by more than a third.
Figure 3 - Cleantech market size
With a share of 30% in the total cleantech market, wind energy is the most important technology, not to mention one of the most cost effective sources of renewable electricity. Demand for wind turbines is spread across the globe and there are many companies active in this segment, such as Vestas, GE, Dongfang and Suzlon, in Europe, the United States, China and India. Its total market share has grown by 27% per annum and has reached a size of EUR 50 billion. Wind turbines and component parts are often manufactured in close proximity to the wind farms themselves, putting production and sales on national soil.
Global Cleantech market [EUR bn]
2008 2010 2010 2015
290-360
Forecasted in 2008
Actual
Growth p.a.
31% 12%
Forecasted Actual
10-15%
Forecast

15 Clean Economy, Living Planet - The race to the top of the global cleantech market
Solar PV is the fastest growing cleantech segment, growing at nearly 100% a year. With a share of 24% (EUR 45 billion), it has now become a major con-tender in the cleantech market. Chinese companies like Yingli, LDK Solar and Suntech Power have shown high growth in the past two years. This growth is matched by the increase in sales numbers at companies like Applied Materials, Roth und Rau and Centrotherm, providing Asian companies with the necessary manufacturing equipment to produce solar cells and panels.
Figure 4 - Clean Energy Technology market segmentation in 2010 [EUR bn]
The biogas and biofuels market segment shows growth of 20% per annum since 2008. Its current market share stands at about 20% of the total cleantech market. Demand for biofuels and biogas is also spread around the world. While the United States and Brazil are the main suppliers of bioethanol, European countries have a strong market position in biogas. The biodiesel market, however, is characterized by strong fl uctuations in supply. European suppliers have been affected by a number of developments, including the United States’ dumping of biodiesel on the market and Argentinean suppliers’ strong positions in global export markets14.
Other renewable energy segments include solar thermal, concentrated solar power, ocean power and geothermal power. While 70% of all solar thermal is produced in China, geothermal companies are based mainly in the United States, Iceland, the Philippines and Italy.
Energy effi ciency segments include CFLs (compact fl uorescent lights) and LED lighting, insulation and electric vehicles. Energy storage includes batteries and fl ywheels. The majority of energy effi cient lighting and batteries comes from
14 Biodiesel magazine, Global Biodiesel Production and Market Report, September 1, 2010
5
100% p.a.
27% p.a.
20% p.a.
PV Solar
Biomass
Wind
Biomass
Other
PV Solar
22%
Wind
24%
30% 24%
2008 2010
2008 2010
2008 2010
Segmentation

16 Clean Economy, Living Planet - The race to the top of the global cleantech market
Asia. Insulation is produced all over the world, and supplies are close to the places where it is used.
The global cleantech market is expected to continue to grow at a high pace. Forecasts put growth between 10% and 15% per annum through 201515, valuing the global market at EUR 290-360 billion. In order to realize the WWF vision of a 100% renewable energy future, demand for Clean Energy Technolo-gy must grow by 7-10% per year16. To meet the high level of demand, compa-nies – and the economic landscapes in which they work – must continue to grow their production.
2.2 Despite global growth, the Netherlands dropped one place to number 18
The 2010 rankings clearly demonstrate the remarkable growth of the global Clean Energy Technology market. Many countries have taken huge steps for-ward, though a few, like the Netherlands, have taken steps back.
As in the 2009 report, the ranking measures the contribution of the clean-tech sector to a nation’s economy. Unlike other rankings, which focus on deployment or investment potential, the ranking reveals which countries are manufacturing attractive products, at favorable prices and quality. The ranking includes the 27 EU member states, the G7 countries, the BRIC countries, and South Africa, South Korea, Taiwan, Turkey and Australia.
To measure the status of each country, the value added for the major re-newable energy and energy efficiency technologies in 2010 was analyzed. Renewable energy here is defined as the technologies to create heat, electricity or transportation fuels. Energy efficiency consists of those technologies that are only dedicated to increasing efficiency or replacing less efficient technologies. The value added ranking shows how much money is earned by manufacturing cleantech in each country. In essence, the value of manufactured products in each country was counted. If a Japanese company manufactures a Solar cell in China and sells it in the US, the value of the Solar cell would be attributed to China. To show the economic potential of cleantech, only the capital expendi-tures on tradable goods was counted17.
15 Growth based on market reports on the various cleantech segments16 Forecast is based on the growth in the capacity of renewable energy in the IEA 450 ppm scenario
and the WWF/Ecofys Energy Report. It is important to note that in both scenarios, renewable energy capacity will increase until 2020, and accelerate thereafter
17 Tradable goods are those that have export or import potential. Their prices are set in international markets

17 Clean Economy, Living Planet - The race to the top of the global cleantech market
For each technology in each country, Roland Berger listed the important steps in the value chain and assessed the total production volume and the value added in each step of production. This value chain approach to the ranking prevented products from being counted twice. For instance, a solar PV cell may be produced in one factory and used as an intermediate product in a panel factory18.
The value added was counted in three stages. In the first stage, the manufactu-ring volume in each value chain step was totaled per country. The second stage determined the cost share per step in the value chain. Total costs of a cleantech product were allocated to the various production steps in the value chain. In the third stage, the value added per country now equals the manufacturing volume in each step in the value chain multiplied with the cost share per step in the value chain.
A comprehensive overview of the total value added of the cleantech market did not exist. The ranking therefore draws from a broad range of sources, including industry trade organizations, broker and industry reports, and the companies themselves. A complete list can be found in appendix A.
Figure 5 reveals the top 25 countries in 2010, according to both absolute value added and relative value added weighted by GDP. In both rankings, China is a clear growth leader, showing remarkable growth at 77% per annum with close to 25% global market share.
18 For details, see appendix A

18 Clean Economy, Living Planet - The race to the top of the global cleantech market
Figure 5 - Clean Energy Technology rankings
In the relative ranking, Denmark remains the global cleantech leader. Though a relatively small country, Denmark is home to large companies in this sector. Vestas, for instance, holds a 12% share of the global market for wind turbines, and Rockwool is a world leader in insulation material. Denmark’s presence in the biomass industry is small, but growing.
Germany is present in most cleantech segments, a fact that is refl ected in its top-3 position in both rankings. Companies like Repower and Enercon develop and manufacture wind turbines, and the country is a major producer of manu-facturing equipment for the solar PV segment. Its also
Absolute global Clean Energy Technology value added [EUR bn]
45 30 15 0
Greece Portugal Hungary Canada Sweden Finland Czech Republic Russia Austria Poland Taiwan Belgium Netherlands Italy United Kingdom India South Korea France Spain Denmark Brazil Japan Germany United States China
6 6
1 2 3 4 5 6 7 8 9
10 11 12 13 14 15 16 17 18 19 20 21 22 23 24 25
Ranking
(4) (2) (1) (3) (6) (5) (7) (8)
(10) (11) (9)
(17) (12) (13) (16) (25) (14) (29) (28) (15) (19) (23) (27) (30) (21)
=
2010 2008 Top 5 fast climbers 2008-2010
45 30 15 0
South Korea
Japan
Germany
United States
China + 77% p.a.
+ 28% p.a.
+ 19% p.a.
+ 15% p.a.
+ 30% p.a.
= =
Relative global Clean Energy Technology value added weighted by GDP [EUR %]
Italy Portugal Sweden Estonia Slovakia France Hungary Netherlands United States India Taiwan Poland Finland Japan Latvia Belgium Austria South Korea Spain Czech Republic Lithuania Brazil Germany China Denmark
4 2 0
1 2 3 4 5 6 7 8 9
10 11 12 13 14 15 16 17 18 19 20 21 22 23 24 25
Ranking
(1) (6) (3) (2) (-) (-) (4) (9) (7) (8) (-)
(11) (5)
(25) (15) (13) (18) (17) (24) (12) (16)
(-) (21) (33) (29)
2010 = Top 5 fast climbers 2008-2010
United States
Taiwan
South Korea
Germany
China
=
=
+ 58% p.a.
+ 15% p.a.
+ 22% p.a.
+ 25% p.a.
+ 26% p.a.

19 Clean Economy, Living Planet - The race to the top of the global cleantech market
manufactures solar PV cells and modules. One of the largest inverter compa-nies, SMA, is also based in Germany.
With strong positions in all cleantech segments, the United States is growing well at 28%, and has risen by EUR 11 billion in value added. In absolute terms, it is now in second place with a total value added of EUR 32.5 billion. Given the large size of its economy, however, it holds the 17th position in the relative ranking.
Like a few countries, the Netherlands dropped positions in both rankings and now trails the United States in the relative ranking at number 18.
2.3 Cleantech growth in the Netherlands lags behind global developments In its advice to the Dutch government, the Innovation Platform identifi ed those cleantech segments in which the Netherlands holds a strong competi-tive position: offshore wind, biobased solutions and solar PV. The Innovation Platform proposed that the Netherlands concentrate its resources on these three segments. It based this advice on the level of Dutch R&D competences, the number of patents which have arisen from this R&D, the Dutch economic structure where cleantech is concerned, the infrastructure of the economy in general and the country’s geographical position. Although the total size of the Dutch sector has increased by 15% per annum to EUR 1.4 bn, it is not suffi -cient to keep up with the pace of growth in the global market.
Figure 6 - Dutch strengths in Clean Energy Technology and segment growth
Competitive position and market share of The Netherlands in Cleantech
COMPETITIVE POSITION
MARK
ET S
HARE
Wind offshore Biodiesel
Biogas
Bioethanol PV Solar Solar thermal Wind onshore LED E-mobility
weak
1-2%
>2%
average strong
<1%
125%
Global United Kingdom
Denmark Germany
97% 372%
132% 215%
The Netherlands
WIND OFFSHORE
Global Sweden Belgium
57% 55% 20% 41% 83%
Finland The Netherlands
United States
26% 561%
118%
Global
100% 101%
The Netherlands
China South Korea
BIOFUELS AND BIOGAS1)
PV SOLAR
Dutch growth in international perspective
Source: Innovatieplatform, Roland Berger analysis
Insulation
Competitive position based on Economic Opportunities for Renewable Energy report of InnovatiePlatform
1) average of biodiesel, bioethanol and biogas

20 Clean Economy, Living Planet - The race to the top of the global cleantech market
Growth in the Dutch offshore wind segment slightly trails the global market, though solar PV growth severely lags behind the global average. The biobased segment is the only one of the three that exceeds the global pace. As the major assets of the Dutch cleantech sector, these three segments are the drivers be-hind its potential success, but they are not growing fast enough to advance the Netherlands in the ranking, much less place the country in the top 10.

21 Clean Economy, Living Planet - The race to the top of the global cleantech market
3 Leading cleantech nations: pointing the way towards accelerated growth
The global cleantech market has grown signifi cantly in the past two years, but the growth is not uniformly spread across countries. Some countries, like China, have successfully captured large shares of the global cleantech market, while other countries have not been able to increase their cleantech value ad-ded enough to compete. The cleantech ranking reveals fi ve successful countries that have either shown high growth in recent years or have captured a large share of the market relative to their GDP. Their example can guide other coun-tries, like the Netherlands, towards becoming a leader in this attractive sector. Denmark, China and Germany are the top 3. These countries have a value added in cleantech between 1% and 3% of GDP. China is also growing rapidly at 77% p.a. Other fast climbers include the United States and South Korea.
To pick up the pace, the Netherlands must emulate countries like the Uni-ted States or South Korea which have stepped up their cleantech game. The frontrunner nations (fi gure 7) seem to be concentrating on absolute growth and are thus responsible for most of the growth in the sector as a whole. These frontrunners have also secured competitive positions in some or all cleantech segments. At their heels is South Korea, which has been able to step out of the “pack” and is now well on its way towards becoming one of the frontrunners.
Figure 7 - Clean Energy Technology growth rates per countryThe fi ve leading cleantech countries point to the steps the Netherlands must
take to move ahead at a global level. These top-performing nations share three key success factors:
-2.000 -3.000 -1.000 31.000 30.000 3.000 2.000 12.000 1.000 0
Denmark
China
Canada
United Kingdom
Belgium Austria
Sweden Spain
South Korea Netherlands United States Taiwan
Japan
Italy
India
Greece
Germany
France
Finland
Brazil
Cleantech growth
Cleantech value added difference 2008 – 2010 [EUR m]
Cleantech value growth '08-'10 [EUR %]
Size indicates total value added [EUR bn]
FRONTRUNNERS
PACK
Source: Roland Berger analysis

22 Clean Economy, Living Planet - The race to the top of the global cleantech market
• A coherent and supportive industrial policy for cleantech• Easy access to capital and fi nancing for growth• Presence of large companies, economies of scale and consolidation
Figure 8 - Lessons from top-performing countries
3.1 A coherent and supportive industrial policy enables cleantech companies to grow
Denmark, Germany, China and South Korea have clear and coherent indus-trial policies for their cleantech sectors. Each country has made the choice that cleantech has a major role in its economy and industrial structure. Often, countries have focused on one or only a few cleantech segments, e.g. Denmark on wind or South Korea on LED lighting and batteries for e-mobility.
A coherent and supportive industrial policy that fosters the sector’s competi-tiveness and growth consists of four related components. First, a country has developed a vision or roadmap for a low-carbon economy and has set targets for its future fuel mix that are in line with its strong economic position in one or a few cleantech segments. Second, the government’s policy emphasizes large-scale deployment and has set up incentives to create a (domestic) market. Third, the government invests in supportive infrastructure that enables the sector to operate or which facilitates the uptake of its products. And fourth, the government’s R&D investments support its industrial objectives. Alignment between these four components is necessary to successfully foster and maintain a stable cleantech sector. R&D efforts should support the development of those technologies for which there is also a market. And a market should be created for those technologies that the country wants to include in its energy mix.
INTEGRATED INDUSTRIAL POLICY
ECONOMIES OF SCALE AND CONSOLIDATION
LESSON
EASY ACCESS TO FINANCING FOR GROWTH

23 Clean Economy, Living Planet - The race to the top of the global cleantech market
3.1.1 Renewable energy vision
Denmark, Germany, China and South Korea have included their objectives for renewable energy and energy efficiency in their cleantech industrial policies. Their visions for reducing dependency on limited and foreign resources, some decades old and some relatively new, underpin policies that have accelerated their cleantech industries above the rest. Denmark and Germany, for example, woke up to their dependence on foreign oil during the 1970s oil crisis; their shifts towards renewable energy have broadened their energy portfolios19. China, noting its limited fossil resources and the heavy pollution caused by coal and transportation20, set a target for 2020 that 20% of its energy supply must be renewable21. In its Green Korea plan, South Korea sees renewable energy and energy efficiency as important drivers behind reducing its fossil fuel dependence22.
3.1.2. Deployment and domestic market development
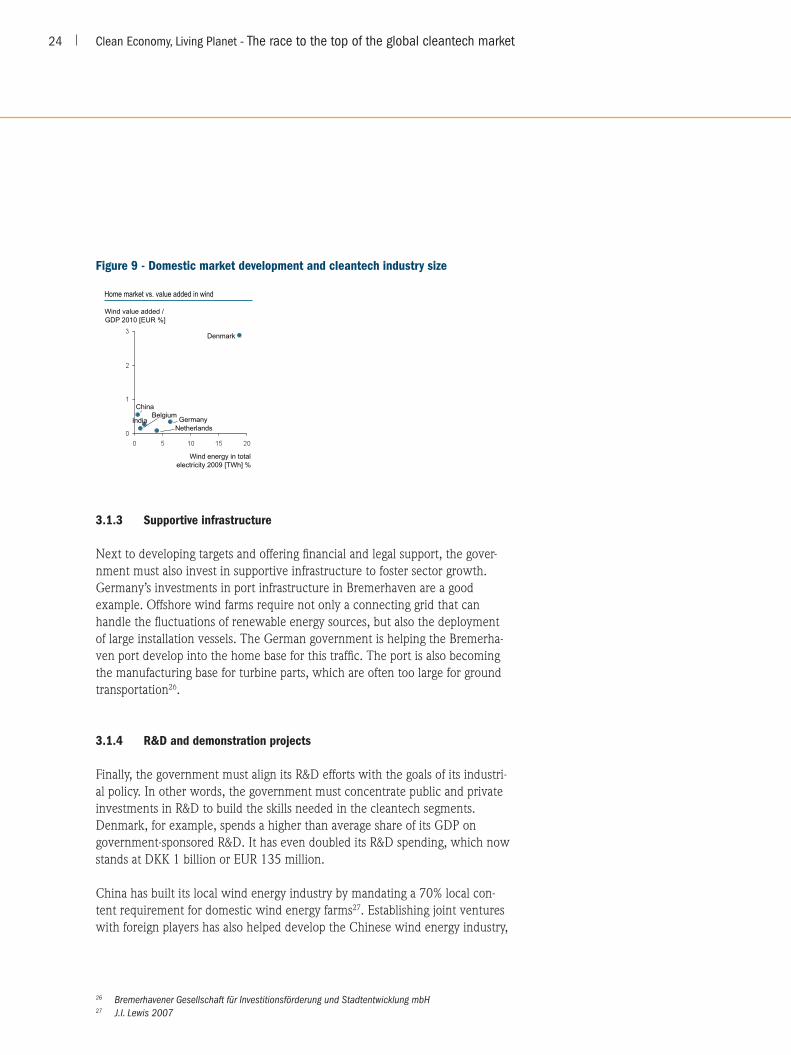
Policies also boost and shape domestic market development. In Germany, feed-in tariffs for renewable energy and prioritized grid access for renewable electricity served two purposes. First of all, these measures helped the gover-nments realize their targets for renewable energy use. Secondly, fostering the home market built up the local industries and enabled them to test new pro-ducts and take innovations to the next levels. Large-scale domestic deployment is necessary if a cleantech sector is to mature23, and target-setting is a major aspect of domestic market development. South Korea has set a target of 30% LED lighting by 2015, which will help companies innovate and develop new products that will compete on the global market24. In Denmark and Germany, the large-scale deployment of wind energy enabled the local industry to impro-ve the technology. Within the cleantech sector, large-scale deployment – rather than advances in the lab – is responsible for many technological advances and for the reduction of costs of those technologies25 .
19 Amos, 2009 and Lipp, 200720 Karplus, 200721 HSBC and the Climate Group even predict China will realize this target and may possibly exceed it22 Cleantech Group, 201023 For instance, the growth of the country’s wind energy industry is matched by growth in domestic
deployment (Lewis, J.l. and Ryan H. Wiser, 2007)24 Korea Energy Management Corporation, IEA DSM Task 22 Presentation, 201025 Deutsche Bank, The German Feed-in Tariff for PV, 2011
24 Clean Economy, Living Planet - The race to the top of the global cleantech market
Figure 9 - Domestic market development and cleantech industry size
3.1.3 Supportive infrastructure
Next to developing targets and offering fi nancial and legal support, the gover-nment must also invest in supportive infrastructure to foster sector growth. Germany’s investments in port infrastructure in Bremerhaven are a good example. Offshore wind farms require not only a connecting grid that can handle the fl uctuations of renewable energy sources, but also the deployment of large installation vessels. The German government is helping the Bremerha-ven port develop into the home base for this traffi c. The port is also becoming the manufacturing base for turbine parts, which are often too large for ground transportation26.
3.1.4 R&D and demonstration projects
Finally, the government must align its R&D efforts with the goals of its industri-al policy. In other words, the government must concentrate public and private investments in R&D to build the skills needed in the cleantech segments. Denmark, for example, spends a higher than average share of its GDP on government-sponsored R&D. It has even doubled its R&D spending, which now stands at DKK 1 billion or EUR 135 million.
China has built its local wind energy industry by mandating a 70% local con-tent requirement for domestic wind energy farms27. Establishing joint ventures with foreign players has also helped develop the Chinese wind energy industry,
26 Bremerhavener Gesellschaft für Investitionsförderung und Stadtentwicklung mbH27 J.I. Lewis 2007
Home market vs. value added in wind
Wind energy in total electricity 2009 [TWh] %
Wind value added / GDP 2010 [EUR %]
Netherlands
Belgium India Germany
China
Denmark

25 Clean Economy, Living Planet - The race to the top of the global cleantech market
as its foreign partners could bring in expertise not immediately available in China. Now, China is stepping up its own R&D efforts. South Korea has inclu-ded large funds for R&D in its green stimulus packages, and the government directly supports companies’ R&D in LED lighting and batteries28.
These large R&D investments are met with a strong focus on demonstration projects, which enables the R&D to progress towards those who might buy the resulting products. Denmark’s long history in onshore demonstration projects and large-scale deployment, fostering “learning by doing” throughout the 1980s and 90s, has developed a competitive wind energy industry. Its attention has now shifted to focus on offshore wind energy. In the Megavind consortium, government, industry players and research institutes are working together to reduce the costs of offshore wind. Megavind also aims to develop 400 MW of demonstration projects.
Figure 10 - R&D in Denmark
3.2 Access to capital powers cleantech growth
Companies need capital to develop new and better products, and to set up and expand their businesses. As mentioned above, the governments of top-perfor-ming cleantech countries have invested large sums in the sector, particularly through green stimulus packages in the wake of the recent economic crisis29. Financial institutions in these countries are also investing. Next to providing equity and debt to cleantech companies, banks also provide project fi nancing needed to buy the capital intensive cleantech products and to apply them.
28 The Breakthrough Institute, “Rising tigers, sleeping giant”, 200929 HSBC, “Climate Investment Update”, 2010, data covers period up till August 2010
R&D in Denmark DEMONSTRATION FOCUS
IT
FR
0.004
0.002
0.000
NL
DK
DE ES SE UK
FI
0.006
Average wind energy R&D expenditures 2002-2007 [EUR m, EUR %]
Absolute expenditures
Expe
nditu
res t
o GD
P
SIZE Government R&D budget to GDP [EUR %]
0.015
0.010
0.000 2007 2006 2005 2004 2003 2002
Denmark
OECD 0.005
0.020
> To maintain its leading position, Denmark more than doubles its Cleantech funding to DKK 1 bn
> Denmark spends the majority of its public and private R&D funds for renewable energy on wind energy to reach critical mass as a small nation
Megavind for offshore wind
Consortium of industry players, research institutes and government aims to reduce costs and will develop 400 MW of demonstration projects
Source: EU SET Plan, IEA, OECD, Megavind, Risoe, Roland Berger analysis
Onshore demos in 1980s and 1990s
Government, research institutes, wind turbine companies and utilities developed demonstration projects in the 1980s and 1990s
DANISH WIND TECHNOLOGIES
26 Clean Economy, Living Planet - The race to the top of the global cleantech market
Venture capitalists and corporate venture investors provide (equity) capital to cleantech companies as well.
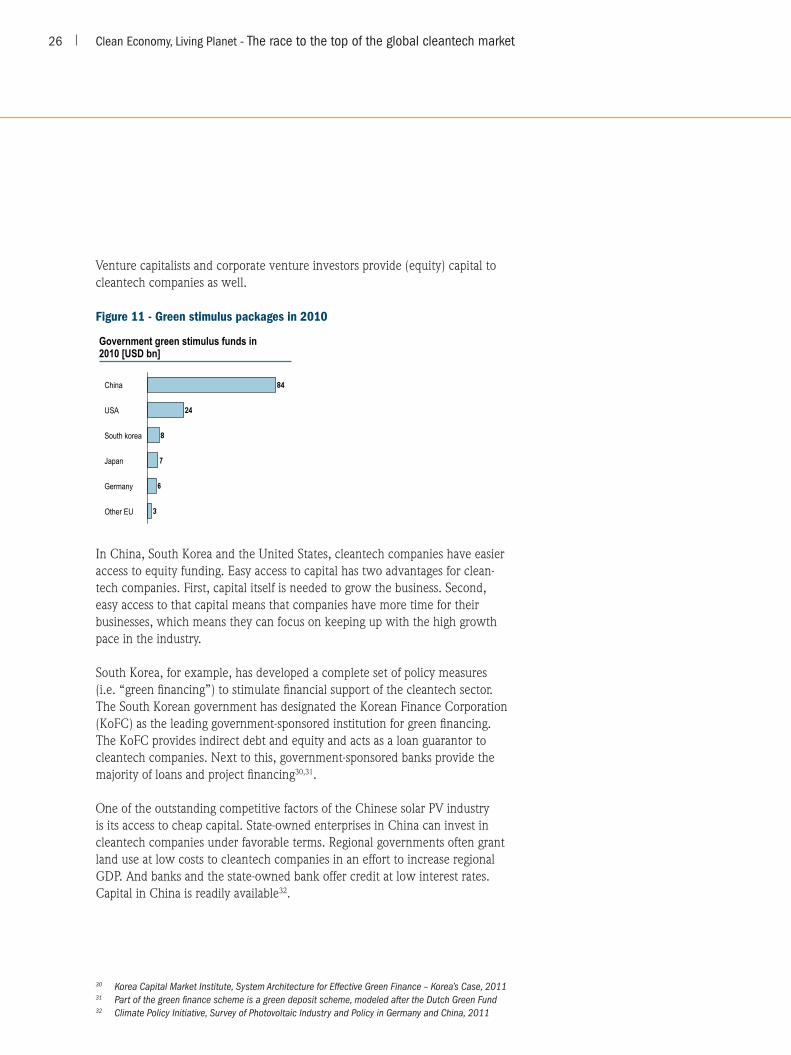
Figure 11 - Green stimulus packages in 2010
In China, South Korea and the United States, cleantech companies have easier access to equity funding. Easy access to capital has two advantages for clean-tech companies. First, capital itself is needed to grow the business. Second, easy access to that capital means that companies have more time for their businesses, which means they can focus on keeping up with the high growth pace in the industry.
South Korea, for example, has developed a complete set of policy measures (i.e. “green fi nancing”) to stimulate fi nancial support of the cleantech sector. The South Korean government has designated the Korean Finance Corporation (KoFC) as the leading government-sponsored institution for green fi nancing. The KoFC provides indirect debt and equity and acts as a loan guarantor to cleantech companies. Next to this, government-sponsored banks provide the majority of loans and project fi nancing30,31.
One of the outstanding competitive factors of the Chinese solar PV industry is its access to cheap capital. State-owned enterprises in China can invest in cleantech companies under favorable terms. Regional governments often grant land use at low costs to cleantech companies in an effort to increase regional GDP. And banks and the state-owned bank offer credit at low interest rates. Capital in China is readily available32.
30 Korea Capital Market Institute, System Architecture for Effective Green Finance – Korea’s Case, 201131 Part of the green fi nance scheme is a green deposit scheme, modeled after the Dutch Green Fund32 Climate Policy Initiative, Survey of Photovoltaic Industry and Policy in Germany and China, 2011
Government green stimulus funds in 2010 [USD bn]
Other EU
USA
China
Japan
South korea
Germany

27 Clean Economy, Living Planet - The race to the top of the global cleantech market
In the United States in 2010, the venture capital industry increased its invest-ments in cleantech by 8%33. This high-risk capital enables companies to invest in R&D and develop innovative products, building the foundations of the indus-try and positioning the country for further growth.
3.3 Large companies drive cleantech sales growth
Top-performing cleantech nations have established large companies in the sector, and these companies are major drivers of their success. Take Vestas in Denmark or Yingly in China. They have the capabilities to keep pace with the high growth in the market and are able to utilize their competences to develop better products and expand their sales across the world. For instance, GE has entered the wind turbine market by acquiring Enron Wind; likewise, Siemens acquired Bonus. These two companies have leveraged their competences and global presence to create a worldwide cleantech footprint and sales base.
In the cleantech sector, large companies are chiefl y responsible for the incre-ase in sales and are therefore needed to grow the sector. In wind turbines, for example, 90% of market growth comes from the top-15 companies in the industry (fi gure 12).
Figure 12 - Consolidation in the cleantech sector
Large cleantech companies also build up strong networks of suppliers. Thanks to their size, they offer smaller companies a key sales opportunity and even enable the execution and coordination of research projects between companies.
33 US venture capital (VC) investment in cleantech companies increased by 8% to USD 3.98 billion in 2010 from USD 3.7 billion in 2009, and deal total increased by 7% to 278, according to Ernst & Young and Dow Jones Venture Source
Consolidation Growth in solar PV cell manufacturing comes from large companies
Share of top 10 43% 51%
Worldwide production capacity [GW] (base case)
Growth in wind turbine manufacturing comes from large companies
Top 10 production capacity [GW] (base case)
2011
18.2
35.8
2010
12.7
29.3
Share of top 15
2010
27.1
Growth 2008
38.7
Other companies
Top 15 companies
11.6 89% 90%
Worldwide production [GW]

28 Clean Economy, Living Planet - The race to the top of the global cleantech market
Large companies also act as launching customers. Large utility companies, for example, have developed the market for wind turbines in Denmark and Ger-many; as experienced and demanding customers, they incentivize the industry to innovate.
3.4 The lessons reaffirm the 2009 WWF-NL recommendations
The three lessons from the top-performing countries closely parallel the recom-mendations from the report in 2009, reaffirming their relevance to Dutch government, research institutes, companies and society.
The first recommendation on foundational support starting in the early stages of the innovation cycle and continuing through market launch is reflected in the lesson of a coherent and supportive industrial policy. A good R&D strategy supports both fundamental and applied research demonstration projects and market creation, and which can thus move innovations from idea to product.
The second recommendation on the limited availability of seed capital for cleantech companies is mirrored in the second lesson on easy access to capital.
The third recommendation emphasized the importance of developing a home market. This recommendation is reflected in both the first and the third les-sons. Government support to develop a home market is mandatory for the development of the cleantech industry. A home market gives local cleantech companies the opportunity to develop and sell their products and grow into mature and competitive businesses. Also, start-ups and smaller cleantech companies benefit from larger cleantech companies taking the role of launching customers.
As outlined in the introduction, these recommendations have only been im-plemented to a certain extent. It is clear from the cleantech leaders that there remains great, untapped potential in the Netherlands to accelerate the growth of the Dutch cleantech sector.
For instance, there is no alignment of industrial policy and energy policy in the Netherlands. In the current “topteam” debate, cleantech industrial policy is intermingled with general energy industrial policy. The government has not focused its policy on those cleantech segments in which the Netherlands has a competitive advantage. It is thus not creating a home market by ensuring the

29 Clean Economy, Living Planet - The race to the top of the global cleantech market
large-scale deployment of a certain technology. Nor is the Dutch government investing in supportive infrastructure in the Netherlands. The government has increased its investments in R&D in renewable energy and energy effi ciency since 2005, but these amounts have fl uctuated widely34 and are not targeting those technologies in which the country wants to excel. A few pilot projects have been funded (e.g. PlantOne), but the demonstration stage of the offshore wind project FLOW did not receive funding. No integration between R&D and market creation is present. R&D in solar PV has not been met with subsidies for the deployment of solar PV.
Nor has access to capital improved in the Netherlands. The amount of venture capital invested in cleantech segments in the Netherlands dropped to only EUR 6 million in 201035. In other countries, this fi gure rose. While the Dutch government does provide guarantees to banks for loans offered to cleantech companies, it is not meeting the demand for equity capital36. Also, the tax advantages in its Green Fund program have been scaled down, reducing the amount of project fi nancing available to cleantech. A noteworthy fact is that Dutch bankers are investing in cleantech – abroad.
Figure 13 - Venture capital investments in cleantech
Furthermore, no large Dutch companies in the cleantech sector are present. In solar PV, for example, Dutch companies have not been able to expand their production capacities in line with the global market. Many of the solar PV equipment manufacturing companies have been acquired by larger, foreign companies. The situation in the Dutch wind segment is similar. Dutch clean-tech companies are currently too small to compete on a global scale.
34 PWC/Decisio, Monitoring van publiek gefi nancierd energieonderzoek, 2005-200935 NVP, Ondernemend Vermogen 201036 The Technopartner seed facility cap of EUR 4 m is too low and thus does not permit venture capital
funds to diversify risk and invest considerable amounts in start-ups
Venture capital investments in Cleantech [EUR m]1)
1) Marketanalysis: Investments by country of portfolio company 2) Cleantech: investments in energy and the environment
-70%
2008 2010 2009 2007
UNITED STATES NETHERLANDS
Source: NVP, Ernst&Young
2008 2007 2010 2009
+8%

30 Clean Economy, Living Planet - The race to the top of the global cleantech market
4 Barriers in the Dutch cleantech sector and recommendations for overcoming them
The Netherlands holds no major market share in any of the main cleantech seg-ments. Since 2009, the Netherlands has not made progress in those areas the WWF-NL recommends are most crucial to its growth and success in this sector.
The top-performing countries exemplify what countries should do to achieve a strong position in cleantech. Companies were asked to identify the obstacles they face in the Dutch sector. A number of barriers are inhibiting the Nether-lands’ progress. Understanding what those barriers are can point the Nether-lands in the direction of growth.
4.1 Five barriers inhibit the acceleration of the Dutch cleantech sector
To understand the discrepancies between global cleantech growth and that of the Dutch sector, we conducted a survey of Dutch companies. The survey asked companies to name the barriers that most severely hamper their com-panies’ growth, what actions are needed to overcome those barriers, and how they would rate government policy on the sector. Sixty companies, represen-ting the range of cleantech segments, responded to the questionnaire.
Figure 14 - Dutch companies which participated in the cleantech survey
Company overview
Large player > EUR 5 m 24%
Small player EUR 50.000 – 5 m 32%
Startup < EUR 50.000 43%
Companies by revenue Companies by CET sector
Insulation
Other 8% Lighting
Solar
Wind 8%
Combined Heat Power
5%
Biomass
11%
Heating ventilation and Air conditioning
Consulting

31 Clean Economy, Living Planet - The race to the top of the global cleantech market
Responses were classifi ed into seven categories:
• Unstableregulation• Insufficientfinancing• Marketdevelopment• Internalorganization• Innovationneeds• Valuechainissues• Fossilalternatives
Figure 15 grades these responses according to the number of times they were mentioned and the level of priority applied to them by respondents. The survey clearly reveals that unstable regulation, market development and insuffi cient fi nancing are major obstacles to sector growth in the Netherlands. Internal or-ganization and innovation needs are also major issues that must be addressed.
Figure 15 - Barriers to Dutch cleantech growth
Unstable regulation is mentioned most often and is given high priority by res-pondents. The new government’s replacement of the SDE subsidy framework with the SDE+ regulation is seen as a signal that the government is not commit-ted to renewable energy. Important technologies are effectively excluded from obtaining subsidies and the caps to the total budget adds to the uncertainty of investments. Regional and municipal regulation, too, may hinder the adoption of renewable energy technology (e.g. the installation of biogas plants is often delayed by lengthy permit processes).
Importance of Dutch barriers
UNSTABLE REGULATION
INSUFFICIENT FINANCING
MARKET DEVELOPMENT
FOSSIL ALTERNATIVES
INTERNAL ORGANIZATION
INNOVATION NEEDS
VALUE CHAIN ISSUES
FREQUENCY
PRIO
IRTY
Often mentioned Rarely mentioned
Very
im
porta
nt
Not im
porta
nt
Important and general barriers
Irrelevant general barriers
Important but specific barriers
Non-essential barriers
> SDE renewable energy support framework has been replaced by SDE+
> Absence of domestic market and no large launching customers
UNSTABLE REGULATION
INSUFFICIENT FINANCING
MARKET DEVELOPMENT
INTERNAL ORGANIZATION
INNOVATION NEEDS
> Little medium-sized venture capital > Banks have reduced credit
> SME companies have low growth ambitions and have not been able to grow further
> Low R&D expenditures > Innovation gap
Source: Roland Berger analysis

32 Clean Economy, Living Planet - The race to the top of the global cleantech market
The absence of a home market is also frequently mentioned. Companies face difficulties in selling their products, as customers are risk averse and do not want to experiment with new technology. Companies also face difficulties in obtaining financing for capital intensive cleantech products that have a payback period over three years, or which are considered more risky.
The third major barrier is insufficient financing. While mentioned less often, it is given high priority. Financing is necessary on both sides of the value chain, for consumer purchasing as well as for company growth. The most frequently mentioned issues are the need for working capital, the lengthy procedures required to obtain bank or venture capital, and the necessity for government guarantees.
A fourth barrier concerns internal organization. Many companies have a hard time reaching the scale needed to keep up with the high pace of growth in the cleantech market. Issues include managing business expansion, setting up sales and distribution channels, developing logistics and attracting skilled personnel.
While innovation needs is not frequently mentioned as a barrier, the companies that do mention it give it a high priority. Companies often lack financial support during the high-risk R&D stages in which fundamental research is demon-strated. Furthermore, R&D uncertainty and lead times require far too many resources from SME companies.
While these barriers exist in most countries, the degrees to which they inhibit growth differ. To identify which barriers are particularly detrimental to Dutch cleantech, we also surveyed companies abroad and the barriers they face in reducing CO2 emissions. In this survey, 90 companies of all sizes and from all sectors participated. A comparison of the Dutch and international surveys reveals that unstable regulation and market development are obstructing Dutch development.

33 Clean Economy, Living Planet - The race to the top of the global cleantech market
Figure 16 - Barriers in cleantech specifi c to the Dutch situation
4.2 Three recommendations will help the Dutch cleantech sector accelerate growth
The Dutch cleantech sector and its stakeholders – fi nancial institutions, busi-ness associations and the government – convened at the WNF-FME cleantech symposium held May 9, 2011 to discuss the current state of the sector in the Netherlands and to develop recommendations to advance the sector’s growth. Through roundtable discussions, the Dutch cleantech stakeholders formulated three recommendations that build on the lessons of the top-performing coun-tries and incorporate the barriers to Dutch cleantech growth.
The government must make a clear-cut choice for renewable energy and then base its industrial policy on best practices
Guiding principlesIn order to reach a coherent, stable and supportive industrial policy, and thus for business to thrive, the government must fi rst make a clear choice for cleantech. The current government has not made a clear-cut decision for a renewable energy future and the government lacks vision and leadership in this respect.
To avoid reinventing the wheel and to accelerate policymaking (and to make up for the lost time), the Dutch government should look to successful countries (e.g. the frontrunners) and model its policy frameworks accordingly.
UNSTABLE REGULATION
INSUFFICIENT FINANCING
INTERNAL ORGANIZATION / CONSOLIDATION
INNOVATION NEEDS / R&D
GLOBAL BARRIERS
DUTC
H BA
RRIE
RS
Often mentioned
Infrequently mentioned
Ofte
n m
entio
ned
Infre
quen
tly
men
tione
d
Dutch-specific barriers
Barriers more often seen abroad
MARKET DEVELOPMENT

34 Clean Economy, Living Planet - The race to the top of the global cleantech market
The government should also invest in the preconditions necessary for a success- ful cleantech sector, such as the construction and maintenance of an energyinfrastructure and the large-scale deployment of cleantech, to demonstrate its sincere commitment. Furthermore, it should develop R&D budgets for large-scale demonstration projects. While companies would lead the initiation of these projects, contributing their knowledge and labor, the government (and other larger companies) would fund them.
Short-term measuresIn the short-term, the Dutch government must focus its efforts on biobased ap-plications (biochemicals, biofuels, biogas and biomass electricity and heat) and offshore wind37. These cleantech segments correspond with the competitive strengths of the Netherlands. Then, the government must create a stable home market for these technologies with a long-term support program that will ena-ble large-scale deployment38. Also, the Dutch government needs to develop a roadmap for its R&D efforts in renewable energy. This roadmap should attribute a larger part of the budget to biobased applications and offshore wind. In other fields, the government should just maintain a sufficient level of R&D in order to keep up with developments worldwide. Analogous to the German Bremer-haven investment, the Dutch government and port authorities should invest in infrastructure for both the biobased economy and offshore wind sector. These investments will signal its commitment and will reduce market uncertainty.
The government must also increase its R&D budget to support the much needed demonstration projects. For instance, the government did not provide funding to the second stage of the highly praised FLOW demonstration project. The government should raise the budget such that it can support at least four demonstration projects in the next three years.
In these demonstration projects, suppliers and transporters of biomass, instal-lation and equipment manufacturers, biomass conversion companies and end-users (business-to-business) need to cooperate in setting up a biobased value chain that replaces fossil fuels with second-generation biochemicals, biofuels and biogas. Projects could establish a bio-ethanol to bio-ethane value chain, large-scale biomass gasification or a lingo-cellulosic biomass refinery.
37 Solar PV has a second priority38 Either via target setting or via feed-in tariff schemes

35 Clean Economy, Living Planet - The race to the top of the global cleantech market
Financial institutions must cooperate with each other and with government in devising financial solutions to support the cleantech sector
Guiding principlesProviding access to capital is the main responsibility of the financial sector. There is a major need for cleantech venture capital to provide equity financing to entrepreneurs and firms in their expansion stages. The financial sector must also act proactively, i.e. bringing private players together as well as initiating more cooperation with the government. Such cooperation could, for example, overcome risks (through public financing) that would normally be insurmoun-table. Banks and other investors should build a knowledge base about clean-tech, which would help them better understand the risks of their investments and enable them to provide their debtors with valuable information.
Short-term measuresIn the Netherlands, around five venture capital funds dedicated to cleantech are present that have a size in excess of EUR 20 million. Hence, the total amount of investments possible in Dutch cleantech start-ups is very limited39, as exemplified by the EUR 6 million in investments in 2010. The Dutch finan-cial sector should actively raise capital from private and institutional investors to establish more VC funds. By raising the current cap of EUR 4 million in its “technopartner” regulation to at least EUR 15 million, the Dutch government can assist the financial sector in establishing VC funds that are large enough to invest in the sector and diversify risks. In so doing, the government thus sup-ports the cleantech sector but also assists in building a sound Venture Capital sector, benefiting the Dutch economy as a whole.
Furthermore, government and financial institutions should continue their support of the Holland Financial Centre’s initiative to assess the possibilities of establishing a Green Investment Fund. The financial sector should also develop lending principles that take into account the capital-intensive but low operating cost of cleantech products. Finally, financial institutions and government must also devise a common solution to the Green Fund scheme, which has become less attractive due to a cut in tax advantages.
39 Assuming an average size of EUR 30 m and a 5-year investment period, a theoretical maximum to annual investments in Dutch cleantech equals EUR 30 m at most. However, Dutch funds make substantial investments abroad, lowering the theoretical maximum further

36 Clean Economy, Living Planet - The race to the top of the global cleantech market
Large companies and cleantech companies should work with smaller cleantech companies
Guiding principlesLarge cleantech companies should initiate more extensive cooperation with smaller players, like sharing knowledge and distribution channels, and should establish a representative body for the industry. Large companies can also act as launching customers, thus meeting the demand necessary to push the sector forward. The government should also take on its responsibility as launching customer.
Short-term measuresThe WWF climate savers – WWF business partners in reducing the carbon footprint – procure cleantech solutions on a large-scale. For instance, KPN, as a launching customer, has helped Kyotocooling – one the WNF Cleantech Star nominees in 2009 – with the development of its cooling solutions for data centers. Eneco invests in renewable energy production like wind energy (both onshore and offshore), biomass, hydro, solar and geothermal energy. More Dutch businesses should adopt these cleantech procurement practices.
In the FLOW project, large companies and small companies in the offshore wind business cooperate in R&D. Similarly, large and small Dutch companies in (bio)chemicals, food and transport should also cooperate in innovation projects to develop a biobased value chain.
The government has ample opportunity to contribute to all of these activities. In 2008, 75% of the 334 Dutch government buildings did not have an energy label in either category A or B. To start, the Dutch government could act as a launching customer in many technologies in energy efficiency.

37 Clean Economy, Living Planet - The race to the top of the global cleantech market
5 Getting the Netherlands back on track towards a top-10 position in the global cleantech industry
In the 2009 report, WWF-NL announced its ambition for the Netherlands to gain a top-10 position in the global cleantech industry. But since that first report, the Netherlands has dropped to 18th position – making this ambition more difficult to achieve. Although Dutch cleantech has increased in value, the accelerating global growth rate of the industry is hard to keep up with.
Despite its lagging performance, the Netherlands can still reach this goal. The Netherlands is home to many ambitious companies which share WWF-NL’s plan. And because the cleantech sector is, in many ways, in its infancy, there is still ample opportunity for the Netherlands to secure significant market share in many areas. If realized, the three recommendations developed in collabo-ration with the Dutch cleantech sector should create a stable environment for growth. If the government, industry, academia and the public work together on these recommendations, a top-10 position can be within reach.
5.1 The Netherlands can grow its cleantech business to EUR 3-4 billion
In the 2011 ranking, the value added of the Netherlands equals EUR 1.4 billion. If the Netherlands grew its value added in line with the market, this would equal EUR 1.6-2.6 billion by 2015 – still not enough to advance the Netherlands far enough in the ranking to become a cleantech leader.
To gain a top-10 position by 2015, the Netherlands needs to overtake Belgium currently in 10th place. Assuming that the growth pace of the Belgian cleantech industry is in line with the global pace at 10-15% per annum, the added value of Belgium would be in the range of 0.6% to 0.7% of its GDP by 2015. To over-take Belgium, the Dutch cleantech sector must grow between 18% and 24% and reach a total value added of EUR 3-4 billion.
The success of the Netherlands in a renewable energy future depends on the success of its cleantech companies. The Dutch cleantech companies that parti-cipated in the 2011 WNF Cleantech Star survey have a current total sales vo-lume of EUR 450 million. We asked these companies to state their sales growth ambitions for 2015. Combined, the sector aims to grow by a sales weighted average of 25-30%, implying total sales of EUR 1.4-1.7 billion by 2015. If this ambition is supported by the sector as a whole (and its stakeholders), the sector’s growth can exceed the growth rate of 18-24% to reach a position in the top 10. A position at number 7 or 8 is then feasible40.
40 Assuming that growth in sales is equal to growth in value added, all other countries grow in line with the market

38 Clean Economy, Living Planet - The race to the top of the global cleantech market
5.2 Ambitious and successful companies prove the feasibility of the top-10 ambition
To show the potential of Dutch cleantech companies, WWF-NL initiated the WNF Cleantech Star. The award is given to companies which make products that structurally contribute to the transition towards renewable energy and/or energy efficiency. The companies must invest in R&D, innovate and expand production and capacity in order the realize the transition goals on a larger sca-le. The companies must also have a successful strategy focused on growth, pro-fitability and corporate social responsibility. A company with the WNF Clean-tech Star is an example to other companies in the Netherlands and abroad. In recognizing excellence in economic, climate and innovation performance, the award inspires entrepreneurs and companies to take advantage of the opportu-nities in cleantech. It also shows government and the general public cleantech’s contribution to the economy and to the creation of green collar jobs.
In 2009, Priva was awarded the first WNF Cleantech Star. Priva provides energy-efficient climate control and process automation for horticulture and for commercial and industrial buildings.
The selection of the 2011 WNF Cleantech Star was a three-step process. In the first step, companies were invited to complete a questionnaire on their economic, climate and innovation performance. The jury then chose six nominees, and each company was visited by a jury member. In the final step, each company gave a presentation to the entire jury. The presentation detailed the company’s contribution to the Dutch knowledge economy and to the global environment. The jury then chose a winner.
For the 2011 award, WWF-NL identified 280 companies in the Dutch clean-tech sector. These companies are active across the cleantech spectrum and are proof of Dutch competence in this sector. The growth of these companies, expanding sales at home and abroad and developing new and better products, contributes to the climate goals of WWF-NL and at the same time is good for the Dutch economy.
Topell Energy has been awarded the 2011 WNF Cleantech Star. The biocoal product developed by Topell reduces CO2 emissions by up to 90% compared to coal, and can substitute coal for both heat and power applications. The torrefac-tion process developed by Topell is the most efficient available. What’s more,

39 Clean Economy, Living Planet - The race to the top of the global cleantech market
Topell has the ambition to grow its production substantially by 2015, and couldthus reduce CO2 by 4 Mton per year. Topell’s biocoal and processes represent an important step in the transition towards 100% renewable energy.
40 Clean Economy, Living Planet - The race to the top of the global cleantech market
6 Conclusions and recommendations
The urgency to act on climate change is clear. WWF-NL’s trip to Greenland with Crown Prince Willem Alexander van Oranje in May was a stark reminder of the massive changes in the Arctic. But the impact of climate change is evi-dent around the globe; melting glaciers and rising sea levels are only the most noticeable consequences.
The solution to climate change is also clear. The main cause of climate change is the large-scale burning of fossil fuels and the subsequent release of CO2 into the atmosphere. A 100% renewable energy future is feasible and energy effici-ency and renewable energy will cut these emissions drastically.
Countries and companies are already investing in the R&D that will develop more efficient and more renewable – and economical – solutions that can meet our global energy demand without destroying the planet. In the last two years alone, the global cleantech sector has made major leaps towards a low-carbon economic future, though some countries have been more successful than others. China, for instance, grew in that time by more than EUR 30 bn in value added. The Netherlands, in contrast, fell behind, dropping one place to the 18th position in the ranking. WWF-NL’s ambition that the Netherlands beco-mes one of the top-10 countries in cleantech seems a far reach in this rapidly developing sector.
But the Netherlands can learn from the countries that are performing well. Les-sons taken from their success closely resemble the recommendations WWF-NL put forward in 2009. For the Netherlands to thrive in cleantech – more impor-tantly, for the future economy and environment to be sustained and sustainable – the Netherlands must take the reigns of a 100% renewable energy future. Three recommendations will guide the way:
• Thegovernmentmustmakeaclear-cutchoiceforrenewableenergyand then base its industrial policy on best practices, including large-scale deployment, R&D and supportive infrastructure
• Financialinstitutionsmustcooperatewitheachotherandwithgovern-ment in devising financial solutions to support the cleantech sector
• Largecompaniesandcleantechcompaniesshouldworkwithsmallercleantech companies

41 Clean Economy, Living Planet - The race to the top of the global cleantech market
The goal is for the Netherlands to increase its cleantech value added to EUR 3-4 bn, or between 0.6% and 0.7% of Dutch GDP, by 2015. What is good for the planet and its citizens is also good for the economy. Cleantech Stars like Topell prove that a sustainable future – and a thriving Dutch cleantech sector – are within reach.

42 Clean Economy, Living Planet - The race to the top of the global cleantech market
Appendix A Methodology
The cleantech country ranking measures the cleantech value added per country – how much is earned with the manufacturing of cleantech products and tech-nology. The ranking includes the 27 EU member states, the G7 countries, the BRIC countries, and South Africa, South Korea, Taiwan, Turkey and Australia.
To measure the status of each country, we analyzed the value added of the major renewable energy and energy efficiency technologies in 2010. Rene-wable energy here is defined as the technologies to create heat, electricity or transportation fuels. Energy efficiency consists of those technologies that are only dedicated to increasing efficiency or replacing less efficient technologies. Insulation and lighting solutions are considered in the study, for example, be-cause they are solely dedicated to increasing efficiency. Products where incre-mental advanced have been made, such as household appliances or cars with energy efficient engines, have not been included. Although we recognize that the contribution of these products can be large, they are not solely dedicated to reducing CO2 emissions. It is important to note that we have excluded hydro-power in this ranking. The environmental damage caused by hydropower and hydrodams contributes to global warming. Furthermore, hydropower has been used for more than a century and so does not represent a new or innovative application of cleantech. We acknowledge that this is an important industrial sector in countries like Austria, Germany, France and China, but exclude it from our definition of cleantech for the purposes of this report. Neither did we include CCS.
The value added of manufacturing cleantech products in each country has been counted. We attributed this value added to the country where the products were manufactured. For instance, if a Japanese company manufactured a Solar cell in China and sold it in the US, the value of the Solar cell was attributed to China. To show the economic potential of cleantech, we only counted the manufacturing of tradable goods41. That means, that we counted the capital expenditures on cleantech goods, but we did not count the operational expen-ditures or local installation costs42. Counting operational expenditures or local installation costs would imply that we implicitly measure the adoption as well, rather than only the manufacturing part of cleantech. Although adoption of cleantech also adds economic value to a country, other rankings already show which countries have already deployed cleantech on a large scale.
41 Tradable goods are those that have export or import potential. Their prices are set in international markets
42 Except for these technologies, where installation has the characteristics of a tradable good and foreign companies and laborers are specialized in the installation, for instance in offshore wind or geothermal energy

43 Clean Economy, Living Planet - The race to the top of the global cleantech market
The methodology is based on a modular framework to include a country’s manufacturing contribution in each step of the value chain of each cleantech segment. This modular approach enables the allocation of manufacturing value to countries in separate value chain step and avoids the allocation of all manu-facturing volume to the country that makes the fi nal product. For instance, a Danish wind energy turbine may include a Belgian gear box. While the wind turbine could be sold by a Danish company, the value of the transmission in this wind turbine was allocated to Belgian sales and the other parts of the turbine to Danish sales.
Figure 17 - Modular approach to value added calculation
The value added was counted in three stages. In the fi rst stage, the manufactu-ring volume in each value chain step was totaled per country. The second stage determined the cost share per step in the value chain. Total costs of a cleantech product were allocated to the various production steps in the value chain.In the third stage, the value added per country now equals the manufacturing volume in each step in the value chain multiplied with the cost share per step in the value chain.
The cleantech ranking is based on the following cleantech segments:
• Windenergy(onshoreandoffshore)• SolarPV• Solarthermal• CSP• Geothermal
Modular framework for CET value added
1,300
1,300 9% 76% 7%
9%
1,300
SALES VOLUME PRICE
Onshore wind energy
Foun-dation Turbine Grid Other
Tower Drive Rotor blades Other…
EUR 25 bn
EUR 25 bn
EUR 25 bn
> Modular framework enables consistency in calculation while enabling flexibility
> The level of detail can vary between technologies or meet specific country requirements
> The technologies included in the sales scope should cover the majority of industry and is modularly expandable
> Assess country market volume per step in value chain per technology and differentiate on level of detail
> Assess value addedd of steps in value chain
> Calculate country CET added value
Remarks Approach

44 Clean Economy, Living Planet - The race to the top of the global cleantech market
• Biodiesel• Bioethanol• Biogas• Heatpumps• Insulation• LEDlighting• Compactfluorescentlighting• Electricvehicles• Fuelcells• Flywheels• MicroCHP• Batteries
No single source with comprehensive data on the cleantech manufacturing industry is yet available. Therefore, the ranking is based on a broad range of sources, including industry trade organizations, broker and industry reports, and the annual reports and investor presentation from the cleantech companies themselves. A complete list can be found below.
• AnsamAbayechi,Lithium-ionBatteriesforElectricVehicles:TheUSValue Chain, CGGC, October 2011
• AsociacióndelaIndustriaFotovoltaica–Haciaunsuministrososteniblede electricidad
• AsociacióndelaIndustriaFotovoltaica–PresentadoelInformeanualdeASIF2009:“HacialaconsolidacióndelaenergíafotovoltaicaenEspaña”
• AsociacióndelaIndustriaFotovoltaica–Situaciónenelmundo• AxisResearchMind,BiodieselandFeedstocks–AGlobalMarketOut-
look• BiofuelsPlatform–statistics• BMUGreentech2.0• BoschThermotechnik–Themarketforthermotechnology• BSRIA–SuperSuccessfulHeatPumps• BTMConsult–WorldMarketUpdate• BundesverbandSolarwirtschaft–StatistischeZahlenderdeutschen
Solarstrombranche (Photovoltaik)• BundesverbandSolarwirtschaft–ThePhotovoltaicandSolarThermal• CenterforAgriculturalandRuralDevelopment,EthanolPrice2005-
2010• CentralBureauofStatistics–Statlinedatabase

45 Clean Economy, Living Planet - The race to the top of the global cleantech market
• Chi-HsunLinandMong-ChiaoHuang,LEDLightingIndustry,ITISProgram, 2010
• CleanEdge–CleanEnergyTrends2008• Comext–Externaltradedatabase• ConvergeNet–UPSSystems:WhataretheOptions?• CRISIResearch,IndependentEquityResearch,2011• DeltaEnergy&EnvironmentLtd,Micro-CHP–HistoricandFuture
Sales, October 2010• DeltaEnergy&EnvironmentLtd,Micro-CHPFinallyArrivesinEurope-
But Future Growth Uncertain, January 2011• DeutschEnergie-Agentur,Biogaspartner–gemeinsameinspeisen,May
2010• EarthPolicyInstitute,U.S.AnnualBiodieselProduction,2000-2009• EarthPolicyInstitute,WorldAnnualBiodieselProduction,1991-2009• ecoprog&FraunhoferUmsicht,TheMarketforBiogasPlantsinEurope,
June 2010• Electroiq,PVinvertermarket:7munits,$8.5bin2014,saysIMSRe-
search, January 2010• EmergingMarketsOnline–Biodiesel2020:GlobalMarketSurvey,
Feedstock Trends and Forecasts• EnergyInformationAdministration,FormEIA-63B,“AnnualPhotovol-
taic Module/Cell• EnergyInformationAdministration,OfficeofIntegratedAnalysisand
Forecasting• ENERSEnergyConcept,Productionofbiofuelsintheworld”(data
2009)• ePure,EuropeanProductionCapacityInstalled,August2010• EurObserv’ER–Barometer(variousversions)• EuropeanBiodieselBoard–statistics• EuropeanBiodieselBoard,2009-2010:EUbiodieselindustryrestrained
growth in challenging times• EuropeanCommission,CommissionStaffWorkingDocument,Accom-
panying Directive 2005/32/EC with regard to ecodesign requirements for nondirectional household lamps
• EuropeanCommission,Strategicenergytechnologiesinformationsys-tem, Geothermal Energy, 2011
• EuropeanHeatPumpAssociation,Outlook2010• EuropeanPhotovolaticsIndustryAssociation–GlobalMarketOutlook
for Photovoltaics until 2013• EuropeanPhotovolaticsIndustryAssociation–SolargenerationV2008

46 Clean Economy, Living Planet - The race to the top of the global cleantech market
• EuropeanSolarThermalIndustryAssociation–ConcentratedSolarThermal Power – Now!
• Eurostat• Eurostat–Statisticsdatabase• ExaneBNPParibas,Whatoutlookforinsulationplayersinamorechal-
lengingenvironment?,October2008• EzineMark,WindTurbineRotorBlades,December2010• FachverbandBiogase.V.,BiogasBranchenzahlen2010• Farms.com,2010AnnualEthanolProduction=13.23billiongallons• FreedoniaGroup,WorldInsulationDemandbyValue,2011• GCL-PolyEnergyHoldingsLimited,2010FullYearResults,March
2011• GeothermalEnergyAssociation–GeothermalIndustryEmployment:
Survey Results & Analysis• GeothermalEnergyAssociation,GeothermalEnergy:International
Market Update, May 2010• GermanyTrade&InvestGmbH,LightingIndustryinGermany,April
2009• GlobalWindEnergyCouncil–GlobalWindReport2008• GlobalData–GlobalGeothermalEnergyMarketAnalysisandForecasts
to 2012• GlobalData–GlobalSolarThermalPowerMarketAnalysisandFore-
casts to 2013• Globalinsulationmagazine–OntheChineseinsulationindustry• GTMResearch,2009globalpvCellandModuleProductionanalysis,
May 2010• HongKongExchangesandClearingLimited,NVCLightingHolding
Limited• IEA-SHC-SolarHeatWorldwideMarketsandContributiontothe
Energy Supply 2006, edition 2009• IHSEmergingEnergyResearch,WindTurbineComponentSupply
Chain Strategies: 2010-2025, June 2010• IMSResearch,TheWorldMarketforPhotovoltaicInverters2010• InterconnectionConsulting–ThermalInsulationinEurope2008Deve-
lopment and Trends• InternationalGeothermalAssociation–IGANews72• InternationalInstituteofRefrigeration,Newsletterno.45,January2011• InternationalEnergyAgency,RenewableEnergyEssentials:Geothermal,
2010• Islandsbanki,U.S.GeothermalIndustryOverview,February2011

47 Clean Economy, Living Planet - The race to the top of the global cleantech market
• Islandsbanki,UnitedStatesGeothermalEnergy,October2010• iWatt,LEDLightingMarketShinesSemiconductorIndustry,2010• J.P.Morgan,NVCLightingHoldingsLtd,December2010• Jefferies–CleanTechPrimer• JefferiesInternationalLtd.,EnergyStorage–BatteryTechnology,2011• JRCScientificandTechnicalReports,RenewableEnergySnapshots
2009• KPMG,WorldGeothermalMarket&Outlook,2010• Larouchepac,BiofuelsBurnBillionsof“MealsPerGallon”!,March
2011• LEDinside,BeLight:LEDlightbulbstodominatethelightingmarket,
2010• LEDinside,RogerChu,LEDIndustryOutlookin2011• LisaFrantzis&ShalomGoffri,SolarWaterHeatingSupplyChainMarket
Analysis, September 2010• LuxResearch–The$41billionenergystoragemarket:thenextbig
energy investments• MAKEConsulting–TheWindForecast–Supplyside,Demandside• MAKEConsulting,WindEnergyMarketShare2010,March2011• ManufacturersSurvey• MarketTransformationProgramme,Insulationindustryproductand
market overview, 2008• Marketbuzz,SolarbuzzAnnualWorldPhotovoltaicMarketReview,
March 2011• MarketsinGermany–StatusQuoandPerspectives• MorganStanley,LED:FromTVtoLighting;UpgradeEpistarandEver-
light to Overweight, May 2010• MüllundAbfall,DerBiogasmarktinEuropakommtbis2020inFahrt–
Deutschland bleibt Vorreiter, 2011• NASDAQ,Newsletter,March2011• NavigantConsultingEurope,Ltd.,ReviewofSalesandInventoryEsti-
mates• NREL,ConcentratingSolarPowerProjects,June2010• PeterClarke,Wafersalesup43%in2010,saysSEMI,EETimes,July
2011• PhotonInternational,YearoftheTiger,March2011• PolicyResearchInstitute,MinistryofAgriculture,ForestryandFis-
heries, Japan –Biofuels Policies in Asia• PowerElectronicsTechnology–EnergyStorageDeviceMarkettoHit
$12BillionByDecade’sEnd

48 Clean Economy, Living Planet - The race to the top of the global cleantech market
• PVTech,ChinesefirmbreaksintoVLSIResearch’sTop10PVequip-ment supplier rankings for 2010, March 2011
• PVTech,ComtecSolarpostsrecordrevenueandwafershipmentsin2010, March 2011
• PVTech,Daqoreports2010polysiliconshipmentsat3,650MT:reve-nueUS$242.7million
• PVTech,SolarWorldtoexpandmoduleproductionto1.4GWin2011,March 2011
• RenewableEnergyWorld,CanEuropeSolarThermalCompete?,March2011
• RenewableFuelsAssociation–statistics• RenewableFuelsFoundation,2011EthanolIndustryOutlook• RolandBerger–variousreports• RommertSchram&OscarKibazohi,BioenergyandFoodSecurityPro-
ject: Final Consultation, May 2010• RuggeroBertani,GeothermalPowerGenerationintheWorld2005–
2010 Update Report, April 2010• Sarasin–Sustainabilityreport• Sarasin,Solarenergy2008–Stormyweatherwillgivewaytosunnier
periods• SaschaRentzing,Adimeadozen,newenergy,March2010• SemiconductorTODAY,ChineseburnintoLEDmarketdrivingMOCVD,
September 2010• SenterNovem,BioethanolinEurope,2007• ShumingHua,CurrentSituationofCFLProductinChina,June2008• SMC,Havellsseenatureinelectricity,2011• SocieteGenerale–GreenNewDeal• SolarEnergyIndustryAssociation–USSolarIndustryinReview2008• Solarbuzz-Marketbuzz2009• SolarServer,GCL-Polyrevenuesgrow274%to2.37billionin2010,
March 2011• SolarServer,LDKSolarrevenuessoar36%in4Q2010toUSD921mil-
lion, March 2011• SonneWind&Wärme–DerMarktwächst• StephenLawrence,GeothermalEnergy,LeedsSchoolofBusiness,2008• Sun&WindEnergy,Vacuumtubeindustryonanupwardtrend,De-
cember 2009• TheWallStreetTranscript,2015Lithium-ionBatteryMarket,February
2011• U.S.CommercialServiceChina,HVACIndustryOverview,2011

49 Clean Economy, Living Planet - The race to the top of the global cleantech market
• U.S.EnergyInformationAdministration,FormEIA-22M,“MonthlyBio-diesel Production Survey” and EIA-22S, “Supplement to the Monthly Biodiesel Production Survey”
• U.S.EnergyInformationAdministration,GeothermalHeatPumpManu-facturing Activities 2009
• U.S.EnergyInformationAdministration,SolarThermalCollectorManu-facturing Activities 2009, December 2010
• USEnvironmentalProtectionAgency,agSTAR,2010• USDAForeignAgriculturalService,BrazilBiofuelsAnnual,July2010• VITO,Lot19:Domesticlighting,October2009• VLSIResearch,Top10PVEquipmentSuppliers2010• VrindaBhandarkar,WorldStatusofSSLManufacturing,StrategiesUn-
limited, April 2010• WernerB.Koldehoff,ClimateChangeandRenewableEnergies,Febru-
ary 2011• WorldwatchInstitute–StrongGrowthinCompactFluorescentBulbs
Reduces Electricity Demand• ZiaEftekhar,TheTransformationoftheLightingIndustry,March2011
Investor presentations, annual reports, press releases, websites of and broker reports on various companies:
• AIXTRON• AMGAdvancedMetallurgicalGroupN.V.• AmtechSystems• Bosch• CHSTEGroup• CRH• Danfoss• Enel• GE• HansenTransmissions• Kingspan• LMWindPower• NEM• NPC• OrmatTechnologies• Osram• OwensCorning• Philips• PhilipsLighting

50 Clean Economy, Living Planet - The race to the top of the global cleantech market
• Power-one• Recticel• ReneSolaLtd.• Rockwool• SaintGobain• Satcon• SchottSolar• Siemens• SMASolarTechnology• Solel• Synbra• Veeco• Vestas

51 Clean Economy, Living Planet - The race to the top of the global cleantech market
Appendix B – Literature
• Ackerman,FrankandElizabethStanton(2006),ClimateChange–theCosts of Inaction, Report to Friends of the Earth England, Wales and Northern Ireland
• Aki,Helen,ZacharyArnold,GenevieveBennett,JesseJenkins,ChrisKnight,AshleyLin,TajWaltonandAdamZemel,CaseStudiesinAmeri-can Innovation – A New Look at Government Involvement in Technolo-gical Development The Breakthrough, Breakthrough Institute, 2009
• Amos,J.,ProceedingsoftheICE–Engineering,SustainabilityDen-mark’s sustainable energy future, 156(9), 2009
• Andersen,PerDannemandReviewofHistoricalandModernUtilizationof Wind Power, 1999
• Andersen,PerDannemand,MadsBorupandMichaelHolmOlesen,Innovation in energy technologies, Risø Energy Report 5, 2006
• AnsamAbayechi,Lithium-ionBatteriesforElectricVehicles:TheUSValue Chain, CGGC, October 2011
• Beintema,N.M.,A.F.D.Avila,andP.G.Pardey.AgriculturalR&DinBrazil: Policy, Investments, and Institutional Profile. Washington, D.C.: IFPRI, Embrapa, and FONTAGRO, August 2001
• Biodieselmagazine,GlobalBiodieselproductionandmarketreport,2010
• TheBreaktroughInstitute,“Risingtigers,sleepinggiants”,2009• BundesministeriumfürBildungundForschung,dieHightechStrategie
zum Klimaschutz, 2007• BundesministeriumfürUmwelt,NaturschutzundReaktorsicherheit,
GreentechmadeinGermany2.0,VerlagFranzVahlenMünchen,2009• CleantechGroup,GlobalInvestmentTrendsandtheRiseofCleantech
in South Korea, 2011• ClimatePolicyInitiative,SurveyofPhotovoltaicIndustryandPolicyin
Germany and China, 2011• TheClimateGroup/HSBC,Deliveringlowcarbongrowth,2011• Colares,JuscelinoF.,ABriefHistoryofBrazilianBiofuelsLegislation
(June 25, 2008). Syracuse Journal of Law & Commerce, Vol. 35, No. 2• CommissievanWijzenICES/KISAdviesvandeCommissienaaraanlei-
ding van de Midterm evaluatie van de Bsik-projecten, 2008• DeutscheBank,TheGermanFeed-inTariffforPV,2011• EuropeanBiodieselBoard,2009-2010:EUbiodieselindustryrestrained
growth in challenging times• EuropeanCommission,InvestingintheDevelopmentofLowCarbon
Technologies, SET plan, 2009

52 Clean Economy, Living Planet - The race to the top of the global cleantech market
• EuropeanUnion,Directive2009/28/ECoftheEuropeanParliamentand of the Council, 2009
• FaningerG.H.SolarThermalsystemsinAustria,statusreport2005presented to the IEA Solar Heating and Cooling Program, 2005
• Fulley,Laura,StateRenewablePortfolioStandardsandEnergyEfficiencyResource Standards, presentation of American Council for an Energy-Efficient Economy
• Garnaut,R.,TheGarnautClimateChangeReview,CambridgeUniver-sity Press, Cambridge, 2008
• HSBC,“Climateinvestmentupdate”,2010• Innovatieplatform/RolandBerger,Stimuleringvandeeconomische
potentie van duurzame energie voor Nederland, 2010• IPPC,Fourthassessmentreport:Climatechange,2007• Jacobson,S.,andV.Lauber,ThePoliticsandpolicyofenergysystem
transformation – explaining the German diffusion of renewable energy technology, Energy Policy, 34, pp. 256-276, 2004
• Kamp,L.N.,Learninginwindturbinedevelopment:acomparisonbetween the Netherlands and Denmark, University of Utrecht, 2002
• Karplus,V.J.,InnovationinChina’sEnergySector,Workingpaper#61,Stanford University, 2007
• Kemfert,Claudia(2005).“GlobalClimateProtection:ImmediateActionWill Avert High Costs.” DIW Weekly Report 1(12): 135-141.
• KoreaCapitalMarketInstitute,SystemArchitectureforEffectiveGreenFinance – Korea’s Case, 2011
• KoreaEnergyManagementCorporation,IEADSMTask22Presenta-tion, 2010
• Kristinsson,KariandRekhaRao,LearningtoGrow:AComparativeAnalysis of the Wind Energy sector in Denmark and India, DRUID Working Paper No. 07-18, 2007
• Krohn,S.WindEnergyPolicyinDenmarkStatus2002,DanishWindEnergy Association, 2002
• Krohn,S.WindEnergyPolicyinDenmark:25yearsofSuccess–Whatnow?DanishWindEnergyAssociation,2002
• Lauber,V.,L.Metz,ThreeDecadesofRenewableElectricityPoliciesinGermany, Energy and Environment,15(4), pp 599-623, 2004
• Lewis,J.l.andRyanH.Wiser,“FosteringaRenewableEnergyTechnolo-gy Industry: An International Comparison of Wind Industry Policy Sup-port Mechanisms,” Energy Policy 35, no. 3 (March 2007): 1844–1857

53 Clean Economy, Living Planet - The race to the top of the global cleantech market
• Lewis,J.L.,“TechnologyAcquisitionandInnovationintheDevelopingWorld: Wind Turbine Development in China and India”, St Comp Int Dev, 2007
• Lipp,J.,EnergyPolicy,Lessonsforeffectiverenewableelectricitypolicyfrom Denmark, Germany and the United Kingdom, 2007
• Lohse,Ulf,DevelopmentsintheGermanPVsectortechnologyadvan-ces and cluster building, Eclareon GmbH, 2009
• Martinot,E.,andL.Junfeng,PoweringChina’sDevelopment:TheRoleof Renewable Energy, Worldwatch Institute, 2007
• NederlandsObservatoriumWetenschapenTechnologie,Wetenschaps-en Technologie Indicatoren Rapport 2008, 2008
• Nielsen,JensBuurgaardandDonaldPolsetal.,Investinginclimatechange: Dutch banks compared 2007, Profundo, 2007
• Nordbo,J.,TechnologyActionProgramsasawayforward,WWFGlobalClimate Policy Discussion paper, 2008
• NPC,SummaryofFinancialResultsfortheFiscalYearEndedAugust31st, 2010, October 2010
• NVP,Ondernemendvermogen2010• Odyssee/Mure,EnergyEfficiencyProfileNetherlands,2008• OECD/IEA,CO2emissionsfromfossilfuelcombustion–highlights,
2010• OECD/IEA,WorldEnergyOutlook2008,2008• OECD/IEA,WorldEnergyOutlook2009,2009• OECD/IEA,WorldEnergyOutlook2010,2010• OECD/IEA,IEAWind2004AnnualReport,2004• OECD,OECDCompendiumofPatentStatistics2008Pinxteren,H.,W.
Segeth, A. van Stel, Accenten in Funderend Energieonderzoek, Neder-landse Organisatie voor Wetenschappelijk Onderzoek, 2009
• PriceWaterHouseCoopers/Decisio,MonitoringpubliekgefinancierdEnergieonderzoek 2005-2009
• SER,Meerchemietussengroenengroei,2010• Stern,Nicholas.2006:TheSternReviewontheEconomicsofClimate
Change• Vaekstfonden,TheEnergyIndustryinDenmark–perspectivesonentre-
preneurship and venture capital, 2006• Watkiss,Paul,TomDowning,ClaireHandleyandRuthButterfield
(2005). The Impacts and Costs of Climate Change. Brussels, European Commission DG Environment.
• Watts,Jonathan,Chinamakesrenewablepowerplaytobeworld’sfirstgreen superpower, The Guardian, 2009

54 Clean Economy, Living Planet - The race to the top of the global cleantech market
• Wrobel,Paul,CleanEnergy:TheBrazilianEthanolexperience,2007:Embassy of Brazil, London
• Wüstenhagen,R.andM.Bilharz,GreenEnergyMarketDevelopmentin Germany, working paper, University of St. Gallen, 2004
• WWF/Ecofys,TheEnergyreport,2011

55 Clean Economy, Living Planet - The race to the top of the global cleantech market
Appendix C – Contributors
Expert committee
Gerard van Baar, Holland Financial CentreDaan Dijk, RabobankCharlie Droste, FMEHein Greven, EnecoChris Hellinga, TU DelftHarm Jeeninga, ECNKees van der KleinKees van der Leun, EcofysMeiny Prins, PrivaHans van der Spek, FMEJan Westra, Priva
Sounding Board
Johan van der Gronden, WWFArjan ten Elshof, EnecoDaniël Povel, TriodosJan Kamminga, FMEManon Janssen, EcofysDaan Dijk, Rabobank
Jury
Gerard van Baar, Holland Financial CentreWard van den Berg, Roland Berger Strategy ConsultantsDaan Dijk, RabobankCharlie Droste, FMEHein Greven, EnecoChris Hellinga, TU DelftKees Stap, EcofysDonald Pols, WWFMeiny Prins, PrivaSimon den Uijl, ECNJan Westra, Priva

56 Clean Economy, Living Planet - The race to the top of the global cleantech market

Contact information:
Roland Berger Strategy ConsultantsWorld Trade Center, Strawinskylaan 5811077 XX Amsterdam, The Netherlands
Telephone: +31 20 7960 600Internet: http://www.rolandberger.nl
© Roland Berger Strategy Consultants07/2011, all rights reservedwww.rolandberger.com
AmsterdamBahrainBarcelonaBeijingBerlinBrusselsBucharestBudapestCasablancaChicagoDetroitDüsseldorfFrankfurtHamburgHong KongIstanbulKyivLisbonLondonMadridMilanMoscowMunichNew YorkParisPragueRigaRomeSão PauloShanghaiStuttgartTokyoViennaWarsawZagrebZurich