Embed Size (px)
Citation preview
CDM-SSC-PDD (version 02) CDM – Executive Board page 1
CLEAN DEVELOPMENT MECHANISM
SIMPLIFIED PROJECT DESIGN DOCUMENT FOR SMALL-SCALE PROJECT ACTIVITIES (SSC-CDM-PDD)
Version 02
CONTENTS
A. General description of the small-scale project activity B. Baseline methodology C. Duration of the project activity / Crediting period D. Monitoring methodology and plan E. Calculation of GHG emission reductions by sources F. Environmental impacts G. Stakeholders comments Annexes Annex 1: Information on participants in the project activity Annex 2: Information regarding public funding
CDM-SSC-PDD (version 02) CDM – Executive Board page 2
Revision history of this document
Version Number
Date Description and reason of revision
01 21 January 2003
Initial adoption
02 8 July 2005 • The Board agreed to revise the CDM SSC PDD to reflect guidance and clarifications provided by the Board since version 01 of this document.
• As a consequence, the guidelines for completing CDM SSC PDD have been revised accordingly to version 2. The latest version can be found at <http://cdm.unfccc.int/Reference/Documents>.
CDM-SSC-PDD (version 02) CDM – Executive Board page 3 SECTION A. General description of the small-scale project activity A.1. Title of the small-scale project activity: >>
KPSL’s 8.0 Mw Biomass Based Power Project At Mahasamund, India Version 02, 25 July 06
A.2. Description of the small-scale project activity: >>
Kalindi Power & Steel Ltd. (KPSL) is private limited company, incorporated on 25/08/2004. The main objective of the company is to deal in power sector including generation of power using conventional or non-conventional fuel. The purpose of the project is to collect and utilize available, sustainably grown and un-utilized waste biomass resource effectively for generation of electricity. It is proposed to set-up a 8 MWH capacity power generating plant at Village Bendridih of District Mahasmund in Chhattisgarh State of India. The power generated will be sold to the Chhattisgarh State Electricity Board (CSEB) as per the agreed terms of the Power Purchase Agreement (PPA). Since the project envisages the collection & utilisation of local biomasses for power generation, it will not only supplement the current & planned electricity generation from traditional fossil fuels but also avoid methane emissions that would arise from the open burning or natural decay of the biomass predominantly rice husk. The project activity is located in a rural belt and will contribute positively to the ‘Sustainable Development of India’ by further strengthening four pillars of sustainable development: • Social well-being:
The location in a rural area will help in alleviating poverty to certain extent by generating both direct and indirect employment in the area of skilled/unskilled jobs for regular operation and maintenance of the power plant. The productive use of an agro waste will bring in associated economic and social benefits. The project will also help to bridge the gap of electricity demand and supply at local and national level.
• Economic well-being:
The increase in demand of rice husk exerted by the project will have local effect on its price and will generate additional revenue for the rice millers, which in turn will benefit the local farmers, as this is paddy-growing area. Generation of electricity using the same as fuel will contribute to the economic well being by generating revenue and inflow of funds. Local and central government will be financially benefited from the projects.
• Environmental well-being:
The project activity is a renewable energy power project, which will collect & use waste biomass generated in the local region as a fuel for power generation and export clean power to the CSEB grid. This electricity generation will either substitute or supplement the power generation by CSEB using conventional sources of energy (which also includes high carbon emissive fuel). Thus it will reduce the CO2 emissions which otherwise would have been emitted due to the generation of power by CSEB grid generation mix. The project activity also avoids methane
CDM-SSC-PDD (version 02) CDM – Executive Board page 4
emissions that would arise through the uncontrolled burning or natural decay of the biomass predominantly rice husk.
• Technological well-being:
The plant will use efficient and environment friendly technology of renewable energy sector. The technology is new though established. It includes a Fluidised Bed Combustion type boiler designed to operate with multi-fuel firing with biomass as major fuel.
A.3. Project participants: >>
Name of Party
Private and / or public entity (ies) project participants (as applicable)
Kindly indicate if the Party involved wishes to be considered as a project participant
India (host) Private entity: Kalindi Power & Steel Limited Public entity: Ministry of Environment and Forests
No
India (host) Private entity : S.R. Corporate Consultant (P) Ltd. Public entity: Ministry of Environment and Forests
No
A.4. Technical description of the small-scale project activity: >>
The project involves installation of 37 TPH BFBC Boiler with the outlet steam parameters of 67 Kg/cm2 & 495+5oC SH temperature and Multistage, impulse, nozzle governed bleed & extraction cum condensing type 8.0 MW capacity Turbo-Generator Set. The project will consume around 10% of the generation for auxiliary consumption and the rest will be exported to the CSEB’s grid (part of the Indian Western Grid.) at 33 kV through local substation. The proposed plant will consume approximately around 1.18 Metric Tones (MT) per hour of biomass per MW of power generation. The annual requirement of biomass predominantly rice husk is estimated at 74.54 thousand MT while the surplus availability of rice husk in the 50 Km range from the proposed plant site is assessed at 262 thousand MT. The project will help to reduce the ever-increasing demand and supply gap of electricity besides contributing towards economic growth and development of the area. The project activity is expected to be commissioned by January 2007.
A.4.1. Location of the small-scale project activity: >> A.4.1.1. Host Party(ies): >>
India
CDM-SSC-PDD (version 02) CDM – Executive Board page 5 A.4.1.2. Region/State/Province etc.: >>
Chhattisgarh State, Mahasmund District, A.4.1.3. City/Town/Community etc: >>
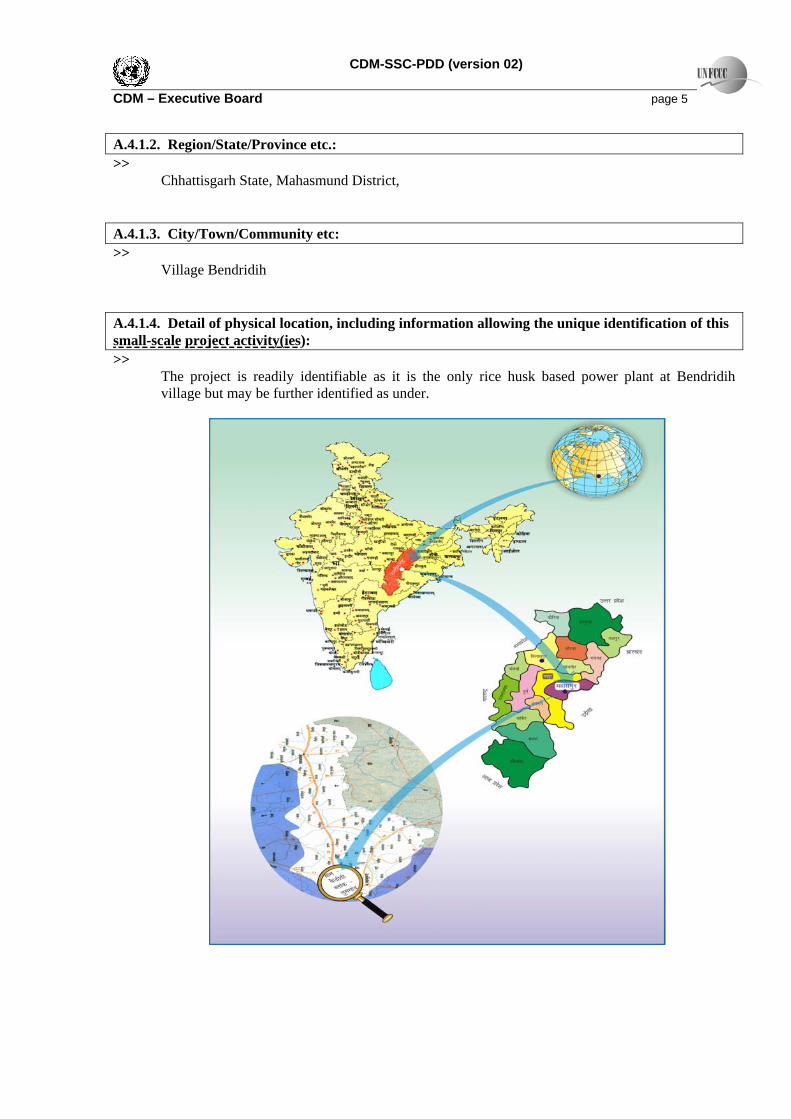
Village Bendridih A.4.1.4. Detail of physical location, including information allowing the unique identification of this small-scale project activity(ies): >>
The project is readily identifiable as it is the only rice husk based power plant at Bendridih village but may be further identified as under.
CDM-SSC-PDD (version 02) CDM – Executive Board page 6 A.4.2. Type and category(ies) and technology of the small-scale project activity: >> The project falls under the UNFCCC small-scale CDM project activity categories under Type-I with project activity being renewable electricity generation for a system. Type I - Renewable Energy Projects ID - Grid Connected Renewable Electricity Generation Clause 24 of Appendix B of the UNFCCC document states that the simplified modalities and procedures are applicable to small-scale CDM project activities. A unit which co-fires renewable biomass [biomass] and non-renewable fossil fuel [coal] whose capacity does not exceed 15 MW qualifies as a small-scale CDM project therefore this project qualifies as a small scale CDM project under Type I.D. The project will produce renewable energy from the combustion of rice husk. It falls within the small scale rating as the total generation capacity of the plant is 8.0 MW, i.e. below the 15 MW outlined in section ID of Appendix B of the simplified modalities and procedures for small-scale CDM project activities. Further the project will export the entire power after meeting its auxiliary consumption to the state grid. That means the electricity supplied from the project activity to the grid would be expected to replace existing and planned generation from the grid, the majority of which is fossil fuel based. • Project Activity with technology details The project participants have identified the scope for utilization of biomass. The biomass gives thermal energy with zero net carbon dioxide emission on account of sequestration i.e. the CO2 emitted during combustion of biomass is much less than the CO2 absorbed by the plants during growth. Hence, the net CO2 emission due to burning of biomass for power generation is zero. The project needs around 1.18 tons of biomass per hour per MW of power generation, which includes mixture of woody biomass, rice husk, sugar cane trash, wood chips etc., as per availability. Average calorific value of the biomass is around 3,250 Kcal/Kg. One 37 TPH, 67 kg/cm2, 495+50C high pressure boiler and a condensing steam turbine (with single bleed for feed water heating) cum generator (STG) set of 8.0 MW capacity is proposed with required balance of plant equipments. The 37 TPH of steam from boiler will be fed to the 8.0 MW bleed & extraction cum condensing turbine. The turbine will be a single cylinder, single exhaust fully condensing type, designed for high operating efficiencies and maximum reliability. The boiler is of Bubbling Fluidised Bed Combustion (BFBC) type with high thermal and combustion efficiency, reducing quantity of biomass needed, to a minimum, automatic operation for consistent high efficiencies and reduced need for manpower. The plant is designed with all other auxiliary plant systems like Biomass handling system with storage and processing arrangements, Ash handling system Air pollution control devices Plant water system including DM water plant, cooling water system make-up, plant/service
water system etc. Cooling water system and cooling tower De-Mineralised (DM) water plant Compressed air system
CDM-SSC-PDD (version 02) CDM – Executive Board page 7 Fire protection system Air conditioning and ventilation Complete electrical system for power plant and grid interconnection including power
evacuation, instrumentation and control systems etc. A.4.3. Brief explanation of how the anthropogenic emissions of anthropogenic greenhouse gas (GHGs) by sources are to be reduced by the proposed small-scale project activity, including why the emission reductions would not occur in the absence of the proposed small-scale project activity, taking into account national and/or sectoral policies and circumstances: >> The emission reductions from the project will arise two routes; the direct substitution of existing grid based generation capacity and planned expansions to the grid and the avoidance of methane from the decay of biomass. Grid based generation in Chhattisgarh is comprised of coal and hydro based generation, in Chhattisgarh 91% of generation capacity is coal based and in the Western region as a whole 78% of generation capacity is thermal based.1 Chhattisgarh Renewable Energy Development Authority (CREDA) is the licensing authority responsible for promotion of non-conventional & renewable sources in the state. According to a study undertaken by them states that the power generation potential from utilisation of rice husk as fuel is assessed at 180 MW2. A study of the rice husk available within the local area arrived at rice husk generation of 262 thousand MT per annum. The plant is expected to consume 69,000 tonnes of rice husk once it has stabilized. Within the study area there are also a number of other types of biomass available – crop residues, fuel wood and bushes – that account for a further supply of 407,087 tonnes of biomass per annum as shown in the following table.
Table 1 - Biomass Generation, Consumption & Surplus
Sl. No.
Biomass From Generation in Qty. in MTPA
Consumption in Qty. in MTPA
Surplus in Qty. in MTPA
1 Crop Residue 1024698.00 926957.04 97740.96 2 Fuel Wood 910100.00 628059.00 282041.00 3 Bushes 54612.00 27306.00 27306.00 4 Industries (Rice Husk) 345882.00 83391.00 262491.00
Total 2335292.00 1665713.04 669578.96
Assuming that the annual requirement for 1 MW of power generation is 10,337 tonnes of rice husk this results in a potential power generation capacity of 25 MW in the study area comprising an area within 50 km range from the block headquarters. At present there is no plant existing in the study area. One plant of capacity 10 MW is expected to commission by September 2006. Apart from this there are no other planned power plants that will draw on the surplus rice husk. It may therefore be concluded that there is substantial surplus of rice husk, which may be combusted in the boiler.
1 http://www.cseb-powerhub.com/8.1_installed_GC.htm 2 Western Region Annual Report 2004-05
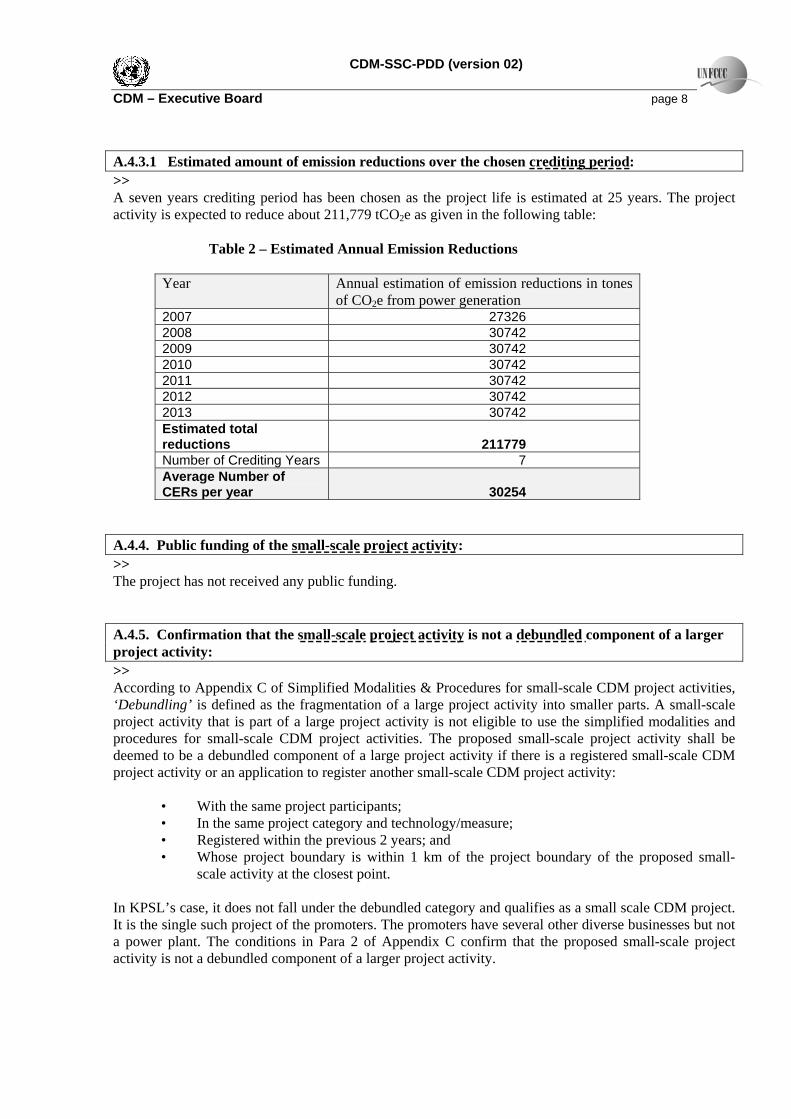
CDM-SSC-PDD (version 02) CDM – Executive Board page 8 A.4.3.1 Estimated amount of emission reductions over the chosen crediting period: >> A seven years crediting period has been chosen as the project life is estimated at 25 years. The project activity is expected to reduce about 211,779 tCO2e as given in the following table:
Table 2 – Estimated Annual Emission Reductions
Year Annual estimation of emission reductions in tones
of CO2e from power generation 2007 27326 2008 30742 2009 30742 2010 30742 2011 30742 2012 30742 2013 30742 Estimated total reductions 211779 Number of Crediting Years 7 Average Number of CERs per year 30254
A.4.4. Public funding of the small-scale project activity: >> The project has not received any public funding. A.4.5. Confirmation that the small-scale project activity is not a debundled component of a larger project activity: >> According to Appendix C of Simplified Modalities & Procedures for small-scale CDM project activities, ‘Debundling’ is defined as the fragmentation of a large project activity into smaller parts. A small-scale project activity that is part of a large project activity is not eligible to use the simplified modalities and procedures for small-scale CDM project activities. The proposed small-scale project activity shall be deemed to be a debundled component of a large project activity if there is a registered small-scale CDM project activity or an application to register another small-scale CDM project activity:
• With the same project participants; • In the same project category and technology/measure; • Registered within the previous 2 years; and • Whose project boundary is within 1 km of the project boundary of the proposed small-
scale activity at the closest point. In KPSL’s case, it does not fall under the debundled category and qualifies as a small scale CDM project. It is the single such project of the promoters. The promoters have several other diverse businesses but not a power plant. The conditions in Para 2 of Appendix C confirm that the proposed small-scale project activity is not a debundled component of a larger project activity.
CDM-SSC-PDD (version 02) CDM – Executive Board page 9 SECTION B. Application of a baseline methodology: B.1. Title and reference of the approved baseline methodology applied to the small-scale project activity: >> Type I – Renewable Energy Projects I D – Grid connected renewable electricity generation B.2 Project category applicable to the small-scale project activity: >> Project Category: I.D. Renewable Energy technologies that suppliers electricity to the grid Renewable technologies that supply electricity to the grid are covered in category I.D. specified in Document “Indicative Simplified baseline & monitoring methodologies for selected small-scale CDM project activity categories, I.D./Version 08 Scope 1 dated 3rd march 2006. The category comprises renewable such as hydro, wind, geothermal and biomass that supply electricity to an electricity distribution system that is or would have been supplied by at least one fossil fuel or non-renewable biomass fired generation unit. The KPSL project will be feeding power to the Western Regional Electricity Grid (WREB). The power generation mix of the WREB comprises of coal based, gas based power generation and hydro, nuclear & RES projects. The major share belongs to the thermal power plants based on coal & gas.
The project activity has a capacity to produce 8 MWh. As per Ministry of Non-Conventional Energy Sources (MNES) - Power Group guidelines, use of fossil fuel up to 20% is allowed in biomass power generation as support fuel in case of exigencies in a year. Hence this project may use coal to the extent of 20%. The project category also meets the eligibility limit of 15 MW. B.3. Description of how the anthropogenic emissions of GHG by sources are reduced below those that would have occurred in the absence of the registered small-scale CDM project activity: >> As per the decision 17/cp.7 Para 43, a CDM project activity is additional if anthropogenic emissions of greenhouse gases by sources are reduced below those that would have occurred in the absence of the registered CDM project activity. This project activity is a renewable energy projects with net zero CO2 emission due to the carbon sequestration. Plants, which are sources of biomass, are re-grown at the same rate as it is being harvested, act as a sink for atmospheric carbon dioxide and the net flux of CO2 to the atmosphere is zero. The power generated by the project activity will replace or supplement the grid power and an analysis of the State grid generation mix gives the conservative baseline CO2 emission factor of 0.865 kgCO2e/kWh for the credit period. Therefore the project activity will reduce the anthropogenic emissions of greenhouse gases by sources below those that would have occurred in absence of the registered CDM project activity. In line with attachment A to appendix B of the simplified M&P for small-scale CDM project activities. Demonstration of additionality focuses on the barriers facing the project-technological barriers, investment barriers and a brief analysis of prevailing practice in the state. In showing that the project is additional we demonstrate that it is not part of the baseline scenario, which in the case of the KPSL is that
CDM-SSC-PDD (version 02) CDM – Executive Board page 10 the grid continues to operate and expand based on predominantly fossil fuel generation and that the rice husk remains uncollected and decays naturally. The main risk to the operation of the plant is the supply of rice husk. The majority of paddy in Chhattisgarh is grown under rain-fed rather than irrigated conditions. The yields of paddy are therefore weather related and there is a high production risk associated with the crop. Added risks on the availability of paddy and hence rice husk revolve around the policy of the state government-Paddy is a heavily regulated crop with about 75% being procured by the state, the remaining paddy is purchased through “Krishi Upaj Mandi” (local agricultural markets) . The government policy has, till date, been to mill the paddy within the state and the “mandies” are not permitted to sell paddy outside the state. Any reversal in this policy would impact the milling of paddy and hence the availability of rice husk within the state. This is crucial as the milling of paddy outside the state will increase price of rice husk as this is primarily a function of the transport cost. Whilst these factors pose a risk to the project in relation to the likely plant load factor and hence returns there is also a more serious risk inherent in the Power Purchase Agreement (PPA). There is currently uncertainty surrounding the received price in the power purchase agreement. Whilst there is a Ministry of Non-conventional Energy Source advised tariff, this is not applied in Chhattisgarh and the project has received a signed PPA with a price of Rs. 2.25/kWh. However the Chhattisgarh State Electricity Regulatory Commission (CSERC) has issued a tariff order for biomass-based plants based on a two-part tariff that equates to Rs 2.67/kWh in the first year of operation and wheeling of power to any HT consumer in the state at 6% as against the erstwhile rate of 3%. Further it was mandatory on part of the state electricity board (CSEB) to purchase the power remaining unsold at a fixed rate of Rs. 2.25 per unit. Now it is not been mandatory. The project proponent has to either sell the power to any third party or sell it to CSEB. Initially the project is designed on the basis of third party sale but in the current scenario, they have left with no option other than selling the power to CSEB at fixed lower tariff effecting the IRR adversely. Apart from this usually there has been instability in the renewable energy tariff issued by the state electricity boards across India and this poses a serious risk to the viability to the project. Further in view of clause15 of the Tariff Order, there will be a reduction of between 32 to 47% in the tariff if the supplier delivers less that 70% or more than 105% of the scheduled energy. The PPA price is therefore not assured for all electricity delivered and low generation will not only impact the returns through a low PLF but also through a reduction in the PPA price. Likewise if the project owner sells electricity volumes conservatively any generation in excess of 105% of the scheduled energy will attract the reduced tariff. In summary the terms of the PPA present a number of risks to the project and the CER revenue will act as a financial buffer that can alleviate the impact of these risks. All assumptions inherent in the financial analysis will be made available to the validator but the following is a summary of the main points and results, which demonstrate the importance of CER revenue. We have worked on the new PPA price of Rs 2.79/kWh as issued by the CSERC. The revenue streams associated with the project are the sale of electricity to the grid and the CERs resulting from registering the project as a CDM. The costs revolve around the use of rice husk and coal as a fuel (the latter which we assume will be burnt during the permissible period under the PPA), which are Rs 900/- per MT and Rs1200/- per MT respectively. We have also included costs for operation and maintenance, personal employed at the site, stores and spares. Analyzing the project IRR in the light of these revenues and costs we arrive at a project IRR of 8.25% without CER Revenues and 14.12% when the expected CER revenue is included. The effect is demonstrated in the table given below:
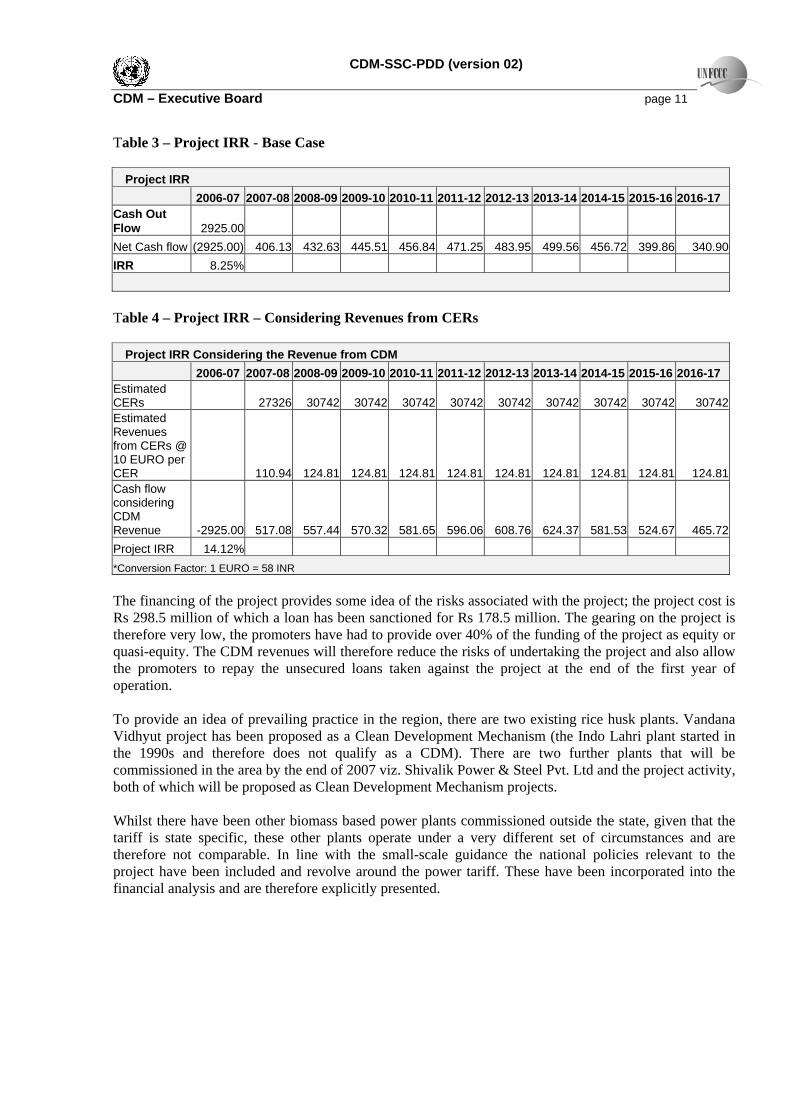
CDM-SSC-PDD (version 02) CDM – Executive Board page 11 Table 3 – Project IRR - Base Case
Project IRR 2006-07 2007-08 2008-09 2009-10 2010-11 2011-12 2012-13 2013-14 2014-15 2015-16 2016-17 Cash Out Flow 2925.00 Net Cash flow (2925.00) 406.13 432.63 445.51 456.84 471.25 483.95 499.56 456.72 399.86 340.90 IRR 8.25%
Table 4 – Project IRR – Considering Revenues from CERs
Project IRR Considering the Revenue from CDM 2006-07 2007-08 2008-09 2009-10 2010-11 2011-12 2012-13 2013-14 2014-15 2015-16 2016-17 Estimated CERs 27326 30742 30742 30742 30742 30742 30742 30742 30742 30742Estimated Revenues from CERs @ 10 EURO per CER 110.94 124.81 124.81 124.81 124.81 124.81 124.81 124.81 124.81 124.81Cash flow considering CDM Revenue -2925.00 517.08 557.44 570.32 581.65 596.06 608.76 624.37 581.53 524.67 465.72Project IRR 14.12% *Conversion Factor: 1 EURO = 58 INR The financing of the project provides some idea of the risks associated with the project; the project cost is Rs 298.5 million of which a loan has been sanctioned for Rs 178.5 million. The gearing on the project is therefore very low, the promoters have had to provide over 40% of the funding of the project as equity or quasi-equity. The CDM revenues will therefore reduce the risks of undertaking the project and also allow the promoters to repay the unsecured loans taken against the project at the end of the first year of operation.
To provide an idea of prevailing practice in the region, there are two existing rice husk plants. Vandana Vidhyut project has been proposed as a Clean Development Mechanism (the Indo Lahri plant started in the 1990s and therefore does not qualify as a CDM). There are two further plants that will be commissioned in the area by the end of 2007 viz. Shivalik Power & Steel Pvt. Ltd and the project activity, both of which will be proposed as Clean Development Mechanism projects. Whilst there have been other biomass based power plants commissioned outside the state, given that the tariff is state specific, these other plants operate under a very different set of circumstances and are therefore not comparable. In line with the small-scale guidance the national policies relevant to the project have been included and revolve around the power tariff. These have been incorporated into the financial analysis and are therefore explicitly presented.
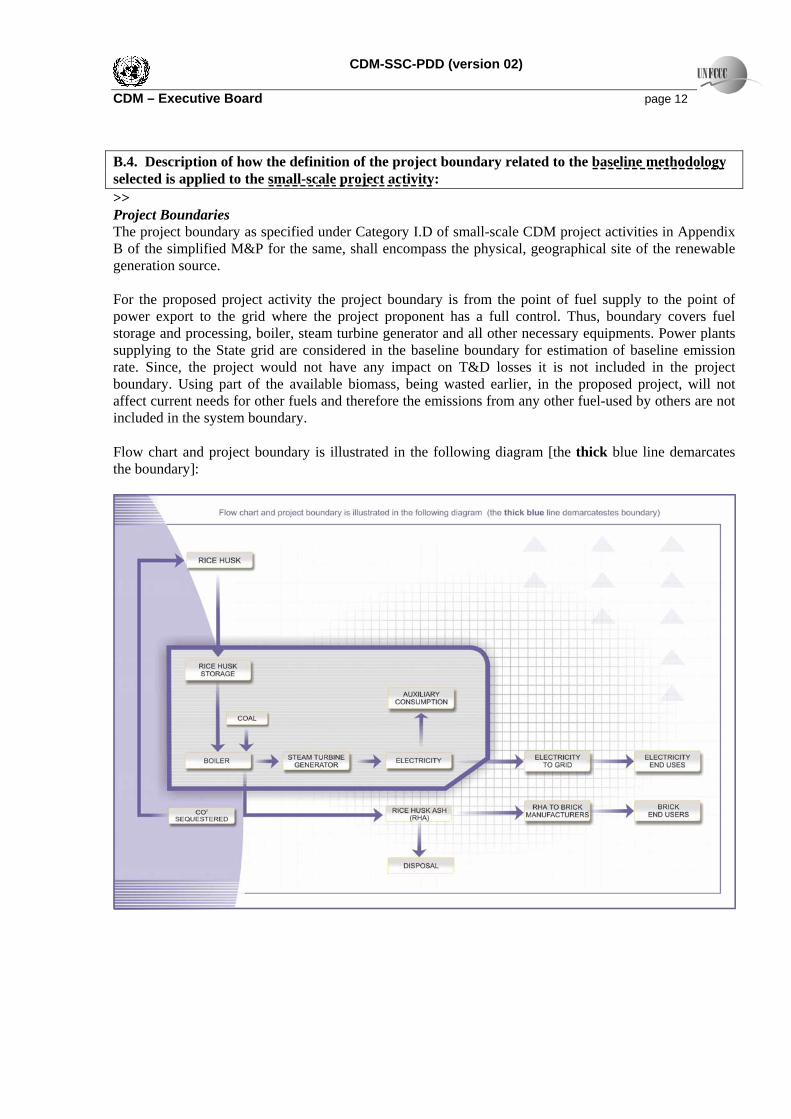
CDM-SSC-PDD (version 02) CDM – Executive Board page 12 B.4. Description of how the definition of the project boundary related to the baseline methodology selected is applied to the small-scale project activity: >> Project Boundaries The project boundary as specified under Category I.D of small-scale CDM project activities in Appendix B of the simplified M&P for the same, shall encompass the physical, geographical site of the renewable generation source. For the proposed project activity the project boundary is from the point of fuel supply to the point of power export to the grid where the project proponent has a full control. Thus, boundary covers fuel storage and processing, boiler, steam turbine generator and all other necessary equipments. Power plants supplying to the State grid are considered in the baseline boundary for estimation of baseline emission rate. Since, the project would not have any impact on T&D losses it is not included in the project boundary. Using part of the available biomass, being wasted earlier, in the proposed project, will not affect current needs for other fuels and therefore the emissions from any other fuel-used by others are not included in the system boundary. Flow chart and project boundary is illustrated in the following diagram [the thick blue line demarcates the boundary]:
CDM-SSC-PDD (version 02) CDM – Executive Board page 13 B.5. Details of the baseline and its development: >> The baseline methodology has followed the one specified in the Project Category I.D. in Para 29 of the Appendix B of the Simplified M&P for small scale CDM project activities. The net emission factor was found to be 0.865 kgCO2equ/kWh. For the project activity the base line scenario was determined as equivalent electricity generation from the grid as shown B2 earlier. Baseline methodology for projects under Type I. D has been detailed in point no. 9 of the referred document. It states that the baseline is the kWh produced by the renewable generating unit multiplied by an emission coefficient (measured in kgCO2 equ/kWh) calculated as under: a) The average of the “approximate operating margin” and the “build margin”, where,
i) The “approximate operating margin” is the weighted average emissions (in kgCO2 equ/kWh) of all generating sources serving the system, excluding hydro, geothermal, wind, low-cost biomass, nuclear and solar generation; ii) The “build margin” is the weighted average emissions (in kgCO2 equ/kWh) of recent capacity additions to the system, based on the most recent information available on plants built for sample m at the time of PDD submission. The sample group m consists of the five power plants that have been built most recently or the power plant capacity additions in the electricity system that comprises 20% of the system generation (in MWh) and that have been built most recently. The larger annual generation from either sample should be chosen for calculation of build margin.
OR b) The weighted average emissions (in kgCO2 equ/kWh) of current generation mix. For calculating the approximate operating margin factor, a 3 years average and for Build margin emission factor the most recent capacity additions based on the most recent statistics available at the time of submission of PDD has been chosen. Choice of the grid that will be affected by the project activity In India, power is a current subject between the state and the central governments therefore there are state utilities and central utilities. The electricity system in India is divided into five regions – Northern, Eastern, Western, Southern, and North-Eastern Electricity Boards. The Management of generation and supply of power within the regional grid is undertaken by the Load Dispatch Centers (LDC). Different states within the regional grids meet the demand from their own generation facilities plus generation by power plants owned by the central sector i.e., National Thermal Power Corporation (NTPC) and National Hydro Power Corporation (NHPC) etc. specific quota is allocated to different states from the central sector power plants. Depending on the demand and generation there are exports and imports of power within different states in the regional grid minimizes the effect of inter state power transactions which are dynamic and vary widely. The regional grids have minimal interchange of electricity between themselves therefore a regional grid can be safely considered as the relevant electricity grid rather than going for the state grid. National grid has not been chosen due to infrastructure and low inter-regional energy exchanges.
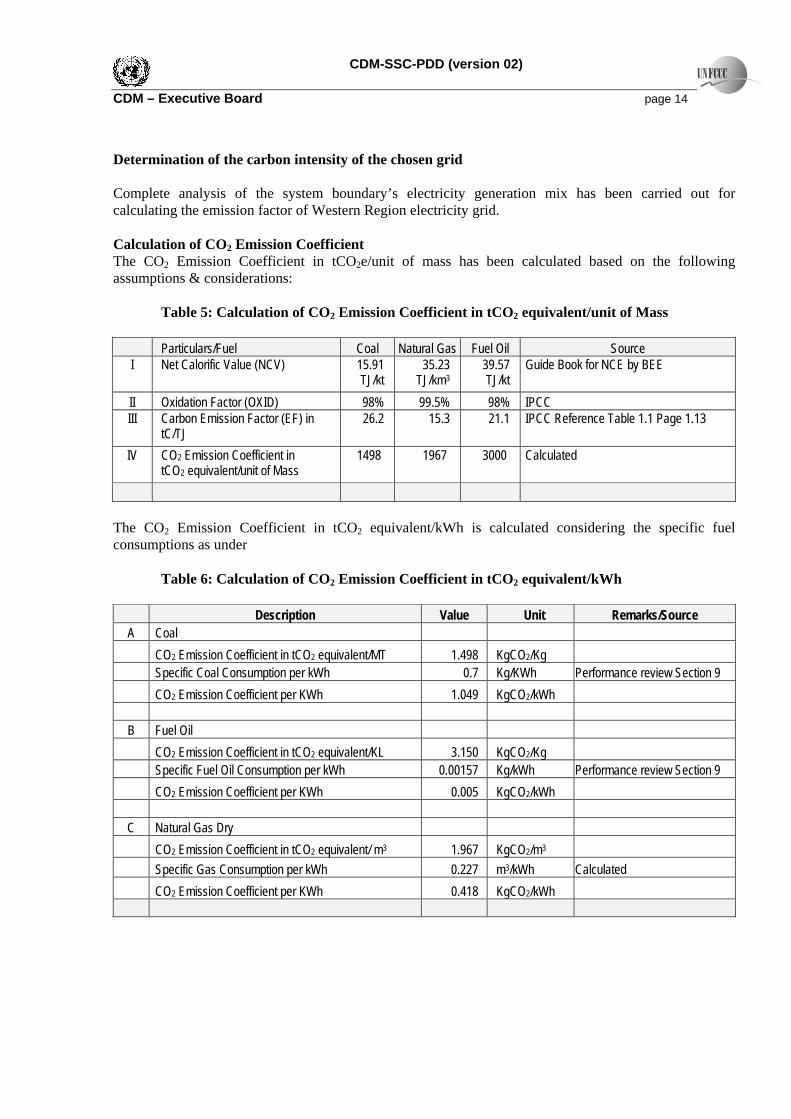
CDM-SSC-PDD (version 02) CDM – Executive Board page 14 Determination of the carbon intensity of the chosen grid Complete analysis of the system boundary’s electricity generation mix has been carried out for calculating the emission factor of Western Region electricity grid. Calculation of CO2 Emission Coefficient The CO2 Emission Coefficient in tCO2e/unit of mass has been calculated based on the following assumptions & considerations:
Table 5: Calculation of CO2 Emission Coefficient in tCO2 equivalent/unit of Mass
Particulars/Fuel Coal Natural Gas Fuel Oil Source I
Net Calorific Value (NCV)
15.91 TJ/kt
35.23 TJ/km3
39.57 TJ/kt
Guide Book for NCE by BEE
II Oxidation Factor (OXID) 98% 99.5% 98% IPCC III
Carbon Emission Factor (EF) in tC/TJ
26.2
15.3
21.1
IPCC Reference Table 1.1 Page 1.13
IV CO2 Emission Coefficient in tCO2 equivalent/unit of Mass
1498 1967 3000 Calculated
The CO2 Emission Coefficient in tCO2 equivalent/kWh is calculated considering the specific fuel consumptions as under
Table 6: Calculation of CO2 Emission Coefficient in tCO2 equivalent/kWh
Description Value Unit Remarks/Source
A Coal CO2 Emission Coefficient in tCO2 equivalent/MT 1.498 KgCO2/Kg Specific Coal Consumption per kWh 0.7 Kg/KWh Performance review Section 9 CO2 Emission Coefficient per KWh 1.049 KgCO2/kWh
B Fuel Oil CO2 Emission Coefficient in tCO2 equivalent/KL 3.150 KgCO2/Kg Specific Fuel Oil Consumption per kWh 0.00157 Kg/kWh Performance review Section 9 CO2 Emission Coefficient per KWh 0.005 KgCO2/kWh
C Natural Gas Dry CO2 Emission Coefficient in tCO2 equivalent/ m3 1.967 KgCO2/m3 Specific Gas Consumption per kWh 0.227 m3/kWh Calculated CO2 Emission Coefficient per KWh 0.418 KgCO2/kWh
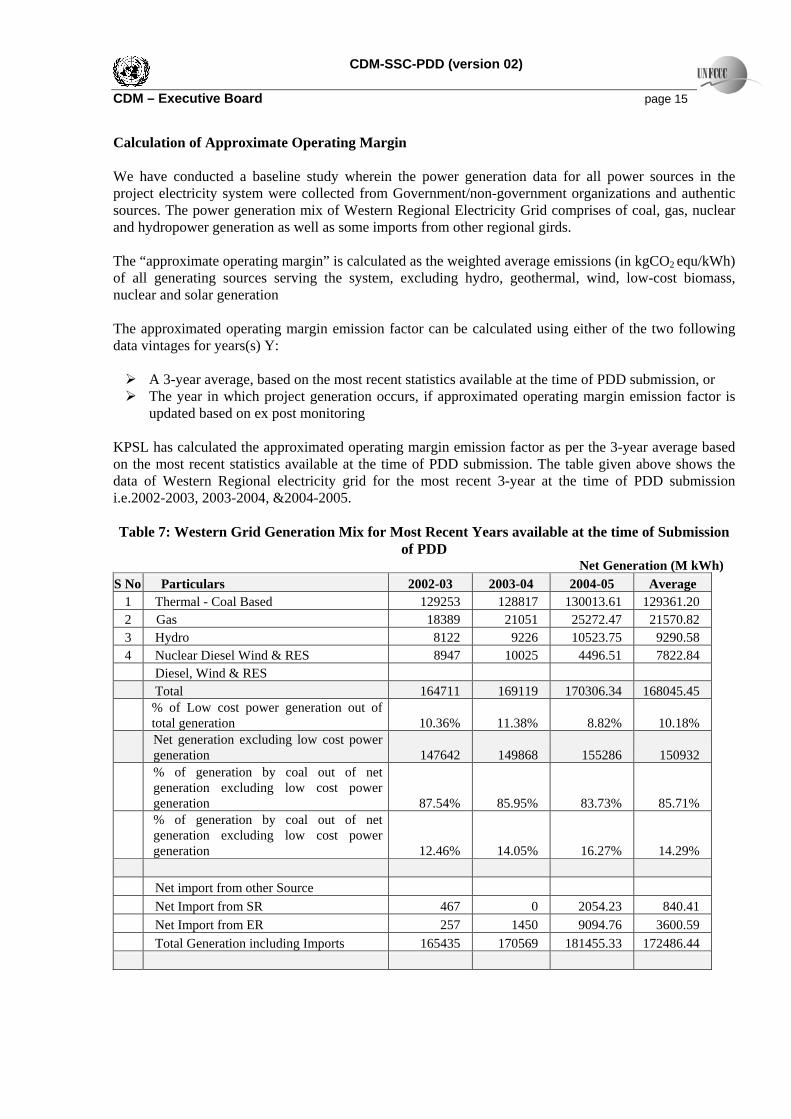
CDM-SSC-PDD (version 02) CDM – Executive Board page 15 Calculation of Approximate Operating Margin We have conducted a baseline study wherein the power generation data for all power sources in the project electricity system were collected from Government/non-government organizations and authentic sources. The power generation mix of Western Regional Electricity Grid comprises of coal, gas, nuclear and hydropower generation as well as some imports from other regional girds. The “approximate operating margin” is calculated as the weighted average emissions (in kgCO2 equ/kWh) of all generating sources serving the system, excluding hydro, geothermal, wind, low-cost biomass, nuclear and solar generation The approximated operating margin emission factor can be calculated using either of the two following data vintages for years(s) Y: A 3-year average, based on the most recent statistics available at the time of PDD submission, or The year in which project generation occurs, if approximated operating margin emission factor is
updated based on ex post monitoring KPSL has calculated the approximated operating margin emission factor as per the 3-year average based on the most recent statistics available at the time of PDD submission. The table given above shows the data of Western Regional electricity grid for the most recent 3-year at the time of PDD submission i.e.2002-2003, 2003-2004, &2004-2005. Table 7: Western Grid Generation Mix for Most Recent Years available at the time of Submission
of PDD Net Generation (M kWh)
S No Particulars 2002-03 2003-04 2004-05 Average 1 Thermal - Coal Based 129253 128817 130013.61 129361.20 2 Gas 18389 21051 25272.47 21570.82 3 Hydro 8122 9226 10523.75 9290.58 4 Nuclear Diesel Wind & RES 8947 10025 4496.51 7822.84 Diesel, Wind & RES Total 164711 169119 170306.34 168045.45
% of Low cost power generation out of total generation 10.36% 11.38% 8.82% 10.18%
Net generation excluding low cost power generation 147642 149868 155286 150932
% of generation by coal out of net generation excluding low cost power generation 87.54% 85.95% 83.73% 85.71%
% of generation by coal out of net generation excluding low cost power generation 12.46% 14.05% 16.27% 14.29%
Net import from other Source Net Import from SR 467 0 2054.23 840.41 Net Import from ER 257 1450 9094.76 3600.59 Total Generation including Imports 165435 170569 181455.33 172486.44
CDM-SSC-PDD (version 02) CDM – Executive Board page 16
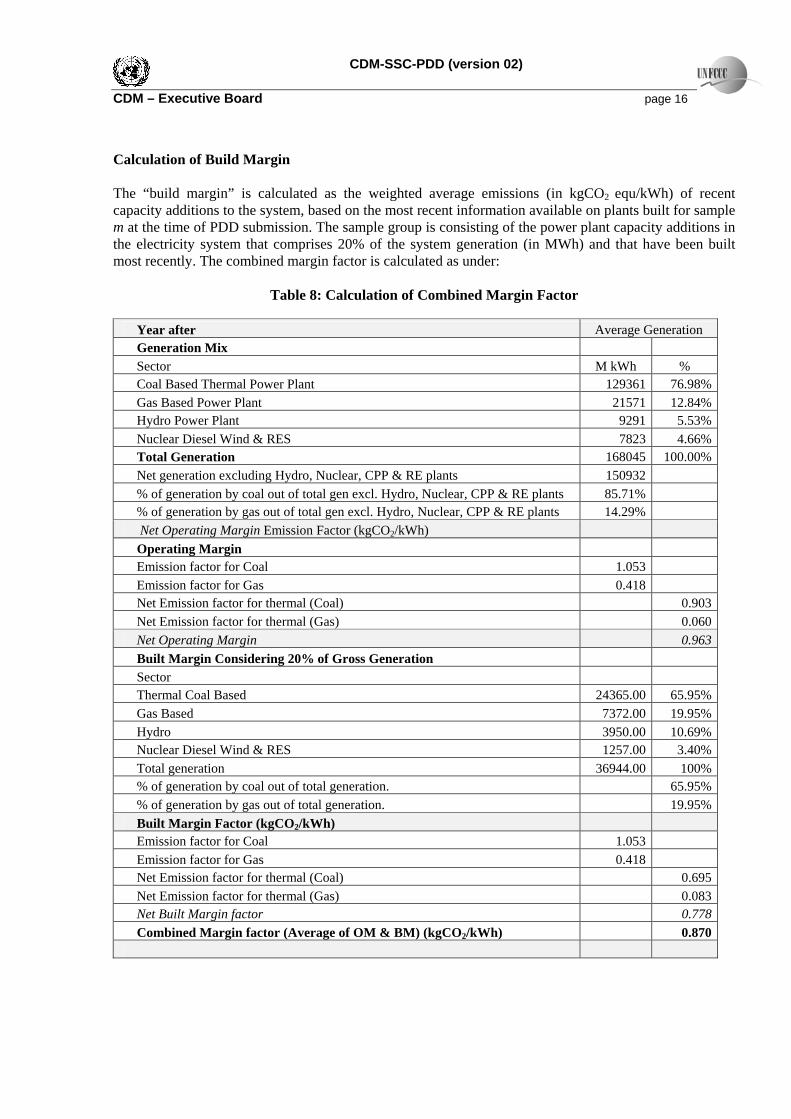
Calculation of Build Margin The “build margin” is calculated as the weighted average emissions (in kgCO2 equ/kWh) of recent capacity additions to the system, based on the most recent information available on plants built for sample m at the time of PDD submission. The sample group is consisting of the power plant capacity additions in the electricity system that comprises 20% of the system generation (in MWh) and that have been built most recently. The combined margin factor is calculated as under:
Table 8: Calculation of Combined Margin Factor
Year after Average Generation Generation Mix Sector M kWh % Coal Based Thermal Power Plant 129361 76.98%Gas Based Power Plant 21571 12.84%Hydro Power Plant 9291 5.53%Nuclear Diesel Wind & RES 7823 4.66%Total Generation 168045 100.00%Net generation excluding Hydro, Nuclear, CPP & RE plants 150932 % of generation by coal out of total gen excl. Hydro, Nuclear, CPP & RE plants 85.71% % of generation by gas out of total gen excl. Hydro, Nuclear, CPP & RE plants 14.29% Net Operating Margin Emission Factor (kgCO2/kWh) Operating Margin Emission factor for Coal 1.053 Emission factor for Gas 0.418 Net Emission factor for thermal (Coal) 0.903 Net Emission factor for thermal (Gas) 0.060 Net Operating Margin 0.963 Built Margin Considering 20% of Gross Generation Sector Thermal Coal Based 24365.00 65.95%Gas Based 7372.00 19.95%Hydro 3950.00 10.69%Nuclear Diesel Wind & RES 1257.00 3.40%Total generation 36944.00 100%% of generation by coal out of total generation. 65.95%% of generation by gas out of total generation. 19.95%Built Margin Factor (kgCO2/kWh) Emission factor for Coal 1.053 Emission factor for Gas 0.418 Net Emission factor for thermal (Coal) 0.695 Net Emission factor for thermal (Gas) 0.083 Net Built Margin factor 0.778 Combined Margin factor (Average of OM & BM) (kgCO2/kWh) 0.870
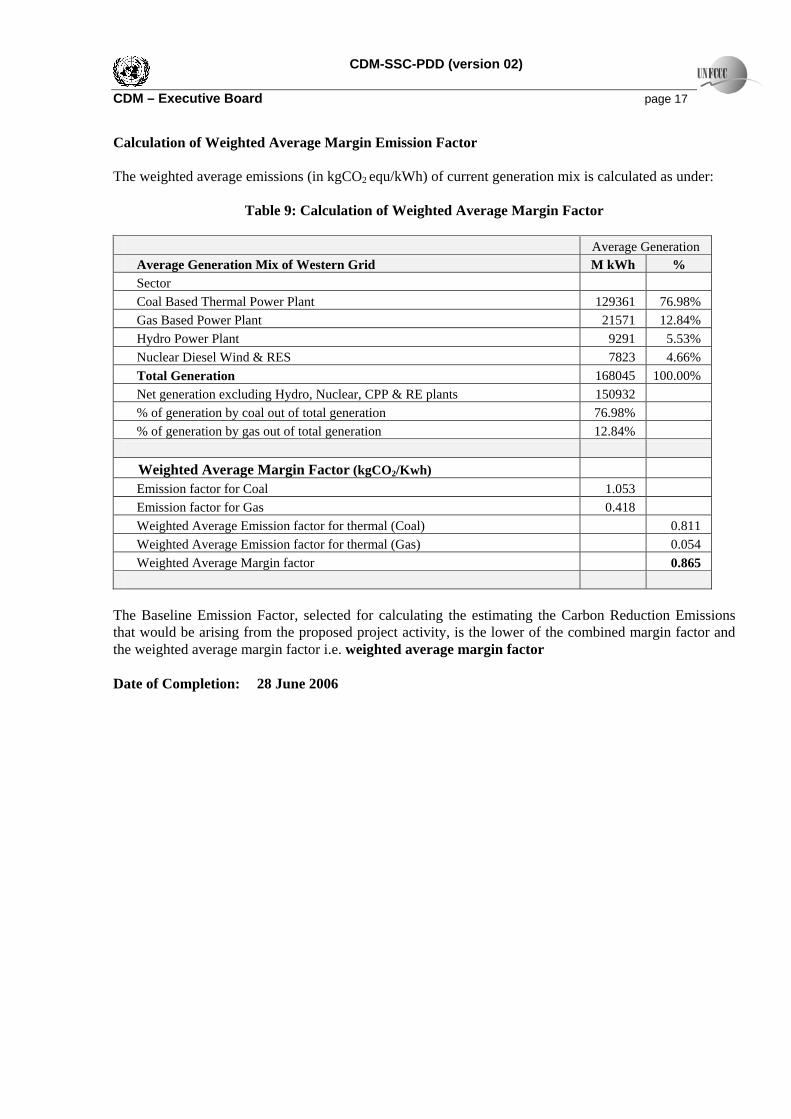
CDM-SSC-PDD (version 02) CDM – Executive Board page 17 Calculation of Weighted Average Margin Emission Factor The weighted average emissions (in kgCO2 equ/kWh) of current generation mix is calculated as under:
Table 9: Calculation of Weighted Average Margin Factor
Average Generation Average Generation Mix of Western Grid M kWh % Sector Coal Based Thermal Power Plant 129361 76.98% Gas Based Power Plant 21571 12.84% Hydro Power Plant 9291 5.53% Nuclear Diesel Wind & RES 7823 4.66% Total Generation 168045 100.00% Net generation excluding Hydro, Nuclear, CPP & RE plants 150932 % of generation by coal out of total generation 76.98% % of generation by gas out of total generation 12.84% Weighted Average Margin Factor (kgCO2/Kwh) Emission factor for Coal 1.053 Emission factor for Gas 0.418 Weighted Average Emission factor for thermal (Coal) 0.811 Weighted Average Emission factor for thermal (Gas) 0.054 Weighted Average Margin factor 0.865
The Baseline Emission Factor, selected for calculating the estimating the Carbon Reduction Emissions that would be arising from the proposed project activity, is the lower of the combined margin factor and the weighted average margin factor i.e. weighted average margin factor Date of Completion: 28 June 2006
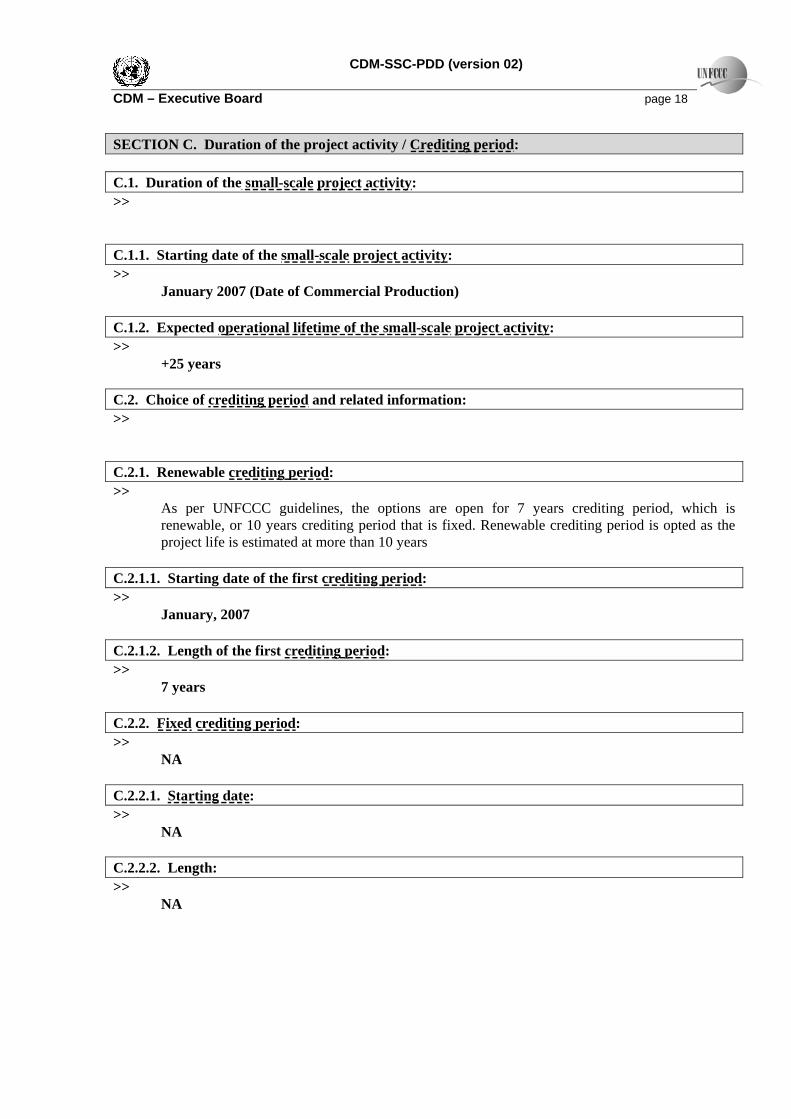
CDM-SSC-PDD (version 02) CDM – Executive Board page 18 SECTION C. Duration of the project activity / Crediting period: C.1. Duration of the small-scale project activity: >> C.1.1. Starting date of the small-scale project activity: >> January 2007 (Date of Commercial Production) C.1.2. Expected operational lifetime of the small-scale project activity: >> +25 years C.2. Choice of crediting period and related information: >> C.2.1. Renewable crediting period: >> As per UNFCCC guidelines, the options are open for 7 years crediting period, which is
renewable, or 10 years crediting period that is fixed. Renewable crediting period is opted as the project life is estimated at more than 10 years
C.2.1.1. Starting date of the first crediting period: >> January, 2007 C.2.1.2. Length of the first crediting period: >> 7 years C.2.2. Fixed crediting period: >>
NA C.2.2.1. Starting date: >> NA C.2.2.2. Length: >> NA
CDM-SSC-PDD (version 02) CDM – Executive Board page 19 SECTION D. Application of a monitoring methodology and plan: >> D.1. Name and reference of approved monitoring methodology applied to the small-scale project activity: >>
Title: Renewable electricity generation for a grid Reference: “Appendix B of the simplified modalities and procedure for small scale CDM
project activities”. Version 8 According to Appendix B of the simplified M&P for small-scale CDM project activities of the UNFCCC CDM website, the project has been identified to belong to Type I.D [renewable electricity generation for a grid]. Point 13 of the same document specifies that for the said category of CDM project, ‘Monitoring shall consist of metering the electricity generated by the renewable technology. In the case of co-fired plants, the amount of biomass input and its energy content shall be monitored’.
D.2. Justification of the choice of the methodology and why it is applicable to the small-scale project activity: >>
The project activity meets the eligibility criteria to use simplified modalities and procedure for small-scale CDM project activities as set out in paragraph 6 (c) of decision 17/CP.7. Details of approved methodology for baseline calculations for CDM projects of capacity less than 15 MW is available in the “Appendix B of the simplified modalities and procedure for small scale CDM project activities”. As the power plant is of 8 MW capacities, reference has been taken from indicative simplified baseline and monitoring methodologies for selected small scale (CDM projects less than 15 MW) project activity categories.
Since the project is a grid connected renewable energy project, emission reduction quantity depends on the units of energy exported to the grid (in kWh) and the baseline emission of the state grid. The methodology covers the monitoring of units exported and the other parameters affecting the quantity of power export and CO2 emissions. The project fires biomass and hence the methodology also includes monitoring the amount of biomass input and the energy availability from the same. The net emission reductions will result from the units of power available from the biomass for export. The methodology will include monitoring of the quantity of biomass.
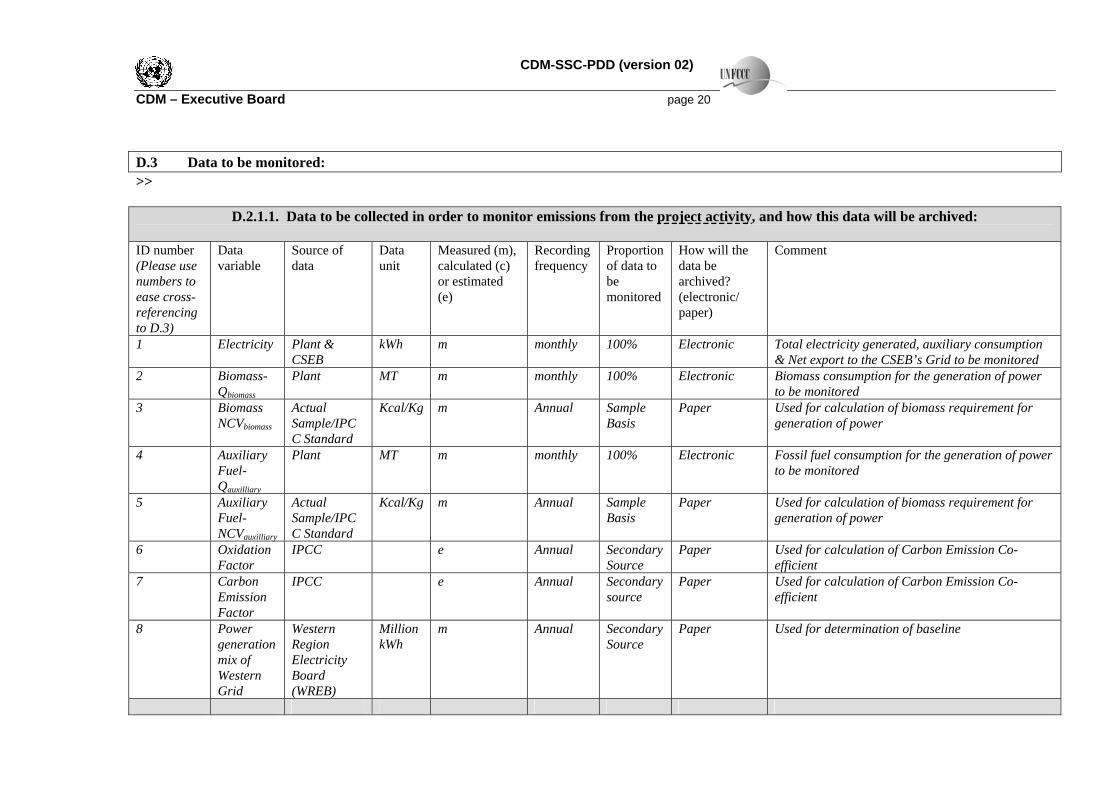
CDM-SSC-PDD (version 02) CDM – Executive Board page 20 D.3 Data to be monitored: >> D.2.1.1. Data to be collected in order to monitor emissions from the project activity, and how this data will be archived: ID number (Please use numbers to ease cross-referencing to D.3)
Data variable
Source of data
Data unit
Measured (m), calculated (c) or estimated (e)
Recording frequency
Proportion of data to be monitored
How will the data be archived? (electronic/ paper)
Comment
1 Electricity Plant &CSEB
kWh m monthly 100% Electronic Total electricity generated, auxiliary consumption & Net export to the CSEB’s Grid to be monitored
2 Biomass-Q
Plant biomass
MT m monthly 100% Electronic Biomass consumption for the generation of power to be monitored
3 BiomassNCV
Actual Sample/IPCC Standard
biomass
Kcal/Kg m Annual Sample Basis
Paper Used for calculation of biomass requirement for generation of power
4 AuxiliaryFuel- Q
Plant
auxilliary
MT m monthly 100% Electronic Fossil fuel consumption for the generation of power to be monitored
5 AuxiliaryFuel- NCV
Actual Sample/IPCC Standard auxilliary
Kcal/Kg m Annual Sample Basis
Paper Used for calculation of biomass requirement for generation of power
6 OxidationFactor
IPCC e Annual SecondarySource
Paper Used for calculation of Carbon Emission Co-efficient
7 CarbonEmission Factor
IPCC e Annual Secondarysource
Paper Used for calculation of Carbon Emission Co-efficient
8 Powergeneration mix of Western Grid
Western Region Electricity Board (WREB)
Million kWh
m Annual SecondarySource
Paper Used for determination of baseline
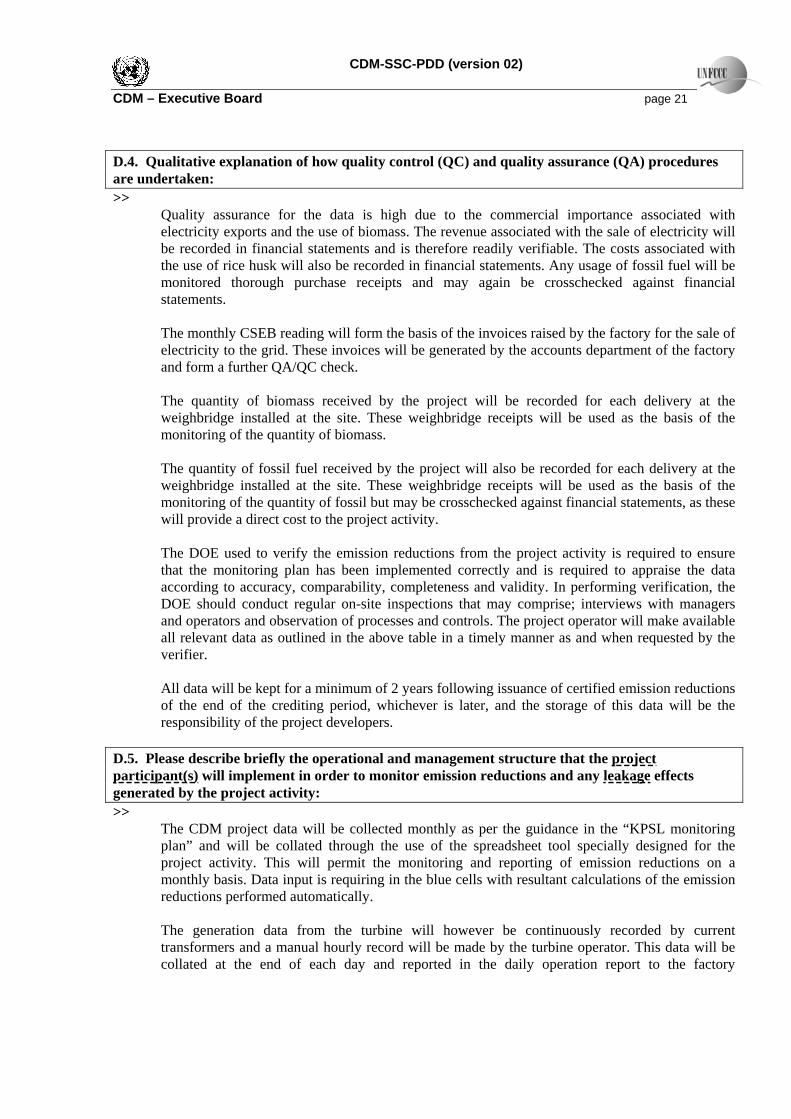
CDM-SSC-PDD (version 02) CDM – Executive Board page 21 D.4. Qualitative explanation of how quality control (QC) and quality assurance (QA) procedures are undertaken: >>
Quality assurance for the data is high due to the commercial importance associated with electricity exports and the use of biomass. The revenue associated with the sale of electricity will be recorded in financial statements and is therefore readily verifiable. The costs associated with the use of rice husk will also be recorded in financial statements. Any usage of fossil fuel will be monitored thorough purchase receipts and may again be crosschecked against financial statements.
The monthly CSEB reading will form the basis of the invoices raised by the factory for the sale of electricity to the grid. These invoices will be generated by the accounts department of the factory and form a further QA/QC check. The quantity of biomass received by the project will be recorded for each delivery at the weighbridge installed at the site. These weighbridge receipts will be used as the basis of the monitoring of the quantity of biomass. The quantity of fossil fuel received by the project will also be recorded for each delivery at the weighbridge installed at the site. These weighbridge receipts will be used as the basis of the monitoring of the quantity of fossil but may be crosschecked against financial statements, as these will provide a direct cost to the project activity. The DOE used to verify the emission reductions from the project activity is required to ensure that the monitoring plan has been implemented correctly and is required to appraise the data according to accuracy, comparability, completeness and validity. In performing verification, the DOE should conduct regular on-site inspections that may comprise; interviews with managers and operators and observation of processes and controls. The project operator will make available all relevant data as outlined in the above table in a timely manner as and when requested by the verifier. All data will be kept for a minimum of 2 years following issuance of certified emission reductions of the end of the crediting period, whichever is later, and the storage of this data will be the responsibility of the project developers.
D.5. Please describe briefly the operational and management structure that the project participant(s) will implement in order to monitor emission reductions and any leakage effects generated by the project activity: >>
The CDM project data will be collected monthly as per the guidance in the “KPSL monitoring plan” and will be collated through the use of the spreadsheet tool specially designed for the project activity. This will permit the monitoring and reporting of emission reductions on a monthly basis. Data input is requiring in the blue cells with resultant calculations of the emission reductions performed automatically.
The generation data from the turbine will however be continuously recorded by current transformers and a manual hourly record will be made by the turbine operator. This data will be collated at the end of each day and reported in the daily operation report to the factory

CDM-SSC-PDD (version 02) CDM – Executive Board page 22
management, the responsibility for which will be with the GM (Power). This data will form the basis of the ongoing calculation, which will then be tallied against the monthly recordings taken by the CSEB, and a representative of the plant. The consumption of biomass and fossil fuel will be reported monthly by the Manager Purchase (Power). The plant will implement a PLC system, which will monitor the main performance and output variables of the power plant; the systems for monitoring the CDM aspect of the project will be drawn extensively from the PLC system.
D.6. Name of person/entity determining the monitoring methodology: >>
Kalindi Power & Steel Ltd. & the associate consultant S.R. Corporate Consultant (P) Ltd
CDM-SSC-PDD (version 02) CDM – Executive Board page 23 SECTION E.: Estimation of GHG emissions by sources: E.1. Formulae used: >> E.1.1 Selected formulae as provided in appendix B: >>
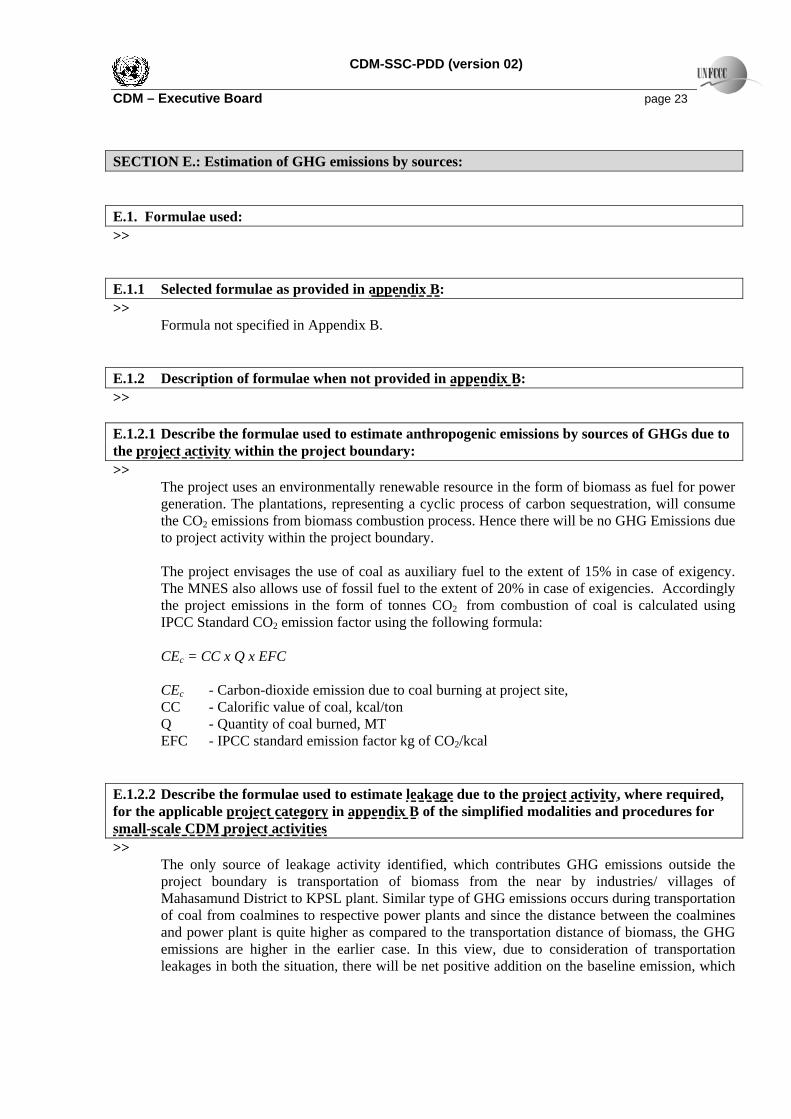
Formula not specified in Appendix B. E.1.2 Description of formulae when not provided in appendix B: >> E.1.2.1 Describe the formulae used to estimate anthropogenic emissions by sources of GHGs due to the project activity within the project boundary: >>
The project uses an environmentally renewable resource in the form of biomass as fuel for power generation. The plantations, representing a cyclic process of carbon sequestration, will consume the CO2 emissions from biomass combustion process. Hence there will be no GHG Emissions due to project activity within the project boundary.
The project envisages the use of coal as auxiliary fuel to the extent of 15% in case of exigency. The MNES also allows use of fossil fuel to the extent of 20% in case of exigencies. Accordingly the project emissions in the form of tonnes CO2 from combustion of coal is calculated using IPCC Standard CO2 emission factor using the following formula: CEc = CC x Q x EFC CEc - Carbon-dioxide emission due to coal burning at project site, CC - Calorific value of coal, kcal/ton Q - Quantity of coal burned, MT EFC - IPCC standard emission factor kg of CO2/kcal
E.1.2.2 Describe the formulae used to estimate leakage due to the project activity, where required, for the applicable project category in appendix B of the simplified modalities and procedures for small-scale CDM project activities >>
The only source of leakage activity identified, which contributes GHG emissions outside the project boundary is transportation of biomass from the near by industries/ villages of Mahasamund District to KPSL plant. Similar type of GHG emissions occurs during transportation of coal from coalmines to respective power plants and since the distance between the coalmines and power plant is quite higher as compared to the transportation distance of biomass, the GHG emissions are higher in the earlier case. In this view, due to consideration of transportation leakages in both the situation, there will be net positive addition on the baseline emission, which
CDM-SSC-PDD (version 02) CDM – Executive Board page 24
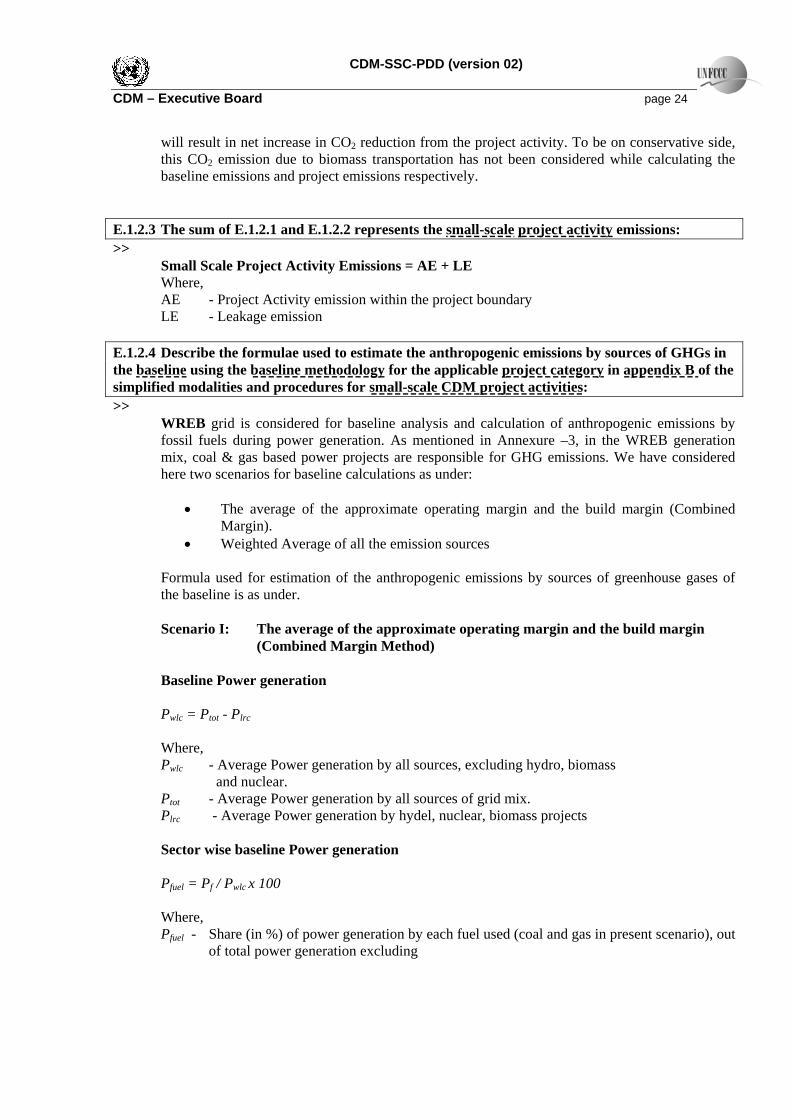
will result in net increase in CO2 reduction from the project activity. To be on conservative side, this CO2 emission due to biomass transportation has not been considered while calculating the baseline emissions and project emissions respectively.
E.1.2.3 The sum of E.1.2.1 and E.1.2.2 represents the small-scale project activity emissions: >>
Small Scale Project Activity Emissions = AE + LE Where, AE - Project Activity emission within the project boundary LE - Leakage emission
E.1.2.4 Describe the formulae used to estimate the anthropogenic emissions by sources of GHGs in the baseline using the baseline methodology for the applicable project category in appendix B of the simplified modalities and procedures for small-scale CDM project activities: >>
WREB grid is considered for baseline analysis and calculation of anthropogenic emissions by fossil fuels during power generation. As mentioned in Annexure –3, in the WREB generation mix, coal & gas based power projects are responsible for GHG emissions. We have considered here two scenarios for baseline calculations as under:
• The average of the approximate operating margin and the build margin (Combined
Margin). • Weighted Average of all the emission sources
Formula used for estimation of the anthropogenic emissions by sources of greenhouse gases of the baseline is as under.
Scenario I: The average of the approximate operating margin and the build margin
(Combined Margin Method)
Baseline Power generation Pwlc = Ptot - Plrc
Where, Pwlc - Average Power generation by all sources, excluding hydro, biomass
and nuclear. Ptot - Average Power generation by all sources of grid mix. Plrc - Average Power generation by hydel, nuclear, biomass projects
Sector wise baseline Power generation
Pfuel = Pf / Pwlc x 100
Where, Pfuel - Share (in %) of power generation by each fuel used (coal and gas in present scenario), out
of total power generation excluding
CDM-SSC-PDD (version 02) CDM – Executive Board page 25
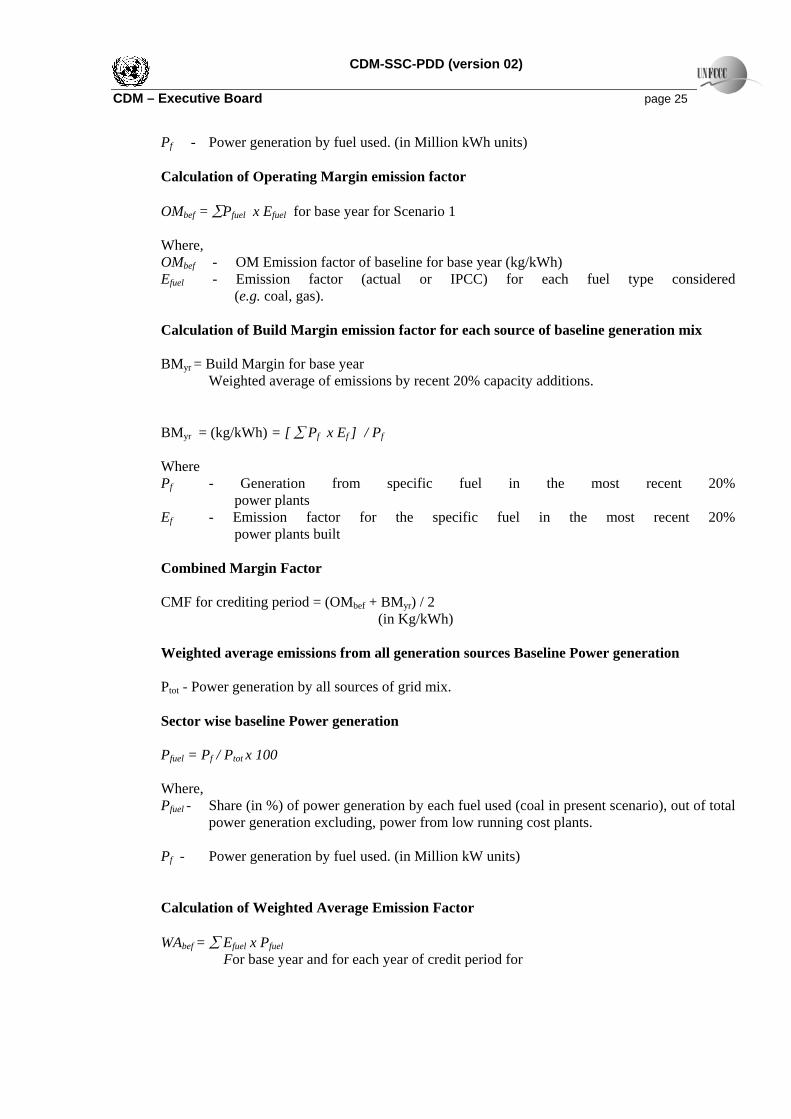
Pf - Power generation by fuel used. (in Million kWh units) Calculation of Operating Margin emission factor
OMbef = ∑Pfuel x Efuel for base year for Scenario 1
Where, OMbef - OM Emission factor of baseline for base year (kg/kWh) Efuel - Emission factor (actual or IPCC) for each fuel type considered
(e.g. coal, gas).
Calculation of Build Margin emission factor for each source of baseline generation mix
BMyr = Build Margin for base year Weighted average of emissions by recent 20% capacity additions.
BMyr = (kg/kWh) = [ ∑ Pf x Ef ] / Pf Where Pf - Generation from specific fuel in the most recent 20%
power plants Ef - Emission factor for the specific fuel in the most recent 20%
power plants built
Combined Margin Factor CMF for crediting period = (OMbef + BMyr) / 2 (in Kg/kWh)
Weighted average emissions from all generation sources Baseline Power generation
Ptot - Power generation by all sources of grid mix.
Sector wise baseline Power generation Pfuel = Pf / Ptot x 100
Where, Pfuel - Share (in %) of power generation by each fuel used (coal in present scenario), out of total
power generation excluding, power from low running cost plants.
Pf - Power generation by fuel used. (in Million kW units)
Calculation of Weighted Average Emission Factor
WAbef = ∑ Efuel x Pfuel
For base year and for each year of credit period for
CDM-SSC-PDD (version 02) CDM – Executive Board page 26
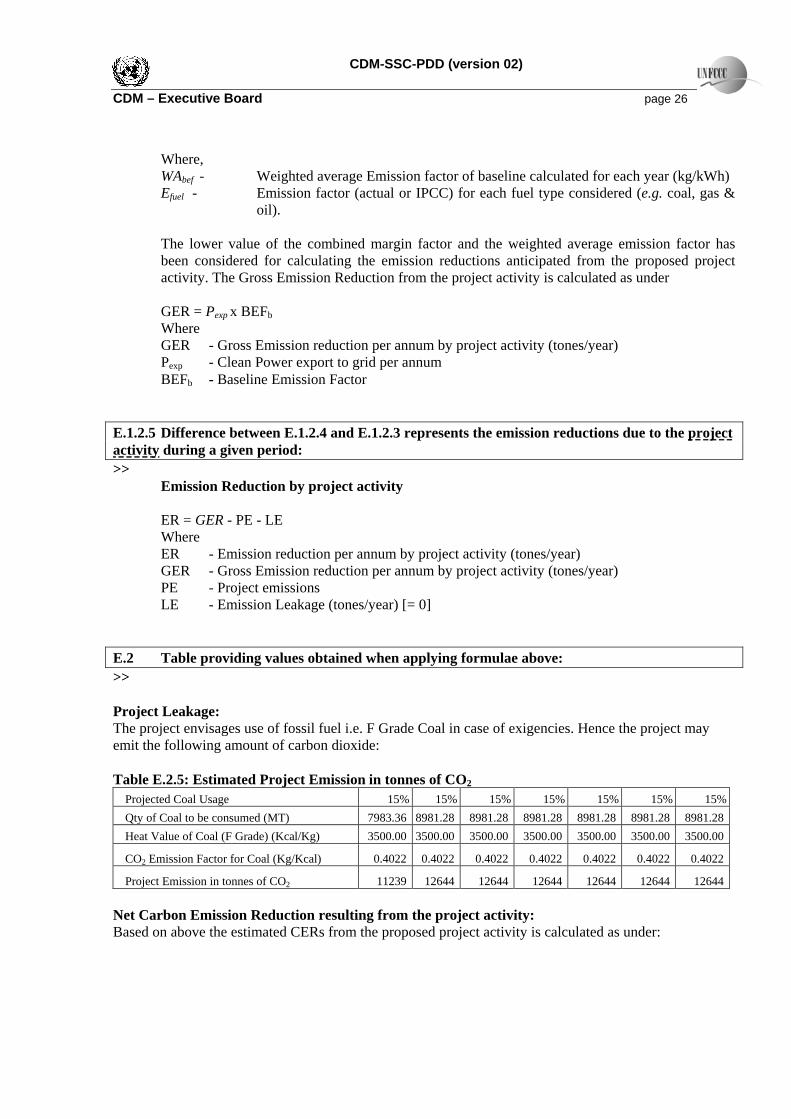
Where, WAbef - Weighted average Emission factor of baseline calculated for each year (kg/kWh) Efuel - Emission factor (actual or IPCC) for each fuel type considered (e.g. coal, gas &
oil).
The lower value of the combined margin factor and the weighted average emission factor has been considered for calculating the emission reductions anticipated from the proposed project activity. The Gross Emission Reduction from the project activity is calculated as under GER = Pexp x BEFb Where GER - Gross Emission reduction per annum by project activity (tones/year) Pexp - Clean Power export to grid per annum BEFb - Baseline Emission Factor
E.1.2.5 Difference between E.1.2.4 and E.1.2.3 represents the emission reductions due to the project activity during a given period: >>
Emission Reduction by project activity
ER = GER - PE - LE Where ER - Emission reduction per annum by project activity (tones/year) GER - Gross Emission reduction per annum by project activity (tones/year) PE - Project emissions LE - Emission Leakage (tones/year) [= 0]
E.2 Table providing values obtained when applying formulae above: >>
Project Leakage: The project envisages use of fossil fuel i.e. F Grade Coal in case of exigencies. Hence the project may emit the following amount of carbon dioxide: Table E.2.5: Estimated Project Emission in tonnes of CO2
Projected Coal Usage 15% 15% 15% 15% 15% 15% 15%Qty of Coal to be consumed (MT) 7983.36 8981.28 8981.28 8981.28 8981.28 8981.28 8981.28 Heat Value of Coal (F Grade) (Kcal/Kg) 3500.00 3500.00 3500.00 3500.00 3500.00 3500.00 3500.00
CO2 Emission Factor for Coal (Kg/Kcal) 0.4022 0.4022 0.4022 0.4022 0.4022 0.4022 0.4022
Project Emission in tonnes of CO2 11239 12644 12644 12644 12644 12644 12644 Net Carbon Emission Reduction resulting from the project activity: Based on above the estimated CERs from the proposed project activity is calculated as under:
CDM-SSC-PDD (version 02) CDM – Executive Board page 27
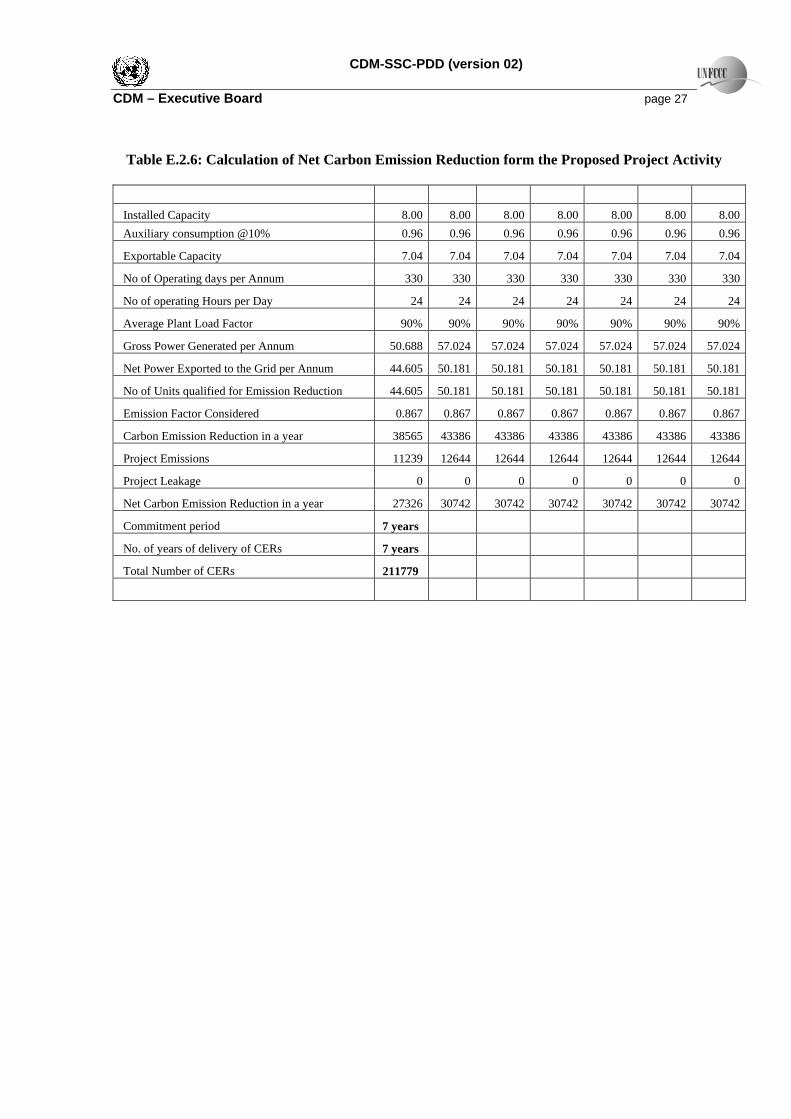
Table E.2.6: Calculation of Net Carbon Emission Reduction form the Proposed Project Activity
Installed Capacity 8.00 8.00 8.00 8.00 8.00 8.00 8.00 Auxiliary consumption @10% 0.96 0.96 0.96 0.96 0.96 0.96 0.96
Exportable Capacity 7.04 7.04 7.04 7.04 7.04 7.04 7.04
No of Operating days per Annum 330 330 330 330 330 330 330
No of operating Hours per Day 24 24 24 24 24 24 24
Average Plant Load Factor 90% 90% 90% 90% 90% 90% 90%
Gross Power Generated per Annum 50.688 57.024 57.024 57.024 57.024 57.024 57.024
Net Power Exported to the Grid per Annum 44.605 50.181 50.181 50.181 50.181 50.181 50.181
No of Units qualified for Emission Reduction 44.605 50.181 50.181 50.181 50.181 50.181 50.181
Emission Factor Considered 0.867 0.867 0.867 0.867 0.867 0.867 0.867
Carbon Emission Reduction in a year 38565 43386 43386 43386 43386 43386 43386
Project Emissions 11239 12644 12644 12644 12644 12644 12644
Project Leakage 0 0 0 0 0 0 0
Net Carbon Emission Reduction in a year 27326 30742 30742 30742 30742 30742 30742
Commitment period 7 years
No. of years of delivery of CERs 7 years
Total Number of CERs 211779
CDM-SSC-PDD (version 02) CDM – Executive Board page 28 SECTION F.: Environmental impacts: F.1. If required by the host Party, documentation on the analysis of the environmental impacts of the project activity: >>
Host Country’s legislation do not require any documentation on the analysis of environmental impacts of the project activity as the capital cost of the project is less Rs 100 Crores. Further in relation to the base line scenario no negative environmental impacts will arise as a result of the project activity.
The positive environmental impacts arising from the project activity are:
A reduction in carbon dioxide emissions from the replacement of fossil fuels, which would be
generated under the baseline scenario. A reduction in the emissions of other harmful gases (NOx and SOx) that arise from the
combustion of coal in power generation. A reduction is ash in comparison to the baseline scenario due the lower ash content of rice
husk relative to coal (18% versus 46% respectively) A reduction in methane emissions through the controlled combustion rice husks & other
biomasses.
The factory will meet all environmental legislations as set out by the Chhattisgarh Environment Conservation Board (the State Pollution Control Board) and there will be on-going monitoring of the plant by this state body. “Consent to Establish” was issued to the plant on 23rd February 2005 and “Consent to operate” will be obtained prior to commissioning to the plant. The plant will install an electrostatic precipitator at the exit of the boiler to limit suspended particulate matter in the flue gases to less than 100 mg/Nm3. There will also investment in waste water systems to treat the water de-mineralization plant effluent and also the blow down water from the cooling water and steam generator. Monitoring of air and water quality will be undertaken on a regular basis as per PCB guidelines after the plant is commissioned.
CDM-SSC-PDD (version 02) CDM – Executive Board page 29 SECTION G. Stakeholders’ comments: G.1. Brief description of how comments by local stakeholders have been invited and compiled: >>
The stakeholder review has been conducted on three levels
A local stakeholder review A national stakeholder review which will be undertaken through the approval by the Ministry
of Environment and Forests (the Indian DNA) and consent to operate from the Chhattisgarh Pollution Control Board. An international stakeholder review, which will be conducted at the time of validation.
The institutions are already in place for the national and international stakeholder review and any comments arising from these processes will be incorporated prior to registration. The project was submitted to the Indian designated national authority (the Ministry of Environment and Forests) in June 2006 and is awaiting their approval.
G.2. Summary of the comments received: >>
The “Gram panchayat” (a locally elected representative) has been approached and informed of the project , a no objection certificate was issued by the “panchayat” on 7th March 2005. Other stakeholders that have been notified of the project, through consents and approvals required for the investment, are the Chhattisgarh Renewable Energy Development Authority, the Chhattisgarh State Electricity Board, the Ministry on Commerce and Industry and the State Boiler Inspectorate These parties have approved the project and provided the necessary approvals required to date.
G.3. Report on how due account was taken of any comments received: >>
No adverse comment has been raised by any of stakeholder
CDM-SSC-PDD (version 02) CDM – Executive Board page 30
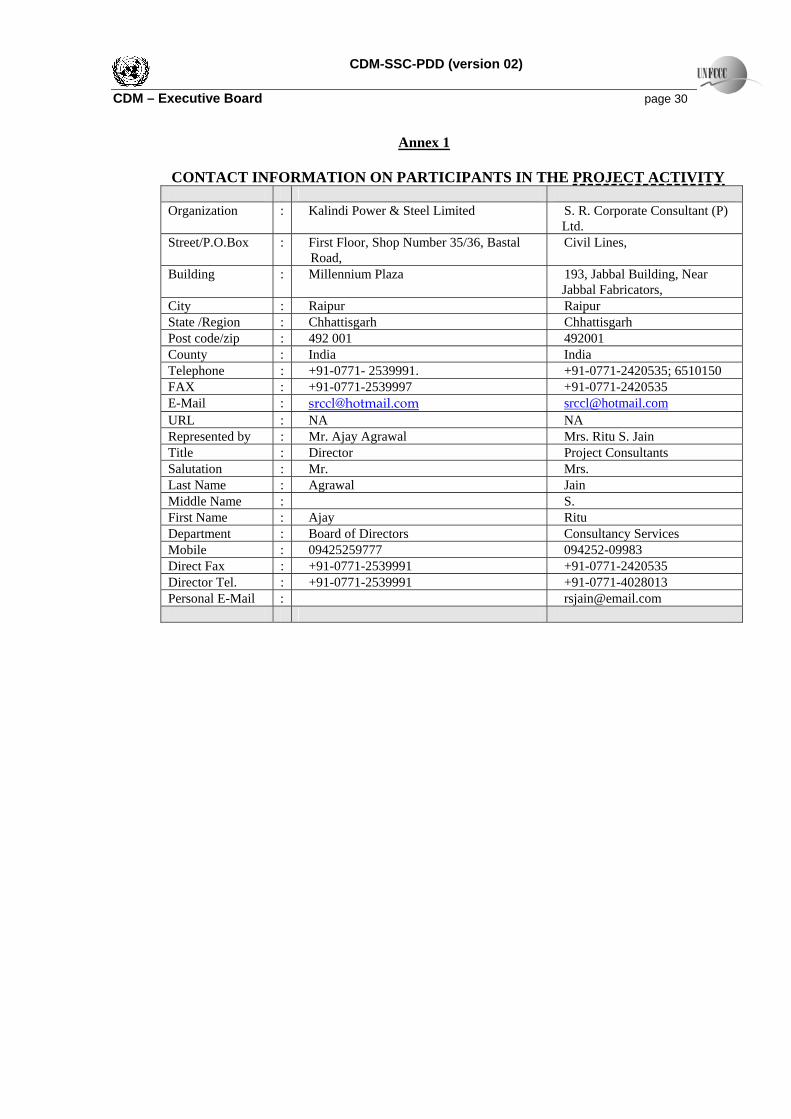
Annex 1
CONTACT INFORMATION ON PARTICIPANTS IN THE PROJECT ACTIVITY Organization : Kalindi Power & Steel Limited S. R. Corporate Consultant (P)
Ltd. Street/P.O.Box : First Floor, Shop Number 35/36, Bastal
Road, Civil Lines,
Building : Millennium Plaza 193, Jabbal Building, Near Jabbal Fabricators,
City : Raipur Raipur State /Region : Chhattisgarh Chhattisgarh Post code/zip : 492 001 492001 County : India India Telephone : +91-0771- 2539991. +91-0771-2420535; 6510150 FAX : +91-0771-2539997 +91-0771-2420535 E-Mail : [email protected] [email protected] URL : NA NA Represented by : Mr. Ajay Agrawal Mrs. Ritu S. Jain Title : Director Project Consultants Salutation : Mr. Mrs. Last Name : Agrawal Jain Middle Name : S. First Name : Ajay Ritu Department : Board of Directors Consultancy Services Mobile : 09425259777 094252-09983 Direct Fax : +91-0771-2539991 +91-0771-2420535 Director Tel. : +91-0771-2539991 +91-0771-4028013 Personal E-Mail : [email protected]
CDM-SSC-PDD (version 02) CDM – Executive Board page 31
Annex 2
INFORMATION REGARDING PUBLIC FUNDING
No funding from any Annex I party is available.
- - - - -