Embed Size (px)
Citation preview
PROJECT DESIGN DOCUMENT FORM (CDM PDD) - Version 03 CDM – Executive Board page 1
This template shall not be altered. It shall be completed without modifying/adding headings or logo, format or font.
CLEAN DEVELOPMENT MECHANISM PROJECT DESIGN DOCUMENT FORM (CDM-PDD)
Version 02 - in effect as of: 1 July 2004)
CONTENTS A. General description of project activity B. Application of a baseline methodology C. Duration of the project activity / Crediting period D. Application of a monitoring methodology and plan E. Estimation of GHG emissions by sources F. Environmental impacts G. Stakeholders’ comments
Annexes Annex 1: Contact information on participants in the project activity Annex 2: Information regarding public funding Annex 3: Baseline information
Annex 4: Monitoring plan
PROJECT DESIGN DOCUMENT FORM (CDM PDD) - Version 03 CDM – Executive Board page 2
This template shall not be altered. It shall be completed without modifying/adding headings or logo, format or font.
SECTION A. General description of project activity A.1 Title of the project activity: Ninguo Cement Plant 9100KW Waste Heat Recovery and Utilisation for Power Generation Project of Anhui Conch Cement Company Limited Version 2 15th June, 2006 A.2. Description of the project activity: The Project Activity is a waste heat recovery and utilization for power generation project located at the Ningguo Conch Cement Plant in Ningguo City of Anhui Province of the People’s Republic of China. The Ningguo Cement Plant is part of the Conch Cement Group Company Limited, a leading coal mining enterprise in China. There are 3 clinker production lines with pre-calcination technology presently, in which Line No.1 is 4000 t/d clinker production line with successful application of waste heat power generation technology, Line No.2 is 2000t/d clinker production line and Line No.3 is 5000t/d clinker production line. The yearly output of high-quality cement and clinker amounts to 5 million tons, and annual power generation reaches 50,000 MWh. This project is the auxiliary waste heat power generation project of No.3 5000t/d clinker production line in the Ningguo Cement Plant, and two sets of heat recovery boilers and one set of mixed-pressure admission condensing turbine-generator unit with the rated power of about 9100kW. The power generation of the clinker per ton is designed to be 38.5kWh/t, annual design power generation amounts to 70,000 MWh, and yearly power supply to cement production facilities is 65.10 million kWh. Key equipment will be imported and procured from China. The main objectives of the Project Activity are to meet the electrical supply needs of the Ningguo Cement Plant and to reduce greenhouse gas emissions through the recovery and use of waste heat from the rotating kiln of the cement clinker production line. The waste heat is currently vented to atmosphere, with a portion re-circulated within the clinker process to pre-heat input fuel and raw materials. However the Project Activity will now capture the waste heat for use in a power generation plant, the exhaust heat of which can also still be recirculated to the clinker process. This power generation plant will be rated at 9.1MW and will produce 70,000 MWh1 of annual electricity generation. The Project Activity will reduce greenhouse gas emissions (CO2) versus the baseline scenario, which is the installation of a 9.1MW waste heat recovery boiler versus the continued supply from the regional power grid. The Project Activity is one of the first of its kind in China and is the first of it’s kind to employ international technology without the use of international grants. Additionally the Project Activity will:
• significantly reduce harmful emissions (including SOx, NOx and floating particles), and thus improve the local environment
• lead to a reduction in the temperature of the vented hot air from over 360°C to 84°C and also reduce the volume of water that is consumed by the humidifying pump in the cooling towers and
1 Estimated as per Step M3 in B.2
PROJECT DESIGN DOCUMENT FORM (CDM PDD) - Version 03 CDM – Executive Board page 3
This template shall not be altered. It shall be completed without modifying/adding headings or logo, format or font.
thereby save water resources in this area. • lead to an increase in local staff employed by about 19 persons.
The Project Activity meets the sustainable development needs of China in that it:
• Supports the circular economy ideas as outlined most recently at a conference organized by the Chinese government.2.
• Increases energy supply from clean energy sources and improves energy security at a time of energy shortage in the eastern provinces of China.3
• Supports the development of the waste heat recovery and power generation sector in China which has considerable energy saving potential in many important sectors of the Chinese economy such as the chemical, aluminium and steel sectors.
• Supports the development of a more energy efficient cement industry in China where published figures show that the cement sector is 45% more energy inefficient than global norms4. The Project Activity will thus specifically help meet China’s sustainable development needs at a time when cement is in great demand.
• Supports the Conch Cement Company limited to become a leading example of GHG mitigation best practice in the cement sector and encourages them to consider other energy efficiency or GHG reduction projects on their sites and through them to other industrial companies.
• Mitigates the impacts of climate change on China which are already beginning to be felt and include the significant shrinkage of the Qinghai-Tibet glaciers which are one of the main sources of water in North West China5.
A.3. Project participants:
Please list project participants and Party(ies) involved and provide contact information in Annex 1. Information shall be in indicated using the following tabular format.
Name of Party involved (*)
((host) indicates a host Party)
Private and/or public entity(ies)
project participants (*) (as applicable)
Kindly indicate if the Party involved
wishes to be considered as
project participant (Yes/No)
Host Country: People’s Republic of China (host)
Anhui Conch Cement Company limited
No
United Kingdom CAMCO International Limited
No
A.4. Technical description of the project activity:
2 Source: China Daily – Front Page, September 29th 2004, where Minister Ma Kai, head of NDRC, is quoted. 3 There have been many articles on energy shortage in China including this latest one in the China Daily outlining how the supply - demand balance is expected to be reached again by 2006 – after massive build out of predominantly coal fired power stations - http://www.chinadaily.com.cn/english/doc/2004-09/22/content_376774.htm 4European statistics on China, see http://www.delchn.cec.eu.int/newsletters/200501/004_zh.htm 5 Source: China Daily - http://www.chinadaily.com.cn/english/doc/2004-09/23/content_376957.htm
PROJECT DESIGN DOCUMENT FORM (CDM PDD) - Version 03 CDM – Executive Board page 4
This template shall not be altered. It shall be completed without modifying/adding headings or logo, format or font.
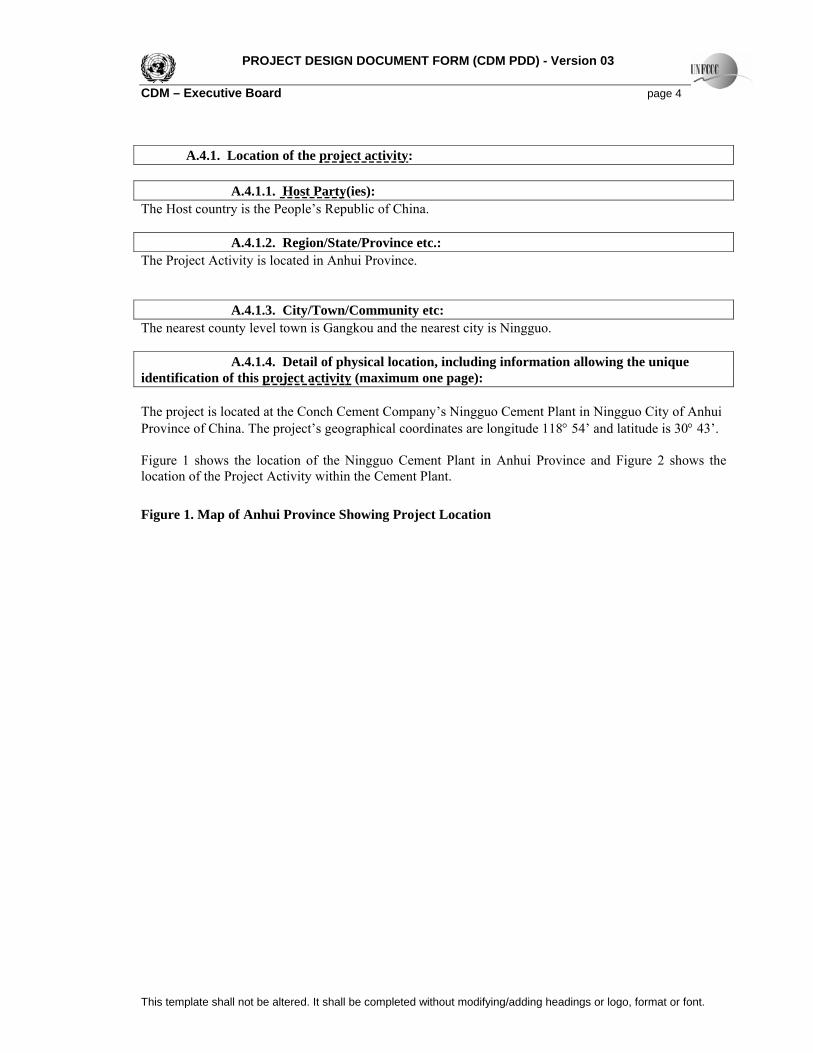
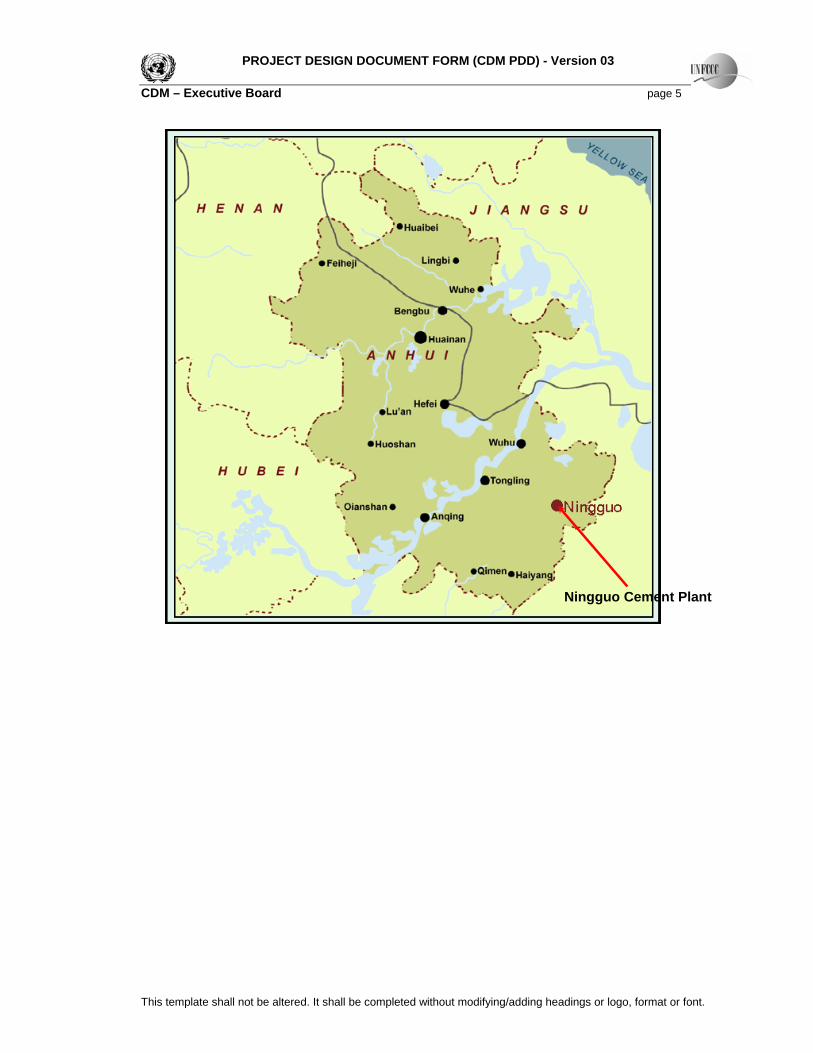
A.4.1. Location of the project activity: A.4.1.1. Host Party(ies): The Host country is the People’s Republic of China. A.4.1.2. Region/State/Province etc.: The Project Activity is located in Anhui Province. A.4.1.3. City/Town/Community etc: The nearest county level town is Gangkou and the nearest city is Ningguo. A.4.1.4. Detail of physical location, including information allowing the unique identification of this project activity (maximum one page): The project is located at the Conch Cement Company’s Ningguo Cement Plant in Ningguo City of Anhui Province of China. The project’s geographical coordinates are longitude 118° 54’ and latitude is 30° 43’. Figure 1 shows the location of the Ningguo Cement Plant in Anhui Province and Figure 2 shows the location of the Project Activity within the Cement Plant.
Figure 1. Map of Anhui Province Showing Project Location
PROJECT DESIGN DOCUMENT FORM (CDM PDD) - Version 03 CDM – Executive Board page 5
This template shall not be altered. It shall be completed without modifying/adding headings or logo, format or font.
Ningguo Cement Plant
PROJECT DESIGN DOCUMENT FORM (CDM PDD) - Version 03 CDM – Executive Board page 6
This template shall not be altered. It shall be completed without modifying/adding headings or logo, format or font.
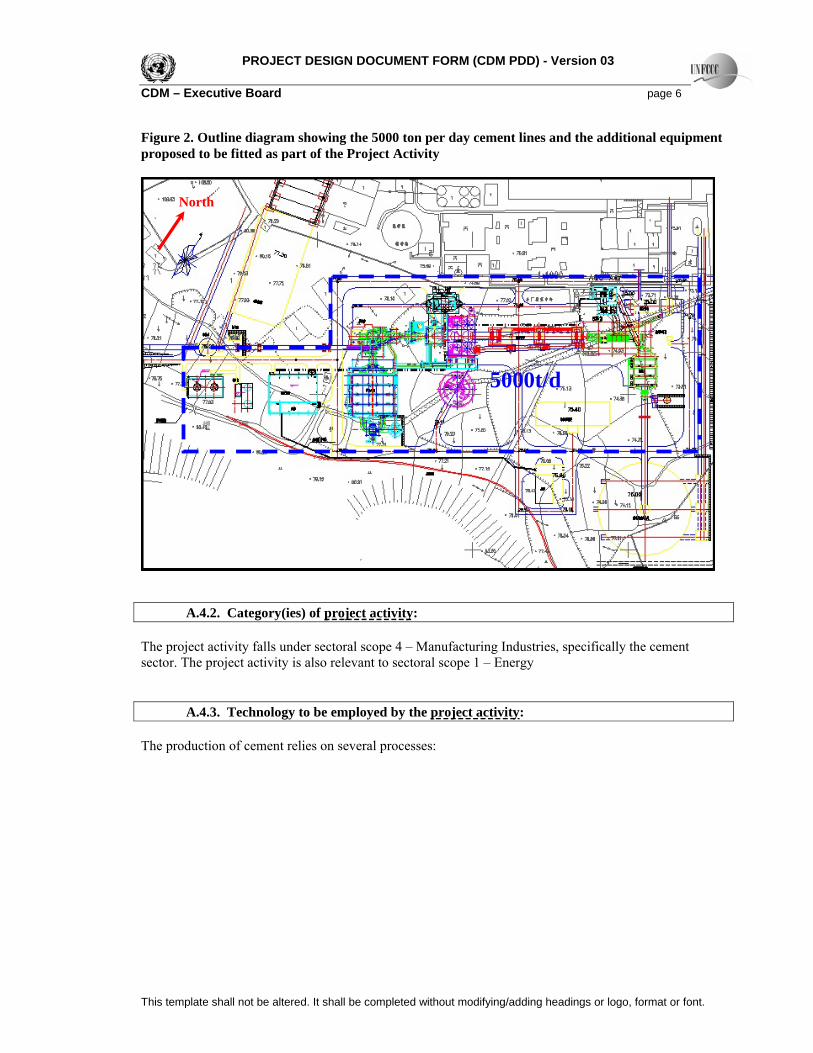
Figure 2. Outline diagram showing the 5000 ton per day cement lines and the additional equipment proposed to be fitted as part of the Project Activity
A.4.2. Category(ies) of project activity: The project activity falls under sectoral scope 4 – Manufacturing Industries, specifically the cement sector. The project activity is also relevant to sectoral scope 1 – Energy A.4.3. Technology to be employed by the project activity: The production of cement relies on several processes:
North
5000t/d
PROJECT DESIGN DOCUMENT FORM (CDM PDD) - Version 03 CDM – Executive Board page 7
This template shall not be altered. It shall be completed without modifying/adding headings or logo, format or font.
Coal preblendingstorage
Limestone preblendingstorage
Proportioning preblendingstorage
Iron Powder storage
Coal mill
Row material
roller millPre-heater Kiln
ESP ESP
Clinker Store
Burning system
Limestone
Coal
Proportioning
Iron powder
Venting
Cooling
Waste gas Waste gas Waste gas
Venting
Coal preblendingstorage
Limestone preblendingstorage
Proportioning preblendingstorage
Iron Powder storage
Coal mill
Row material
roller millPre-heater Kiln
ESP ESP
Clinker Store
Burning system
Limestone
Coal
Proportioning
Iron powder
Venting
Cooling
Waste gas Waste gas Waste gas
Venting
Limestone
Coal
Proportioning
Iron powder
Venting
Cooling
Waste gas Waste gas Waste gas
Venting
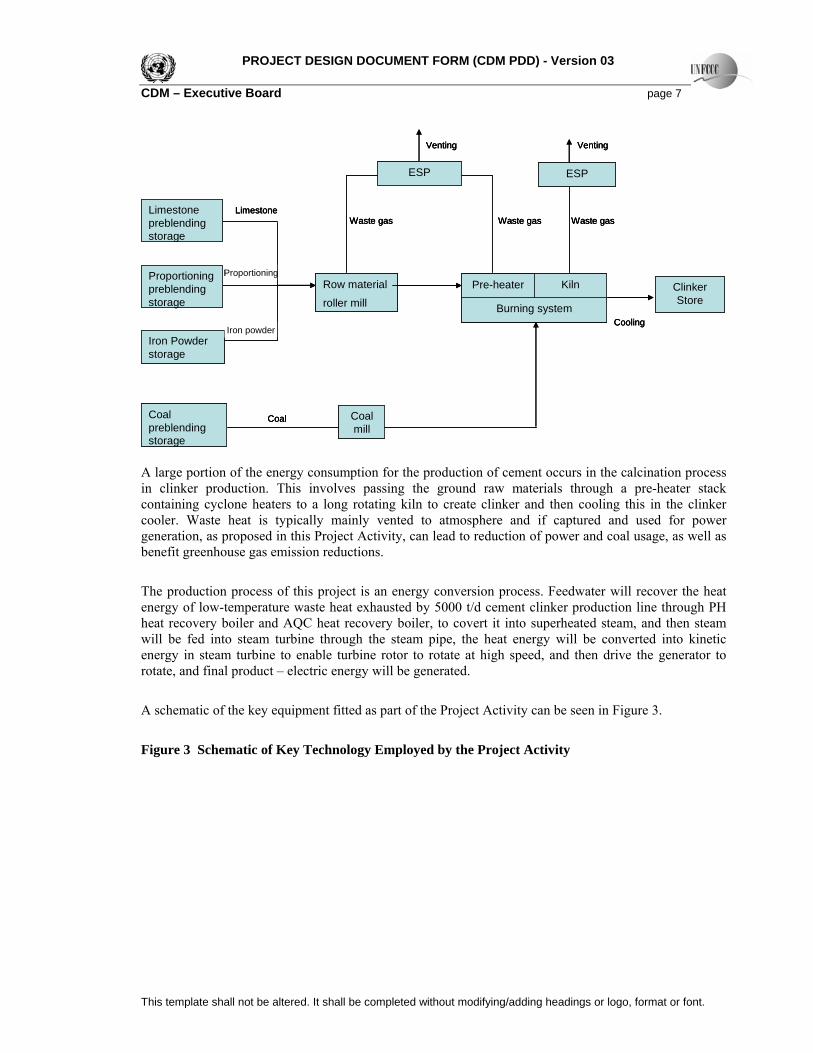
A large portion of the energy consumption for the production of cement occurs in the calcination process in clinker production. This involves passing the ground raw materials through a pre-heater stack containing cyclone heaters to a long rotating kiln to create clinker and then cooling this in the clinker cooler. Waste heat is typically mainly vented to atmosphere and if captured and used for power generation, as proposed in this Project Activity, can lead to reduction of power and coal usage, as well as benefit greenhouse gas emission reductions.
The production process of this project is an energy conversion process. Feedwater will recover the heat energy of low-temperature waste heat exhausted by 5000 t/d cement clinker production line through PH heat recovery boiler and AQC heat recovery boiler, to covert it into superheated steam, and then steam will be fed into steam turbine through the steam pipe, the heat energy will be converted into kinetic energy in steam turbine to enable turbine rotor to rotate at high speed, and then drive the generator to rotate, and final product – electric energy will be generated. A schematic of the key equipment fitted as part of the Project Activity can be seen in Figure 3.
Figure 3 Schematic of Key Technology Employed by the Project Activity
PROJECT DESIGN DOCUMENT FORM (CDM PDD) - Version 03 CDM – Executive Board page 8
This template shall not be altered. It shall be completed without modifying/adding headings or logo, format or font.
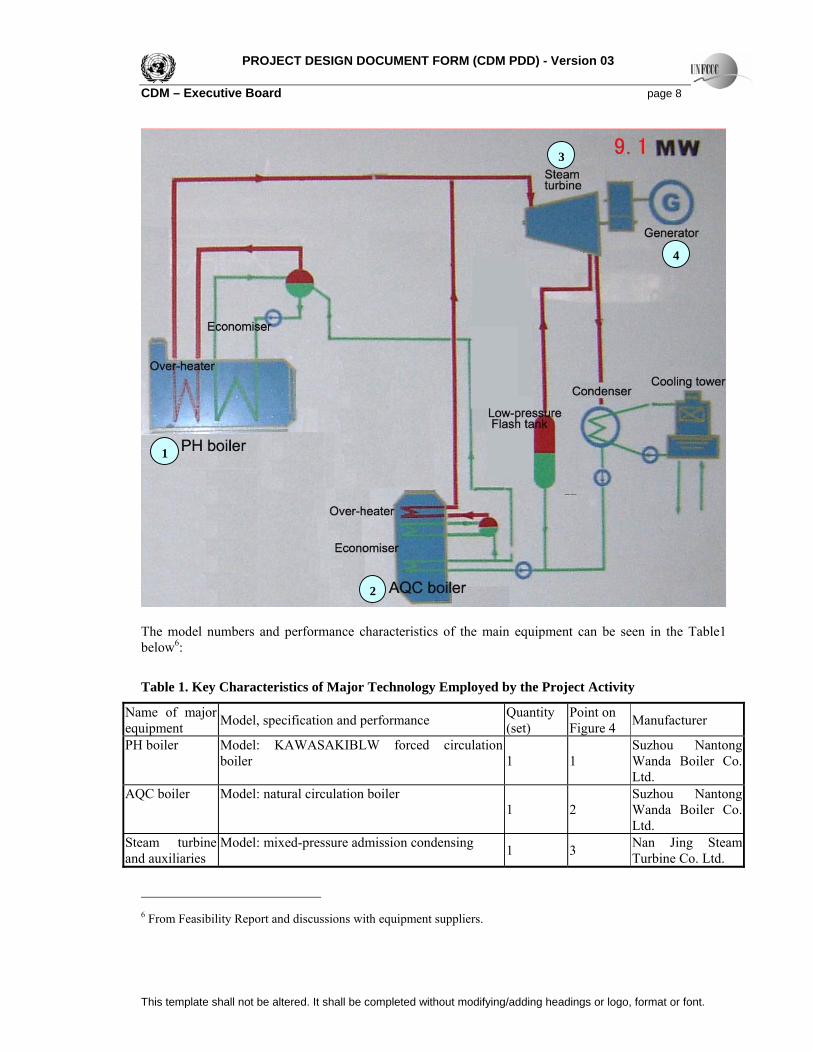
The model numbers and performance characteristics of the main equipment can be seen in the Table1 below6:
Table 1. Key Characteristics of Major Technology Employed by the Project Activity
Name of major equipment Model, specification and performance Quantity
(set) Point on Figure 4 Manufacturer
PH boiler Model: KAWASAKIBLW forced circulationboiler
1 1 Suzhou Nantong Wanda Boiler Co. Ltd.
AQC boiler Model: natural circulation boiler 1 2
Suzhou Nantong Wanda Boiler Co. Ltd.
Steam turbine and auxiliaries
Model: mixed-pressure admission condensing 1 3 Nan Jing Steam Turbine Co. Ltd.
6 From Feasibility Report and discussions with equipment suppliers.
3
1
2
4
PROJECT DESIGN DOCUMENT FORM (CDM PDD) - Version 03 CDM – Executive Board page 9
This template shall not be altered. It shall be completed without modifying/adding headings or logo, format or font.
Name of major equipment Model, specification and performance Quantity
(set) Point on Figure 4 Manufacturer
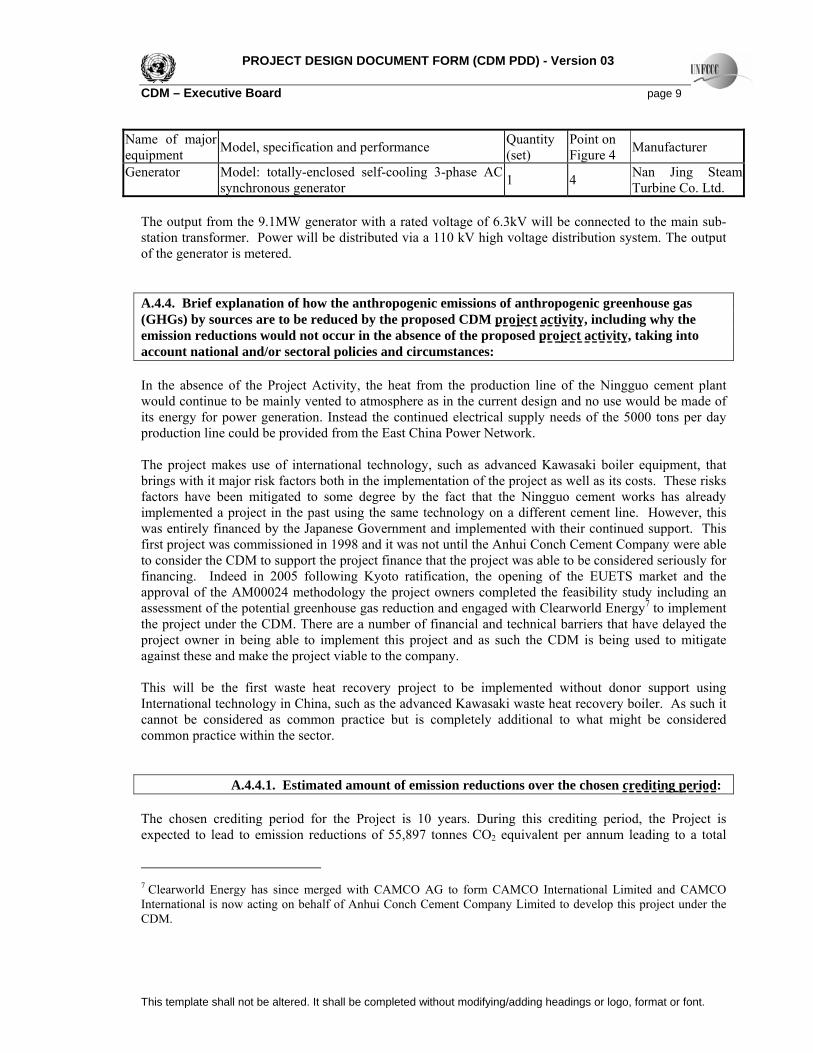
Generator Model: totally-enclosed self-cooling 3-phase AC synchronous generator 1 4 Nan Jing Steam
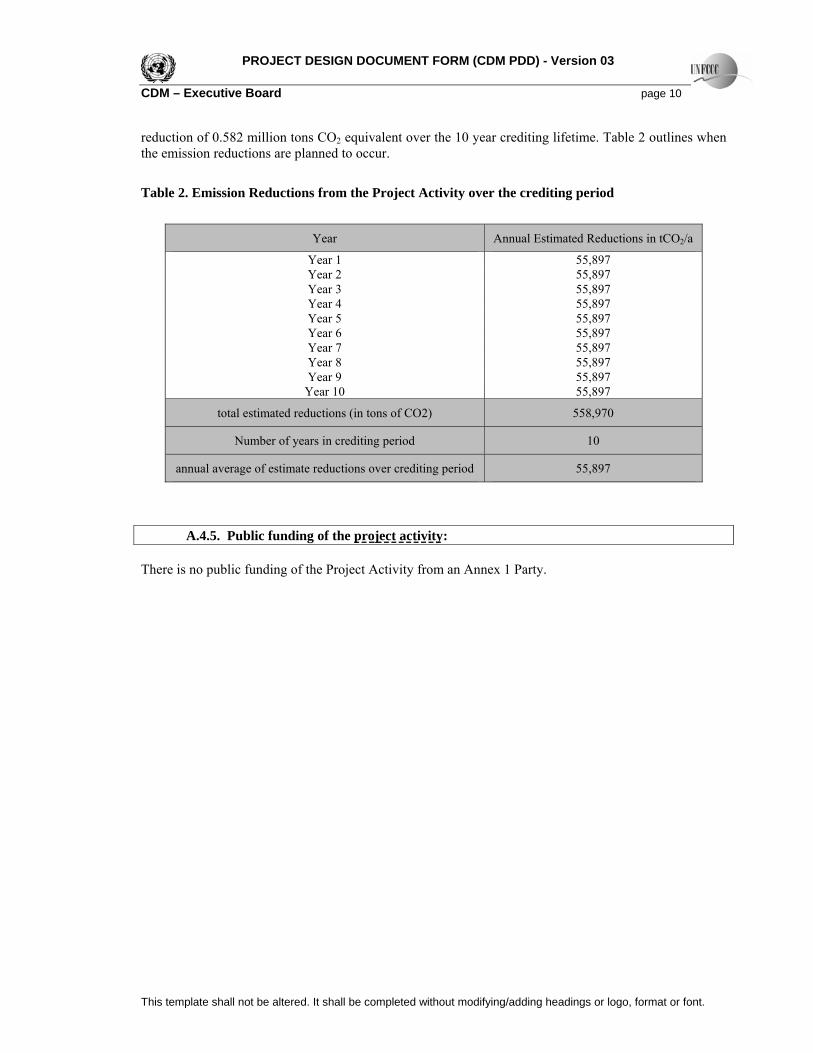
Turbine Co. Ltd. The output from the 9.1MW generator with a rated voltage of 6.3kV will be connected to the main sub-station transformer. Power will be distributed via a 110 kV high voltage distribution system. The output of the generator is metered. A.4.4. Brief explanation of how the anthropogenic emissions of anthropogenic greenhouse gas (GHGs) by sources are to be reduced by the proposed CDM project activity, including why the emission reductions would not occur in the absence of the proposed project activity, taking into account national and/or sectoral policies and circumstances: In the absence of the Project Activity, the heat from the production line of the Ningguo cement plant would continue to be mainly vented to atmosphere as in the current design and no use would be made of its energy for power generation. Instead the continued electrical supply needs of the 5000 tons per day production line could be provided from the East China Power Network. The project makes use of international technology, such as advanced Kawasaki boiler equipment, that brings with it major risk factors both in the implementation of the project as well as its costs. These risks factors have been mitigated to some degree by the fact that the Ningguo cement works has already implemented a project in the past using the same technology on a different cement line. However, this was entirely financed by the Japanese Government and implemented with their continued support. This first project was commissioned in 1998 and it was not until the Anhui Conch Cement Company were able to consider the CDM to support the project finance that the project was able to be considered seriously for financing. Indeed in 2005 following Kyoto ratification, the opening of the EUETS market and the approval of the AM00024 methodology the project owners completed the feasibility study including an assessment of the potential greenhouse gas reduction and engaged with Clearworld Energy7 to implement the project under the CDM. There are a number of financial and technical barriers that have delayed the project owner in being able to implement this project and as such the CDM is being used to mitigate against these and make the project viable to the company. This will be the first waste heat recovery project to be implemented without donor support using International technology in China, such as the advanced Kawasaki waste heat recovery boiler. As such it cannot be considered as common practice but is completely additional to what might be considered common practice within the sector. A.4.4.1. Estimated amount of emission reductions over the chosen crediting period: The chosen crediting period for the Project is 10 years. During this crediting period, the Project is expected to lead to emission reductions of 55,897 tonnes CO2 equivalent per annum leading to a total
7 Clearworld Energy has since merged with CAMCO AG to form CAMCO International Limited and CAMCO International is now acting on behalf of Anhui Conch Cement Company Limited to develop this project under the CDM.
PROJECT DESIGN DOCUMENT FORM (CDM PDD) - Version 03 CDM – Executive Board page 10
This template shall not be altered. It shall be completed without modifying/adding headings or logo, format or font.
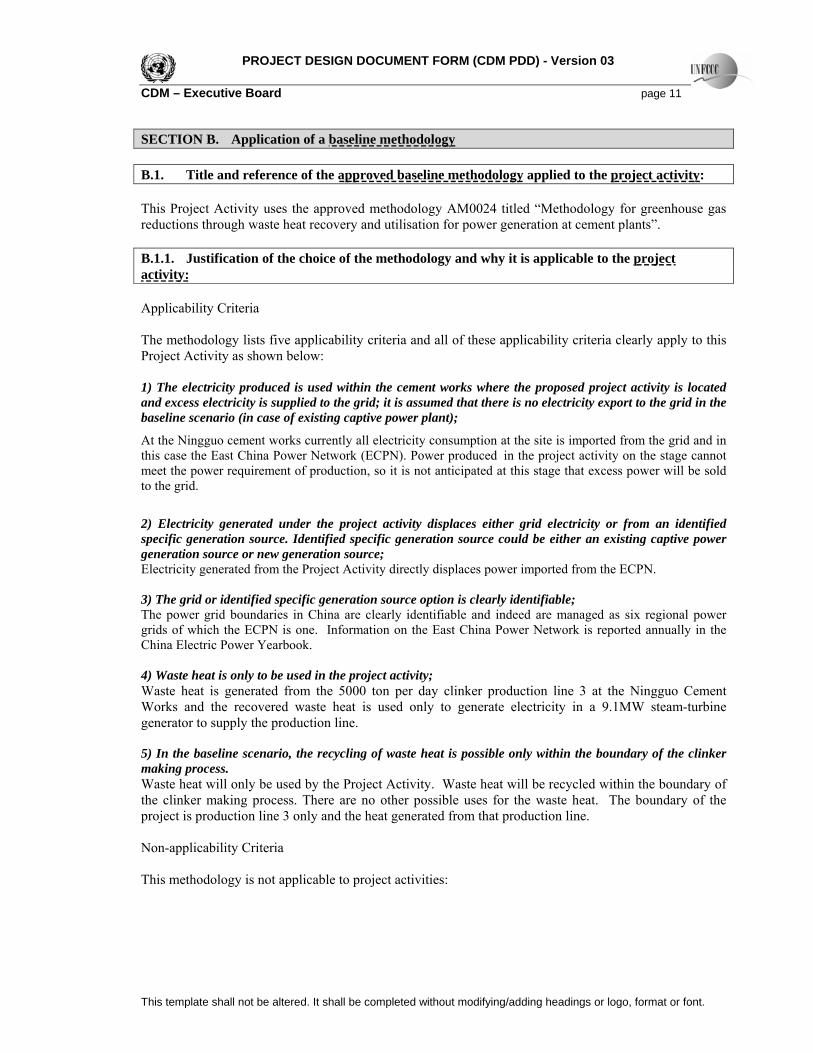
reduction of 0.582 million tons CO2 equivalent over the 10 year crediting lifetime. Table 2 outlines when the emission reductions are planned to occur.
Table 2. Emission Reductions from the Project Activity over the crediting period
Year Annual Estimated Reductions in tCO2/a
Year 1 55,897 Year 2 55,897 Year 3 55,897 Year 4 55,897 Year 5 55,897 Year 6 55,897 Year 7 55,897 Year 8 55,897 Year 9 55,897
Year 10 55,897
total estimated reductions (in tons of CO2) 558,970
Number of years in crediting period 10
annual average of estimate reductions over crediting period 55,897
A.4.5. Public funding of the project activity: There is no public funding of the Project Activity from an Annex 1 Party.
PROJECT DESIGN DOCUMENT FORM (CDM PDD) - Version 03 CDM – Executive Board page 11
This template shall not be altered. It shall be completed without modifying/adding headings or logo, format or font.
SECTION B. Application of a baseline methodology B.1. Title and reference of the approved baseline methodology applied to the project activity: This Project Activity uses the approved methodology AM0024 titled “Methodology for greenhouse gas reductions through waste heat recovery and utilisation for power generation at cement plants”. B.1.1. Justification of the choice of the methodology and why it is applicable to the project activity: Applicability Criteria The methodology lists five applicability criteria and all of these applicability criteria clearly apply to this Project Activity as shown below: 1) The electricity produced is used within the cement works where the proposed project activity is located and excess electricity is supplied to the grid; it is assumed that there is no electricity export to the grid in the baseline scenario (in case of existing captive power plant);
At the Ningguo cement works currently all electricity consumption at the site is imported from the grid and in this case the East China Power Network (ECPN). Power produced in the project activity on the stage cannot meet the power requirement of production, so it is not anticipated at this stage that excess power will be sold to the grid.
2) Electricity generated under the project activity displaces either grid electricity or from an identified specific generation source. Identified specific generation source could be either an existing captive power generation source or new generation source; Electricity generated from the Project Activity directly displaces power imported from the ECPN. 3) The grid or identified specific generation source option is clearly identifiable; The power grid boundaries in China are clearly identifiable and indeed are managed as six regional power grids of which the ECPN is one. Information on the East China Power Network is reported annually in the China Electric Power Yearbook. 4) Waste heat is only to be used in the project activity; Waste heat is generated from the 5000 ton per day clinker production line 3 at the Ningguo Cement Works and the recovered waste heat is used only to generate electricity in a 9.1MW steam-turbine generator to supply the production line. 5) In the baseline scenario, the recycling of waste heat is possible only within the boundary of the clinker making process. Waste heat will only be used by the Project Activity. Waste heat will be recycled within the boundary of the clinker making process. There are no other possible uses for the waste heat. The boundary of the project is production line 3 only and the heat generated from that production line. Non-applicability Criteria This methodology is not applicable to project activities:
PROJECT DESIGN DOCUMENT FORM (CDM PDD) - Version 03 CDM – Executive Board page 12
This template shall not be altered. It shall be completed without modifying/adding headings or logo, format or font.
1)Where the current use of waste heat or the identified alternative business as usual use of waste heat is located outside of the clinker making process In the case of the project activity the current use of waste heat is generated from the PH boiler on the line 3 of the Ningguo Cement Works, which is located within the project boundary, and within the clinker making process. 2)That affect process emissions from cement plants The clinker making process is a chemical process with pre-determined material inputs. Therefore the project activity will not affect project emissions and the entire volume of waste heat is a by-product of the process. B.2. Description of how the methodology is applied in the context of the project activity: The AM0024 methodology has been applied to the Project Activity in the following key steps:
M1. A three step process has been followed to determine the baseline scenario as outlined in the methodology
M2. A six step process (steps 0,1,2,3,4,5) has been followed to demonstrate the additionality of the Project Activity as per the “tool for the demonstration and assessment of additionality” published by the CDM Executive Board
M3. A series of calculations have been carried out to determine the emissions reduction of the Project Activity versus the baseline as per the Approved Methodology.
M1 is outlined below, M2 is applied in section B3 and M3 is also outlined in B3 with additional supporting calculations included in Annex 3. Step M1. Identification of the Baseline Scenario Step M1.1 Determination of technically feasible alternatives to the Project Activity Step M1.1A - According to the Approved Methodology, the first step in determining the baseline scenario is to identify and list within the local context, the current business as usual utilisation of and alternative technically feasible options for waste heat utilisation. The current situation at Line 3 of the Ningguo Cement Works is that most of the waste heat from the kilns is vented to atmosphere and some is re-circulated to pre-heat the raw materials and coal prior to entering the milling machines. The Regional Design Institute that is responsible for the Project Activity has confirmed that to the best of their industry knowledge venting the waste heat is the typical baseline for cement plant in China. They have confirmed that some advanced cement plant designs, like the Ningguo Cement Works, include re-circulation of a small proportion of waste heat from cement production to the pre-heater air for coal and raw materials milling. After the Project Activity is implemented, the waste heat will still be re-circulated to these milling processes but from the exhaust of the heat recovery boilers fitted as part of the Project Activity instead. There are no other potential demands for additional waste heat. The surrounding area is farmland, there is no industry close to the site and it is 18km to the centre of Ningguo. There is residential housing 2 km from the site for staff, but it is not economic to develop this potential heat load and indeed it is not
PROJECT DESIGN DOCUMENT FORM (CDM PDD) - Version 03 CDM – Executive Board page 13
This template shall not be altered. It shall be completed without modifying/adding headings or logo, format or font.
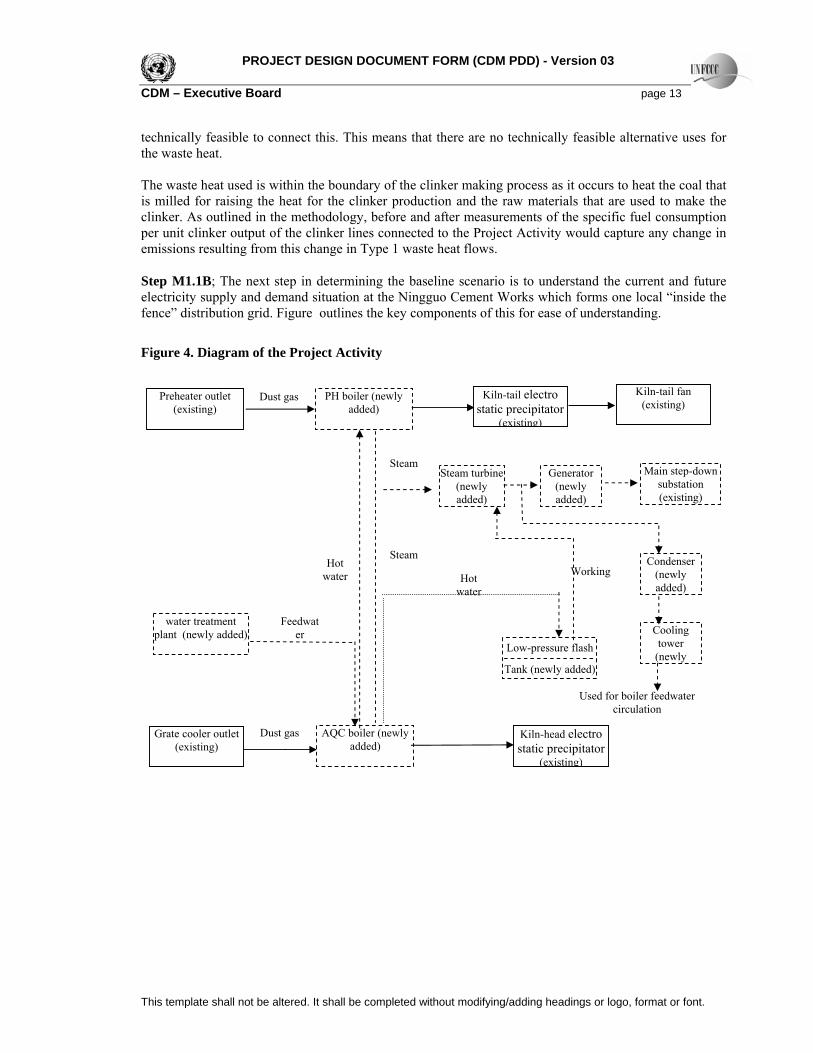
technically feasible to connect this. This means that there are no technically feasible alternative uses for the waste heat. The waste heat used is within the boundary of the clinker making process as it occurs to heat the coal that is milled for raising the heat for the clinker production and the raw materials that are used to make the clinker. As outlined in the methodology, before and after measurements of the specific fuel consumption per unit clinker output of the clinker lines connected to the Project Activity would capture any change in emissions resulting from this change in Type 1 waste heat flows. Step M1.1B; The next step in determining the baseline scenario is to understand the current and future electricity supply and demand situation at the Ningguo Cement Works which forms one local “inside the fence” distribution grid. Figure outlines the key components of this for ease of understanding.
Figure 4. Diagram of the Project Activity
Used for boiler feedwater circulation
Working
Dust gas
Hot water
Preheater outlet (existing)
PH boiler (newly added)
AQC boiler (newly added)
Steam
Grate cooler outlet (existing)
Dust gas
Steam turbine (newly added)
Main step-down substation (existing)
Kiln-tail fan (existing)
Kiln-head electro static precipitator
(existing)
water treatment plant (newly added)
Kiln-tail electro static precipitator
(existing)
Low-pressure flash
Tank (newly added)
Generator (newly added)
Condenser (newly added)
Cooling tower
(newly
Hot water
Steam
Feedwater
PROJECT DESIGN DOCUMENT FORM (CDM PDD) - Version 03 CDM – Executive Board page 14
This template shall not be altered. It shall be completed without modifying/adding headings or logo, format or font.
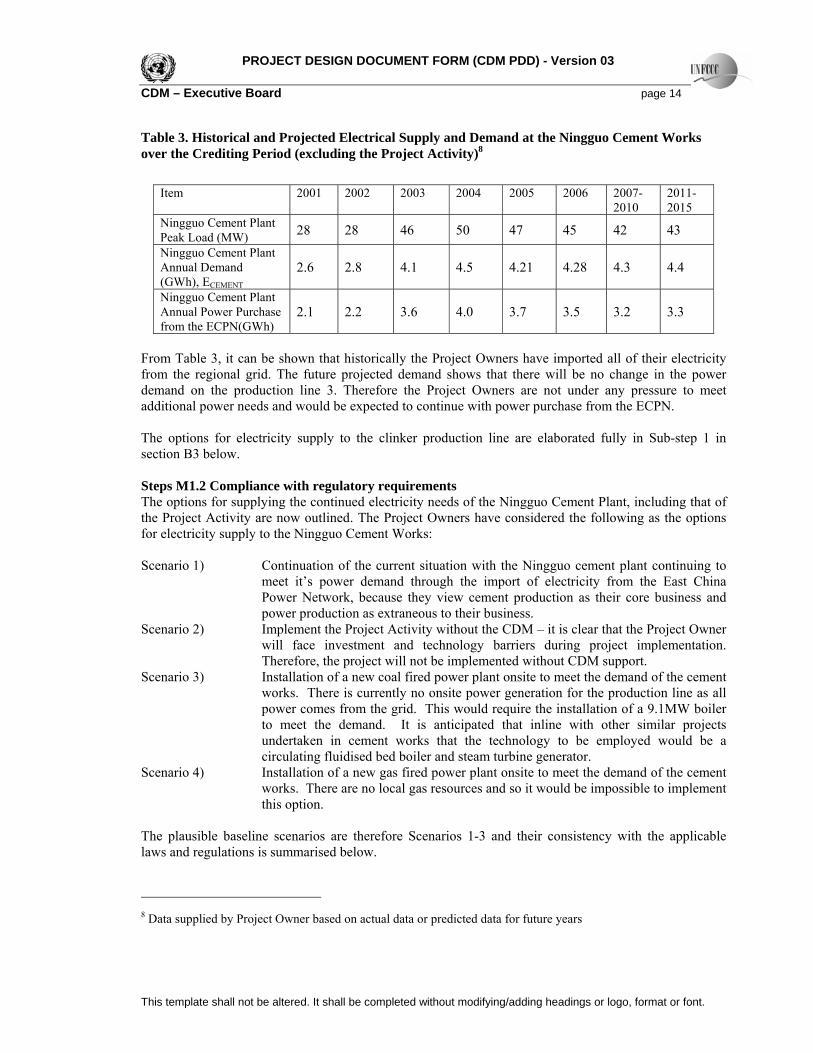
Table 3. Historical and Projected Electrical Supply and Demand at the Ningguo Cement Works over the Crediting Period (excluding the Project Activity)8
Item 2001 2002 2003 2004 2005 2006 2007-
2010 2011-2015
Ningguo Cement Plant Peak Load (MW) 28 28 46 50 47 45 42 43
Ningguo Cement Plant Annual Demand (GWh), ECEMENT
2.6 2.8 4.1 4.5 4.21 4.28 4.3 4.4
Ningguo Cement Plant Annual Power Purchase from the ECPN(GWh)
2.1 2.2 3.6 4.0 3.7 3.5 3.2 3.3
From Table 3, it can be shown that historically the Project Owners have imported all of their electricity from the regional grid. The future projected demand shows that there will be no change in the power demand on the production line 3. Therefore the Project Owners are not under any pressure to meet additional power needs and would be expected to continue with power purchase from the ECPN. The options for electricity supply to the clinker production line are elaborated fully in Sub-step 1 in section B3 below. Steps M1.2 Compliance with regulatory requirements The options for supplying the continued electricity needs of the Ningguo Cement Plant, including that of the Project Activity are now outlined. The Project Owners have considered the following as the options for electricity supply to the Ningguo Cement Works: Scenario 1) Continuation of the current situation with the Ningguo cement plant continuing to
meet it’s power demand through the import of electricity from the East China Power Network, because they view cement production as their core business and power production as extraneous to their business.
Scenario 2) Implement the Project Activity without the CDM – it is clear that the Project Owner will face investment and technology barriers during project implementation. Therefore, the project will not be implemented without CDM support.
Scenario 3) Installation of a new coal fired power plant onsite to meet the demand of the cement works. There is currently no onsite power generation for the production line as all power comes from the grid. This would require the installation of a 9.1MW boiler to meet the demand. It is anticipated that inline with other similar projects undertaken in cement works that the technology to be employed would be a circulating fluidised bed boiler and steam turbine generator.
Scenario 4) Installation of a new gas fired power plant onsite to meet the demand of the cement works. There are no local gas resources and so it would be impossible to implement this option.
The plausible baseline scenarios are therefore Scenarios 1-3 and their consistency with the applicable laws and regulations is summarised below.
8 Data supplied by Project Owner based on actual data or predicted data for future years
PROJECT DESIGN DOCUMENT FORM (CDM PDD) - Version 03 CDM – Executive Board page 15
This template shall not be altered. It shall be completed without modifying/adding headings or logo, format or font.
Scenario 1) This is clearly consistent with prevailing laws and regulations. According to the regulation and policies currently governing the Chinese power market, the East China Power Network will have to guarantee power to meet the demand of the growing industrial and commercial sectors of the region.
Scenario 2) This scenario is consistent with prevailing laws and regulations and as such the project feasibility study was officially approved on the 15th August 2005.
Scenario 3) Coal fired power plants of less than 50MW cannot be constructed under Chinese national regulations. Indeed power plants of less than 200MW will not generally gain approval by the authorities. Moreover the National Development and Reform Committee has an official programme of closures of small scale thermal power generation units. This policy is being implemented to improve the efficiency of power generation and as such, small scale generation cannot be considered an option for the Ningguo cement works.9
Given that Scenario 3 cannot be considered under current laws and regulations, the only options available to the cement plant are therefore Scenarios 1 to 2. This means that they either continue to purchase power from the grid or they undertake the project activity with or without the CDM. Step M1.3 Undertake economic analysis of all options that meet the regulatory requirements Economic Analysis of all Scenarios: Scenario 1) In scenario 1 Conch would continue to purchase power from the ECPN and would use
their free capital to invest in their core business. As such the anticipated IRR for a new investment in the cement sector is used for this scenario. From publicly available data, it can be seen that a typical cement sector project in China would be likely to generate a project IRR of 18-20%, this would therefore be the benchmark for comparison with other scenarios.
Scenario 2) The investment returns of this scenario have been calculated on the basis of money saved
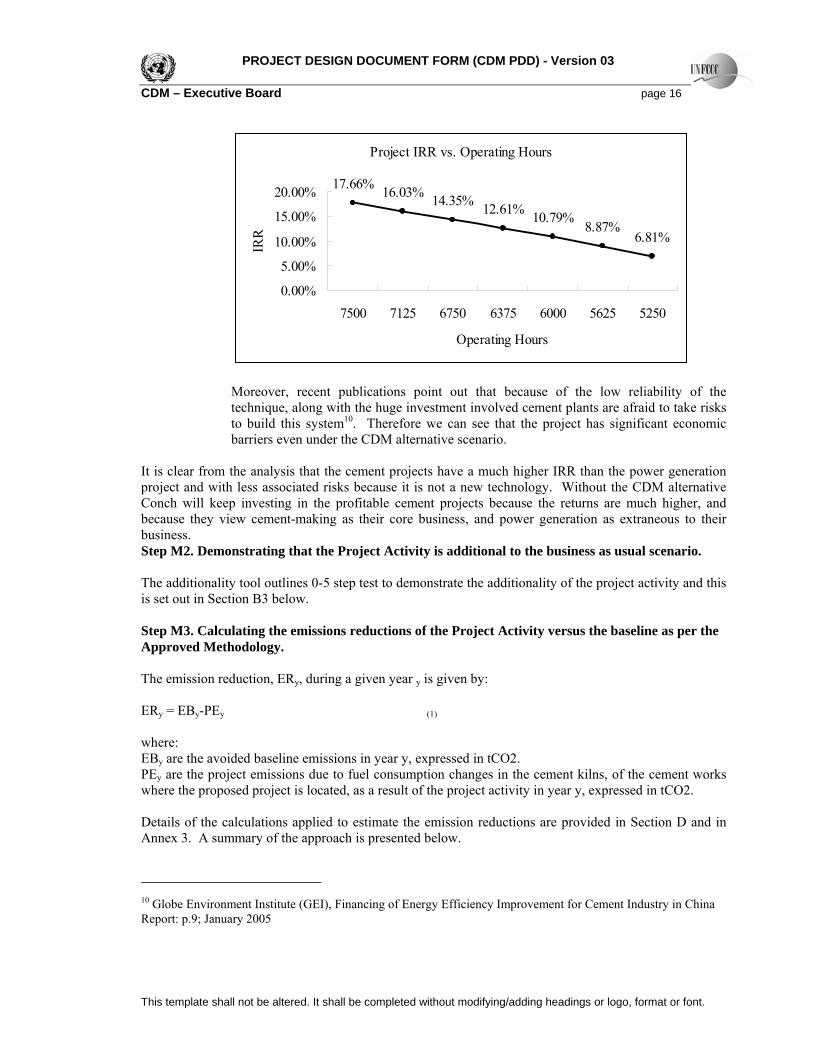
on not purchasing the power from the grid. This analysis can also serve as a comparison between Scenario 1 and Scenario 2. The economic analysis of the project activity showed that the IRR is extremely vulnerable to the amount of hours that equipment will be in operation. Since the technology employed will be unfamiliar to the operators, it is safe to assume that the project equipment will be operated at an average of 6000 hours a year, at least for the first few years of the project activity. The correlation between IRR and operating hours can be seen in the chart below:
9 National Development and Reform Committee Office Document, “Fa Gai Ban (energy), 2006 #392”
PROJECT DESIGN DOCUMENT FORM (CDM PDD) - Version 03 CDM – Executive Board page 16
This template shall not be altered. It shall be completed without modifying/adding headings or logo, format or font.
Project IRR vs. Operating Hours
17.66% 16.03% 14.35%10.79%
8.87%6.81%
12.61%
0.00%
5.00%
10.00%
15.00%
20.00%
7500 7125 6750 6375 6000 5625 5250
Operating Hours
IRR
Moreover, recent publications point out that because of the low reliability of the technique, along with the huge investment involved cement plants are afraid to take risks to build this system10. Therefore we can see that the project has significant economic barriers even under the CDM alternative scenario.
It is clear from the analysis that the cement projects have a much higher IRR than the power generation project and with less associated risks because it is not a new technology. Without the CDM alternative Conch will keep investing in the profitable cement projects because the returns are much higher, and because they view cement-making as their core business, and power generation as extraneous to their business. Step M2. Demonstrating that the Project Activity is additional to the business as usual scenario. The additionality tool outlines 0-5 step test to demonstrate the additionality of the project activity and this is set out in Section B3 below. Step M3. Calculating the emissions reductions of the Project Activity versus the baseline as per the Approved Methodology. The emission reduction, ERy, during a given year y is given by: ERy = EBy-PEy (1) where: EBy are the avoided baseline emissions in year y, expressed in tCO2. PEy are the project emissions due to fuel consumption changes in the cement kilns, of the cement works where the proposed project is located, as a result of the project activity in year y, expressed in tCO2. Details of the calculations applied to estimate the emission reductions are provided in Section D and in Annex 3. A summary of the approach is presented below.
10 Globe Environment Institute (GEI), Financing of Energy Efficiency Improvement for Cement Industry in China Report: p.9; January 2005
PROJECT DESIGN DOCUMENT FORM (CDM PDD) - Version 03 CDM – Executive Board page 17
This template shall not be altered. It shall be completed without modifying/adding headings or logo, format or font.
Baseline Emissions, EBy Baseline emissions are emissions from electricity generation source(s) that would have supplied to the cement works, which would have otherwise been generated by the operation of grid-connected power plants in the absence of the proposed CDM project. The baseline emissions during a given year y are calculated as: EBy=EGCP,y* EFGrid, y +EGgrid,y*EFgrid,y (2) where: EGCP,y is the electricity supplied from the project activity to the cement plant , expressed in MWh; EFGrid, y is the emissions factor of the electricity grid, expressed as tCO2 / MWh. EGGrid, y is the electricity supplied from the project activity to the grid , expressed in MWh; EGCP,y will be monitored annually and for the purposes of an ex-ante evaluation has been estimated with an 82% capacity factor that equates to 65,100 MWh. EFGrid, y has been calculated ex-ante using the ACM0002 methodology and is detailed in Annex 3. EGGrid, y is not relevant to this project as no electricity will be exported to the grid. Project Emissions, PEy Project emissions (PEy) are the difference in CO2 emission from use of fossil fuel in the clinker making process in cement manufacturing unit, where the project is being implemented, before and after the project implementation. This is given by the equations below; PEy = (EIP ,y - EIB ) * Oclinker,y * COEFfuel,y (3) where: EIB is the baseline energy consumption per unit output of clinker in TJ/ton of clinker produced
(i.e. measured before the Project activity goes into operation). EIP,y is the ex-post energy consumption per unit output of clinker for given year, y, in TJ/ton of
clinker produced. COEFfuel is the carbon coefficient (tCO2 / TJ of input fuel) of the fuel used in the cement works to
raise the necessary heat for clinker production. Oclinker,y Is the clinker output of the cement works in a given year y. For this Project Activity, the EIB is the measured baseline energy consumption per unit output of clinker in TJ/ton of clinker. The measured values are seen in Table A5 of Annex 3 and is calculated to be 0.00313. TJ / ton Clinker. This is based on 2005’s measured data for the 5000 ton per day clinker line. Determination of Operating Margin and Build Margin (OM & BM) EF (tCO2/MWh) = (EFOM + EFBM) / 2 (4) The Operating Margin emission factor (EFOMy) is the generation-weighted average emissions per electricity unit of all generating sources serving the system, excluding zero or low-operating cost and must run power plants. It is calculated ex ante using a 3-year average, based on the most recent statistics at the time of PDD submission and is calculated using the following equation:
PROJECT DESIGN DOCUMENT FORM (CDM PDD) - Version 03 CDM – Executive Board page 18
This template shall not be altered. It shall be completed without modifying/adding headings or logo, format or font.
EFOM (tCO2/MWh) = (FSCE * CEFSCE ) * 1/1000 (5) Where: FSCE (tSCE /GWh) is the annual total fuel consumption for power generated on the East China Power Network expressed in tonnes of Standard Coal Equivalent11 per unit of generated power; CEFSCE (tCO2/tSCE) is CO2 emission factor for fuel used for power generation in the East China Power Network expressed per unit of Standard Coal Equivalent.
The CO2 emission factor for Standard Coal CEF is calculated as: CEFSCE (tCO2/tSCE) = NCVSCE * (CCi * OXIDi * 44/12) * 1/1000 (6) Where: NCVSCE (GJ/tSCE) is the net calorific value of Standard Coal as obtained from the General Code for Comprehensive Energy Consumption Calculation (Chinese National Standard GB2589-81); CCi (tC/TJ) is the average carbon content for fuel i12 used to generate power in the East China Power Network derived from IPCC default values for fuel carbon contents13; OXIDi is national standard fuel oxidation factor for coal14 in China; and 44/12 is the carbon conversion factor from tonnes of C to tonnes of CO2. The Build Margin is the weighted average emission factor of the 20% most recent power plants built15. The Build Margin emission factor is derived from the following equation: EFBM (tCO2/MWh) = [ ∑i, (EFi, * Wi)] (7) Where: Wi is the split according to fuel type of new capacity (%) amongst the 20% most recent plants built; and EFi, are the emissions factors of new plants of fuel type i included in the 20% most recent additions to the ECPN. The determination of the emission factor of new plants of fuel type i is calculated according to the best available technology targets for China, rather than to the average of operating power plants. 11 China typically converts all its energy statistics into “metric tons of standard coal equivalent” (tSCE). One ton of standard coal equivalent provides between 29.31 GJ/tSCE (low calorific value) and 31.52 GJ/tSCE (high calorific value). Reference available online at http://www.nap.edu/books/0309068878/html/92.html 12 In the East China Power Network excluding the low-cost, must run sources, the principal fuel used to generate power is coal. A small amount of oil is also used. However, CO2 emissions from oil comprise of less than 2.5% of total CO2 emissions from thermal power plants on the ECPN so for the purposes of this calculation it is assumed that coal is the only fuel used. 13 Table 1-2; Revised 1996 IPCC Guidelines for National Greenhouse Gas Inventories : Workbook 14 Revised 1996 IPCC Guidelines for National Greenhouse Gas Inventories : Workbook (Table 1-4) 15 Since the published data for China is reported as aggregated data rather than by each individual generating unit, the capacity to be included in the Build Margin is identified by direct comparison of two reporting years where the difference between the two years is approximately 20% of the most recent year. The following equation is being used to determine the reference year: % Recent Capacity Additions = [(C2004 - C n)/ C 2004]* 100 Where: C2004 is the capacity in 2004; and C n is the capacity in the reference year n.
PROJECT DESIGN DOCUMENT FORM (CDM PDD) - Version 03 CDM – Executive Board page 19
This template shall not be altered. It shall be completed without modifying/adding headings or logo, format or font.
The plants emissions factor of new plants is calculated according to the following equation: EFi (tCO2/MWh) = (FBAT * CEFSCE ) * 1/1000 (8) Where: FBAT (tSCE /GWh) is the Chinese 2020 target for fuel consumption efficiency for Best Available Technology expressed in tonnes of Standard Coal Equivalent16 per unit of generated power; CEFSCE (tCO2/tSCE) is CO2 emission factor for fuel used for power generation in the East China Power Network expressed in tonnes of Standard Coal Equivalent. The CO2 emission factor for Standard Coal is calculated as per the Operating Margin. The tables in Annex 3 show the results from the application of these equations and provide a further explanation of how these are derived and applied. The balance of electricity imports to and exports from the East China Power Network compared to the overall generation on the grid is such that a correction to the grid emission factor is considered unnecessary and is therefore omitted from the monitoring protocol. Ex-ante estimate of Emission Reductions The net electricity generated from the Project Activity is based on the Feasibility Report which states the capacity factor of the new plant will be 82% and therefore 7154 full load hours. Once fully commissioned the cement production line will run at an approximate load factor of 82%. Due to the nature of the clinker making process power production is entirely dependent upon the output of clinker and this load factor will therefore be limited by the production of the cement works. Cement production in China more than doubled in the past five years, reaching 1.06 billion tons last year. Due to a booming construction sector. However since 2004, the government had imposed macro control measures and asked for restructuring in the sector, which has been saddled by overcapacity, falling building material prices and rising fuel costs. Whilst it is expected that the Ningguo cement works will fare well in the restructuring due to the fact that they employ an advanced dry process which produces a high quality product, foreign companies are also taking a larger stake in the Chinese market. These factors are increasing the uncertainties in future clinker production at Ningguo and other cement works. This load factor o the new facility therefore has the same related uncertainties. Overall the ex-ante estimate of emission reductions from a full year’s operation of the Project can be calculated as: Full Year Electricity Supply (MWh): 65,100 Baseline Emissions Factor (tCO2 / MWh): 0.859 A) Avoided Baseline Emissions (tCO2): 55,897 16 BAT: China's target efficiency for 2010 (http://www.ccchina.gov.cn/source/fa/fa2002082803)
PROJECT DESIGN DOCUMENT FORM (CDM PDD) - Version 03 CDM – Executive Board page 20
This template shall not be altered. It shall be completed without modifying/adding headings or logo, format or font.
B) Ex-ante estimate of Project Emissions (tCO2): 0 Yearly Emission Reductions (tCO2) = A – B = 55,897 Over a ten year crediting period, this equates to an emission reduction of 580,180 tCO2. B.3. Description of how the anthropogenic emissions of GHG by sources are reduced below those that would have occurred in the absence of the registered CDM project activity: The anthropogenic emissions of GHG by sources are reduced below those that would have occurred in the absence of the registered CDM Project Activity because, in the absence of additional revenues from the CDM, a more economically attractive baseline scenario would have been implemented which has higher emissions. This baseline scenario is continuation of power purchase from the East China Power Network. The ECPN, according to the ACM002 methodology that weights the build margin and the operating margin equally, has an emission factor of 0.859 tCO2eq/MWh leading to baseline emissions of 55,897 tCO2 per full year of operation. The Project Activity does not have any project emissions due to the changes in fuel consumption of the clinker line, power generation can be though of as a by-product of the heat generation facility and as such the plant will not increase the coal consumption for the project. Power will be generated only according to the heat demand. Indeed power production will be entirely dependent on cement production as two are directly correlated. The difference between the baseline energy consumption per unit of clinker in 2005 will be compared to the energy consumption per unit of clinker for the Project Activity on an annual basis. Any change will be used to calculate the project emissions. The net emission reductions are therefore the avoided baseline emissions minus the project emissions minus leakage emissions (which are zero) and this gives emission reductions of 55,897 tCO2 per full year operation. The “Tool for the demonstration of additionality” agreed by the CDM Executive Board, available at the UNFCCC website17 to demonstrate that the Project Activity is additional has been applied below and shows that the baseline scenario is the continuation of power purchase from the ECPN. Sub-step 0. Preliminary Screening based on the starting date of the project activity. The Project Participants are proposing a start date for the crediting period which is after the date of registration of the Project Activity and therefore this Step is not applicable. Sub-step 1. Identification of alternatives to the project activity consistent with current laws and regulations. Please refer to step M1.2 above that demonstrates that the only options available to the cement plant are that they either continue to purchase power from the grid or they undertake the project activity with or without the CDM. These are Scenarios 1 and 2 below.
Scenario 1) Continuation of the current situation with the Ningguo cement plant continuing to meet it’s power demand through the import of electricity from the East China Power Network.
17 http://cdm.unfccc.int/methodologies/PAmethodologies/approved.htm
PROJECT DESIGN DOCUMENT FORM (CDM PDD) - Version 03 CDM – Executive Board page 21
This template shall not be altered. It shall be completed without modifying/adding headings or logo, format or font.
Scenario 2) Implement the Project Activity without the CDM – it is clear that this is not an option the Project Owner is considering. The Project Owner believes that they have a reasonable case for applying for CDM support.
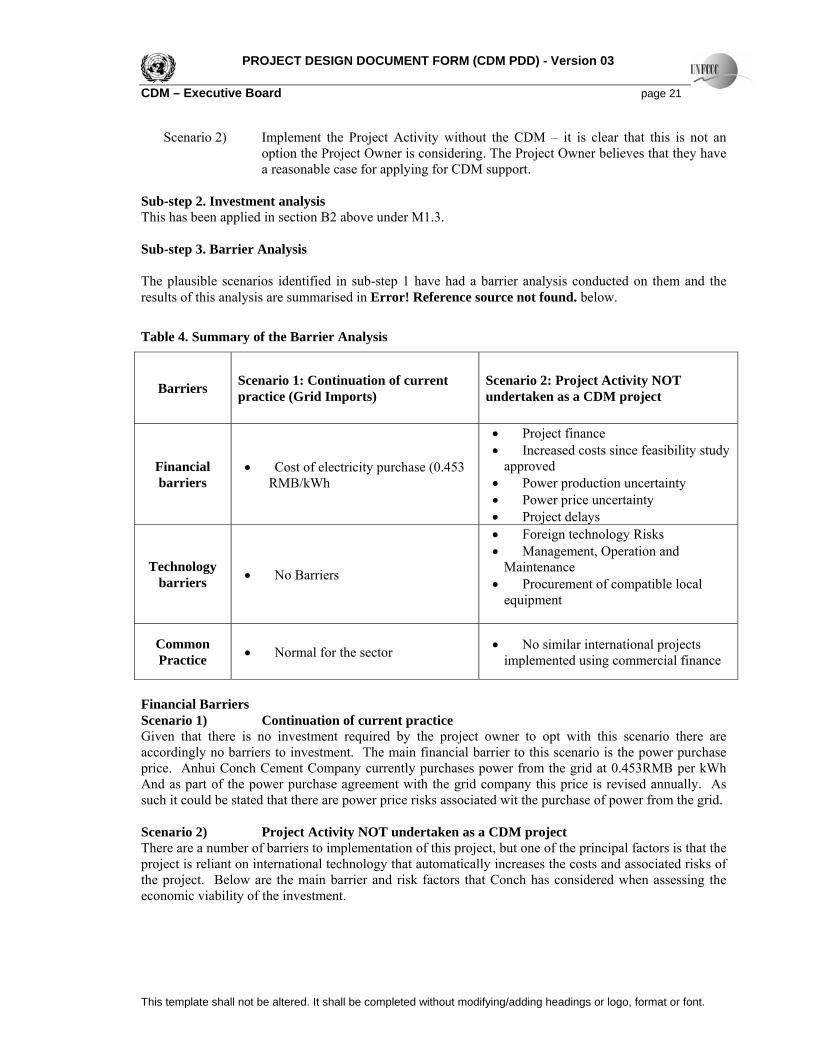
Sub-step 2. Investment analysis This has been applied in section B2 above under M1.3. Sub-step 3. Barrier Analysis The plausible scenarios identified in sub-step 1 have had a barrier analysis conducted on them and the results of this analysis are summarised in Error! Reference source not found. below.
Table 4. Summary of the Barrier Analysis
Barriers Scenario 1: Continuation of current practice (Grid Imports)
Scenario 2: Project Activity NOT undertaken as a CDM project
Financial barriers
• Cost of electricity purchase (0.453 RMB/kWh
• Project finance • Increased costs since feasibility study
approved • Power production uncertainty • Power price uncertainty • Project delays
Technology barriers • No Barriers
• Foreign technology Risks • Management, Operation and
Maintenance • Procurement of compatible local
equipment
Common Practice • Normal for the sector • No similar international projects
implemented using commercial finance
Financial Barriers Scenario 1) Continuation of current practice Given that there is no investment required by the project owner to opt with this scenario there are accordingly no barriers to investment. The main financial barrier to this scenario is the power purchase price. Anhui Conch Cement Company currently purchases power from the grid at 0.453RMB per kWh And as part of the power purchase agreement with the grid company this price is revised annually. As such it could be stated that there are power price risks associated wit the purchase of power from the grid. Scenario 2) Project Activity NOT undertaken as a CDM project There are a number of barriers to implementation of this project, but one of the principal factors is that the project is reliant on international technology that automatically increases the costs and associated risks of the project. Below are the main barrier and risk factors that Conch has considered when assessing the economic viability of the investment.
PROJECT DESIGN DOCUMENT FORM (CDM PDD) - Version 03 CDM – Executive Board page 22
This template shall not be altered. It shall be completed without modifying/adding headings or logo, format or font.
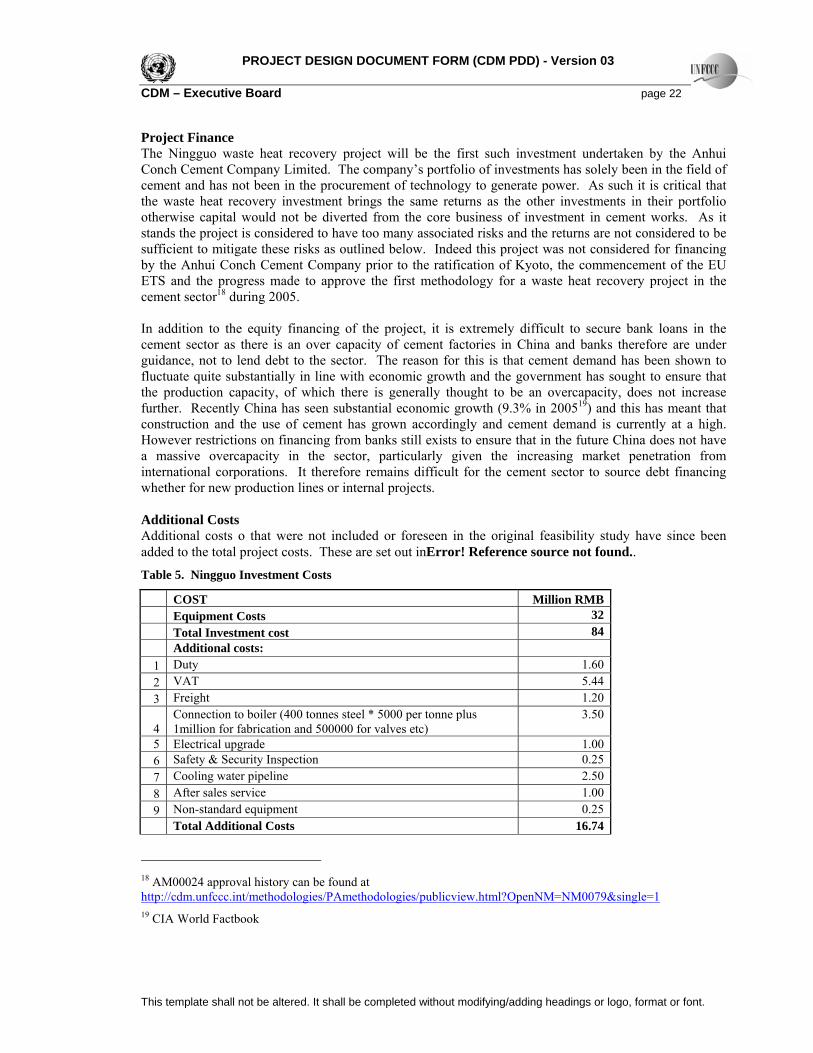
Project Finance The Ningguo waste heat recovery project will be the first such investment undertaken by the Anhui Conch Cement Company Limited. The company’s portfolio of investments has solely been in the field of cement and has not been in the procurement of technology to generate power. As such it is critical that the waste heat recovery investment brings the same returns as the other investments in their portfolio otherwise capital would not be diverted from the core business of investment in cement works. As it stands the project is considered to have too many associated risks and the returns are not considered to be sufficient to mitigate these risks as outlined below. Indeed this project was not considered for financing by the Anhui Conch Cement Company prior to the ratification of Kyoto, the commencement of the EU ETS and the progress made to approve the first methodology for a waste heat recovery project in the cement sector18 during 2005. In addition to the equity financing of the project, it is extremely difficult to secure bank loans in the cement sector as there is an over capacity of cement factories in China and banks therefore are under guidance, not to lend debt to the sector. The reason for this is that cement demand has been shown to fluctuate quite substantially in line with economic growth and the government has sought to ensure that the production capacity, of which there is generally thought to be an overcapacity, does not increase further. Recently China has seen substantial economic growth (9.3% in 200519) and this has meant that construction and the use of cement has grown accordingly and cement demand is currently at a high. However restrictions on financing from banks still exists to ensure that in the future China does not have a massive overcapacity in the sector, particularly given the increasing market penetration from international corporations. It therefore remains difficult for the cement sector to source debt financing whether for new production lines or internal projects. Additional Costs Additional costs o that were not included or foreseen in the original feasibility study have since been added to the total project costs. These are set out inError! Reference source not found..
Table 5. Ningguo Investment Costs
COST Million RMB Equipment Costs 32 Total Investment cost 84 Additional costs:
1 Duty 1.60 2 VAT 5.44 3 Freight 1.20
4 Connection to boiler (400 tonnes steel * 5000 per tonne plus 1million for fabrication and 500000 for valves etc)
3.50
5 Electrical upgrade 1.00 6 Safety & Security Inspection 0.25 7 Cooling water pipeline 2.50 8 After sales service 1.00 9 Non-standard equipment 0.25
Total Additional Costs 16.74
18 AM00024 approval history can be found at http://cdm.unfccc.int/methodologies/PAmethodologies/publicview.html?OpenNM=NM0079&single=1 19 CIA World Factbook
PROJECT DESIGN DOCUMENT FORM (CDM PDD) - Version 03 CDM – Executive Board page 23
This template shall not be altered. It shall be completed without modifying/adding headings or logo, format or font.
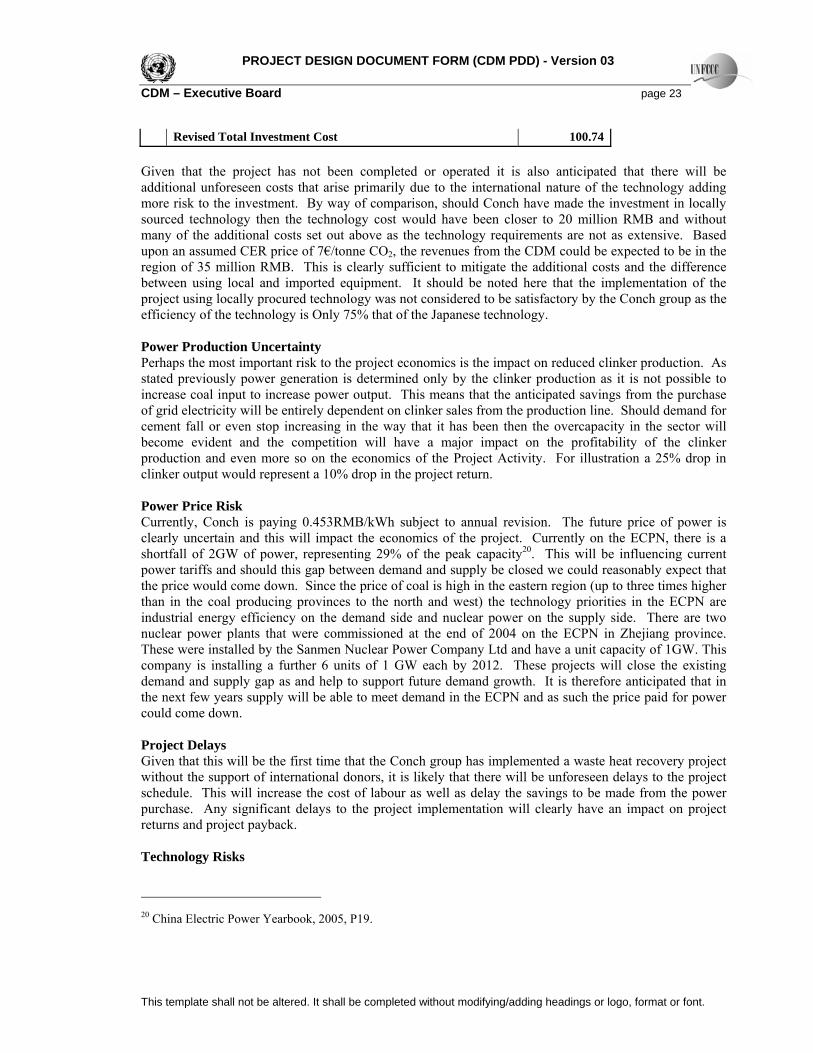
Revised Total Investment Cost 100.74 Given that the project has not been completed or operated it is also anticipated that there will be additional unforeseen costs that arise primarily due to the international nature of the technology adding more risk to the investment. By way of comparison, should Conch have made the investment in locally sourced technology then the technology cost would have been closer to 20 million RMB and without many of the additional costs set out above as the technology requirements are not as extensive. Based upon an assumed CER price of 7€/tonne CO2, the revenues from the CDM could be expected to be in the region of 35 million RMB. This is clearly sufficient to mitigate the additional costs and the difference between using local and imported equipment. It should be noted here that the implementation of the project using locally procured technology was not considered to be satisfactory by the Conch group as the efficiency of the technology is Only 75% that of the Japanese technology. Power Production Uncertainty Perhaps the most important risk to the project economics is the impact on reduced clinker production. As stated previously power generation is determined only by the clinker production as it is not possible to increase coal input to increase power output. This means that the anticipated savings from the purchase of grid electricity will be entirely dependent on clinker sales from the production line. Should demand for cement fall or even stop increasing in the way that it has been then the overcapacity in the sector will become evident and the competition will have a major impact on the profitability of the clinker production and even more so on the economics of the Project Activity. For illustration a 25% drop in clinker output would represent a 10% drop in the project return. Power Price Risk Currently, Conch is paying 0.453RMB/kWh subject to annual revision. The future price of power is clearly uncertain and this will impact the economics of the project. Currently on the ECPN, there is a shortfall of 2GW of power, representing 29% of the peak capacity20. This will be influencing current power tariffs and should this gap between demand and supply be closed we could reasonably expect that the price would come down. Since the price of coal is high in the eastern region (up to three times higher than in the coal producing provinces to the north and west) the technology priorities in the ECPN are industrial energy efficiency on the demand side and nuclear power on the supply side. There are two nuclear power plants that were commissioned at the end of 2004 on the ECPN in Zhejiang province. These were installed by the Sanmen Nuclear Power Company Ltd and have a unit capacity of 1GW. This company is installing a further 6 units of 1 GW each by 2012. These projects will close the existing demand and supply gap as and help to support future demand growth. It is therefore anticipated that in the next few years supply will be able to meet demand in the ECPN and as such the price paid for power could come down. Project Delays Given that this will be the first time that the Conch group has implemented a waste heat recovery project without the support of international donors, it is likely that there will be unforeseen delays to the project schedule. This will increase the cost of labour as well as delay the savings to be made from the power purchase. Any significant delays to the project implementation will clearly have an impact on project returns and project payback. Technology Risks
20 China Electric Power Yearbook, 2005, P19.
PROJECT DESIGN DOCUMENT FORM (CDM PDD) - Version 03 CDM – Executive Board page 24
This template shall not be altered. It shall be completed without modifying/adding headings or logo, format or font.
In addition to the above there is substantial technology risk that needs to be mitigated in order for the Conch group to deploy the required capital. These are outlined below in the technology barriers. Without the CDM revenues and the additional benefits that the CDM brings to the company it is unlikely that the project would meet the financing criteria of Anhui Conch Cement Company and therefore unlikely that the company would have gone ahead with the investment. Furthermore the additional costs that have become evident since the approval of the project feasibility study poses significant risk on both the financial viability of the project as well as the success of the project going forward. Technological Barriers Scenario 1) Continuation of current practice There are no technology barriers to the continuation of current practice. Scenario 2) Project Activity NOT undertaken as a CDM project Foreign Technology Risk This Project is the first commercial project to be implemented in the Chinese cement sector using internationally sourced equipment. There have only been two projects carried out in the sector using the same technology, these have been entirely grant financed through a programme implemented by the Japanese Government in 1998 as is the case for Line 1 of the Ningguo plant. Despite the experience with the first waste heat recovery project at Ningguo the Project Activity has required additional international consultancy on both the technical commissioning of the plant and will also require additional training of key management and operational staff due to the international nature of the technology. As with all international technology transfer projects the transaction cost is high and the requirement for ongoing training for the new technology should not be underestimated. The continued management of the project is a key concern as outlined below. Management, Operation and Maintenance In 1998 the Japanese Government implemented a number of projects in the cement sector. Experience from this programme has shown that the technology transfer has not been successful and that of the 30 projects that were implemented only 2 are still operating today. This includes the project at Line 1 of the Ningguo cement factory. Whilst the projects were not all the same technology it is a good demonstration of how difficult it can be to ensure successful technology transfer. In the case of this programme the main problems were to do with the continued management and operation of the projects and therefore the capacity of the staff. The extensive requirement for staff training has meant an increase both to the cost of the investment as well as an increase to the implementation time of the project. Procurement of compatible local equipment The waste heat recovery technology from the Japanese company Kawasaki Heavy Industries Ltd will be applied in this project. However there is also a large proportion of domestically manufactured equipment that forms part of the project. In order for this to be compatible with the imported equipment much of this is being manufactured exclusively for the Ningguo waste heat recovery project and is not of standard design. This has two implications, firstly there is a risk that the components may fail and secondly this has increased the cost of project implementation. Sub-step 4. Common Practice Analysis Sub-step 4a. Analyze other activities similar to the proposed project activity:
PROJECT DESIGN DOCUMENT FORM (CDM PDD) - Version 03 CDM – Executive Board page 25
This template shall not be altered. It shall be completed without modifying/adding headings or logo, format or font.
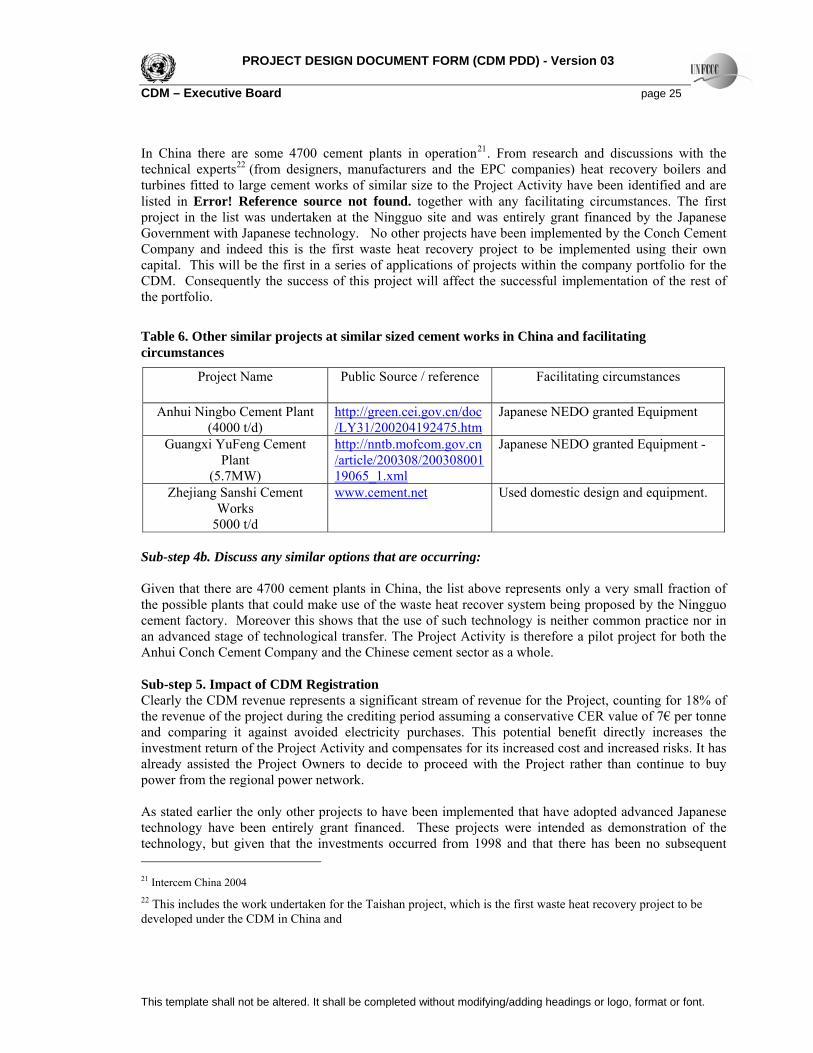
In China there are some 4700 cement plants in operation21. From research and discussions with the technical experts22 (from designers, manufacturers and the EPC companies) heat recovery boilers and turbines fitted to large cement works of similar size to the Project Activity have been identified and are listed in Error! Reference source not found. together with any facilitating circumstances. The first project in the list was undertaken at the Ningguo site and was entirely grant financed by the Japanese Government with Japanese technology. No other projects have been implemented by the Conch Cement Company and indeed this is the first waste heat recovery project to be implemented using their own capital. This will be the first in a series of applications of projects within the company portfolio for the CDM. Consequently the success of this project will affect the successful implementation of the rest of the portfolio.
Table 6. Other similar projects at similar sized cement works in China and facilitating circumstances
Project Name Public Source / reference Facilitating circumstances
Anhui Ningbo Cement Plant (4000 t/d)
http://green.cei.gov.cn/doc/LY31/200204192475.htm
Japanese NEDO granted Equipment
Guangxi YuFeng Cement Plant
(5.7MW)
http://nntb.mofcom.gov.cn/article/200308/20030800119065_1.xml
Japanese NEDO granted Equipment -
Zhejiang Sanshi Cement Works
5000 t/d
www.cement.net Used domestic design and equipment.
Sub-step 4b. Discuss any similar options that are occurring: Given that there are 4700 cement plants in China, the list above represents only a very small fraction of the possible plants that could make use of the waste heat recover system being proposed by the Ningguo cement factory. Moreover this shows that the use of such technology is neither common practice nor in an advanced stage of technological transfer. The Project Activity is therefore a pilot project for both the Anhui Conch Cement Company and the Chinese cement sector as a whole. Sub-step 5. Impact of CDM Registration Clearly the CDM revenue represents a significant stream of revenue for the Project, counting for 18% of the revenue of the project during the crediting period assuming a conservative CER value of 7€ per tonne and comparing it against avoided electricity purchases. This potential benefit directly increases the investment return of the Project Activity and compensates for its increased cost and increased risks. It has already assisted the Project Owners to decide to proceed with the Project rather than continue to buy power from the regional power network. As stated earlier the only other projects to have been implemented that have adopted advanced Japanese technology have been entirely grant financed. These projects were intended as demonstration of the technology, but given that the investments occurred from 1998 and that there has been no subsequent 21 Intercem China 2004 22 This includes the work undertaken for the Taishan project, which is the first waste heat recovery project to be developed under the CDM in China and

PROJECT DESIGN DOCUMENT FORM (CDM PDD) - Version 03 CDM – Executive Board page 26
This template shall not be altered. It shall be completed without modifying/adding headings or logo, format or font.
investment from the private sector since this time, it is clear that without additional finance the sector will not adopt this advanced technology. The CDM therefore fills the funding gap that has become evident from the lack of take up of this technology. B.4. Description of how the definition of the project boundary related to the baseline methodology selected is applied to the project activity: The Project Boundary is defined as the equipment fitted at the Ningguo Cement Works for the Project Activity and the equipment one stage upstream and one step downstream from the Project Activity and under the control of the Project Owners: Boundary one step upstream: The boundary at the “hot” (PH) end of the kiln are the connections from the waste heat recovery boiler to the second stage cyclone and at the “cool” (ACQ) end of the kiln are the connections to the clinker cooler which is now replaced by the ACQ heat recovery boiler. Boundary one step downstream: the 6 kV and 110KV high voltage distribution network. This system is connected to the 110kV Anhui Power Grid via two transformers. The Anhui Power Grid forms part of the regional, East China Power Network (ECPN). The ECPN therefore forms part of the project boundary. The ECPN was historically made up of 4 provinces: Shanghai, Jiangsu, Zhejiang and Anhui. In 2003, a transmission line was completed between the East China Power Network and the independent Fujian Power Grid to facilitate power sharing between these two grids. For the purposes of this analysis therefore the project boundary selected is the ECPN that includes Shanghai, Jiangsu, Zhejiang, Anhui and Fujian provinces. Data for the ECPN is easily available in the annually published China Power Statistics Yearbook. Net imports to the ECPN were around 5% in 2004 (see Table 7 below). This is principally through a transmission interconnection with the Central China Power Network to the ECPN at Shanghai.
Table 7: Transfers to and from the ECPN
2000 2001 2002 2003 2004Total imports (100GWh) 179.83 255.61 416.51 621.75 608.87Total exports (100 GWh) 159.61 196.36 297.88 388.80 325.81Total net transfers (100 GWh) 20.22 59.25 118.63 232.95 283.06Total Generation (100 GWh) 2999.19 3269.07 3678.14 4291.27 4879.86% imports/ exports 0.67% 1.81% 3.23% 5.43% 5.80%
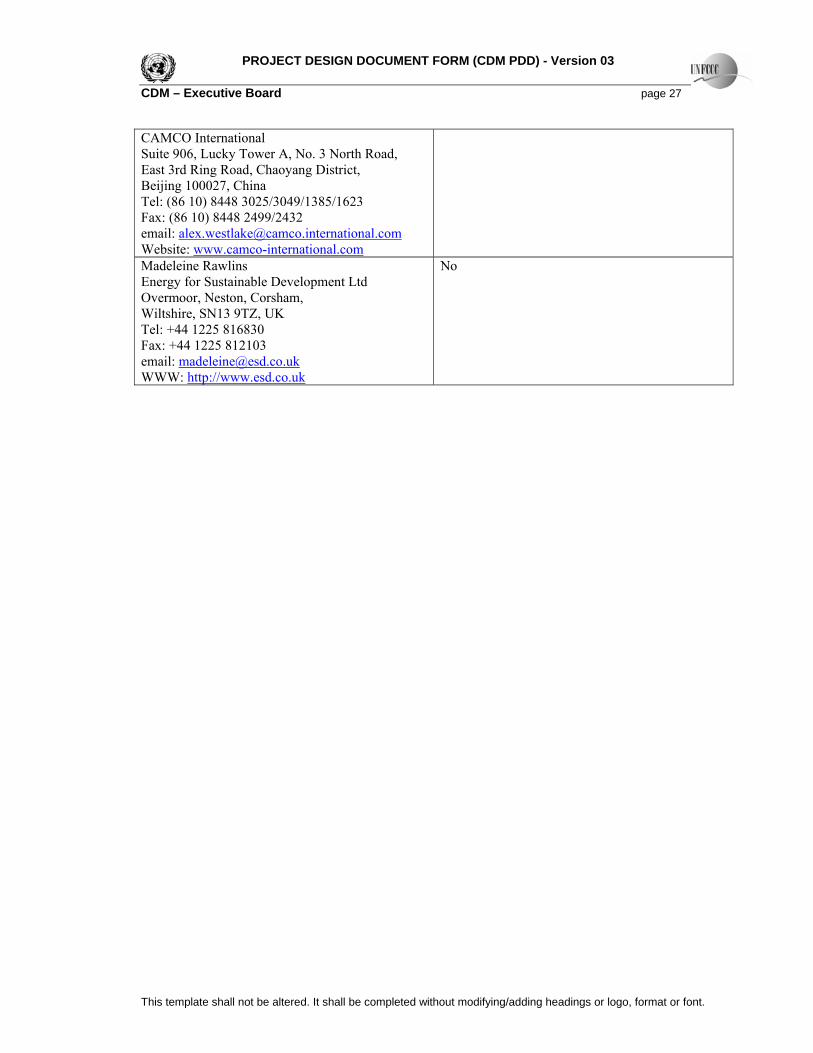
B.5. Details of baseline information, including the date of completion of the baseline study and the name of person (s)/entity (ies) determining the baseline: Date of completion of Baseline Study: 01/06/2006 Organisation
Is organisation a Project Participant Yes/No
Alex Westlake Yes
PROJECT DESIGN DOCUMENT FORM (CDM PDD) - Version 03 CDM – Executive Board page 27
This template shall not be altered. It shall be completed without modifying/adding headings or logo, format or font.
CAMCO International Suite 906, Lucky Tower A, No. 3 North Road, East 3rd Ring Road, Chaoyang District, Beijing 100027, China Tel: (86 10) 8448 3025/3049/1385/1623 Fax: (86 10) 8448 2499/2432 email: [email protected] Website: www.camco-international.com Madeleine Rawlins Energy for Sustainable Development Ltd Overmoor, Neston, Corsham, Wiltshire, SN13 9TZ, UK Tel: +44 1225 816830 Fax: +44 1225 812103 email: [email protected] WWW: http://www.esd.co.uk
No
PROJECT DESIGN DOCUMENT FORM (CDM PDD) - Version 03 CDM – Executive Board page 28
This template shall not be altered. It shall be completed without modifying/adding headings or logo, format or font.
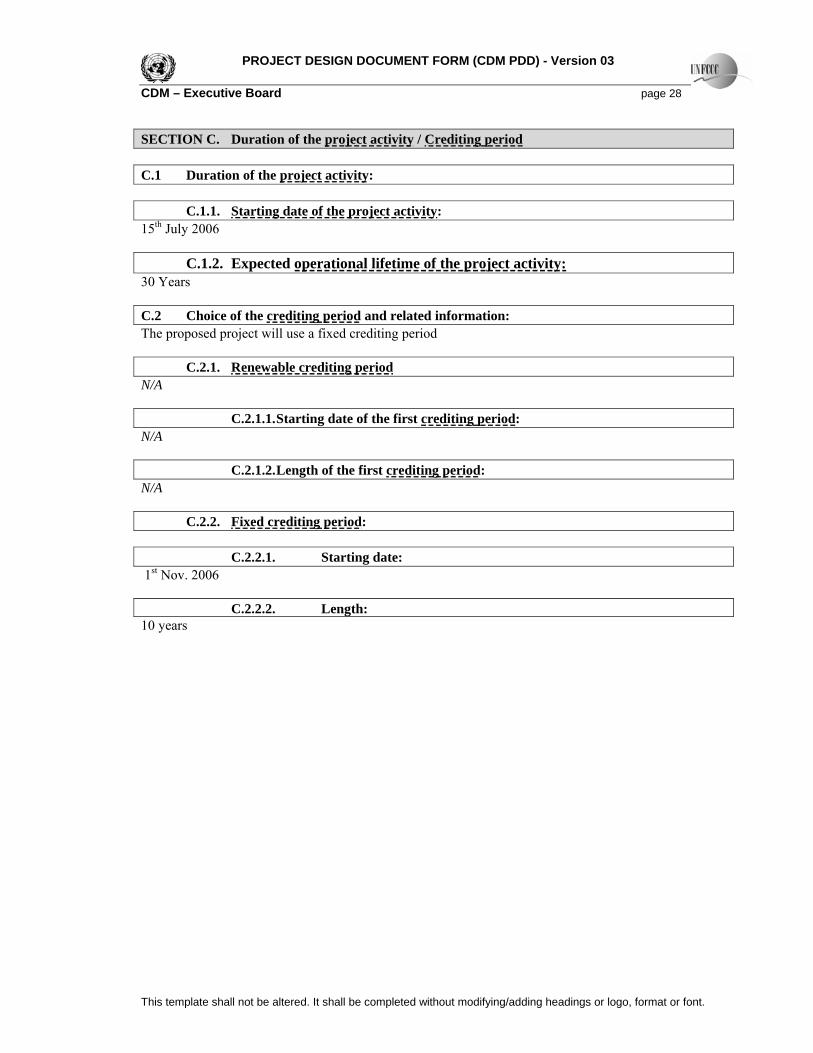
SECTION C. Duration of the project activity / Crediting period C.1 Duration of the project activity: C.1.1. Starting date of the project activity: 15th July 2006 C.1.2. Expected operational lifetime of the project activity: 30 Years C.2 Choice of the crediting period and related information: The proposed project will use a fixed crediting period C.2.1. Renewable crediting period N/A C.2.1.1. Starting date of the first crediting period: N/A C.2.1.2. Length of the first crediting period: N/A C.2.2. Fixed crediting period: C.2.2.1. Starting date: 1st Nov. 2006 C.2.2.2. Length: 10 years
PROJECT DESIGN DOCUMENT FORM (CDM PDD) - Version 03 CDM – Executive Board page 29
This template shall not be altered. It shall be completed without modifying/adding headings or logo, format or font.
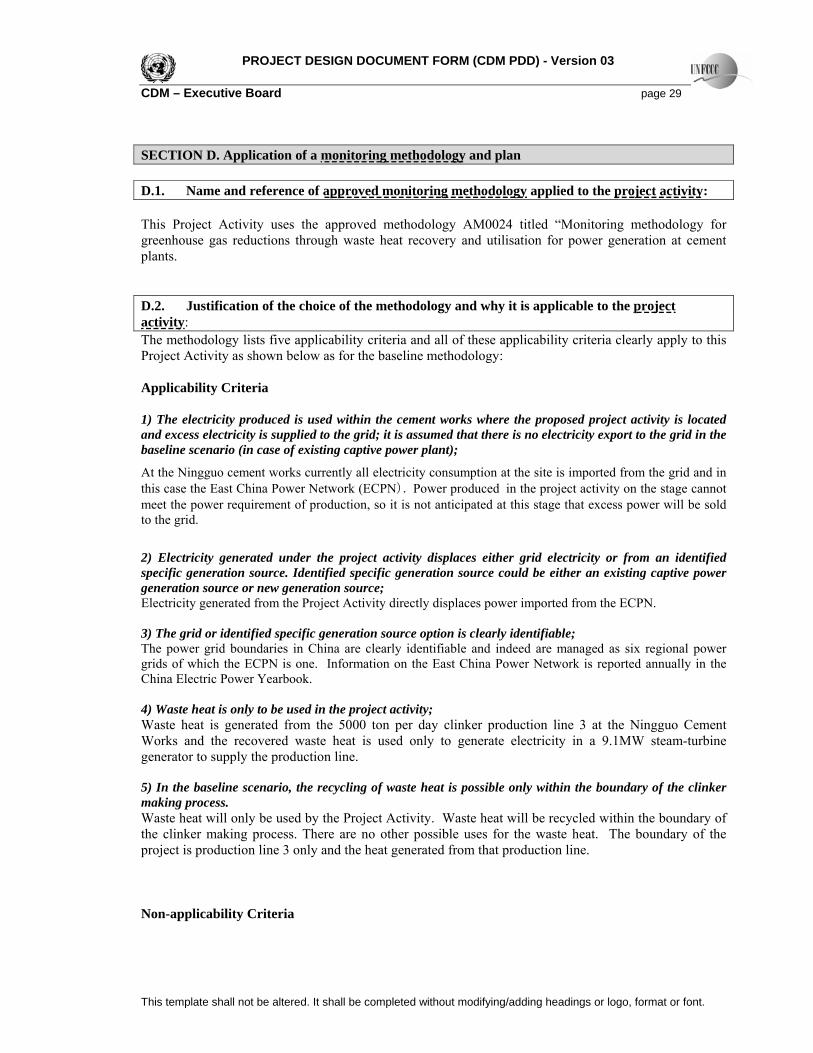
SECTION D. Application of a monitoring methodology and plan D.1. Name and reference of approved monitoring methodology applied to the project activity: This Project Activity uses the approved methodology AM0024 titled “Monitoring methodology for greenhouse gas reductions through waste heat recovery and utilisation for power generation at cement plants. D.2. Justification of the choice of the methodology and why it is applicable to the project activity: The methodology lists five applicability criteria and all of these applicability criteria clearly apply to this Project Activity as shown below as for the baseline methodology: Applicability Criteria 1) The electricity produced is used within the cement works where the proposed project activity is located and excess electricity is supplied to the grid; it is assumed that there is no electricity export to the grid in the baseline scenario (in case of existing captive power plant);
At the Ningguo cement works currently all electricity consumption at the site is imported from the grid and in this case the East China Power Network (ECPN). Power produced in the project activity on the stage cannot meet the power requirement of production, so it is not anticipated at this stage that excess power will be sold to the grid.
2) Electricity generated under the project activity displaces either grid electricity or from an identified specific generation source. Identified specific generation source could be either an existing captive power generation source or new generation source; Electricity generated from the Project Activity directly displaces power imported from the ECPN. 3) The grid or identified specific generation source option is clearly identifiable; The power grid boundaries in China are clearly identifiable and indeed are managed as six regional power grids of which the ECPN is one. Information on the East China Power Network is reported annually in the China Electric Power Yearbook. 4) Waste heat is only to be used in the project activity; Waste heat is generated from the 5000 ton per day clinker production line 3 at the Ningguo Cement Works and the recovered waste heat is used only to generate electricity in a 9.1MW steam-turbine generator to supply the production line. 5) In the baseline scenario, the recycling of waste heat is possible only within the boundary of the clinker making process. Waste heat will only be used by the Project Activity. Waste heat will be recycled within the boundary of the clinker making process. There are no other possible uses for the waste heat. The boundary of the project is production line 3 only and the heat generated from that production line. Non-applicability Criteria
PROJECT DESIGN DOCUMENT FORM (CDM PDD) - Version 03 CDM – Executive Board page 30
This template shall not be altered. It shall be completed without modifying/adding headings or logo, format or font.
This methodology is not applicable to project activities: 1)Where the current use of waste heat or the identified alternative business as usual use of waste heat is located outside of the clinker making process In the case of the project activity the current use of waste heat is generated from the PH boiler on the line 3 of the Ningguo Cement Works, which is located within the project boundary, and within the clinker making process. 2)That affect process emissions from cement plants The clinker making process is a chemical process with pre-determined material inputs. Therefore the project activity will not affect project emissions and the entire volume of waste heat is a by-product of the process.
PROJECT DESIGN DOCUMENT FORM (CDM PDD) - Version 02 CDM – Executive Board page 31
This template shall not be altered. It shall be completed without modifying/adding headings or logo, format or font.
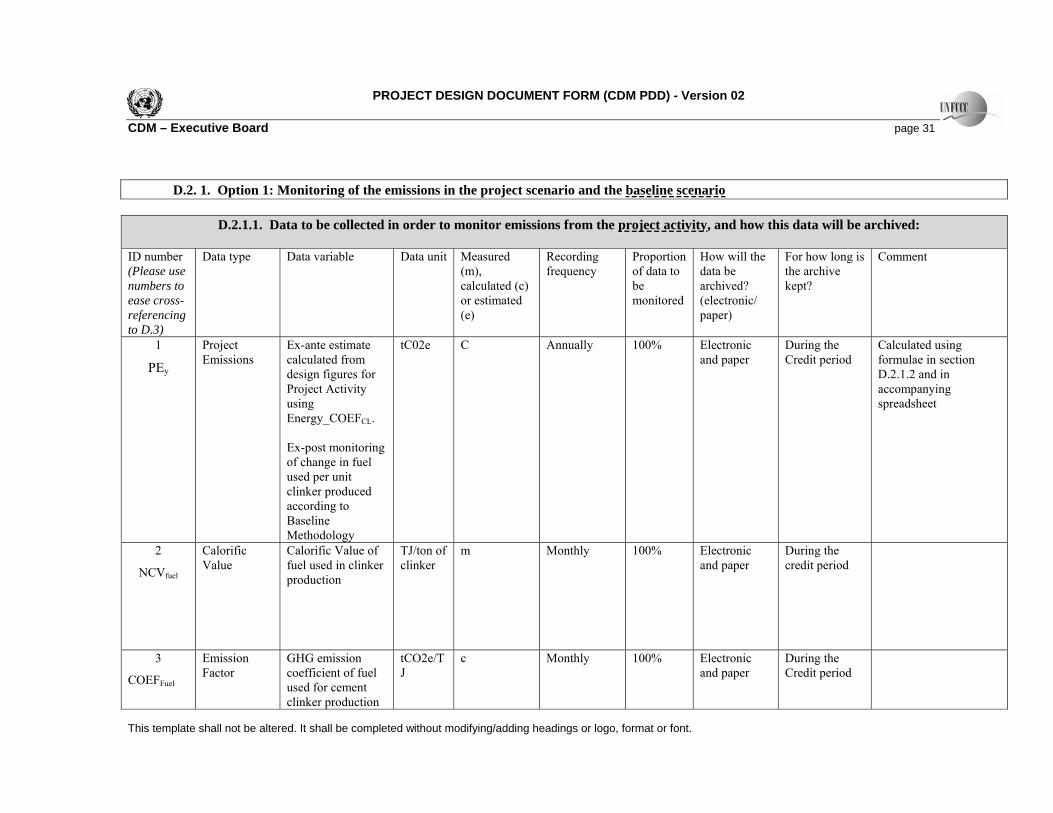
D.2. 1. Option 1: Monitoring of the emissions in the project scenario and the baseline scenario D.2.1.1. Data to be collected in order to monitor emissions from the project activity, and how this data will be archived: ID number (Please use numbers to ease cross-referencing to D.3)
Data type Data variable Data unit
Measured (m), calculated (c) or estimated (e)
Recording frequency
Proportion of data to be monitored
How will the data be archived? (electronic/ paper)
For how long is the archive kept?
Comment
1
PEy
Project Emissions
Ex-ante estimate calculated from design figures for Project Activity using Energy_COEFCL. Ex-post monitoring of change in fuel used per unit clinker produced according to Baseline Methodology
tC02e C
Annually 100% Electronic and paper
During the Credit period
Calculated using formulae in section D.2.1.2 and in accompanying spreadsheet
2
NCVfuel
Calorific Value
Calorific Value of fuel used in clinker production
TJ/ton of clinker
m Monthly 100% Electronic and paper
During the credit period
3
COEFFuel
Emission Factor
GHG emission coefficient of fuel used for cement clinker production
tCO2e/TJ
c Monthly 100% Electronic and paper
During the Credit period
PROJECT DESIGN DOCUMENT FORM (CDM PDD) - Version 02 CDM – Executive Board page 32
This template shall not be altered. It shall be completed without modifying/adding headings or logo, format or font.
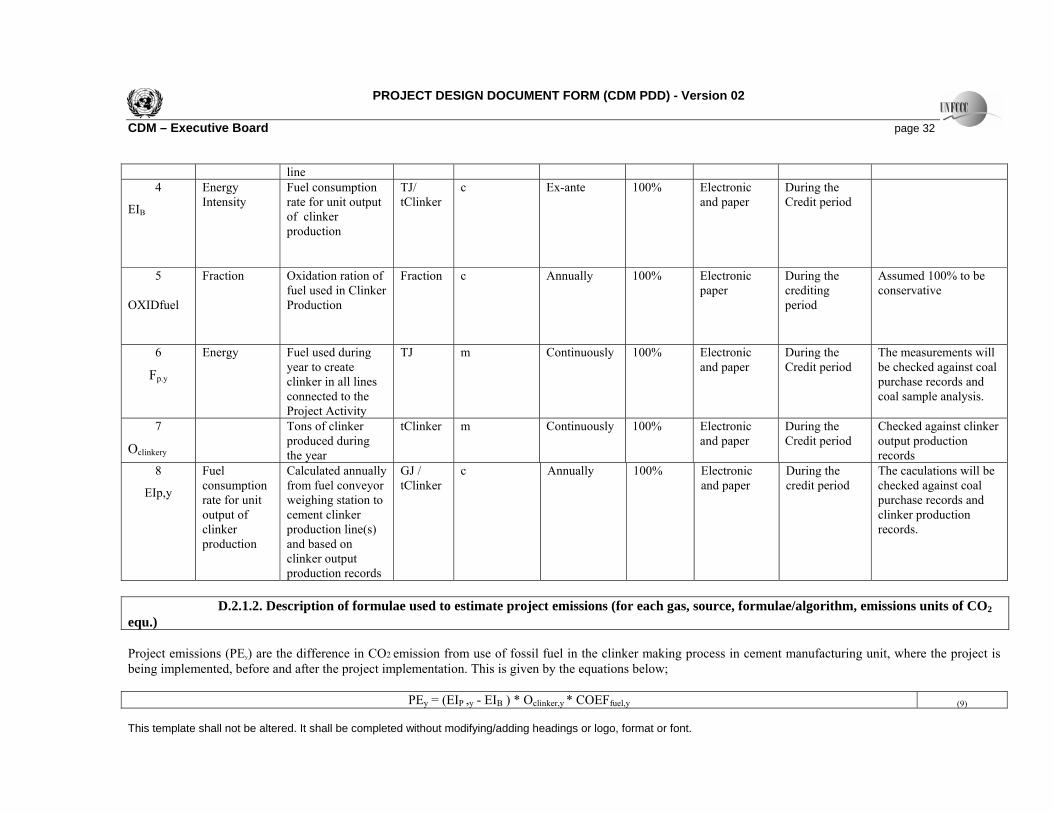
line 4
EIB
Energy Intensity
Fuel consumption rate for unit output of clinker production
TJ/ tClinker
c
Ex-ante 100%
Electronic and paper
During the Credit period
5 OXIDfuel
Fraction Oxidation ration of fuel used in Clinker Production
Fraction c Annually 100% Electronic paper
During the crediting period
Assumed 100% to be conservative
6
Fp.y
Energy Fuel used during year to create clinker in all lines connected to the Project Activity
TJ m Continuously 100% Electronic and paper
During the Credit period
The measurements will be checked against coal purchase records and coal sample analysis.
7
Oclinkery
Tons of clinker produced during the year
tClinker m Continuously 100% Electronic and paper
During the Credit period
Checked against clinker output production records
8
EIp,y
Fuel consumption rate for unit output of clinker production
Calculated annually from fuel conveyor weighing station to cement clinker production line(s) and based on clinker output production records
GJ / tClinker
c Annually 100% Electronic and paper
During the credit period
The caculations will be checked against coal purchase records and clinker production records.
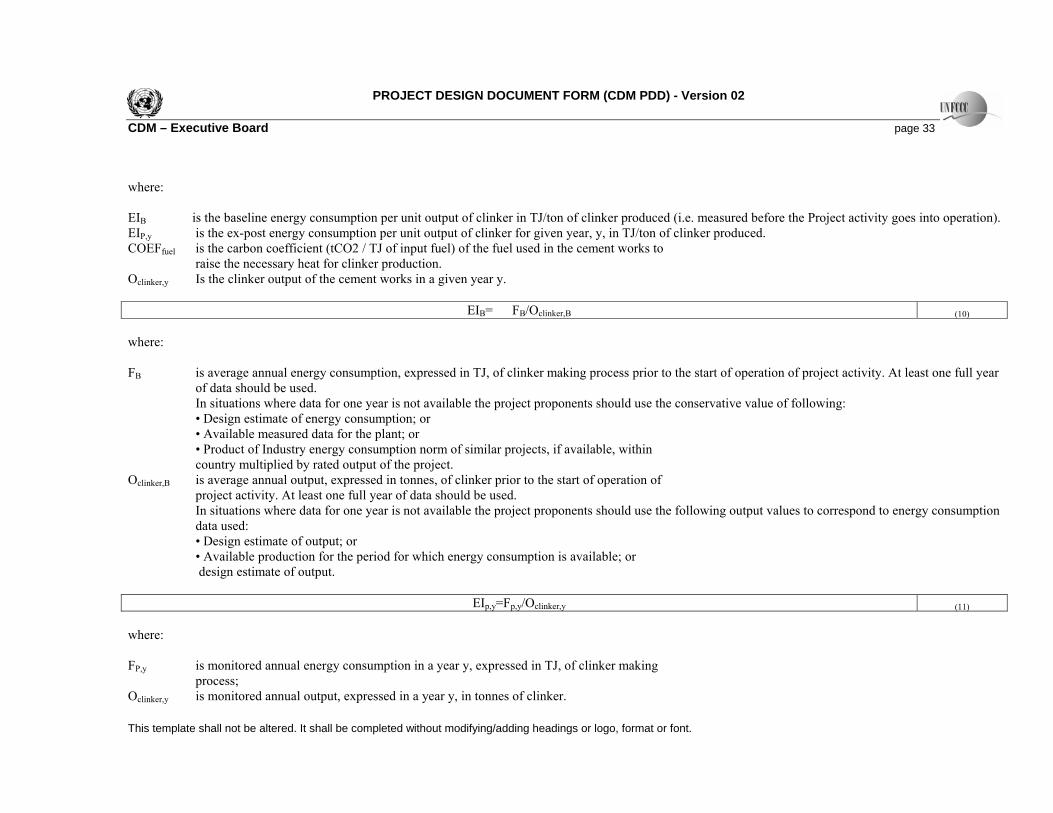
D.2.1.2. Description of formulae used to estimate project emissions (for each gas, source, formulae/algorithm, emissions units of CO2 equ.) Project emissions (PEy) are the difference in CO2 emission from use of fossil fuel in the clinker making process in cement manufacturing unit, where the project is being implemented, before and after the project implementation. This is given by the equations below;
PEy = (EIP ,y - EIB ) * Oclinker,y * COEFfuel,y (9)
PROJECT DESIGN DOCUMENT FORM (CDM PDD) - Version 02 CDM – Executive Board page 33
This template shall not be altered. It shall be completed without modifying/adding headings or logo, format or font.
where: EIB is the baseline energy consumption per unit output of clinker in TJ/ton of clinker produced (i.e. measured before the Project activity goes into operation). EIP,y is the ex-post energy consumption per unit output of clinker for given year, y, in TJ/ton of clinker produced. COEFfuel is the carbon coefficient (tCO2 / TJ of input fuel) of the fuel used in the cement works to
raise the necessary heat for clinker production. Oclinker,y Is the clinker output of the cement works in a given year y.
EIB= FB/Oclinker,B (10) where: FB is average annual energy consumption, expressed in TJ, of clinker making process prior to the start of operation of project activity. At least one full year
of data should be used. In situations where data for one year is not available the project proponents should use the conservative value of following: • Design estimate of energy consumption; or • Available measured data for the plant; or • Product of Industry energy consumption norm of similar projects, if available, within country multiplied by rated output of the project.
Oclinker,B is average annual output, expressed in tonnes, of clinker prior to the start of operation of project activity. At least one full year of data should be used. In situations where data for one year is not available the project proponents should use the following output values to correspond to energy consumption data used: • Design estimate of output; or • Available production for the period for which energy consumption is available; or design estimate of output.
EIp,y=Fp,y/Oclinker,y (11)
where: FP,y is monitored annual energy consumption in a year y, expressed in TJ, of clinker making
process; Oclinker,y is monitored annual output, expressed in a year y, in tonnes of clinker.
PROJECT DESIGN DOCUMENT FORM (CDM PDD) - Version 02 CDM – Executive Board page 34
This template shall not be altered. It shall be completed without modifying/adding headings or logo, format or font.
COEFFuel =NCVfuel,y * EFCO2 ,fuel,y * OXIDfuel,y (12)
where: NCVfuel,y is the net calorific value (energy content) per mass or volume unit of a fuel used in clinker making process; OXIDfuel,y is the oxidation factor of the fuel (see Table 1-6, page 1.29 in the 1996 Revised IPCC
Guidelines for default values), expressed as percentage; EFCO2,fuel fuel is the CO2 emission factor per unit of energy of the fuel, expressed as tCO2 per unit mass or volume unit. The ex-ante estimate of PEy can be calculated using the following formula:
PEy=∑∆EIi*[Oclinker,I]*COEFfuel,i (13) where: I is the index for each clinker production line in the cement plant where the project is being implemented; ∆EIi is the ex-ante design estimate of the change in the energy consumption of each clinker kiln in TJ / ton Clinker, due to project implementation. D.2.1.3. Relevant data necessary for determining the baseline of anthropogenic emissions by sources of GHGs within the project boundary and how such data will be collected and archived :
PROJECT DESIGN DOCUMENT FORM (CDM PDD) - Version 02 CDM – Executive Board page 35
This template shall not be altered. It shall be completed without modifying/adding headings or logo, format or font.
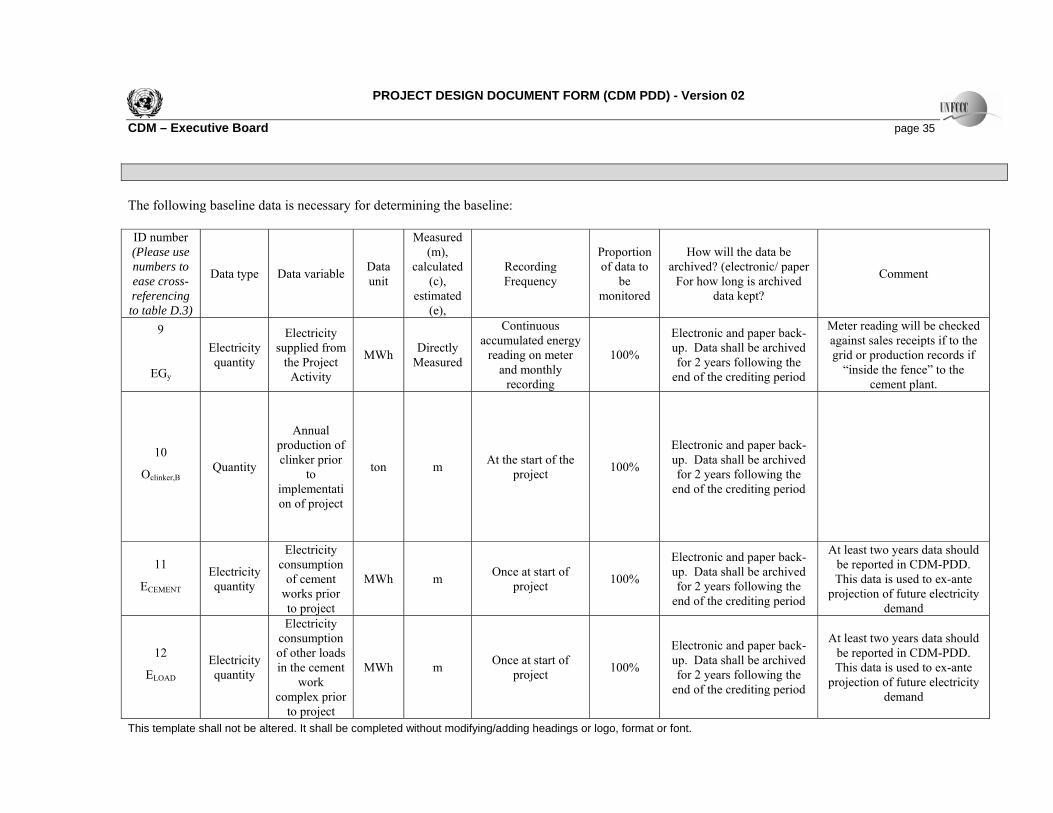
The following baseline data is necessary for determining the baseline: ID number (Please use numbers to ease cross-referencing to table D.3)
Data type Data variable Data unit
Measured (m),
calculated (c),
estimated (e),
Recording Frequency
Proportion of data to
be monitored
How will the data be archived? (electronic/ paper
For how long is archived data kept?
Comment
9
EGy
Electricity quantity
Electricity supplied from
the Project Activity
MWh Directly Measured
Continuous accumulated energy
reading on meter and monthly
recording
100%
Electronic and paper back-up. Data shall be archived for 2 years following the
end of the crediting period
Meter reading will be checked against sales receipts if to the grid or production records if
“inside the fence” to the cement plant.
10
Oclinker,B Quantity
Annual production of clinker prior
to implementation of project
ton m At the start of the project 100%
Electronic and paper back-up. Data shall be archived for 2 years following the
end of the crediting period
11
ECEMENT Electricity quantity
Electricity consumption
of cement works prior to project
MWh m Once at start of project 100%
Electronic and paper back-up. Data shall be archived for 2 years following the
end of the crediting period
At least two years data should be reported in CDM-PDD. This data is used to ex-ante
projection of future electricity demand
12
ELOAD Electricity quantity
Electricity consumption of other loads in the cement
work complex prior
to project
MWh m Once at start of project 100%
Electronic and paper back-up. Data shall be archived for 2 years following the
end of the crediting period
At least two years data should be reported in CDM-PDD. This data is used to ex-ante
projection of future electricity demand
PROJECT DESIGN DOCUMENT FORM (CDM PDD) - Version 02 CDM – Executive Board page 36
This template shall not be altered. It shall be completed without modifying/adding headings or logo, format or font.
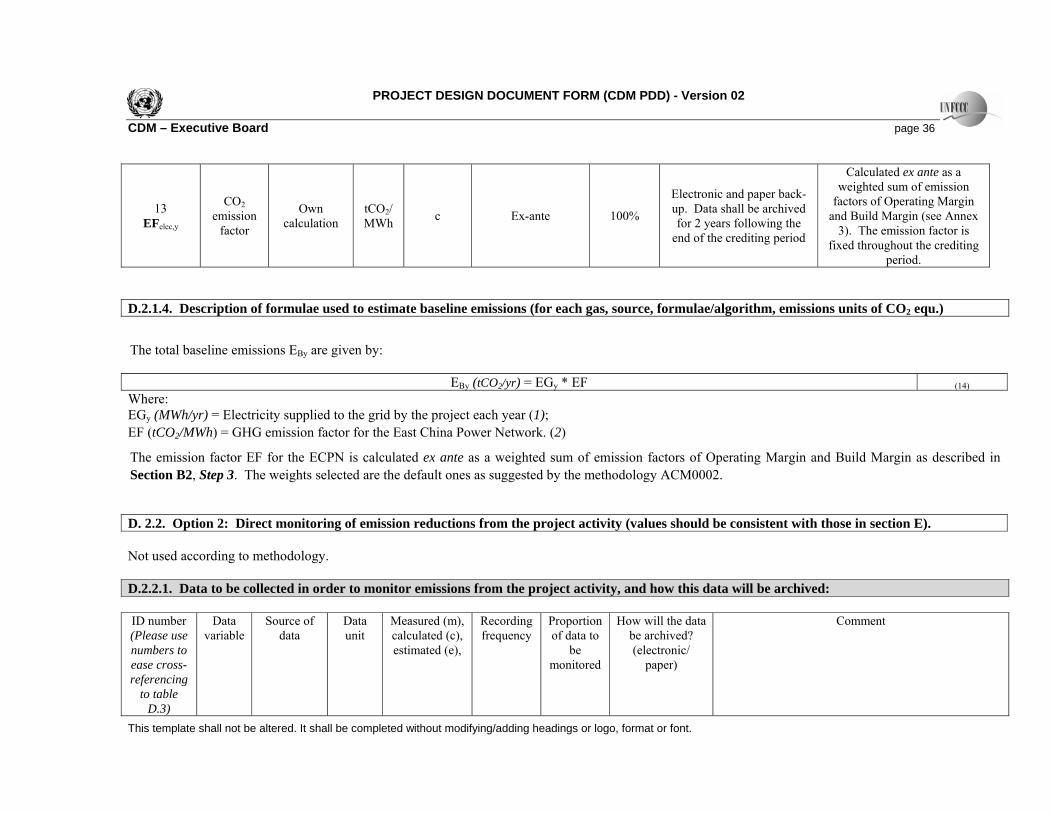
13 EFelec,y
CO2 emission
factor
Own calculation
tCO2/ MWh c Ex-ante 100%
Electronic and paper back-up. Data shall be archived for 2 years following the
end of the crediting period
Calculated ex ante as a weighted sum of emission
factors of Operating Margin and Build Margin (see Annex
3). The emission factor is fixed throughout the crediting
period. D.2.1.4. Description of formulae used to estimate baseline emissions (for each gas, source, formulae/algorithm, emissions units of CO2 equ.)
The total baseline emissions EBy are given by:
EBy (tCO2/yr) = EGy * EF (14) Where: EGy (MWh/yr) = Electricity supplied to the grid by the project each year (1); EF (tCO2/MWh) = GHG emission factor for the East China Power Network. (2)
The emission factor EF for the ECPN is calculated ex ante as a weighted sum of emission factors of Operating Margin and Build Margin as described in Section B2, Step 3. The weights selected are the default ones as suggested by the methodology ACM0002. D. 2.2. Option 2: Direct monitoring of emission reductions from the project activity (values should be consistent with those in section E). Not used according to methodology. D.2.2.1. Data to be collected in order to monitor emissions from the project activity, and how this data will be archived: ID number (Please use numbers to ease cross-referencing
to table D.3)
Data variable
Source of data
Data unit
Measured (m), calculated (c), estimated (e),
Recording frequency
Proportion of data to
be monitored
How will the data be archived? (electronic/
paper)
Comment
PROJECT DESIGN DOCUMENT FORM (CDM PDD) - Version 02 CDM – Executive Board page 37
This template shall not be altered. It shall be completed without modifying/adding headings or logo, format or font.
D.2.2.2. Description of formulae used to calculate project emissions (for each gas, source, formulae/algorithm, emissions units of CO2 equ.): D.2.3. Treatment of leakage in the monitoring plan D.2.3.1. If applicable, please describe the data and information that will be collected in order to monitor leakage effects of the project activity
ID number (Please use numbers to ease cross-referencing to table D.3)
Data variable
Source of data Data
unit
Measured (m), calculated (c) or estimated (e)
Recording frequency
Proportion of data to be monitored
How will the data be archived? (electronic/ paper)
Comment
Not used according to methodology
D.2.3.2. Description of formulae used to estimate leakage (for each gas, source, formulae/algorithm, emissions units of CO2 equ.) According to the methodology (AM0024) the leakage effects for this Project Activity are zero. D.2.4. Description of formulae used to estimate emission reductions for the project activity (for each gas, source, formulae/algorithm, emissions units of CO2 equ.) The emission reduction, ERy, by the project activity during a given year y23 is given by: ERy = EBy – PEy (1)
23 Throughout the document, the suffix y denotes that such parameter is a function of the year y, thus to be monitored at least annually.
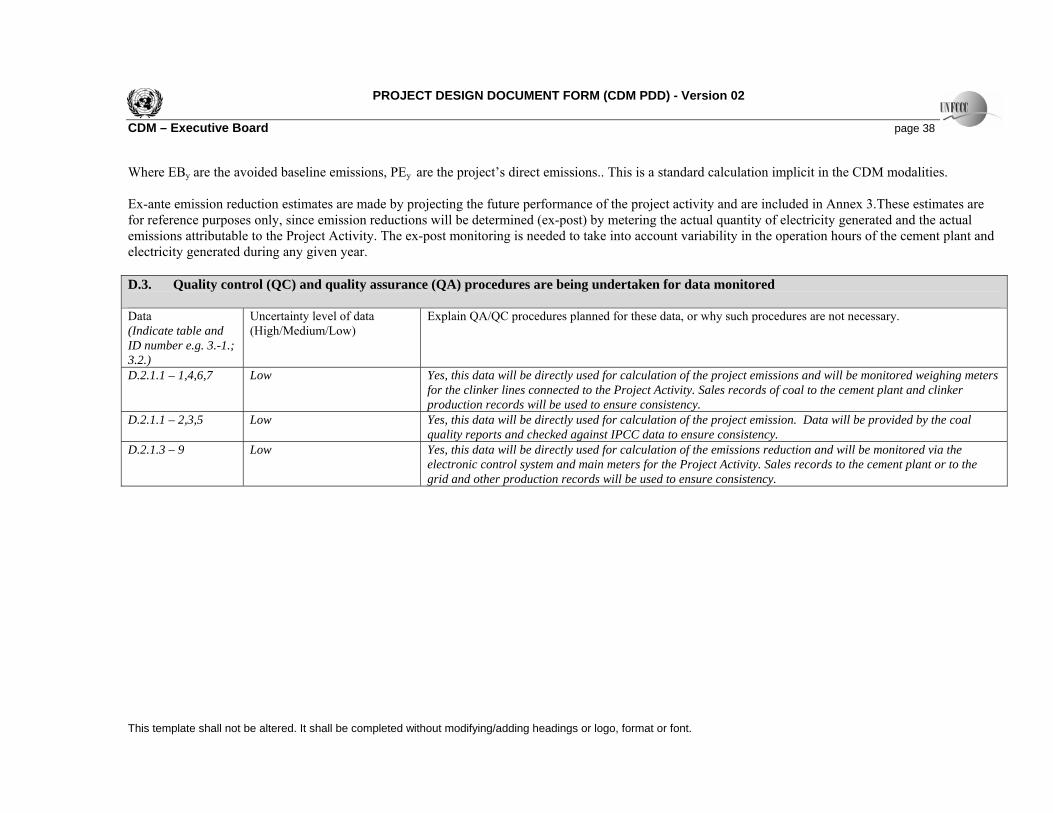
PROJECT DESIGN DOCUMENT FORM (CDM PDD) - Version 02 CDM – Executive Board page 38
This template shall not be altered. It shall be completed without modifying/adding headings or logo, format or font.
Where EBy are the avoided baseline emissions, PEy are the project’s direct emissions.. This is a standard calculation implicit in the CDM modalities. Ex-ante emission reduction estimates are made by projecting the future performance of the project activity and are included in Annex 3.These estimates are for reference purposes only, since emission reductions will be determined (ex-post) by metering the actual quantity of electricity generated and the actual emissions attributable to the Project Activity. The ex-post monitoring is needed to take into account variability in the operation hours of the cement plant and electricity generated during any given year. D.3. Quality control (QC) and quality assurance (QA) procedures are being undertaken for data monitored Data (Indicate table and ID number e.g. 3.-1.; 3.2.)
Uncertainty level of data (High/Medium/Low)
Explain QA/QC procedures planned for these data, or why such procedures are not necessary.
D.2.1.1 – 1,4,6,7
Low Yes, this data will be directly used for calculation of the project emissions and will be monitored weighing meters for the clinker lines connected to the Project Activity. Sales records of coal to the cement plant and clinker production records will be used to ensure consistency.
D.2.1.1 – 2,3,5 Low Yes, this data will be directly used for calculation of the project emission. Data will be provided by the coal quality reports and checked against IPCC data to ensure consistency.
D.2.1.3 – 9 Low Yes, this data will be directly used for calculation of the emissions reduction and will be monitored via the electronic control system and main meters for the Project Activity. Sales records to the cement plant or to the grid and other production records will be used to ensure consistency.
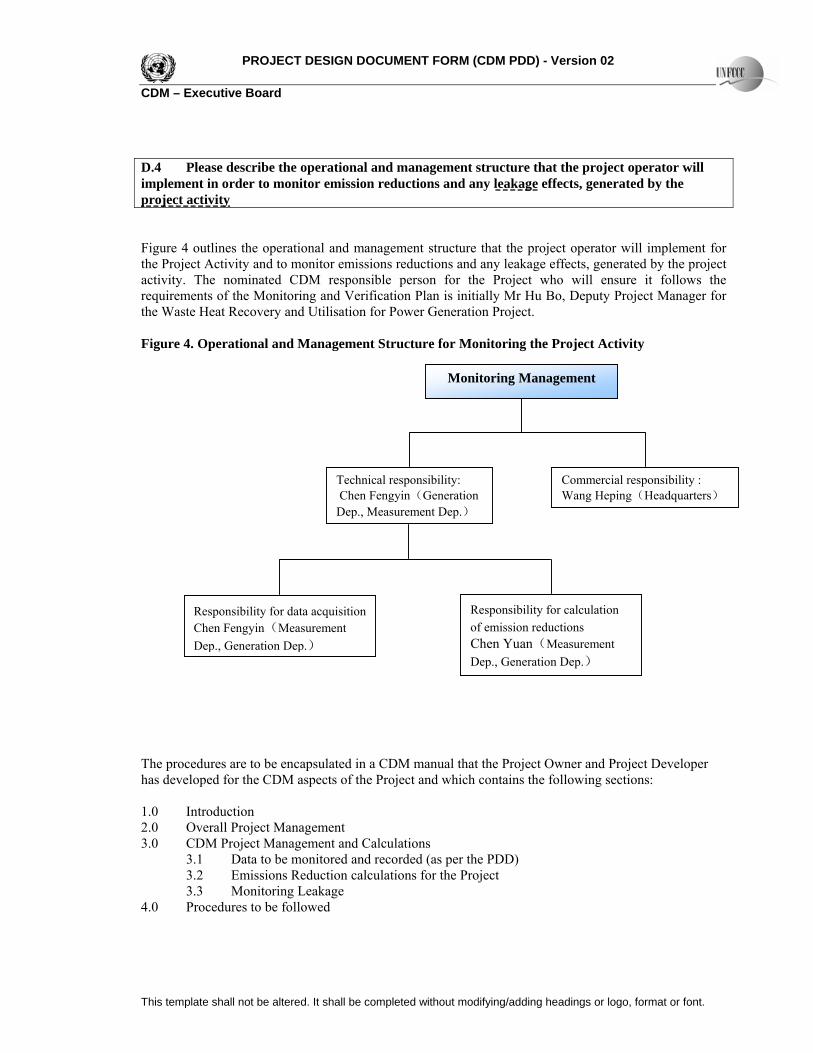
PROJECT DESIGN DOCUMENT FORM (CDM PDD) - Version 02 CDM – Executive Board
This template shall not be altered. It shall be completed without modifying/adding headings or logo, format or font.
D.4 Please describe the operational and management structure that the project operator will implement in order to monitor emission reductions and any leakage effects, generated by the project activity Figure 4 outlines the operational and management structure that the project operator will implement for the Project Activity and to monitor emissions reductions and any leakage effects, generated by the project activity. The nominated CDM responsible person for the Project who will ensure it follows the requirements of the Monitoring and Verification Plan is initially Mr Hu Bo, Deputy Project Manager for the Waste Heat Recovery and Utilisation for Power Generation Project. Figure 4. Operational and Management Structure for Monitoring the Project Activity The procedures are to be encapsulated in a CDM manual that the Project Owner and Project Developer has developed for the CDM aspects of the Project and which contains the following sections: 1.0 Introduction 2.0 Overall Project Management 3.0 CDM Project Management and Calculations
3.1 Data to be monitored and recorded (as per the PDD) 3.2 Emissions Reduction calculations for the Project 3.3 Monitoring Leakage
4.0 Procedures to be followed
Technical responsibility: Chen Fengyin(Generation Dep., Measurement Dep.)
Commercial responsibility : Wang Heping(Headquarters)
Responsibility for data acquisition Chen Fengyin(Measurement Dep., Generation Dep.)
Responsibility for calculation of emission reductions Chen Yuan(Measurement Dep., Generation Dep.)
Monitoring Management
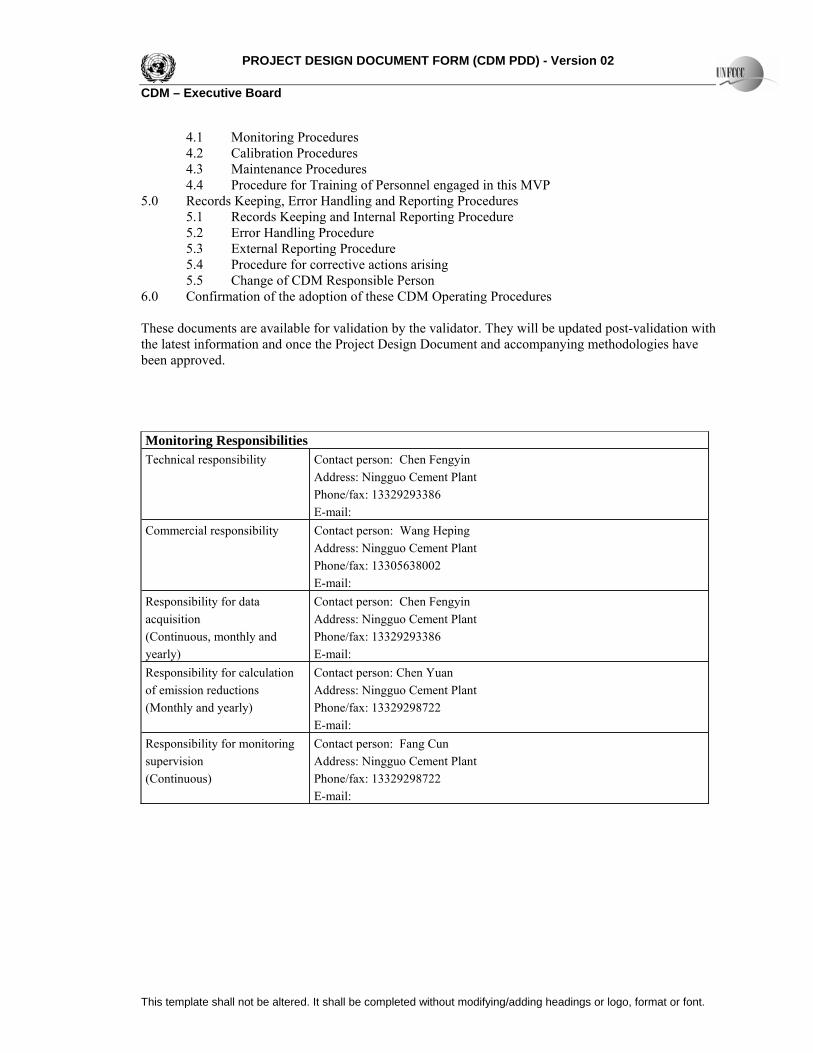
PROJECT DESIGN DOCUMENT FORM (CDM PDD) - Version 02 CDM – Executive Board
This template shall not be altered. It shall be completed without modifying/adding headings or logo, format or font.
4.1 Monitoring Procedures 4.2 Calibration Procedures 4.3 Maintenance Procedures 4.4 Procedure for Training of Personnel engaged in this MVP
5.0 Records Keeping, Error Handling and Reporting Procedures 5.1 Records Keeping and Internal Reporting Procedure 5.2 Error Handling Procedure 5.3 External Reporting Procedure 5.4 Procedure for corrective actions arising 5.5 Change of CDM Responsible Person
6.0 Confirmation of the adoption of these CDM Operating Procedures These documents are available for validation by the validator. They will be updated post-validation with the latest information and once the Project Design Document and accompanying methodologies have been approved. Monitoring Responsibilities Technical responsibility Contact person: Chen Fengyin
Address: Ningguo Cement Plant Phone/fax: 13329293386 E-mail:
Commercial responsibility Contact person: Wang Heping Address: Ningguo Cement Plant Phone/fax: 13305638002 E-mail:
Responsibility for data acquisition (Continuous, monthly and yearly)
Contact person: Chen Fengyin Address: Ningguo Cement Plant Phone/fax: 13329293386 E-mail:
Responsibility for calculation of emission reductions (Monthly and yearly)
Contact person: Chen Yuan Address: Ningguo Cement Plant Phone/fax: 13329298722 E-mail:
Responsibility for monitoring supervision (Continuous)
Contact person: Fang Cun Address: Ningguo Cement Plant Phone/fax: 13329298722 E-mail:
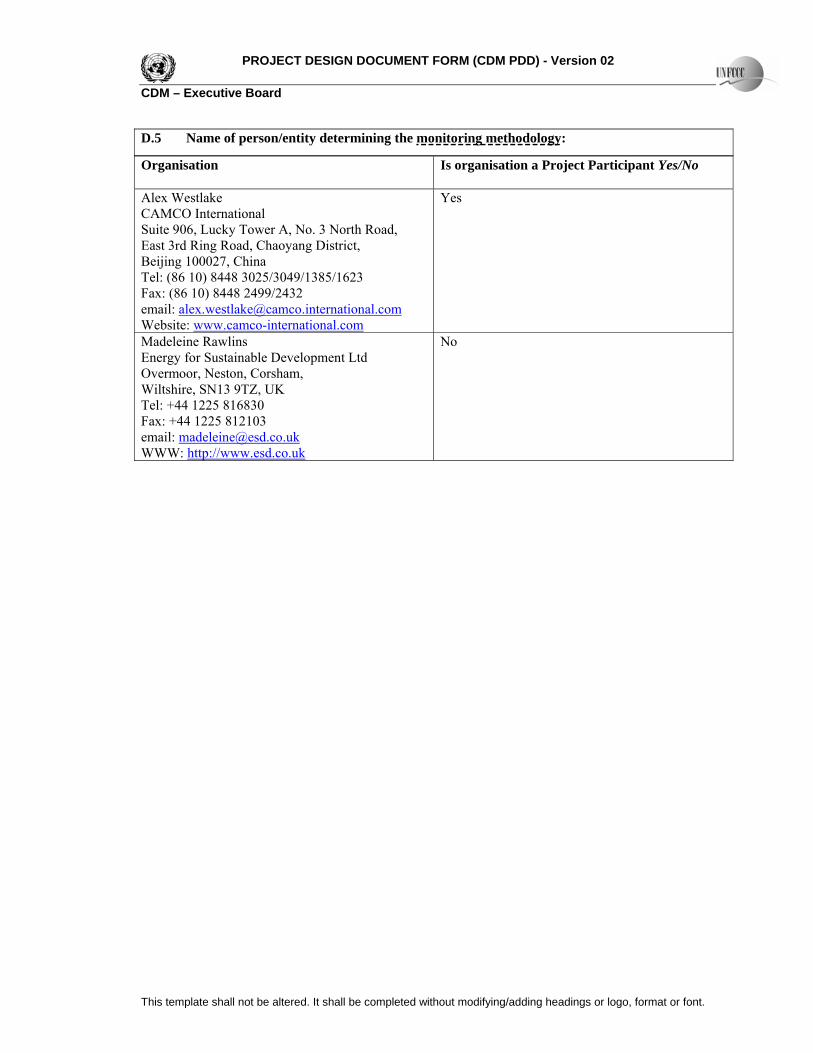
PROJECT DESIGN DOCUMENT FORM (CDM PDD) - Version 02 CDM – Executive Board
This template shall not be altered. It shall be completed without modifying/adding headings or logo, format or font.
D.5 Name of person/entity determining the monitoring methodology:
Organisation
Is organisation a Project Participant Yes/No
Alex Westlake CAMCO International Suite 906, Lucky Tower A, No. 3 North Road, East 3rd Ring Road, Chaoyang District, Beijing 100027, China Tel: (86 10) 8448 3025/3049/1385/1623 Fax: (86 10) 8448 2499/2432 email: [email protected] Website: www.camco-international.com
Yes
Madeleine Rawlins Energy for Sustainable Development Ltd Overmoor, Neston, Corsham, Wiltshire, SN13 9TZ, UK Tel: +44 1225 816830 Fax: +44 1225 812103 email: [email protected] WWW: http://www.esd.co.uk
No
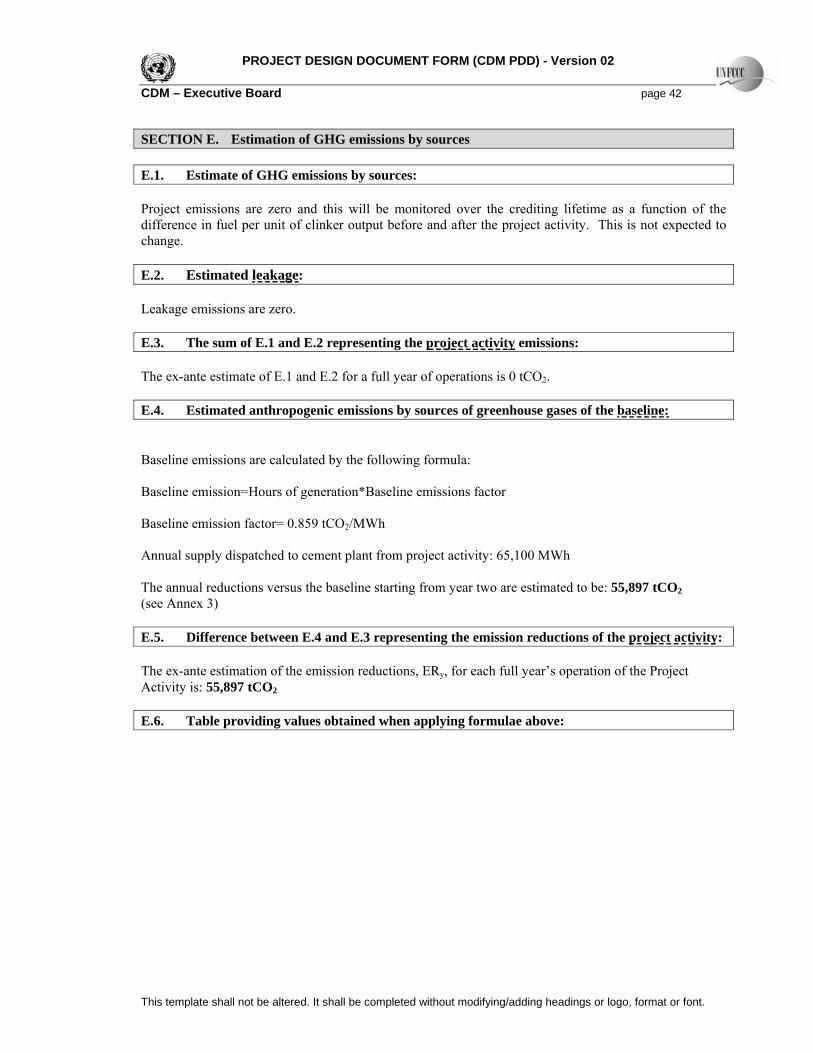
PROJECT DESIGN DOCUMENT FORM (CDM PDD) - Version 02 CDM – Executive Board page 42
This template shall not be altered. It shall be completed without modifying/adding headings or logo, format or font.
SECTION E. Estimation of GHG emissions by sources E.1. Estimate of GHG emissions by sources: Project emissions are zero and this will be monitored over the crediting lifetime as a function of the difference in fuel per unit of clinker output before and after the project activity. This is not expected to change. E.2. Estimated leakage: Leakage emissions are zero. E.3. The sum of E.1 and E.2 representing the project activity emissions: The ex-ante estimate of E.1 and E.2 for a full year of operations is 0 tCO2. E.4. Estimated anthropogenic emissions by sources of greenhouse gases of the baseline: Baseline emissions are calculated by the following formula: Baseline emission=Hours of generation*Baseline emissions factor Baseline emission factor= 0.859 tCO2/MWh Annual supply dispatched to cement plant from project activity: 65,100 MWh The annual reductions versus the baseline starting from year two are estimated to be: 55,897 tCO2 (see Annex 3) E.5. Difference between E.4 and E.3 representing the emission reductions of the project activity: The ex-ante estimation of the emission reductions, ERy, for each full year’s operation of the Project Activity is: 55,897 tCO2 E.6. Table providing values obtained when applying formulae above:
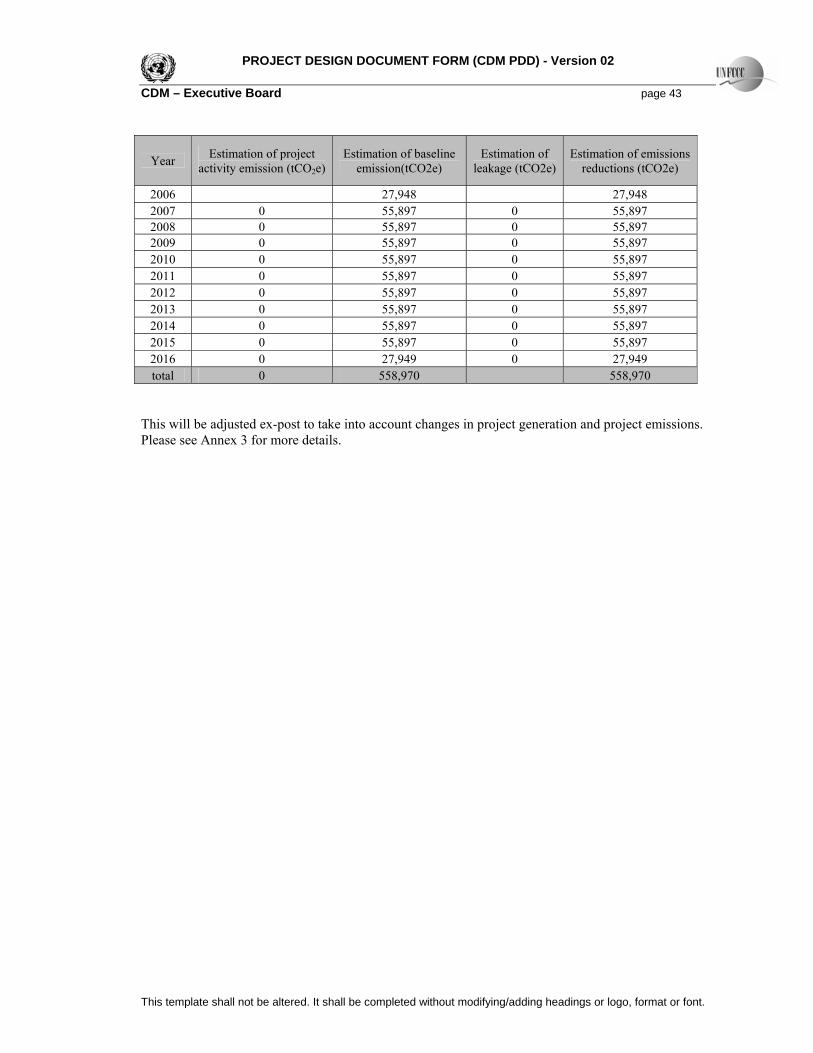
PROJECT DESIGN DOCUMENT FORM (CDM PDD) - Version 02 CDM – Executive Board page 43
This template shall not be altered. It shall be completed without modifying/adding headings or logo, format or font.
This will be adjusted ex-post to take into account changes in project generation and project emissions. Please see Annex 3 for more details.
Year Estimation of project activity emission (tCO2e)
Estimation of baseline emission(tCO2e)
Estimation of leakage (tCO2e)
Estimation of emissions reductions (tCO2e)
2006 27,948 27,948 2007 0 55,897 0 55,897 2008 0 55,897 0 55,897 2009 0 55,897 0 55,897 2010 0 55,897 0 55,897 2011 0 55,897 0 55,897 2012 0 55,897 0 55,897 2013 0 55,897 0 55,897 2014 0 55,897 0 55,897 2015 0 55,897 0 55,897 2016 0 27,949 0 27,949 total 0 558,970 558,970
PROJECT DESIGN DOCUMENT FORM (CDM PDD) - Version 02 CDM – Executive Board page 44
This template shall not be altered. It shall be completed without modifying/adding headings or logo, format or font.
SECTION F. Environmental impacts F.1. Documentation on the analysis of the environmental impacts, including transboundary impacts: The Project Activity has undergone and passed full Environmental Impact Assessments (EIA) in line with the requirements of the Chinese Government. All of which is available for review. The Project Activity is an internal project to the company and has undergone a separate EIA. The Project Owners have established the following assessment of the key environmental impacts for the Project Activity and these are supported by the Feasibility Study and other documents: Noise
The major sources of noise pollution are the power equipment (for example steam turbine, generator, and water pump and so on), and all of this equipment is located in a closed workshop. The water pump will be installed below ground level and therefore the noise pollution is minimal.
Visual Impacts
The visual impact of the Project Activity is minimal as the major equipment is fitted within the middle of the existing cement works and the equipment is lower than the main stacks.
Interference with Communications
There is not expected to be an increase in interference with communications as a result of the Project Activity.
Land Use Impacts
There are no land use impacts as the Project Activity is within an existing site which has already been converted to industrial use for the construction of the cement works.
Air Quality Impacts
Initially air quality impacts are limited to increased level of dust from use and movement of construction equipment. Increased dust levels are short-lived and localised. No significant impacts are expected. Once the project is operational it is expected to lead to reductions in air particulates by 380 tons per year due to the avoidance of fossil fuel for generation. This will have a positive impact on local air quality. The heat of the exhaust gases will also be decreased from above 360° Celsius to about 84.21° Celsius.
Water Usage Impacts
There will be a circulating water system, which uses special equipment to recycle water. The water system will not discharge any additional waste water affecting the local water table and indeed it will reduce the amount of water used for the production of cement by 211,500 tons every year. The project will therefore have a net environmental benefit in addition to the greenhouse gas emissions reductions.

PROJECT DESIGN DOCUMENT FORM (CDM PDD) - Version 02 CDM – Executive Board page 45
This template shall not be altered. It shall be completed without modifying/adding headings or logo, format or font.
F.2. If environmental impacts are considered significant by the project participants or the host Party, please provide conclusions and all references to support documentation of an environmental impact assessment undertaken in accordance with the procedures as required by the host Party: The Environmental impacts of the Project are considered to be positive and not significantly negative.
PROJECT DESIGN DOCUMENT FORM (CDM PDD) - Version 02 CDM – Executive Board page 46
This template shall not be altered. It shall be completed without modifying/adding headings or logo, format or font.
SECTION G. Stakeholders’ comments G.1. Brief description how comments by local stakeholders have been invited and compiled: Comments from local stakeholders have been sought in the following ways:
An open public meeting held in the local town government building to which about 60 local residents, government officials and representatives from the company attended – see Exhibit 1.
Discussions with the local county government and request for a support letter – see Exhibit 2 Discussions with the local provincial trade association, which is a non-government organisation
involved in sharing best practices amongst the cement industry – a support letter is available in Chinese.
A global stakeholder consultation on the UNFCCC website has yet to be carried out. G.2. Summary of the comments received: The comments from the local population mainly concerned expropriation of land, impacts on water resources and the local environment. After hearing about the CDM and the Project’s positive environmental benefits, zero impact with regard land expropriation and positive impact on water resource usage and conservation all were supportive of the Project. G.3. Report on how due account was taken of any comments received: As there are no adverse comments to the Project Activity and all are supportive of the project, the proponents have completed this Project Design Document for consideration by the relevant authorities.
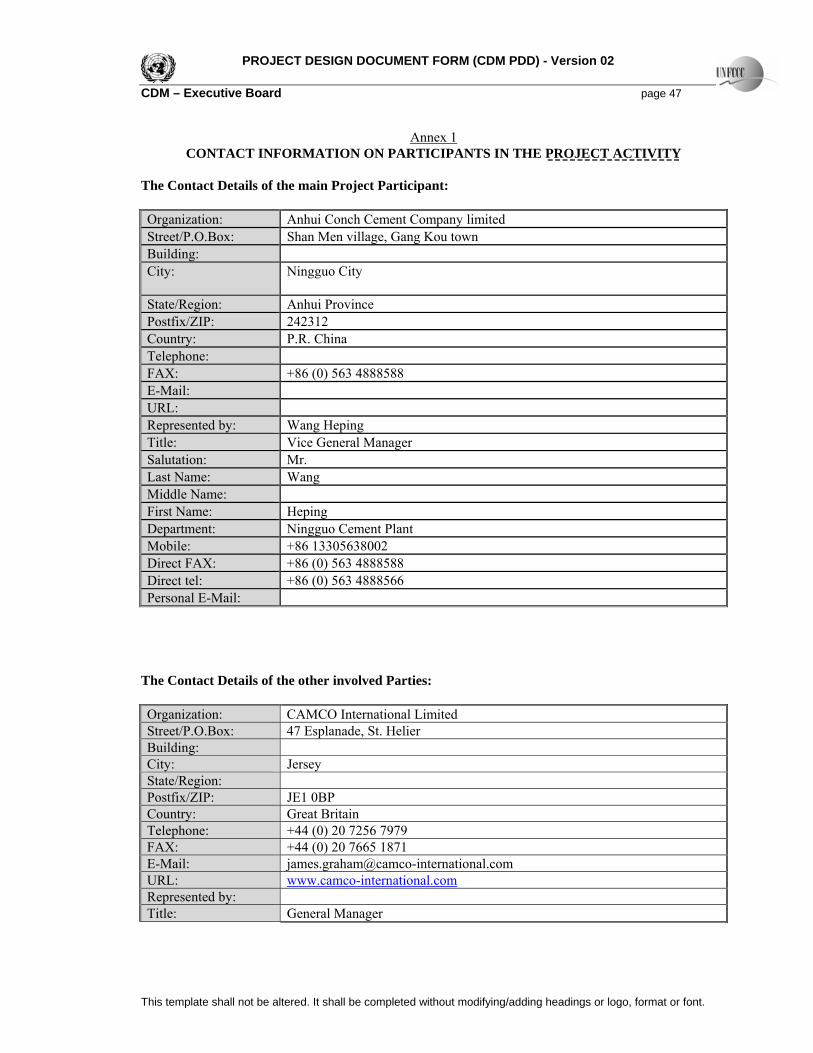
PROJECT DESIGN DOCUMENT FORM (CDM PDD) - Version 02 CDM – Executive Board page 47
This template shall not be altered. It shall be completed without modifying/adding headings or logo, format or font.
Annex 1 CONTACT INFORMATION ON PARTICIPANTS IN THE PROJECT ACTIVITY
The Contact Details of the main Project Participant: Organization: Anhui Conch Cement Company limited Street/P.O.Box: Shan Men village, Gang Kou town Building: City: Ningguo City
State/Region: Anhui Province Postfix/ZIP: 242312 Country: P.R. China Telephone: FAX: +86 (0) 563 4888588 E-Mail: URL: Represented by: Wang Heping Title: Vice General Manager Salutation: Mr. Last Name: Wang Middle Name: First Name: Heping Department: Ningguo Cement Plant Mobile: +86 13305638002 Direct FAX: +86 (0) 563 4888588 Direct tel: +86 (0) 563 4888566 Personal E-Mail:
The Contact Details of the other involved Parties: Organization: CAMCO International Limited Street/P.O.Box: 47 Esplanade, St. Helier Building: City: Jersey State/Region: Postfix/ZIP: JE1 0BP Country: Great Britain Telephone: +44 (0) 20 7256 7979 FAX: +44 (0) 20 7665 1871 E-Mail: [email protected] URL: www.camco-international.com Represented by: Title: General Manager
PROJECT DESIGN DOCUMENT FORM (CDM PDD) - Version 02 CDM – Executive Board page 48
This template shall not be altered. It shall be completed without modifying/adding headings or logo, format or font.
Salutation: Mr. Last Name: Graham Middle Name: First Name: James Department: Mobile: +44 (0) 774 760 2160 Direct FAX: +44 (0) 1225 812103 Direct tel: +44 (0) 1225 816 823 Personal E-Mail: [email protected]

PROJECT DESIGN DOCUMENT FORM (CDM PDD) - Version 02 CDM – Executive Board page 49
This template shall not be altered. It shall be completed without modifying/adding headings or logo, format or font.
Annex 2
INFORMATION REGARDING PUBLIC FUNDING
There is currently no public funding of the Project.
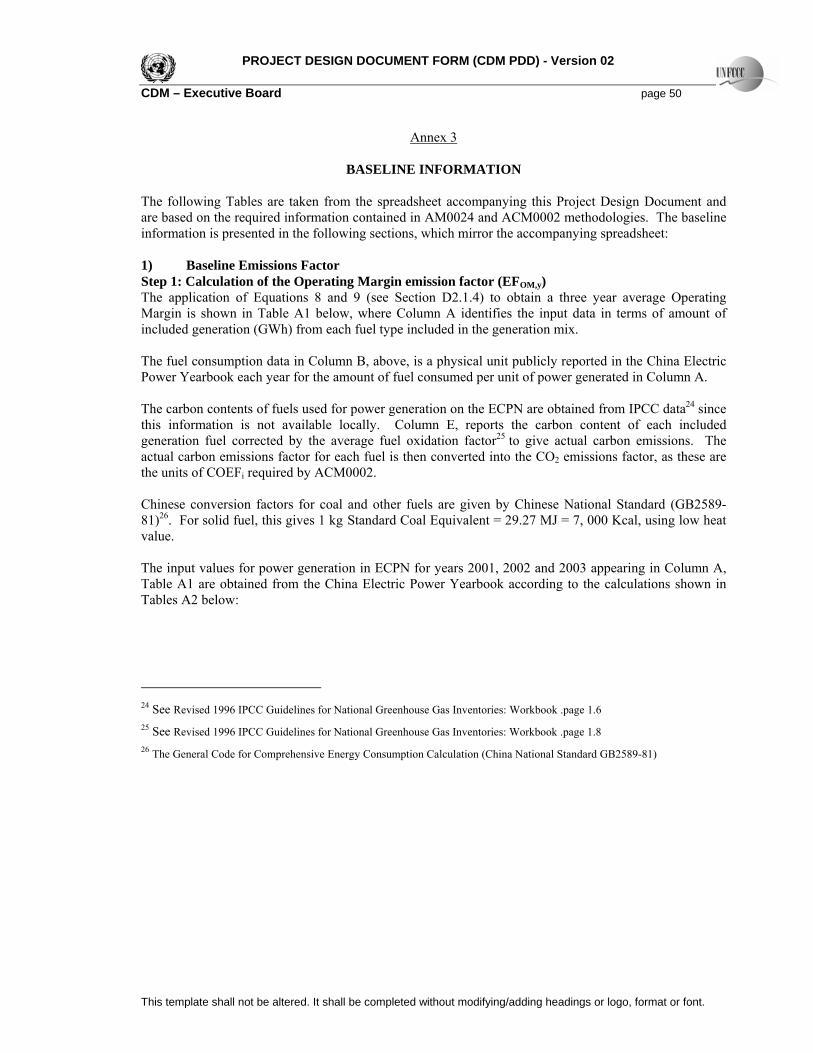
PROJECT DESIGN DOCUMENT FORM (CDM PDD) - Version 02 CDM – Executive Board page 50
This template shall not be altered. It shall be completed without modifying/adding headings or logo, format or font.
Annex 3
BASELINE INFORMATION
The following Tables are taken from the spreadsheet accompanying this Project Design Document and are based on the required information contained in AM0024 and ACM0002 methodologies. The baseline information is presented in the following sections, which mirror the accompanying spreadsheet: 1) Baseline Emissions Factor Step 1: Calculation of the Operating Margin emission factor (EFOM,y) The application of Equations 8 and 9 (see Section D2.1.4) to obtain a three year average Operating Margin is shown in Table A1 below, where Column A identifies the input data in terms of amount of included generation (GWh) from each fuel type included in the generation mix. The fuel consumption data in Column B, above, is a physical unit publicly reported in the China Electric Power Yearbook each year for the amount of fuel consumed per unit of power generated in Column A. The carbon contents of fuels used for power generation on the ECPN are obtained from IPCC data24 since this information is not available locally. Column E, reports the carbon content of each included generation fuel corrected by the average fuel oxidation factor25 to give actual carbon emissions. The actual carbon emissions factor for each fuel is then converted into the CO2 emissions factor, as these are the units of COEFi required by ACM0002. Chinese conversion factors for coal and other fuels are given by Chinese National Standard (GB2589-81)26. For solid fuel, this gives 1 kg Standard Coal Equivalent = 29.27 MJ = 7, 000 Kcal, using low heat value. The input values for power generation in ECPN for years 2001, 2002 and 2003 appearing in Column A, Table A1 are obtained from the China Electric Power Yearbook according to the calculations shown in Tables A2 below:
24 See Revised 1996 IPCC Guidelines for National Greenhouse Gas Inventories: Workbook .page 1.6 25 See Revised 1996 IPCC Guidelines for National Greenhouse Gas Inventories: Workbook .page 1.8 26 The General Code for Comprehensive Energy Consumption Calculation (China National Standard GB2589-81)
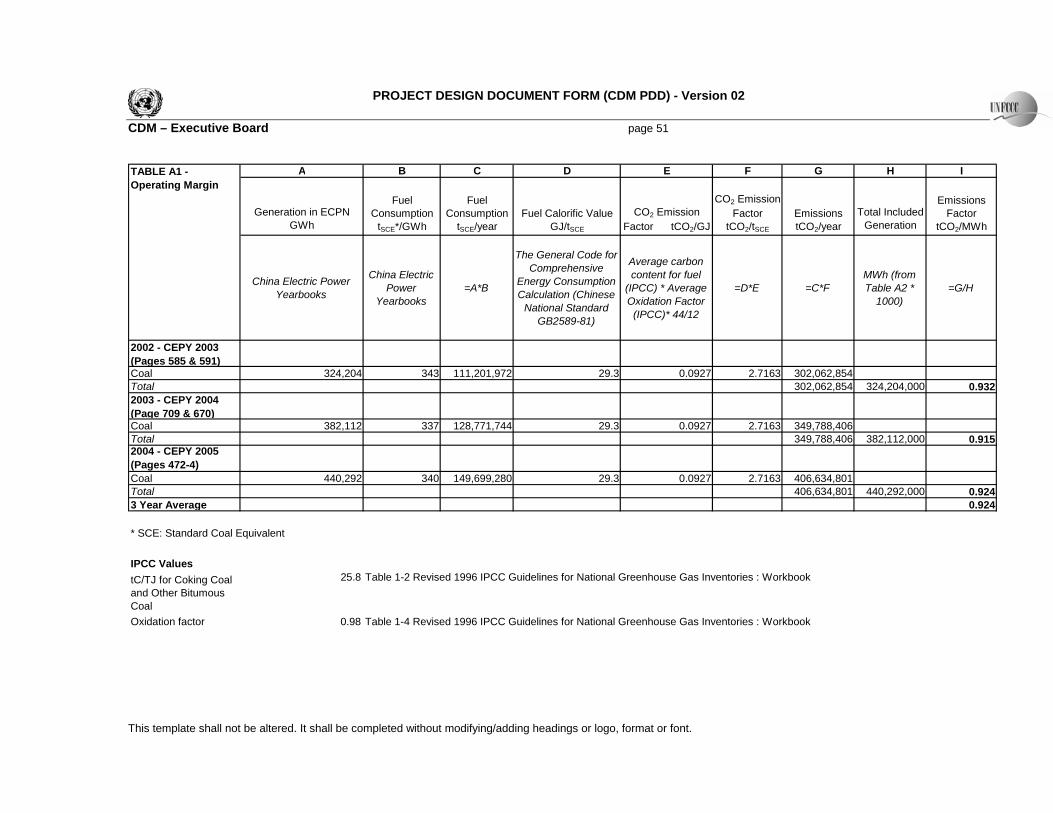
PROJECT DESIGN DOCUMENT FORM (CDM PDD) - Version 02 CDM – Executive Board page 51
This template shall not be altered. It shall be completed without modifying/adding headings or logo, format or font.
A B C D E F G H I
Generation in ECPN GWh
Fuel Consumption
tSCE*/GWh
Fuel Consumption
tSCE/yearFuel Calorific Value
GJ/tSCE
CO2 Emission Factor tCO2/GJ
CO2 Emission Factor
tCO2/tSCE
Emissions tCO2/year
Total Included Generation
Emissions Factor
tCO2/MWh
China Electric Power Yearbooks
China Electric Power
Yearbooks=A*B
The General Code for Comprehensive
Energy Consumption Calculation (Chinese
National Standard GB2589-81)
Average carbon content for fuel
(IPCC) * Average Oxidation Factor
(IPCC)* 44/12
=D*E =C*FMWh (from Table A2 *
1000)=G/H
2002 - CEPY 2003 (Pages 585 & 591)Coal 324,204 343 111,201,972 29.3 0.0927 2.7163 302,062,854Total 302,062,854 324,204,000 0.9322003 - CEPY 2004 (Page 709 & 670)Coal 382,112 337 128,771,744 29.3 0.0927 2.7163 349,788,406Total 349,788,406 382,112,000 0.9152004 - CEPY 2005 (Pages 472-4) Coal 440,292 340 149,699,280 29.3 0.0927 2.7163 406,634,801Total 406,634,801 440,292,000 0.9243 Year Average 0.924
* SCE: Standard Coal Equivalent
IPCC ValuestC/TJ for Coking Coal and Other Bitumous Coal
25.8 Table 1-2 Revised 1996 IPCC Guidelines for National Greenhouse Gas Inventories : Workbook
Oxidation factor 0.98 Table 1-4 Revised 1996 IPCC Guidelines for National Greenhouse Gas Inventories : Workbook
TABLE A1 - Operating Margin
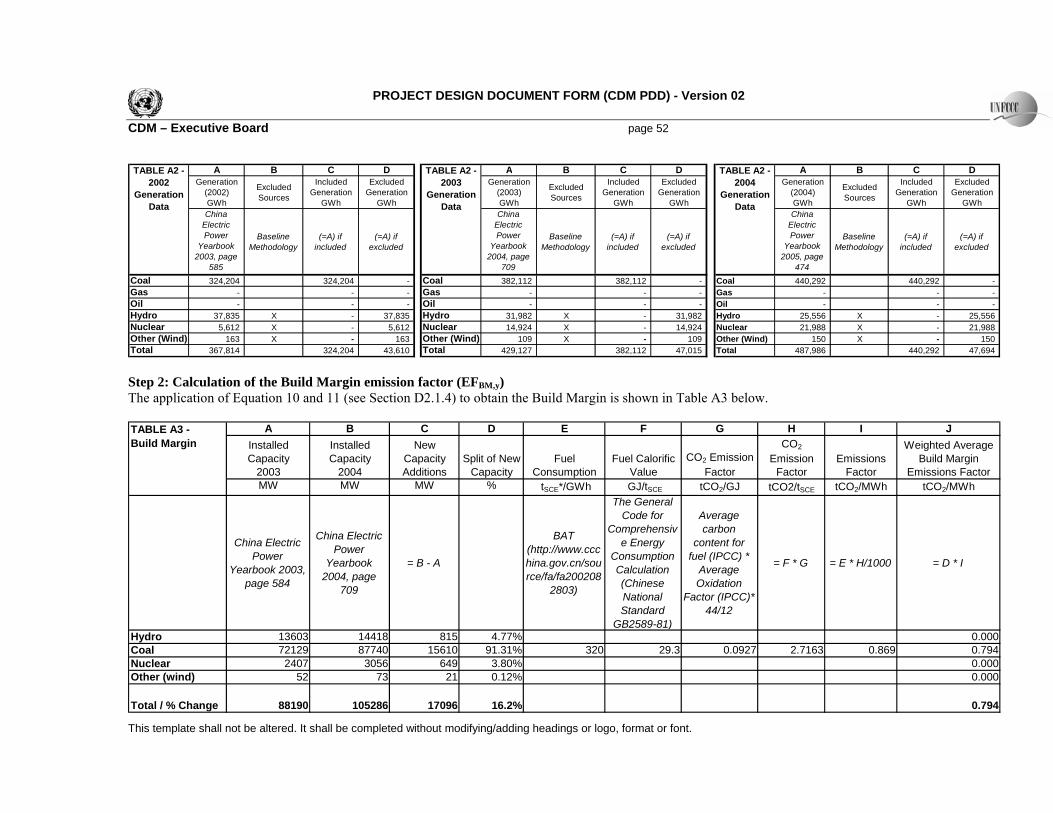
PROJECT DESIGN DOCUMENT FORM (CDM PDD) - Version 02 CDM – Executive Board page 52
This template shall not be altered. It shall be completed without modifying/adding headings or logo, format or font.
A B C D A B C D A B C DGeneration
(2002) GWh
Excluded Sources
Included Generation
GWh
Excluded Generation
GWh
Generation (2003) GWh
Excluded Sources
Included Generation
GWh
Excluded Generation
GWh
Generation (2004) GWh
Excluded Sources
Included Generation
GWh
Excluded Generation
GWhChina
Electric Power
Yearbook 2003, page
585
Baseline Methodology
(=A) if included
(=A) if excluded
China Electric Power
Yearbook 2004, page
709
Baseline Methodology
(=A) if included
(=A) if excluded
China Electric Power
Yearbook 2005, page
474
Baseline Methodology
(=A) if included
(=A) if excluded
Coal 324,204 324,204 - Coal 382,112 382,112 - Coal 440,292 440,292 -Gas - - - Gas - - - Gas - - -Oil - - - Oil - - - Oil - - -Hydro 37,835 X - 37,835 Hydro 31,982 X - 31,982 Hydro 25,556 X - 25,556 Nuclear 5,612 X - 5,612 Nuclear 14,924 X - 14,924 Nuclear 21,988 X - 21,988 Other (Wind) 163 X - 163 Other (Wind) 109 X - 109 Other (Wind) 150 X - 150 Total 367,814 324,204 43,610 Total 429,127 382,112 47,015 Total 487,986 440,292 47,694
TABLE A2 - 2002
Generation Data
TABLE A2 - 2003
Generation Data
TABLE A2 - 2004
Generation Data
Step 2: Calculation of the Build Margin emission factor (EFBM,y) The application of Equation 10 and 11 (see Section D2.1.4) to obtain the Build Margin is shown in Table A3 below.
A B C D E F G H I JInstalled Capacity
2003
Installed Capacity
2004
New Capacity Additions
Split of New Capacity
Fuel Consumption
Fuel Calorific Value
CO2 Emission Factor
CO2
Emission Factor
Emissions Factor
Weighted Average Build Margin
Emissions FactorMW MW MW % tSCE*/GWh GJ/tSCE tCO2/GJ tCO2/tSCE tCO2/MWh tCO2/MWh
China Electric Power
Yearbook 2003, page 584
China Electric Power
Yearbook 2004, page
709
= B - A
BAT (http://www.ccchina.gov.cn/source/fa/fa200208
2803)
The General Code for
Comprehensive Energy
Consumption Calculation (Chinese National Standard
GB2589-81)
Average carbon
content for fuel (IPCC) *
Average Oxidation
Factor (IPCC)* 44/12
= F * G = E * H/1000 = D * I
Hydro 13603 14418 815 4.77% 0.000Coal 72129 87740 15610 91.31% 320 29.3 0.0927 2.7163 0.869 0.794Nuclear 2407 3056 649 3.80% 0.000Other (wind) 52 73 21 0.12% 0.000
Total / % Change 88190 105286 17096 16.2% 0.794
TABLE A3 - Build Margin
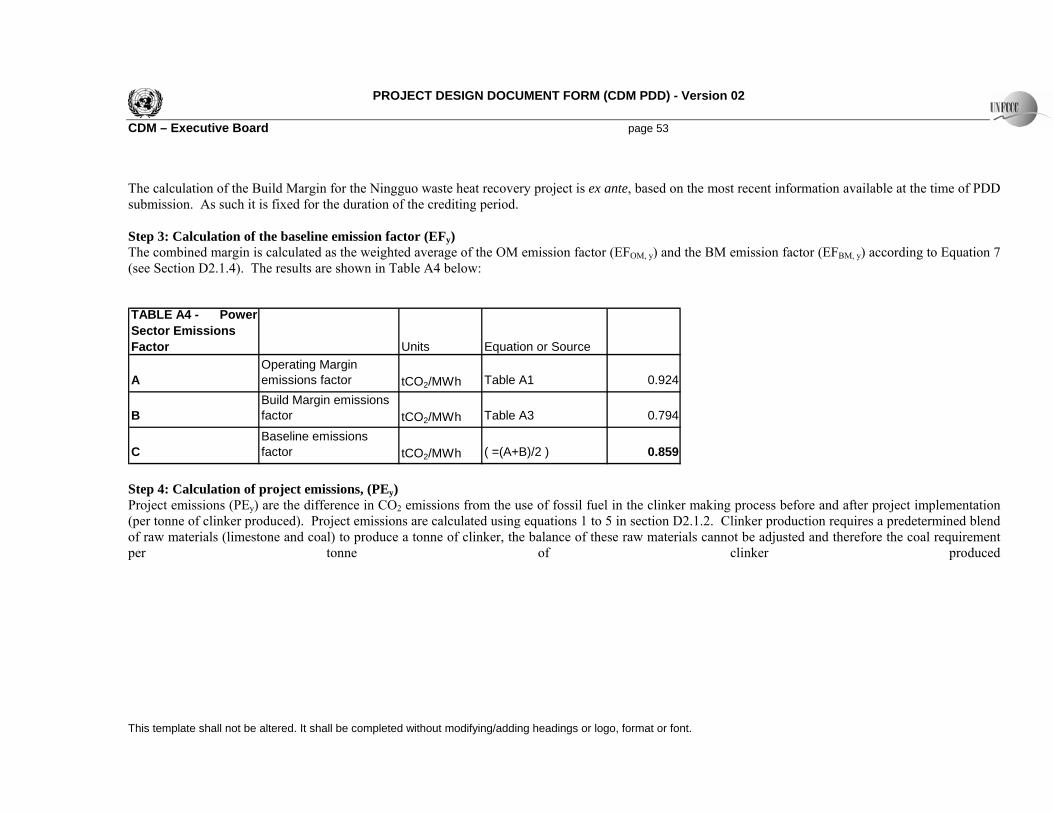
PROJECT DESIGN DOCUMENT FORM (CDM PDD) - Version 02 CDM – Executive Board page 53
This template shall not be altered. It shall be completed without modifying/adding headings or logo, format or font.
The calculation of the Build Margin for the Ningguo waste heat recovery project is ex ante, based on the most recent information available at the time of PDD submission. As such it is fixed for the duration of the crediting period. Step 3: Calculation of the baseline emission factor (EFy) The combined margin is calculated as the weighted average of the OM emission factor (EFOM, y) and the BM emission factor (EFBM, y) according to Equation 7 (see Section D2.1.4). The results are shown in Table A4 below: TABLE A4 - Power Sector Emissions Factor Units Equation or Source
AOperating Margin emissions factor tCO2/MWh Table A1 0.924
BBuild Margin emissions factor tCO2/MWh Table A3 0.794
CBaseline emissions factor tCO2/MWh ( =(A+B)/2 ) 0.859
Step 4: Calculation of project emissions, (PEy) Project emissions (PEy) are the difference in CO2 emissions from the use of fossil fuel in the clinker making process before and after project implementation (per tonne of clinker produced). Project emissions are calculated using equations 1 to 5 in section D2.1.2. Clinker production requires a predetermined blend of raw materials (limestone and coal) to produce a tonne of clinker, the balance of these raw materials cannot be adjusted and therefore the coal requirement per tonne of clinker produced
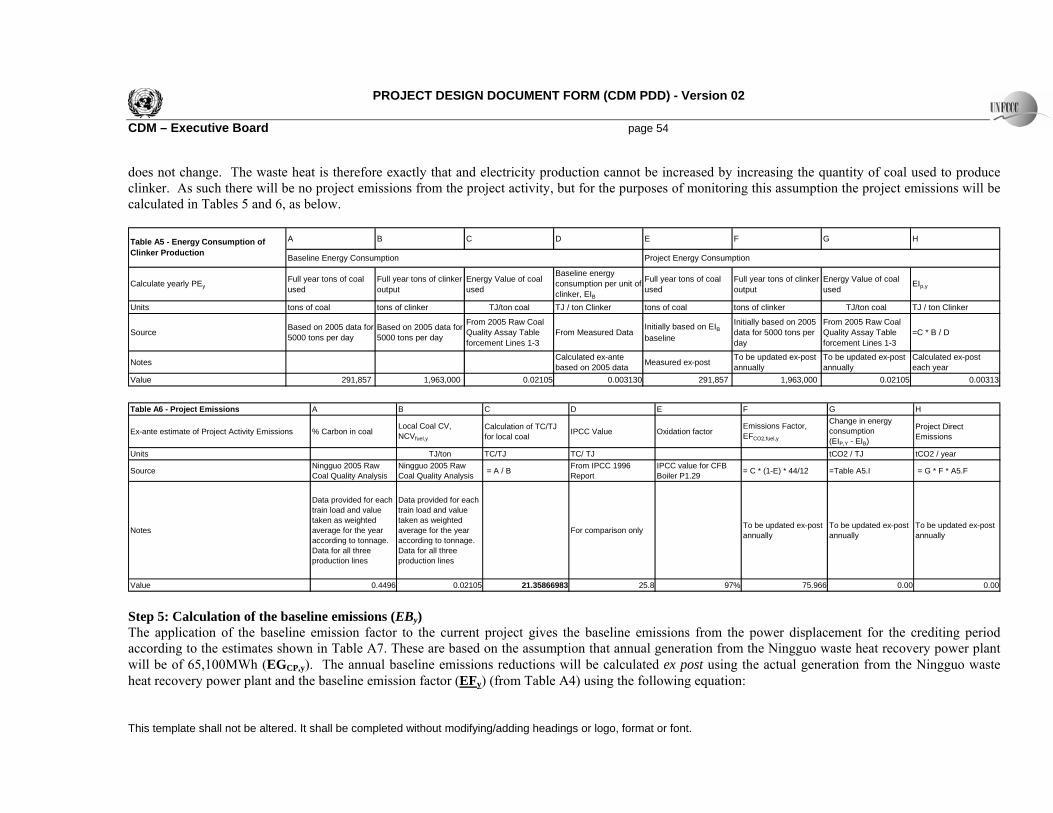
PROJECT DESIGN DOCUMENT FORM (CDM PDD) - Version 02 CDM – Executive Board page 54
This template shall not be altered. It shall be completed without modifying/adding headings or logo, format or font.
does not change. The waste heat is therefore exactly that and electricity production cannot be increased by increasing the quantity of coal used to produce clinker. As such there will be no project emissions from the project activity, but for the purposes of monitoring this assumption the project emissions will be calculated in Tables 5 and 6, as below.
A B C D E F G H
Calculate yearly PEyFull year tons of coal used
Full year tons of clinker output
Energy Value of coal used
Baseline energy consumption per unit of clinker, EIB
Full year tons of coal used
Full year tons of clinker output
Energy Value of coal used
EIp,y
Units tons of coal tons of clinker TJ/ton coal TJ / ton Clinker tons of coal tons of clinker TJ/ton coal TJ / ton Clinker
Source Based on 2005 data for 5000 tons per day
Based on 2005 data for 5000 tons per day
From 2005 Raw Coal Quality Assay Table forcement Lines 1-3
From Measured DataInitially based on EIB
baseline
Initially based on 2005 data for 5000 tons per day
From 2005 Raw Coal Quality Assay Table forcement Lines 1-3
=C * B / D
Notes Calculated ex-ante based on 2005 data Measured ex-post To be updated ex-post
annuallyTo be updated ex-post annually
Calculated ex-post each year
Value 291,857 1,963,000 0.02105 0.003130 291,857 1,963,000 0.02105 0.00313
Table A5 - Energy Consumption of Clinker Production Baseline Energy Consumption Project Energy Consumption
Table A6 - Project Emissions A B C D E F G H
Ex-ante estimate of Project Activity Emissions % Carbon in coalLocal Coal CV, NCVfuel,y
Calculation of TC/TJ for local coal IPCC Value Oxidation factor
Emissions Factor, EFCO2,fuel,y
Change in energy consumption (EIP,Y - EIB)
Project Direct Emissions
Units TJ/ton TC/TJ TC/ TJ tCO2 / TJ tCO2 / year
Source Ningguo 2005 Raw Coal Quality Analysis
Ningguo 2005 Raw Coal Quality Analysis = A / B From IPCC 1996
ReportIPCC value for CFB Boiler P1.29 = C * (1-E) * 44/12 =Table A5.I = G * F * A5.F
Notes
Data provided for each train load and value taken as weighted average for the year according to tonnage. Data for all three production lines
Data provided for each train load and value taken as weighted average for the year according to tonnage. Data for all three production lines
For comparison only To be updated ex-post annually
To be updated ex-post annually
To be updated ex-post annually
Value 0.4496 0.02105 21.35866983 25.8 97% 75.966 0.00 0.00 Step 5: Calculation of the baseline emissions (EBy) The application of the baseline emission factor to the current project gives the baseline emissions from the power displacement for the crediting period according to the estimates shown in Table A7. These are based on the assumption that annual generation from the Ningguo waste heat recovery power plant will be of 65,100MWh (EGCP,y). The annual baseline emissions reductions will be calculated ex post using the actual generation from the Ningguo waste heat recovery power plant and the baseline emission factor (EFy) (from Table A4) using the following equation:
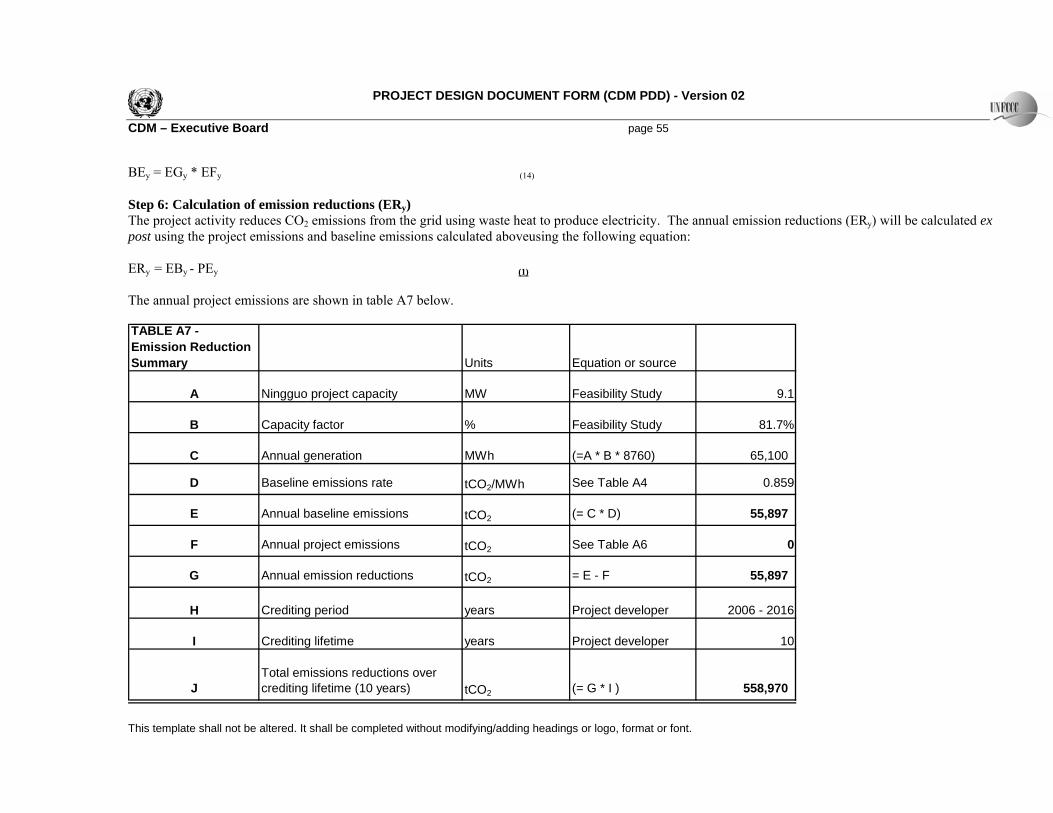
PROJECT DESIGN DOCUMENT FORM (CDM PDD) - Version 02 CDM – Executive Board page 55
This template shall not be altered. It shall be completed without modifying/adding headings or logo, format or font.
BEy = EGy * EFy (14) Step 6: Calculation of emission reductions (ERy) The project activity reduces CO2 emissions from the grid using waste heat to produce electricity. The annual emission reductions (ERy) will be calculated ex post using the project emissions and baseline emissions calculated aboveusing the following equation: ERy = EBy - PEy (1) The annual project emissions are shown in table A7 below. TABLE A7 - Emission Reduction Summary Units Equation or source
A Ningguo project capacity MW Feasibility Study 9.1
B Capacity factor % Feasibility Study 81.7%
C Annual generation MWh (=A * B * 8760) 65,100
D Baseline emissions rate tCO2/MWh See Table A4 0.859
E Annual baseline emissions tCO2 (= C * D) 55,897
F Annual project emissions tCO2 See Table A6 0
G Annual emission reductions tCO2 = E - F 55,897
H Crediting period years Project developer 2006 - 2016
I Crediting lifetime years Project developer 10
JTotal emissions reductions over crediting lifetime (10 years) tCO2 (= G * I ) 558,970

PROJECT DESIGN DOCUMENT FORM (CDM PDD) - Version 02 CDM – Executive Board page 56
This template shall not be altered. It shall be completed without modifying/adding headings or logo, format or font.
Annex 4
MONITORING PLAN
There are three key types of information that must be monitored according to the new proposed monitoring methodology “Baseline methodology for greenhouse gas reductions through waste heat recovery and utilisation for power generation at cement plants”:
1) Measurable/calculated information that is collected once prior to validation of the Project Design Document
2) Documented evidences of various sorts that are collected once prior to validation of the Project Design Document
3) Information that must be monitored ex-post, notably: i. The Generation output from the Project Activity, EGy ii. The changes in specific energy consumption per unit clinker output of the clinker lines connected to the Project Activity EIp,y, as a result of the Project Activity to calculate the project emissions from any such changes, PEy
For items 1 and 2 above, copies of these values/documents will be included in the Project’s CDM Manual and Monitoring and Verification Plan, which the validator and verifier can check annually. For item 3 above, an outline of the specific ex-post monitoring plan for the Project is now described. Monitoring of the generation output from the Project Activity, EGy, The internal meters are maintained and recorded on a monthly basis by the Measuring and Metering Department of the Ningguo. The meter readings can be checked against electrical sales records from the cement plant. The meters are calibrated according to internal procedures and by qualified staff from the local power grid company. Meter inspections are carried out with all parties to the meter reading being present to witness the reading. The net meters are the property of the East China Power Network and are maintained by them according to national calibration and maintenance procedures. The changes in fuel consumption per unit output of the cement works, EIp,y, as a result of the Project Activity to calculate the project emissions, PEy The changes in fuel consumption per unit output of the 5000 ton per day production lines will be monitored on a monthly basis by recording:
The fuel consumed by each line (value taken from the weighing machine on the “fuel in” conveyor from the mine to the cement plant)
The output of clinker from each line (value taken from the weighting machine on the “output” side of the production lines)
On an annual basis this will be checked against the baseline values. Currently this value is 0.14 tons of as used raw coal per ton of clinker produced which equates to 0.003219 TJ / t clinker output, but 2005 will be used as the benchmark year for this value.
Quality Assurance and Quality Control

PROJECT DESIGN DOCUMENT FORM (CDM PDD) - Version 02 CDM – Executive Board page 57
This template shall not be altered. It shall be completed without modifying/adding headings or logo, format or font.
The cement plant’s quality assurance and quality control procedures for recording, maintaining and archiving data will need to be improved as part of this CDM project. This is an on-going process which will be ensured through the CDM mechanism in terms of the need for verification of the emissions on an annual basis.