Embed Size (px)
Citation preview
PROJECT DESIGN DOCUMENT FORM (CDM PDD) - Version 03.1. CDM – Executive Board page 1
CLEAN DEVELOPMENT MECHANISM PROJECT DESIGN DOCUMENT FORM (CDM-PDD)
Version 03 - in effect as of: 28 July 2006
CONTENTS A. General description of project activity B. Application of a baseline and monitoring methodology C. Duration of the project activity / crediting period D. Environmental impacts E. Stakeholders’ comments
Annexes Annex 1: Contact information on participants in the project activity Annex 2: Information regarding public funding Annex 3: Baseline information
Annex 4: Monitoring plan

PROJECT DESIGN DOCUMENT FORM (CDM PDD) - Version 03.1. CDM – Executive Board page 2 SECTION A. General description of project activity A.1 Title of the project activity: >> “20MW Bagasse based Cogeneration power project” at Bannari Amman Sugars Limited
Sathyamangalam, Tamil Nadu
Version 02
16/05/2007
A.2. Description of the project activity: >> Purpose
The project activity aims to improve the efficiency of power generation from biomass residues and export
the resulting surplus electricity to the State Electricity Grid.
The project activity has been implemented in one of the sugar factories of M/s. Bannari Amman Sugars
Limited (BASL) situated at Sathyamangalam, Erode District, Tamil Nadu. BASL is a part of the Bannari
Amman Group, a leading industrial conglomerate engaged in the manufacturing of sugar, industrial
alcohols, granites, power generation and distribution. Prior to implementation of the project activity, BASL
was generating steam and power from its mill generated bagasse, through two low pressure boilers and two
turbo generator (TG) sets. The generated steam and power were utilized to meet the captive energy
requirements of the sugar factory.
BASL has replaced the low pressure system with a new 20 MW high pressure cogeneration plant (“project
activity”) in order to improve the energy efficiency and increase power generation thereby facilitating the
export of electricity to the TamilNadu Electricity Board (TNEB) grid, which is part of the southern
regional grid of India. By exporting renewable electricity to the grid, the project activity displaces fossil
fuel intensive electricity from the grid connected power plants and results in emission reductions.
Project’s contribution to sustainable development
Social well-being
The project activity helps to bridge the gap of electricity demand and supply at local and national level. The
location of the project activity in rural setting contributes towards poverty alleviation by generating both
direct and indirect employment. The project activity generates additional income for BASL, enabling the
PROJECT DESIGN DOCUMENT FORM (CDM PDD) - Version 03.1. CDM – Executive Board page 3 allocation of funds to continue its social welfare measures like health camps, infrastructure development,
dissemination of latest agricultural techniques etc.
Economic well-being
The project activity being situated at a remote part of the grid serves as a decentralized grid power source.
The improved power quality has a direct positive impact on the region’s economic growth through better
productivity and quality of life. The revenues from sale of electricity would provide sufficient funds for
BASL to expand its sugar crushing capacity, leading to higher cane demand that would boost local
employment and improve the income level of farmers in the region.
Environmental well-being
The CO2 emissions of the combustion process due to burning of bagasse are consumed by the sugarcane
plant during its growth, representing a cyclic process, thereby leading to zero net CO2 emission. The export
of surplus electricity to the grid reduces the emission of environmentally harmful gases including GHGs
from fossil fuel power plants.
Technological well-being
The project activity uses the most efficient and environment friendly technology of cogeneration available
in the renewable energy sector at the time of its implementation. The successful demonstration of the high
pressure (87 ata and 515ºC) cogeneration technology helps to accelerate the conversion from lesser steam
parameters (32 or 44 ata) prevalent in the country to high efficiency high pressure systems.
A.3. Project participants: >>
Name of Party involved
(*)
(host indicates a host
Party)
Private and/or public entity(ies)
project participants (*)
(as applicable)
Kindly indicate if the
Party involved wishes to
be considered as project
participant
India (Host Country) Bannari Amman Sugars Limited –
Private Entity
No
PROJECT DESIGN DOCUMENT FORM (CDM PDD) - Version 03.1. CDM – Executive Board page 4 A.4. Technical description of the project activity: A.4.1. Location of the project activity: >> A.4.1.1. Host Party(ies): >> India A.4.1.2. Region/State/Province etc.: >> Tamil Nadu A.4.1.3. City/Town/Community etc: >> Alathukombai Village, Sathyamangalam Taluk, Erode District A.4.1.4. Detail of physical location, including information allowing the unique identification of this project activity (maximum one page): >>
The 20 MW cogeneration plant is located adjacent to BASL’s sugar factory at Alathukombai village of
Sathyamangalam taluk (11.3°N 77.17°E), Erode District in the state of Tamil Nadu and has been operating
since 1986. The nearest railway station is Erode. TNEB electrical sub-station for power export of 20 MVA
is situated very near to this project, approximately two kilometres to where the surplus power is exported.
Other requirements of the cogeneration project including water requirement, infrastructure facilities are
also available at the site.

PROJECT DESIGN DOCUMENT FORM (CDM PDD) - Version 03.1. CDM – Executive Board page 5
Tamil Nadu, India
Erode District, Tamil Nadu
Sathyamangalam, Erode District
PROJECT DESIGN DOCUMENT FORM (CDM PDD) - Version 03.1. CDM – Executive Board page 6 A.4.2. Category(ies) of project activity: >>
The project activity generates electricity from bagasse, which is a renewable fuel and therefore can be categorized under “Category 1: Energy industries (renewable / non-renewable sources)” as prescribed in the latest ‘List of Sectoral Scopes’ available at UNFCCC website.
A.4.3. Technology to be employed by the project activity: >>
The cogeneration plant consists of a high pressure boiler; a suitable collaterally operating TG set and
associated auxiliary equipment. The boiler is designed to generate 120 TPH steam at 87 ata pressure and
515ºC temperature using bagasse as the main fuel. The high pressure configuration has a better efficiency
than the low pressure system, resulting in the generation of higher quantity of steam at a higher enthalpy
for the same quantity of biomass input. The inlet feed water will be at 170 ºC with the feed water heated in
high pressure feed water heaters. The TG set is rated for a nominal output of 20 MW with inlet steam
parameters of 87 ata and 515ºC. The steam-power ratio has increased to around 5.4 kg/kWh as compared
to 10 kg/kWh in the pre-project scenario. The turbo-generator is of double extraction cum condensing type
capable of operating during off-season when there is no process steam requirement. Surplus bagasse during
season will be stored for operation in the off-season period.
• The boiler and turbo Generators are fully automated to improve the operational efficiency. All the
steam turbine driven mills are replaced with DC drives and all Induced Draft (ID), Forced Draft
(FD), Secondary Air (SA) fans and boiler feed pumps are with Variable Frequency Drives (VFD)
drives for energy conservation. Pressure regulating and De-superheating System (PRDS) system
with automation is introduced to ensure continuous working of mill during grid failure. To reduce
blow-down, water quality is maintained at the required parameter and make-up water is used from
Reverse Osmosis (RO) plant. As the TG is of extraction cum condensing type, the steam during
sugar mill stoppages need not be let out, which would in turn reduce the specific steam
consumption.
• The auxiliary plant systems include:
• Fuel (bagasse / biomass) handling system
• Ash handling system
PROJECT DESIGN DOCUMENT FORM (CDM PDD) - Version 03.1. CDM – Executive Board page 7
• Cooling water system
• Raw water and de-mineralized (DM) water system
• Instrument air system, electrical system and EHV transmission system
The cogeneration plant generates a total power of 20 MW during season and off-season. After meeting
steam and power requirements of sugar plant, cogeneration plant auxiliaries and BASL’s adjacent granite
factory, about 13.0 MW of surplus power during season and 17.5 MW during off-season are being
exported to TNEB grid. The power generated in the TG set will be at 11 KV level, stepped down to 415V
for feeding the plant equipments and stepped up to 110 KV for paralleling with the TNEB grid at the
electrical sub-station, which is situated approximately two kilometres from the plant. Considering the
overall electrical energy efficiency in the pre-project and project scenarios, the net quantity of increased
electrical energy generation as a result of the project activity during the 10-year crediting period would be
around 950.50 Million kWhs.
The project activity involves complete replacement of the existing low pressure biomass cogeneration
system with a new high pressure system. The high pressure configuration is more efficient, and therefore,
the electricity generated from a certain quantity of biomass is higher than in the low pressure system; the
average annual generation prior to the project activity was around 24.8 Million kWhs and increased to
119.1 Million kWhs after implementing the project activity. The incremental electricity generated is
exported to the TNEB grid resulting in the displacement of an equivalent generation from sources
connected to the grid.
The TNEB grid is interlinked with other state grids in southern India with significant quantity of energy
exchanges and therefore, the electricity exported by the project activity to the TNEB grid may be
considered to displace equivalent electricity from the southern regional grid. The electricity generation mix
of southern regional grid is GHG emission intensive; the emission factor representing present and future
grid mix is calculated to be 0.86 tCO2 per MWh (Refer Annex 3). Thus, the project activity, by exporting
950.5 Million kWhs of electricity to the southern regional grid, is expected to reduce GHG emissions of
817,430 tons over a ten year period.
PROJECT DESIGN DOCUMENT FORM (CDM PDD) - Version 03.1. CDM – Executive Board page 8
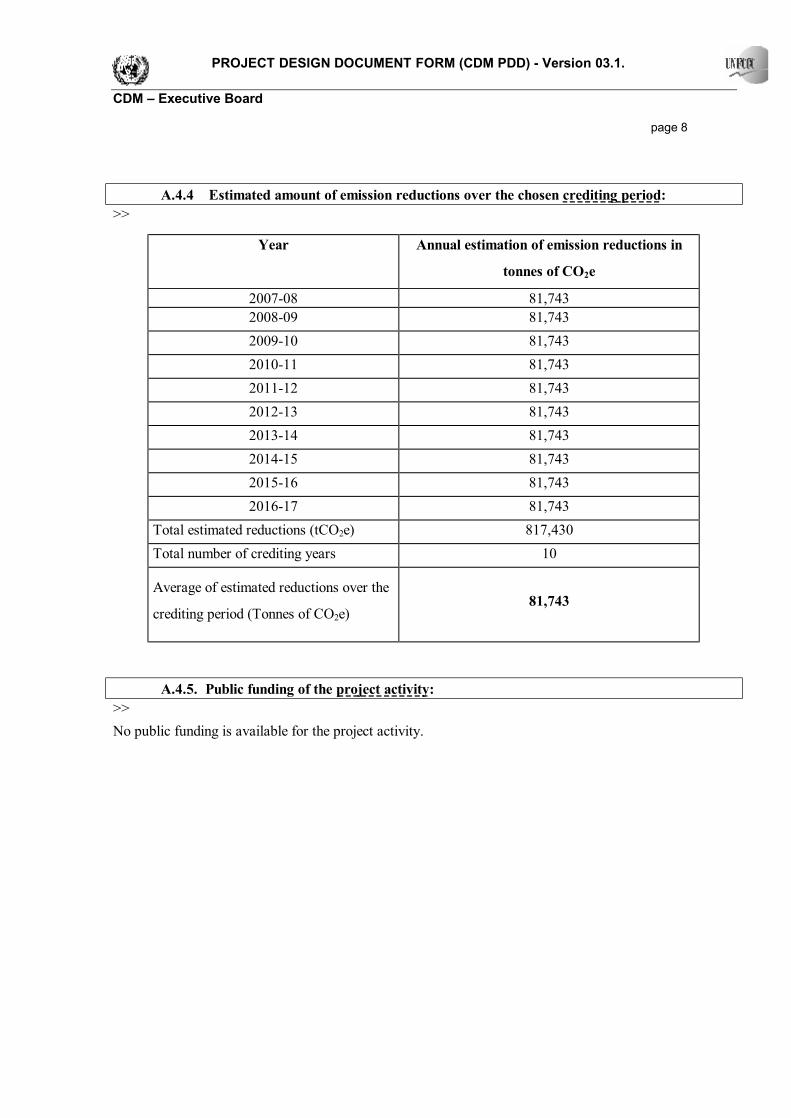
A.4.4 Estimated amount of emission reductions over the chosen crediting period: >>
A.4.5. Public funding of the project activity: >> No public funding is available for the project activity.
Year Annual estimation of emission reductions in
tonnes of CO2e
2007-08 81,743 2008-09 81,743 2009-10 81,743 2010-11 81,743 2011-12 81,743 2012-13 81,743 2013-14 81,743 2014-15 81,743 2015-16 81,743 2016-17 81,743
Total estimated reductions (tCO2e) 817,430 Total number of crediting years 10
Average of estimated reductions over the
crediting period (Tonnes of CO2e) 81,743

PROJECT DESIGN DOCUMENT FORM (CDM PDD) - Version 03.1. CDM – Executive Board page 9
SECTION B. Application of a baseline and monitoring methodology B.1. Title and reference of the approved baseline and monitoring methodology applied to the project activity: >> Title: Consolidated baseline methodology for grid-connected electricity generation from biomass
residues (ACM0006) Version 04
Reference: This consolidated baseline methodology (ACM0006) is based on elements from the following
methodologies:
• AM0004: “Grid-connected Biomass Power-Generation that avoids uncontrolled burning of
biomass which is based on the A.T Bio power Rice Husk Power Project in Thailand.”
• AM0015: “Bagasse-based cogeneration connected to an electricity grid based on the proposal
submitted by Vale do Rosario Bagasse Cogeneration, Brazil.”
• NM0050: “Ratchasima SPP Expansion Project in Thailand.”
• NM0081: “Trupan biomass cogeneration project in Chile.”
• NM0098: “Nobrecel fossil to biomass fuel switch project in Brazil”
This methodology also refers to the ACM0002 (“Consolidated baseline methodology for grid-connected
electricity generation from renewable sources”) and the latest version of the “Tool for the demonstration
and assessment of additionality”.

PROJECT DESIGN DOCUMENT FORM (CDM PDD) - Version 03.1. CDM – Executive Board page 10 B.2 Justification of the choice of the methodology and why it is applicable to the project activity: >>
The project activity generates electricity from the combustion of bagasse, a renewable biomass residue
from the sugar mill, and feeds surplus electricity to the grid. All the applicability criteria of ACM0006
have been met by the project activity as described under:
Conditions of ACM0006 Applicability to project activity
Applicable to grid connected and biomass residue
fired electricity generation project activities
Bagasse fired in the project activity is a biomass
residue. The project activity is connected to the
TNEB grid to which it exports surplus electricity
Involves the improvement of energy efficiency of an
existing power generation plant
The project involves the energy efficiency
improvement of a power plant by replacing with a
high efficiency power plant
May be based on the operation of a power generation
unit located in an agro-industrial plant generating the
biomass residues
Based on the efficiency improvement of a power
generation unit located in a sugar plant
Biomass residues are defined as biomass that is a by-
product, residue or waste stream from agriculture,
forestry and related industries. This shall not include
municipal waste or other wastes that contain
fossilized and/or non-biodegradable material.
Bagasse used in the project activity is a residue from
agriculture related industry (sugar plant)
No other biomass types than biomass residues, as
defined above, are used in the project plant and these
biomass residues are the predominant fuel used in the
project plant (some fossil fuels may be co-fired).
Bagasse will be used as the predominant fuel,
however, some amount of coal may be co-fired
during drought or other emergency situations
For projects that use biomass residues from a
production process (e.g. production of sugar or wood
panel boards), the implementation of the project shall
not result in an increase of the processing capacity of
raw input (e.g. sugar, rice, logs, etc.) or in other
The project activity uses the residue (bagasse) from
sugar manufacturing. The production process is
independent of the project activity and has not
resulted in increase of the sugar plant crushing
capacity.

PROJECT DESIGN DOCUMENT FORM (CDM PDD) - Version 03.1. CDM – Executive Board page 11 substantial changes (e.g. product change) in this
process.
The biomass used by the project facility should not be
stored for more than one year.
Bagasse is not stored on the site for more than one
year.
No significant energy quantities, except from
transportation of the biomass, are required to prepare
the biomass residues for fuel combustion
The preparation of bagasse doesn’t involve
significant energy consumption. Some quantity of
energy may be used for biomass transportation from
outside during unavailability of bagasse.
The methodology is only applicable for the 17
combinations of project activities and baseline
scenarios identified in the methodology.
Project activity fits in scenario 14.
For the project activity, Scenario 14 – Energy Efficiency Projects has been used since the project involves
improving the energy efficiency by replacing the existing boiler and turbine configuration. The replacement
increases the power generation capacity while the thermal biomass firing capacity is maintained. In the
absence of the project activity, the existing power plant had sufficient lifetime to continue operating till the
end of the 10 year crediting period. In the absence of the project activity, the same type and quantity of
biomass residues as in the project plant would be used in the existing power plant. For details, refer Section
B.4 below.

PROJECT DESIGN DOCUMENT FORM (CDM PDD) - Version 03.1. CDM – Executive Board page 12 B.3. Description of the sources and gases included in the project boundary >>
The following emission sources are included for determining the GHG emissions of the project
activity:
• CO2 emissions from on-site fossil fuel and electricity consumption that is attributable to the project
activity. This includes fossil fuels co-fired in the project plant, fossil fuels used for on-site
transportation or fossil fuels or electricity used for the preparation of the biomass residues, e.g., the
operation of shredders or other equipment, as well as any other sources that are attributable to the
project activity; and
• CO2 emissions from off-site transportation of biomass residues that are combusted in the project
plant.
For the purpose of determining the baseline, project participants have included the following emission
sources:
• CO2 emissions from fossil fuel fired power plants connected to the electricity system; and
• CO2 emissions from fossil fuel based heat generation that is displaced through the project activity.
Methane emissions are excluded from both project and baseline emissions,
The spatial extent of the project activity includes:
• Fuel storage and processing area
• Boiler, TG set and all other power generating equipments, captive consumption units, steam
consuming equipments and auxiliary equipments.
• The means for transportation of biomass residues to the project site
• All grid connected power plants of the southern regional grid.

PROJECT DESIGN DOCUMENT FORM (CDM PDD) - Version 03.1. CDM – Executive Board page 13
Fig B.1: Project boundary of BASL’s project activity, Sathyamangalam
Electricity Grid
End user
CO2 sequestration
by plant growth
Biomass fired high-pressure boiler
CO2 emissions
BASL Sugar plant, Sathyamangalam
Bagasse
Project boundary
Power generating unit
Captive power consumption
Auxiliary power consumption
Outside biomass transportation
Temporary storage of biomass
Coal Storage (Co-firing in emergency)

PROJECT DESIGN DOCUMENT FORM (CDM PDD) - Version 03.1. CDM – Executive Board page 14 Following table illustrates which emission sources are included and which are excluded from the project boundary: Source Gas Justification/Explanation
CO2 Included Main Emission source.
CH4 Excluded Excluded for simplification. This is
conservative. Grid Electricity Generation
N2O Excluded Excluded for simplification. This is
conservative.
CO2 Included Important emission source
CH4 Excluded Excluded for simplification. This is
conservative. Heat Generation
N2O Excluded Excluded for simplification. This is
conservative.
CO2 Excluded No surplus biomass
CH4 Excluded No surplus biomass
Bas
elin
e Sc
enar
io
Decay or uncontrolled
burning of surplus biomass
N2O Excluded No surplus biomass
CO2 Included Important emission source.
CH4 Excluded Excluded for simplification. This quantity is
very small.
Onsite fossil fuel and
electricity consumption due to
the project activity
N2O Excluded Excluded for simplification. This quantity is
very small.
CO2 Included An important emission source.
Proj
ect S
cena
rio
Offsite transportation of
biomass
CH4 Excluded Excluded for simplification. This quantity is
very small.
PROJECT DESIGN DOCUMENT FORM (CDM PDD) - Version 03.1. CDM – Executive Board page 15
N2O Excluded Excluded for simplification. This quantity is
very small.
CO2 Excluded
It is assumed that CO2 emissions from
surplus biomass residues do not lead to
changes of carbon pools in the LULUCF
sector.
CH4 Excluded
This emission source must be included only if
CH4 emissions from uncontrolled burning or
decay of biomass in the baseline scenario are
included.
Combustion of biomass for
electricity and/or heat
generation
N2O Excluded Excluded for simplification. This quantity is
very small.
CO2 Excluded
It is assumed that CO2 emissions from
surplus biomass residues do not lead to
changes of carbon pools in the LULUCF
sector.
CH4 Excluded
Excluded for simplification. Since biomass is
stored for not longer than one year, this
emission source is assumed to be small.
Biomass storage
N2O Excluded Excluded for simplification. This quantity is
very small.
B.4. Description of how the baseline scenario is identified and description of the identified baseline scenario: >> In the absence of the CDM project activity, BASL had the following baseline options:
Baseline option 1 (BA1):
• Implementation of the project activity not undertaken as a CDM project activity
• Installation of a high pressure cogeneration system
• The existing low pressure system would be de-commissioned and scrapped

PROJECT DESIGN DOCUMENT FORM (CDM PDD) - Version 03.1. CDM – Executive Board page 16
• The surplus power after meeting the captive requirements of the sugar mill would be exported to
the grid
Baseline option 2 (BA2):
• Continuation of the existing low pressure cogeneration system and replacement with a high
pressure cogeneration system at the end of its lifetime
• The captive power and steam requirements of the sugar plant would be met by the system
• There would no surplus power for export
Determination of the most plausible baseline scenario:
As defined in the consolidated methodology ACM0006, the realistic and credible alternatives have been
separately determined for power generation, heat generation and biomass. Steps 3 (Barrier analysis) of the
“tool for the assessment and demonstration of additionality” is used to analyse the above two options and
determine the most plausible baseline alternatives:
Alternatives for power generation: How power would have been generated in the absence of the
project activity?
1. As per baseline option BA1 above, the proposed project activity not undertaken as a CDM project
activity is a likely baseline option (Option P1 as per ACM0006).
2. As per baseline option BA2 above, power would be partly generated at the existing power plant
fired with the same type of biomass as the project activity (Option P5 of ACM0006) and partly in
grid connected power plants (Option P4 of ACM0006)
Identification of most likely baseline power generation scenario using barrier analysis:
The first option (P1 - implementation of the project activity not undertaken as a CDM project activity)
cannot be a baseline alternative since it faces prohibitive barriers (Refer Section B.5) to its implementation.
There are no legal and regulatory requirements for implementation of the high pressure system. At the time
of implementation of the project activity, only three cogeneration plants with equivalent pressure and
temperature configuration were in existence in the country. In the absence of sufficient expertise and
successful high pressure projects, it is very likely that BASL would not have opted for implementation of
the high pressure system without the CDM incentive.
PROJECT DESIGN DOCUMENT FORM (CDM PDD) - Version 03.1. CDM – Executive Board page 17
In the second option (combination of P4 and P5), the project proponent would use a lower energy efficient
cogeneration plant compared to the project activity, which would result in consumption of more bagasse in
order to generate equivalent steam and power for in-house utilization or captive consumption only. Though
this alternative does not entail surplus power generation and export to an electricity grid, it is in compliance
with all applicable legal and regulatory requirements and could be the baseline. In India, all the sugar mills
have their own cogeneration units, most of them operating with low-pressure boiler configuration of below
45 kg/cm2 (Maximum are in the range of 21 kg/cm2 to 45 kg/cm2) to cater to the in house steam and power
requirements. This scenario (present situation of sugar mills) is considered as “Business As Usual” case for
the Indian sugar industry, where in, bagasse is used at lower efficiency levels to meet the internal power
requirements of sugar mills. Prior to the 20MW cogeneration plant, the sugar mill was equipped with two
boilers, a 40 TPH and 30 TPH with parameters 32 kg/cm2 and 3800 Centigrade and two turbines of
capacities 1.5MW and 3.0MW were existent to meet the energy requirements of the sugar mill and had
sufficient lifetime to continue operating till the end of the crediting period. This option does not face any of
the barriers as that of Option 1 and could be a likely baseline scenario.
A summary of the barrier analysis for the above two alternatives are provided below:
Options Barriers
P1 P4 and P5
Investment Yes No
Technological Yes No
Common practice Yes No
Institutional No No
The most likely baseline power generation option is a combination of Option P4 and P5.
Alternative for steam generation: How heat would be generated in the absence of the project activity?
1. As per baseline option BA1 above, the proposed project activity not undertaken as a CDM project
activity is a likely baseline option (Option H1 as per ACM0006).
PROJECT DESIGN DOCUMENT FORM (CDM PDD) - Version 03.1. CDM – Executive Board page 18
2. As per baseline option BA2 above, heat would be generated at the existing cogeneration power
plant fired with the same type of biomass as the project activity (Option H5 of ACM0006)
Identification of most likely baseline heat generation scenario using barrier analysis:
The first option (H1 - implementation of the project activity not undertaken as a CDM project activity)
cannot be a baseline alternative since it faces prohibitive barriers (Refer Section B.5) to its implementation.
There are no legal and regulatory requirements for implementation of the high pressure cogeneration
system.
In the second option (H5), the process heat requirement of the sugar factory would continue to be met by
steam from the exhaust of the backpressure turbines of the low pressure cogeneration system. The low
pressure cogeneration system would have continued to operate without any problems till the end of the
crediting period and the factory would have continued to meet its heat requirement from the system. There
is no policy or regulation enforcing the replacement of the low pressure system with a high pressure
system. BASL could have continued heat generation in the low pressure system. There are no barriers
preventing this option and therefore it is a likely baseline option.
A summary of the barrier analysis for the above two alternatives are provided below:
Options Barriers
H1 H5
Investment Yes No
Technological Yes No
Common practice Yes No
Institutional No No
The most likely baseline heat generation option is H5.
Alternatives for use of biomass: What would happen to the biomass in the absence of the project
activity?
1. As per baseline option BA1 above, the biomass would be used for heat and electricity generation in
a high pressure cogeneration system at the project site (Option B4 as per ACM0006)
2. As per baseline option BA2 above, the biomass would be used for heat and electricity generation in
the existing low pressure cogeneration system at the project site (Option B4 as per ACM0006)
PROJECT DESIGN DOCUMENT FORM (CDM PDD) - Version 03.1. CDM – Executive Board page 19 Identification of most likely baseline biomass scenario using barrier analysis:
The first option (implementation of the project activity not undertaken as a CDM project activity) cannot
be a baseline alternative since it faces prohibitive barriers (Refer Section B.5) to its implementation. There
are no legal and regulatory requirements for implementation of the high pressure cogeneration system.
In the second option, bagasse would have been used to generate heat and power (required for captive
consumption only) at the project site in the existing low pressure boiler and turbine configuration. This
alternative does not face any barriers and is in compliance with all regulatory requirements and could be a
likely baseline scenario.
However, it may be noted that in both of the options, the biomass is consumed at the project site (Option
B4).
Most plausible baseline scenario for the project activity:
The above analysis shows that the most likely baseline scenario is the “Baseline option 2” described above
in this section, which is a combination of:
Options P4 and P5 for power generation
Options H5 for heat generation
Option B4 for biomass residues
The above combination of baseline scenarios for power, heat and biomass is applicable under scenario 14 of ACM0006.

PROJECT DESIGN DOCUMENT FORM (CDM PDD) - Version 03.1. CDM – Executive Board page 20 B.5. Description of how the anthropogenic emissions of GHG by sources are reduced below those that would have occurred in the absence of the registered CDM project activity (assessment and demonstration of additionality): >> BASL’s project activity generates clean electricity using CO2 neutral bagasse as fuel and the surplus
electricity from the project activity is supplied to the southern regional grid. In the business as usual (BAU)
scenario, BASL would have continued with their low pressure cogeneration plant with no power export to
grid, which is demonstrated using the latest UNFCCC “Tool for the demonstration and assessment of
additionality” as prescribed by ACM0006. The equivalent quantity of electricity would be generated from
power sources in the grid. Considering the existing grid generation mix and the recent capacity additions,
fossil fuel based power plants are likely to dominate the generation mix with a CO2 emission factor of 0.86
kg CO2/kWh. Therefore, it may be stated that the implementation of the CDM project activity reduces
GHG emissions that would otherwise occur in the CO2 intensive grid sources.
Demonstration and Assessment of Additionality:
B.5.1 Step 0: Preliminary Screening based on the starting date of the project activity
The procurement and project construction began in March 2001 i.e. after January 2000 and prior to the
Registration of the first CDM project activity (18 November 2004). The lack of closest fit methodology has
delayed the project’s Validation before December 2005 and therefore, the project may claim CERs
generated after its Registration with UNFCCC. However, BASL would provide documentary evidence for:
• Consideration of the CDM in the decision to proceed with the project activity
• Starting date of the project activity
This clears the preliminary screening criteria of UNFCCC for registration of eligible project activity as a
CDM project.
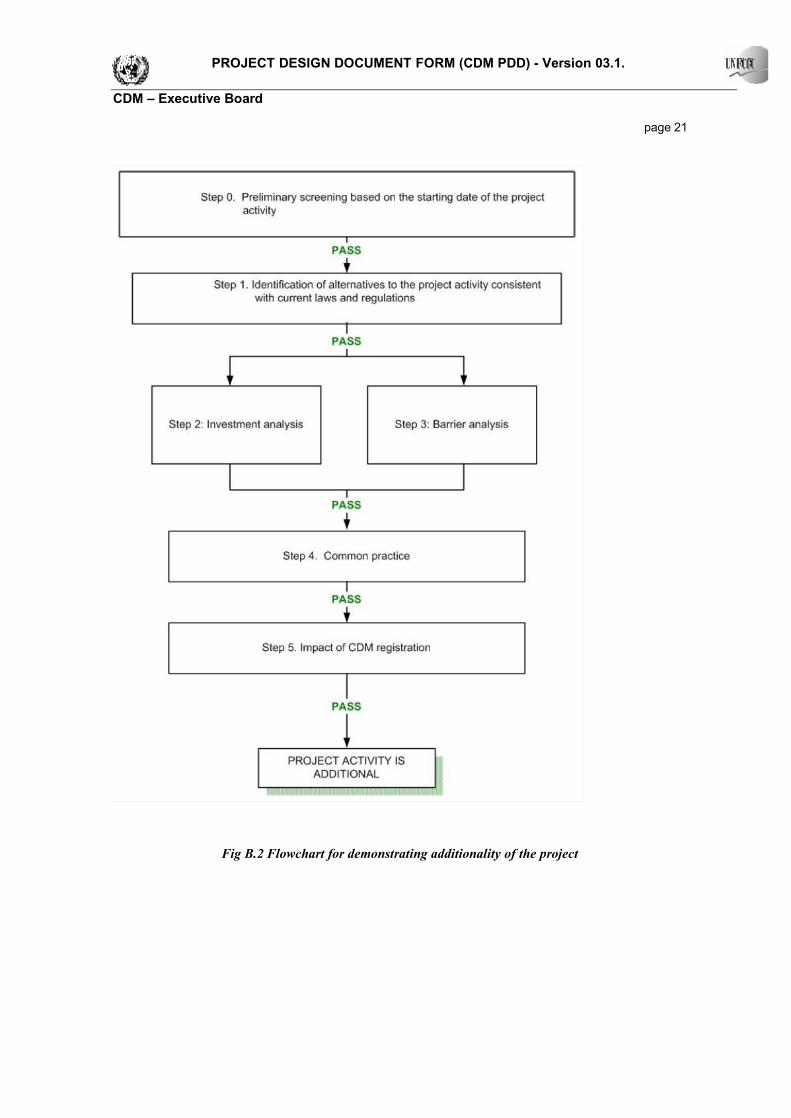
PROJECT DESIGN DOCUMENT FORM (CDM PDD) - Version 03.1. CDM – Executive Board page 21
Fig B.2 Flowchart for demonstrating additionality of the project
PROJECT DESIGN DOCUMENT FORM (CDM PDD) - Version 03.1. CDM – Executive Board page 22 B.5.2 Step 1 - Identification of alternatives to the project activity consistent with current laws and
regulations
The sub-steps include:
A. Sub-step 1a. Define alternatives to the project activity
B. Sub-step 1b. Enforcement of applicable laws and regulations
In sub-step 1a and 1b, BASL is required to identify realistic and credible alternative(s) that were available
to BASL or similar project developers that provide output or services comparable with the project activity.
These alternatives are required to be in compliance with all applicable legal and regulatory requirements.
Sub-step 1.a: Define alternatives to the project activity
Considering the analysis in section B.4 above, the likely alternatives to the project activity are:
1. The project activity not undertaken as a CDM project activity
2. A combination of:
• Option P4 and P5: Continuation of power generation at the existing power plant (old boiler with
lower efficiency) fired with the same type of biomass as the project activity and partly in existing
and/or new grid connected power plants.
• Option B4: Use of biomass to generate heat and power at the project site.
• Option H5: Continuation of heat generation from bagasse at the project site.
•
• Sub-step1.b. Enforcement of applicable laws and regulations
• Both the above options satisfy all applicable laws and regulations of the country.
• Option 1:
• The implementation of the project activity (utilising the bagasse for efficient power generation) not
undertaken as a CDM project activity is not restricted by any applicable law or legislation.
• Option 2:
• There is no law or legislation that restricts the continuation of power generation in existing low
pressure system fired with the same type of biomass as the project activity and partly in
existing/new grid connected power plants.

PROJECT DESIGN DOCUMENT FORM (CDM PDD) - Version 03.1. CDM – Executive Board page 23
• There is no law or legislation that restricts using the biomass to generate heat and power at the
project site.
• There is no law or legislation that restricts heat generation from bagasse at the project site.
Therefore, all the alternatives satisfy the applicable laws and legislations.
The next step for additionality justification as per the Fig B.2 is either
• Investment analysis (Step 2) OR
• Barrier analysis (Step 3)
BASL proceeds to establish project additionality by conducting barrier analysis as under:
B.3.3 Step 3: Barrier Analysis
BASL is required to determine whether the project activity faces barriers that:
• Prevent the implementation of this type of project activity; and
• Do not prevent the implementation of at least one of the alternatives
The above study has been done by means of the following sub-steps:
Sub-step 3.a: Identification of barriers that would prevent the implementation of the project activity
The potential for bagasse based cogeneration in the Indian sugar industry is estimated by the Ministry of Non-Conventional Energy Sources (MNES) as 3500 MW of which Tamil Nadu has a potential of 350 MW. As early as 1995, several awareness campaigns and sponsored programs have been conducted to encourage sugar mills to tap their surplus power potential. However, the presence of several associated barriers; mainly climatic, policy, technological and prevailing practice; have prevented the widespread implementation of this concept.
BASL has moved forward and implemented a high pressure cogeneration system to export power to the
grid despite the above barriers that are discussed in the subsequent section. The major barriers faced by
BASL are:
§ Investment barrier: BASL was apprehensive in approving the investment proposal for the project
activity due to two risk factors in the financial returns: Climatic and Policy risks

PROJECT DESIGN DOCUMENT FORM (CDM PDD) - Version 03.1. CDM – Executive Board page 24 § Technological barrier: Being one of the first of its kind in the region, the lack of trained
manpower and the absence of successful high pressure configurations were a deterrent to the
project activity
§ Other barriers
All the above barriers are further elaborated below:
(i) Investment barrier:
The project activity faced a major barrier in investment approval from the BASL board. The Indian sugar
industry is characterised by frequent fluctuations attributed to various factors such as sugar cane output,
market forces, political scenario and governmental controls. The new high-pressure cogeneration system
required a very high investment of around INR 5880.5 lakhs against the continuation of the low pressure
system with minimum retrofits. Though the project would provide a marginal return on the investment
under normal circumstances, it is not sufficient to cover the risk of investment on a project which is highly
sensitive to fuel availability and the power policy atmosphere.
In the three years subsequent to implementation of the project activity, the region supplying sugarcane to
the factory was adversely affected by drought. As a result, cane crushing and therefore fuel availability for
the project plant reduced by a large extent; bagasse generation in 2003, 2004 and 2005 has been 2.45, 0.24
and 1.015 lakh tonnes respectively against 2.91 lakh tonnes prior to the project implementation. This has
severely affected the project profitability and clearly demonstrates the investment risk borne by BASL in
implementing this project activity.
BASL has no background in selling power to the grid and also happens to be only the second sugar
industry in the country in implementing 87-ata cogeneration system. BASL’s management took decision to
pursue the project activity in the midst of the uncertainties involved, considering the revenues from carbon
credits generated by the project under CDM.
Hence, BASL has borne a financial risk and taken a pro-active approach by showing confidence in the
Kyoto Protocol and therefore the CDM system. Besides the direct financing risk, BASL is also shouldering

PROJECT DESIGN DOCUMENT FORM (CDM PDD) - Version 03.1. CDM – Executive Board page 25 the additional transaction costs related to the preparation of project documents, supporting CDM initiatives
and also developing and maintaining M&V protocol to fulfil CDM requirements.
(ii) Technological Barrier
The typical alternative to the project activity is to have continued with the low or medium pressure
cogeneration configuration. Although very few bagasse based cogeneration power plants are designed with
above mentioned high pressure and temperature parameters in India. In India, four plants with 87 ata
pressure and 515ºC temperature configuration have been commissioned at the time of implementation of
the project activity and BASL ’s 20 MW cogeneration plant at Sathyamangalam is the first of its kind and
the only project in the state of TamilNadu to have this high pressure technology. The project activity uses a
technology, which has low market share and less penetration. Low penetrated technology is related to
efficiencies of major equipments, trouble-free plant operation, availability of spares, availability of skilled
manpower to operate the plant continuously etc. BASL is the first company in TamilNadu to take up the
risk in overcoming the technology barrier by adopting 87 ata pressure configuration and STG of double
extraction cum condensing type.
The technological barriers become even more significant considering the renewable energy potential in
TamilNadu using bagasse as fuel. Success of the CDM project will provide a trigger for replication in the
other sugar mills thus further reducing the GHG emission to the atmosphere.
(iii) Other Barriers
Despite several years of experience in sugar production, BASL had to overcome a few barriers in order to
implement the project activity.
As the region surrounding the sugar plant is significantly dominated by agriculture, the personnel in the
plant had to be trained to handle the high pressure configuration cogeneration plant and therefore an extra
effort by BASL management was taken to train the technical personnel in order to operate an advanced
technology plant.

PROJECT DESIGN DOCUMENT FORM (CDM PDD) - Version 03.1. CDM – Executive Board page 26 BASL for long have been involved in business of sugar production and rural economics and had to
therefore transform (overcome barrier) and develop expertise to deal with the economics of electricity
generation, distribution and dealing with power sector economics, bureaucracy etc.
BASL has signed Power Purchase Agreement (PPA) with TNEB. For their earnings, the project depends on the payment from TNEB against the sale of electricity to the grid. It is known that condition of state electricity boards in India is not very healthy and it is likely that, there would be problems with cash flows of BASL. BASL had to take this risk and face this institutional barrier on which they have limited or no control. This situation makes CDM funds even more critical for BASL.
It is estimated that, of the total project proponents who get approval from central/state electricity authority to establish bagasse/biomass based power project in India, only a few are successful in commissioning of the plant due to some of the above mentioned barriers. The data on the ‘Common Practice Analysis’ of the bagasse-based cogeneration suggests that the barriers discussed are strong enough to hinder growth of the sector.
The project activity is additional as it over comes the above barriers by taking up risk of implementing power project, which is not core business of sugar industry.
Additionality test for Regulatory/Legal requirements
Government of India passed the Electricity Act, 2003 to reform and regulate the generation, transmission
and distribution of electricity. The Act sets obligations for the distribution companies to source at least
10% of the total installed generation capacity from non-conventional energy sources. The fulfilment of this
obligation will be binding upon state electricity boards to purchase power from projects of renewable
energy type by providing higher purchase tariffs and other incentives to encourage renewable energy
promoters. Though these obligations are not yet enforced, TNEB has already achieved this target as a
result of the tremendous growth of wind energy in the state and hence, there is no such binding on TNEB to
encourage further renewable energy projects.
There are no other national or state policies necessitating sugar mills to implement high pressure
cogeneration systems and export power to the grid. BASL has taken a proactive step, above the regulatory
requirements, to develop a technically advanced cogeneration project in Tamil Nadu.

PROJECT DESIGN DOCUMENT FORM (CDM PDD) - Version 03.1. CDM – Executive Board page 27
Sub-step(3b). Show that the identified barriers would not prevent a wide spread implementation of at
least one of the alternatives (except the proposed project activity already considered in step 3a):
The most likely alternative in the baseline scenario is the continuation of the low pressure cogeneration
system at the project site. This alternative doesn’t entail any huge capital outlay as required by the project
activity. BASL would have met the minor expenditures of maintenance and retrofits of the low pressure
system without any difficulty.
The low pressure technology is a common practice in Indian sugar industry and BASL has the necessary
expertise, skilled manpower and other resources to operate the plant without any significant risks
associated with the 87-ata system.
The continuation of the low pressure system would not require capacity building or training exercise as
required by the project activity. Since, power is not exported; the associated risks of energy pricing and
policy are not involved.
As discussed above, the barriers facing the project activity do not prevent the wide spread implementation
of the alternative in the sugar industry.
B.3.3 Step 4: Common Practice Analysis
Sub-step 4.a: Analyse other activities similar to the project activity
In 2001, when BASL decided to implement the project activity, most sugar mills in Tamil Nadu were using
their entire bagasse in low pressure cogeneration to meet their captive energy requirements and did not
export power to the grid. The maximum cogeneration pressure prevailing was 67 kg/cm2 (Table B1). Thus,
the common practice in the similar project sector, socio-economic environment, geographic conditions and
technological circumstances was the utilisation of bagasse in low pressure boilers for in-house
PROJECT DESIGN DOCUMENT FORM (CDM PDD) - Version 03.1. CDM – Executive Board page 28 consumption, which would have been the case with BASL’s sugar factory. However, the prospect of CDM
revenue has encouraged BASL to install the first 87-ata high pressure cogeneration system in Tamil Nadu.
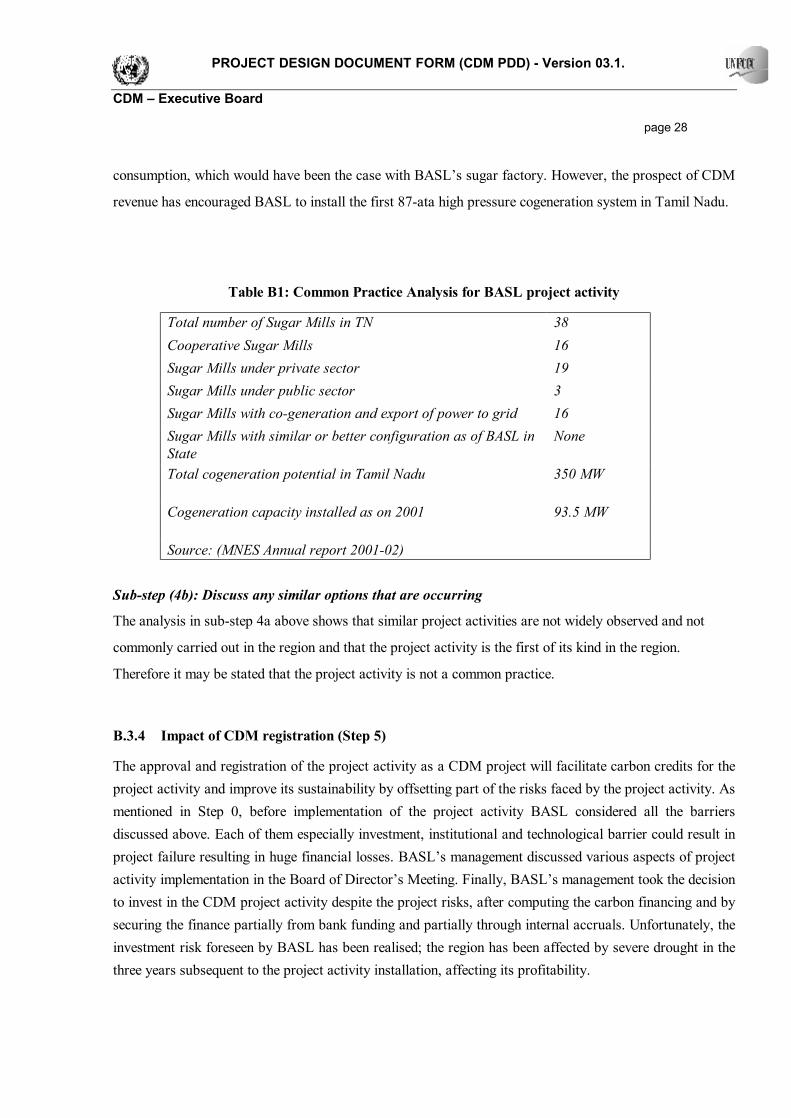
Table B1: Common Practice Analysis for BASL project activity
Total number of Sugar Mills in TN 38 Cooperative Sugar Mills 16 Sugar Mills under private sector 19 Sugar Mills under public sector 3 Sugar Mills with co-generation and export of power to grid 16 Sugar Mills with similar or better configuration as of BASL in State
None
Total cogeneration potential in Tamil Nadu 350 MW
Cogeneration capacity installed as on 2001 93.5 MW
Source: (MNES Annual report 2001-02)
Sub-step (4b): Discuss any similar options that are occurring
The analysis in sub-step 4a above shows that similar project activities are not widely observed and not
commonly carried out in the region and that the project activity is the first of its kind in the region.
Therefore it may be stated that the project activity is not a common practice.
B.3.4 Impact of CDM registration (Step 5)
The approval and registration of the project activity as a CDM project will facilitate carbon credits for the project activity and improve its sustainability by offsetting part of the risks faced by the project activity. As mentioned in Step 0, before implementation of the project activity BASL considered all the barriers discussed above. Each of them especially investment, institutional and technological barrier could result in project failure resulting in huge financial losses. BASL’s management discussed various aspects of project activity implementation in the Board of Director’s Meeting. Finally, BASL’s management took the decision to invest in the CDM project activity despite the project risks, after computing the carbon financing and by securing the finance partially from bank funding and partially through internal accruals. Unfortunately, the investment risk foreseen by BASL has been realised; the region has been affected by severe drought in the three years subsequent to the project activity installation, affecting its profitability.
PROJECT DESIGN DOCUMENT FORM (CDM PDD) - Version 03.1. CDM – Executive Board page 29
• The realization of carbon credits by BASL in the coming years will help the sustainable operation
of the project by offsetting the losses incurred to a certain extent. The continued operation of the
plant will encourage other promoters to adopt high efficiency cogeneration and further contribute
to sustainable development of the region.
It is ascertained that the project activity would not have occurred in the absence of the CDM simply
because no sufficient financial assistance, policy initiatives, or other incentives exist locally to foster its
development in India and, without the carbon financing for the project activity, BASL would not have taken
the investment risks in order to implement the project activity. Further CDM fund will provide additional
coverage to the risk due to institutional barriers and technical problems related to the operation of the
project activity, resulting in untimely shut downs of plant and its associated loss of production.
Further with CDM project activity registration many more sugar manufacturing industries in India would
take up similar initiatives under CDM by overcoming the barriers to project activity implementation
resulting in higher quantum of anthropogenic greenhouse gas emissions reductions.
PROJECT DESIGN DOCUMENT FORM (CDM PDD) - Version 03.1. CDM – Executive Board page 30 B.6. Emission reductions:
B.6.1. Explanation of methodological choices: >> The emission reductions are mainly from the incremental energy generation using the same quantity of
biomass that would have been combusted in the baseline scenario (low pressure cogeneration plant). The
incremental energy is exported to the grid and displaces equivalent CO2 emission from grid connected
power plants.
B.6.1.1 Project Emissions:
With reference to ACM0006, it is required to account CO2 emissions from the combustion of fossil fuels
used by the project activity (during unavailability of bagasse / drought / any other unforeseen
circumstances), from transportation of biomass from other sites to the project activity, CO2 emissions from
electricity consumption and CH4 emissions from biomass combustion if included in the project boundary.
Such emissions are calculated by using the below equations:
PEy = PETy +PEFFy + PEEC,y + GWPCH4 . PEBiomass,CH4,y
Where:
PETy CO2 emissions during the year y due to transportation of the biomass residues to the
project plant (tCO2/yr)
PEFFy CO2 emissions during the year y due to fossil fuels co-fired by the generation facility or
other fossil fuel consumption at the project site that is attributable to the project activity
(tCO2/yr)
PEEC,y CO2 emissions during the year y due to electricity consumption at the project site that is
attributable to the project activity (tCO2/yr)
GWPCH4 Global Warming Potential for methane valid for the relevant commitment period
PEBiomass,CH4,y CH4 emissions from the combustion of biomass residues during the year y (tCH4/yr)
Carbon dioxide emissions from transportation of biomass to the project site (PETy):
2,,
COKmyy
yiy EFAVD
TLBF
PET ××= ∑

PROJECT DESIGN DOCUMENT FORM (CDM PDD) - Version 03.1. CDM – Executive Board page 31 Where:
BFi,y is the quantity of biomass type i, transported from other sites and used as fuel in
the project plant during the year y in a volume or mass unit,
TLy is the average truck load of the trucks used measured in tons of biomass,
AVDy is the average return trip distance between the biomass fuel supply sites and the
site of the project plant in kilometers (km), and
2,COKmEF is the average CO2 emission factor for the trucks measured in tCO2/km
Carbon dioxide emissions from on-site consumption of fossil fuels (PEFFy)
The proper and efficient operation of the biomass residue fired power plant may require using some fossil
fuels, e.g. for start-ups or for stabilising combustion (when the moisture content in biomass residue is too
high) or for the preparation or on-site transportation of the biomass residues. In addition, any other fuel
consumption at the project site that is attributable to the project activity should be taken into account (e.g.
for mechanical preparation of the biomass residues).
CO2 emissions from combustion of respective fossil fuels are calculated as follows:
i,FF,2COiy,i,site projecty,i,plant projecty EF x NCVx) FF FF(PEFF += ∑ …....(1)
Where:
FFproject plant,i,y Quantity of fossil fuel type i combusted in the biomass residue fired power plant
during the year y (mass unit per year)
FFproject site,i,y Quantity of fossil fuel type i combusted at the project site for other purposes that
that are attributable to the project activity during the year y (mass unit per year)
NCVi Net calorific value of fossil fuel type i (GJ /mass unit)
EFCO2,i CO2 emission factor for fossil fuel type i (tCO2/GJ)
PROJECT DESIGN DOCUMENT FORM (CDM PDD) - Version 03.1. CDM – Executive Board page 32
Carbon Dioxide emissions from electricity consumption (PEEC,y)
Any electricity consumption at the project site excluding that of the power plant auxiliary1 equipments
would be monitored. Corresponding project emissions would be calculated as follows:
PEEC,y = ECPJ,y x EFgrid,y
Where,
PEEC,y is CO2 emissions from on-site electricity consumption attributable to the project activity
(tCO2/yr)
ECPJ,y is on-site electricity consumption attributable to the project activity during the year y
(MWh)
EFgrid,y is CO2 emission factor for grid electricity during the year y (tCO2/MWh)
Methane emissions from combustion of biomass residues (PEBiomass,CH4,y)
These emissions are not included in the project boundary and are neglected both in project emissions and
baseline emissions.
B.6.1.2 Emission reductions due to displacement of electricity:
Emission reductions due to the displacement of electricity is calculated by multiplying the net quantity of
increased electricity generated with biomass residues as a result of the project activity (EGy) with the CO2
baseline emission factor for the electricity displaced due to the project (EFelectricity,y), as follows:
ERelectricity,y = EGy . EFelectricity,y
Where:
ERelectricity,y Emission reductions due to displacement of electricity during the year y (tCO2/yr)
EGy Net quantity of increased electricity generation as a result of the project activity
(incremental to baseline generation) during the year y (MWh)
EFelectricity,y CO2 emission factor for the electricity displaced due to the project activity during
the year y (tCO2/MWh)
PROJECT DESIGN DOCUMENT FORM (CDM PDD) - Version 03.1. CDM – Executive Board page 33
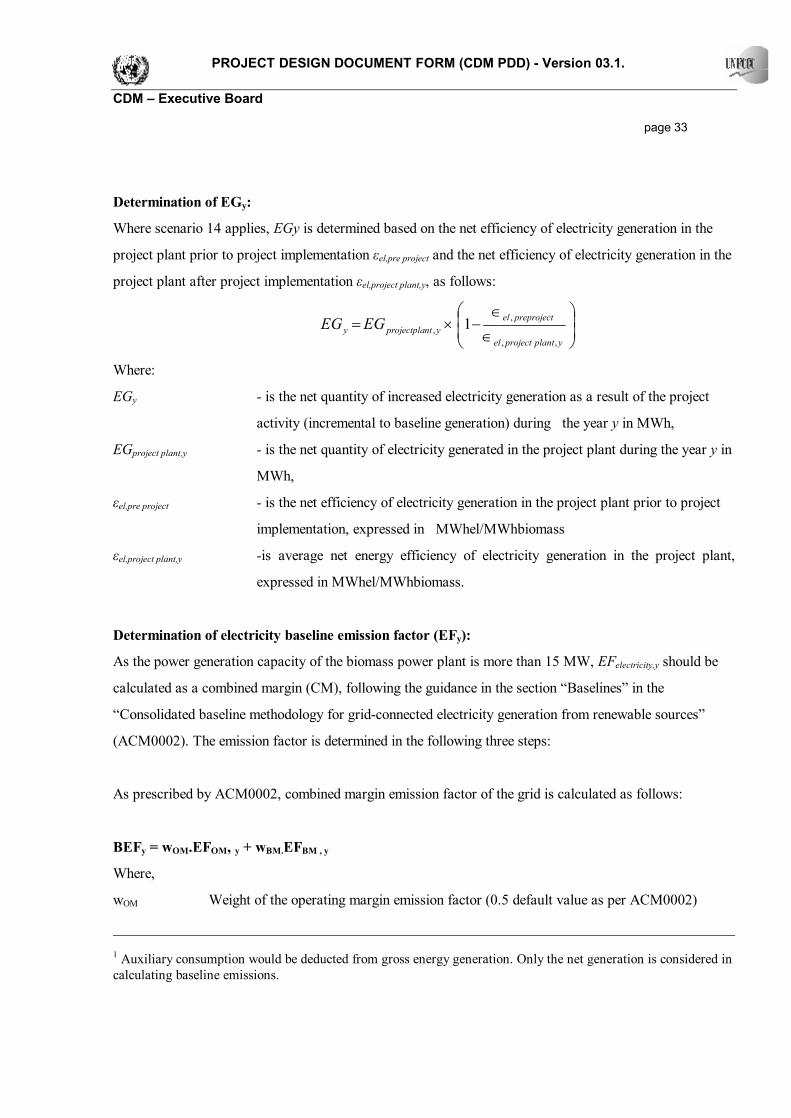
Determination of EGy:
Where scenario 14 applies, EGy is determined based on the net efficiency of electricity generation in the
project plant prior to project implementation εel,pre project and the net efficiency of electricity generation in the
project plant after project implementation εel,project plant,y, as follows:
∈
∈−×=
yplantprojectel
preprojectelyntprojectplay EGEG
,,
,, 1
Where:
EGy - is the net quantity of increased electricity generation as a result of the project
activity (incremental to baseline generation) during the year y in MWh,
EGproject plant,y - is the net quantity of electricity generated in the project plant during the year y in
MWh,
εel,pre project - is the net efficiency of electricity generation in the project plant prior to project
implementation, expressed in MWhel/MWhbiomass
εel,project plant,y -is average net energy efficiency of electricity generation in the project plant,
expressed in MWhel/MWhbiomass.
Determination of electricity baseline emission factor (EFy):
As the power generation capacity of the biomass power plant is more than 15 MW, EFelectricity,y should be
calculated as a combined margin (CM), following the guidance in the section “Baselines” in the
“Consolidated baseline methodology for grid-connected electricity generation from renewable sources”
(ACM0002). The emission factor is determined in the following three steps:
As prescribed by ACM0002, combined margin emission factor of the grid is calculated as follows:
BEFy = wOM.EFOM, y + wBM.EFBM , y
Where,
wOM Weight of the operating margin emission factor (0.5 default value as per ACM0002)
1 Auxiliary consumption would be deducted from gross energy generation. Only the net generation is considered in calculating baseline emissions.

PROJECT DESIGN DOCUMENT FORM (CDM PDD) - Version 03.1. CDM – Executive Board page 34 EFOM, y Operating margin emission factor calculated as per ACM0002
wBM Weight of the build margin emission factor (0.5 default value as per ACM0002)
EFBM,y Build margin emission factor calculated as per ACM0002
BEFy Combined margin baseline emission factor of the grid
Operating margin (OM):
ACM0002 provides four options for calculating OM. Option (a) “Simple OM” has been adopted here and
the formula for calculating same is described below:
yjj
jiyjiji
yOM GENCOEFxFEF ,,,,,
, / ∑∑=
where,
Fi ,j, y Is the amount of fuel i (in a mass or volume unit) consumed by relevant power
sources j in year(s) y
j Refers to the power sources delivering electricity to the grid, excluding low-
operating cost and must-run power plants, and including imports from the grid
COEFi,j y Is the CO2 emission coefficient of fuel i (tCO2 / mass or volume unit of the fuel),
taking into account the carbon content of the fuels used by relevant power
sources j and the percent oxidation of the fuel in year(s) y, and
GENj,y Is the electricity (MWh) delivered to the grid by source j
The CO2 emission coefficient COEFi is obtained as:
xOXIDiEFxNCVCOEF COii 2,=
For calculations, local values of NCVi and EFCO2i have been used. The ex-ante data vintage of 3-year
average, based on the most recent statistics available at the time of PDD submission has been used for the
calculation.
Build Margin:
The build margin is calculated as the weighted average emissions of recent capacity additions to the
reference grid, based on the most recent information available on plants already built for sample group m at
the time of PDD submission. The PDD has adopted ex-ante option for build margin calculation.
PROJECT DESIGN DOCUMENT FORM (CDM PDD) - Version 03.1. CDM – Executive Board page 35
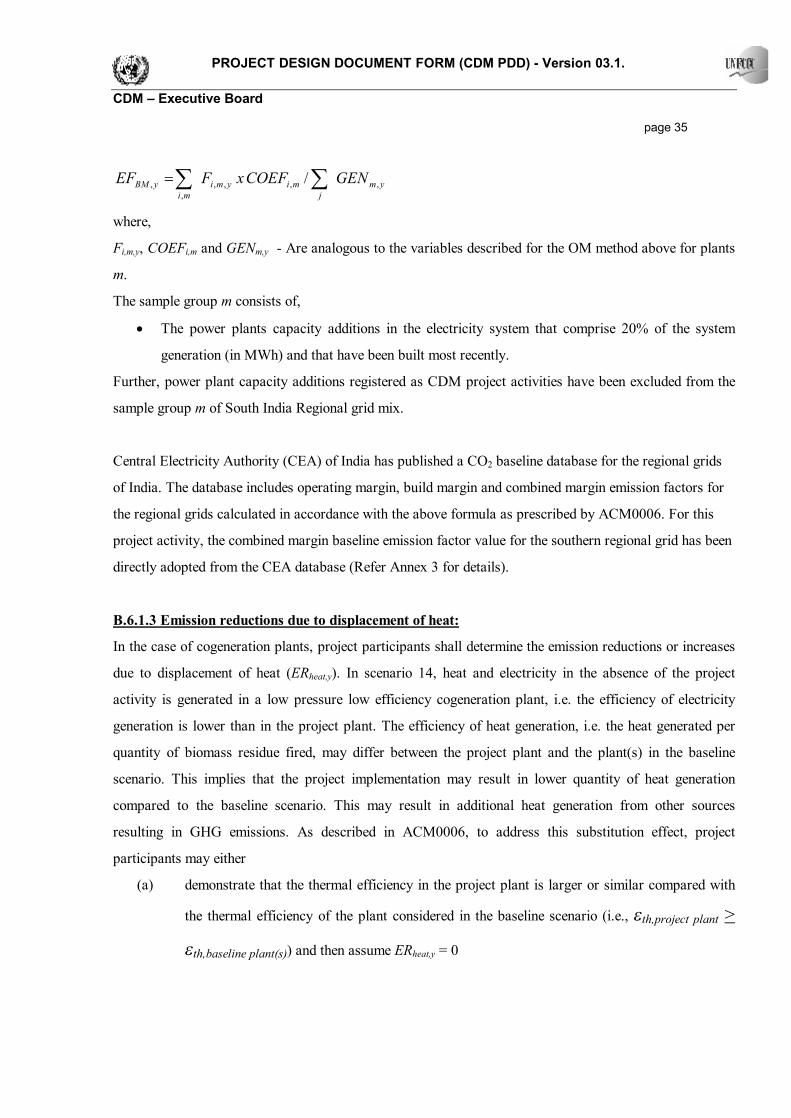
ymj
miymimi
yBM GENCOEFxFEF ,,,,,
, / ∑∑=
where,
Fi,m,y, COEFi,m and GENm,y - Are analogous to the variables described for the OM method above for plants
m.
The sample group m consists of,
• The power plants capacity additions in the electricity system that comprise 20% of the system
generation (in MWh) and that have been built most recently.
Further, power plant capacity additions registered as CDM project activities have been excluded from the
sample group m of South India Regional grid mix.
Central Electricity Authority (CEA) of India has published a CO2 baseline database for the regional grids
of India. The database includes operating margin, build margin and combined margin emission factors for
the regional grids calculated in accordance with the above formula as prescribed by ACM0006. For this
project activity, the combined margin baseline emission factor value for the southern regional grid has been
directly adopted from the CEA database (Refer Annex 3 for details).
B.6.1.3 Emission reductions due to displacement of heat:
In the case of cogeneration plants, project participants shall determine the emission reductions or increases
due to displacement of heat (ERheat,y). In scenario 14, heat and electricity in the absence of the project
activity is generated in a low pressure low efficiency cogeneration plant, i.e. the efficiency of electricity
generation is lower than in the project plant. The efficiency of heat generation, i.e. the heat generated per
quantity of biomass residue fired, may differ between the project plant and the plant(s) in the baseline
scenario. This implies that the project implementation may result in lower quantity of heat generation
compared to the baseline scenario. This may result in additional heat generation from other sources
resulting in GHG emissions. As described in ACM0006, to address this substitution effect, project
participants may either
(a) demonstrate that the thermal efficiency in the project plant is larger or similar compared with
the thermal efficiency of the plant considered in the baseline scenario (i.e., εth,project plant >
εth,baseline plant(s)) and then assume ERheat,y = 0

PROJECT DESIGN DOCUMENT FORM (CDM PDD) - Version 03.1. CDM – Executive Board page 36
or, if this is not the case,
(b) account for any increases in CO2 emissions,
In the project activity case, (a) is true (i.e., the efficiency of heat generation in the project plant is higher
than that of the baseline plants). Therefore, it is assumed that ERheat,y = 0 for this project activity.
B.6.1.4: Leakage:
ACM0006 states “The main potential source of leakage for this project activity is an increase in emissions
from fossil fuel combustion due to diversion of biomass from other uses to the project plant as a result of
the project activity. Where the most likely baseline scenario is the use of the biomass for energy generation
(scenarios 1, 4, 6, 8, 9, 11, 12, 13 and 14), the diversion of biomass to the project activity is already
considered in the calculation of baseline reductions. In this case, leakage effects do not need to be
addressed.” The project activity falls under scenario 14 of ACM0006 and therefore does not require
addressing leakage. There is no leakage of emission reductions for this project activity.
B.6.1.5: Net Emission reductions
The project activity mainly reduces CO2 emissions through substitution of power and heat generation with
fossil fuels by energy generation with biomass residues. The emission reduction ERy by the project activity
during a given year y is the difference between the emission reductions through substitution of electricity
generation with fossil fuels (ERelectricity,y), the emission reductions through substitution of heat generation
with fossil fuels (ERheat,y), project emissions (PEy), emissions due to leakage (Ly) as follows:
ERy = ERheat,y + ERelectricity,y + BEbiomass,y– PEy – Ly
Where:
ERy Emissions reductions of the project activity during the year y (tCO2/yr)
ERelectricity,y Emission reductions due to displacement of electricity during the year y (tCO2/yr)
ERheat,y Emission reductions due to displacement of heat during the year y (tCO2/yr). This
parameter is equal to zero since efficiency of heat generation in the project scenario is
higher than the baseline scenario.

PROJECT DESIGN DOCUMENT FORM (CDM PDD) - Version 03.1. CDM – Executive Board page 37 BEbiomass Baseline emissions due to biomass decay. This parameter is excluded from the project
boundary and therefore is equal to zero.
PEy Project emissions during the year y (tCO2/yr)
Ly Leakage emissions during the year y (tCO2/yr). For scenario 14, leakage need not be
separately estimated and therefore Ly = 0.
Since ERheat,y = 0, BEbiomass,y and Ly = 0 for this project activity, the above equation reduces to:
ERy = ERelectricity,y – PEy

PROJECT DESIGN DOCUMENT FORM (CDM PDD) - Version 03.1. CDM – Executive Board page 38
B.6.2. Data and parameters that are available at validation: Data / Parameter: εel,existing plant(s)
Data unit: MWhe/MWhbiomass
Description: Average net efficiency of electricity generation in the existing power /
cogeneration plant(s) fired with the same type of biomass residue at the project
site
Source of data used: On-site measurements
Value applied: 0.0395
Justification of the
choice of data or
description of
measurement methods
and procedures actually
applied :
Measure the quantity of fuels fired and the electricity generation during a
representative time period and divide the quantity of fuels fired. In case of
turbines with heat extraction, the efficiency should be determined over a time
period that reasonably represents the different operation modes. The three most
recent historical years should preferably be used to determine the average
efficiency, where such data is available and where this time period is reasonably
representative.
Any comment: -
Data / Parameter: εth,existing plant(s
Data unit: MWhth/MWhbiomass
Description: Average net efficiency of heat generation in the existing power / cogeneration
plant(s) fired with the same type of biomass residue at the project site
Source of data used: On-site measurements
Value applied: 0.64
Justification of the
choice of data or
description of
measurement methods
and procedures actually
Measure the quantity of fuels fired and the electricity generation during a
representative time period and divide the quantity of fuels fired. In case of
turbines with heat extraction, the efficiency should be determined over a time
period that reasonably represents the different operation modes. The three most
recent historical years should preferably be used to determine the average

PROJECT DESIGN DOCUMENT FORM (CDM PDD) - Version 03.1. CDM – Executive Board page 39 applied : efficiency, where such data is available and where this time period is reasonably
representative.
Any comment: -
Data / Parameter: EFelectricity Data unit: tCO2/MWh Description: Combined margin baseline emission factor of the southern regional grid Source of data used: CEA/IPCC Value applied: 0.86 Justification of the choice of data or description of measurement methods and procedures actually applied :
Calculated as per guidelines provided in ACM0002
Any comment: More details in Annexure 3
B.6.3 Ex-ante calculation of emission reductions: >>
The following tables show the calculation of emission reductions using the formula mentioned in section B.6.1. Project emissions: Emissions due to combustion of fossil fuels in the project activity: S.No Notation Parameter Unit Value Comments
1 FFproject plant,y Quantity of fossil fuel used T/yr 0
Will be measured if used. Envisaged only during emergencies.
2 FFprojectsite,y Quantity of fossil fuel used T/yr 0
Will be measured if used. Envisaged only during emergencies.
3 NCV Calorific Value TJ/T coal 0.020784
Average calorific value of coal used in grid connected power plants based on CEA data.
4 EFCO2 CO2 emission factor tCO2/TJ 96.1 IPCC default value
5 OXID Oxidation factor 0.98 IPCC default value 6 COEF CO2 emission tCO2/T coal 1.957 Methodology formula
PROJECT DESIGN DOCUMENT FORM (CDM PDD) - Version 03.1. CDM – Executive Board page 40
(3*4*5) factor
7 PEFFy ((1+2)*3*4)
CO2 emissions from coal tCO2/yr 0 Methodology formula
Emissions due to combustion of fossil fuels for transportation of biomass:
8 BFy
Quantity of biomass bought and transported from outside T/yr 0
Only expected during bagasse shortage
9 TLy
Average truck load of the trucks used T 10
Average rated tonnage of trucks used
10 AVDy
Average return trip distance between the biomass fuel supply sites and the project plant kms 100
Conservative assumption. ACM0006 prescribes a minimum value of 20 kms.
11
Fuel consumption per 1000 kilometer kg/000'kms 205
Based on truck mileage of 4 kms/litre diesel
12 CO2 emission
factor kgCO2/kg fuel 3.16 IPCC default value
13 EFkm,CO2
(10*11)
Average CO2 emission factor of the trucks kgCO2/km 0.6478 Methodology formula
14
PETy ((8*10*11) / (9))
CO2 emissions from diesel tCO2 0 Methodology formula
15 PEy (7+14)
Total Project Emissions tCO2 0 Methodology formula
Leakage: As per ACM0006, for project activities under scenario 14, leakage is already considered in the baseline calculations and need not be separately addressed. Emission reductions due to displacement of electricity: Determination of EGy:
S.No Notation Parameter Unit Pre-project Post project
1 EGpre-project,y Generation from the pre-project 4.5 MW, 32 Kg/cm2 MWhe 39,284.07 0.00
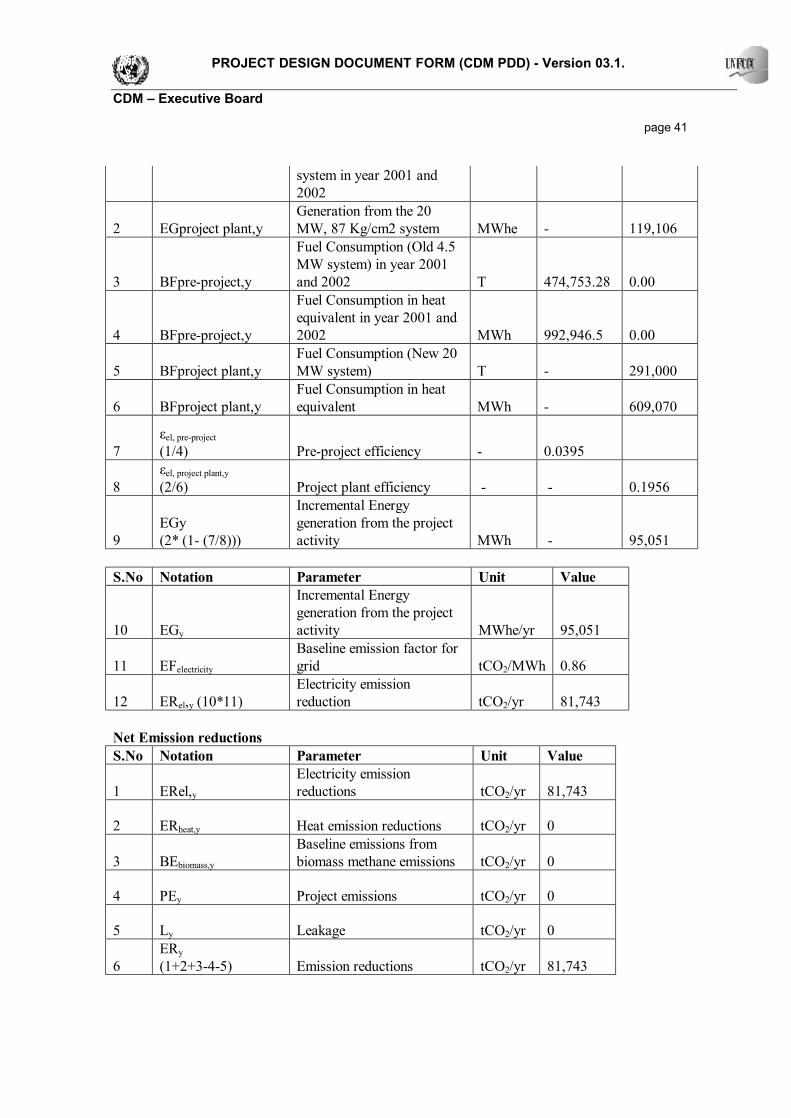
PROJECT DESIGN DOCUMENT FORM (CDM PDD) - Version 03.1. CDM – Executive Board page 41
system in year 2001 and 2002
2 EGproject plant,y Generation from the 20 MW, 87 Kg/cm2 system MWhe - 119,106
3 BFpre-project,y
Fuel Consumption (Old 4.5 MW system) in year 2001 and 2002 T 474,753.28 0.00
4 BFpre-project,y
Fuel Consumption in heat equivalent in year 2001 and 2002 MWh 992,946.5 0.00
5 BFproject plant,y Fuel Consumption (New 20 MW system) T - 291,000
6 BFproject plant,y Fuel Consumption in heat equivalent MWh - 609,070
7 εel, pre-project
(1/4) Pre-project efficiency - 0.0395
8 εel, project plant,y
(2/6) Project plant efficiency - - 0.1956
9 EGy (2* (1- (7/8)))
Incremental Energy generation from the project activity MWh - 95,051
S.No Notation Parameter Unit Value
10 EGy
Incremental Energy generation from the project activity MWhe/yr 95,051
11 EFelectricity Baseline emission factor for grid tCO2/MWh 0.86
12 ERel,y (10*11) Electricity emission reduction tCO2/yr 81,743
Net Emission reductions S.No Notation Parameter Unit Value
1 ERel,y Electricity emission reductions tCO2/yr 81,743
2 ERheat,y Heat emission reductions tCO2/yr 0
3 BEbiomass,y Baseline emissions from biomass methane emissions tCO2/yr 0
4 PEy Project emissions tCO2/yr 0
5 Ly Leakage tCO2/yr 0
6 ERy (1+2+3-4-5) Emission reductions tCO2/yr 81,743

PROJECT DESIGN DOCUMENT FORM (CDM PDD) - Version 03.1. CDM – Executive Board page 42
B.6.4 Summary of the ex-ante estimation of emission reductions: >>
Sr.
No.
Operating
Years
Baseline Emission Factor
(tonnes of CO2 / MWh)
EFy
Incremental
electricity generation
(MWh)
EGy
Electricity
Emission reductions
(tonnes of CO2)
BEy
Project
Emissions
(tonnes of CO2)
PEy
Emission Reductions
(tonnes of CO2 )
1. 2007-08 0.86 95,051 81,743 0 81,743
2. 2008-09 0.86 95,051 81,743 0 81,743
3. 2009-10 0.86 95,051 81,743 0 81,743
4. 2010-11 0.86 95,051 81,743 0 81,743
5. 2011-12 0.86 95,051 81,743 0 81,743
6. 2012-13 0.86 95,051 81,743 0 81,743
7. 2013-14 0.86 95,051 81,743 0 81,743
8. 2014-15 0.86 95,051 81,743 0 81,743
9. 2015-16 0.86 95,051 81,743 0 81,743
10. 2016-17 0.86 95,051 81,743 0 81,743
2007-2017 950,510 81,743 0 81,743
B.7 Application of the monitoring methodology and description of the monitoring plan:
B.7.1 Data and parameters monitored:
Data / Parameter: AVDy Data unit: Kilometres (Kms) Description: Average return trip distance between biomass fuel supply sites and the project site Source of data to be used:
Truck operator
Value of data applied 100
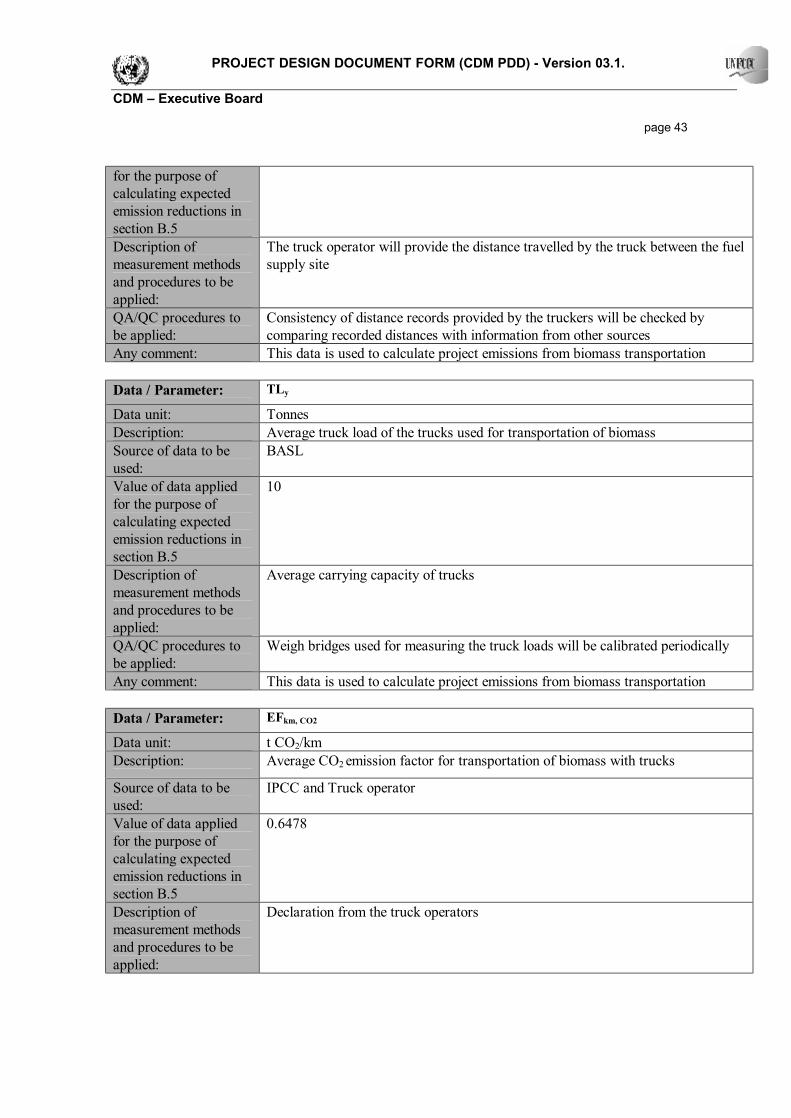
PROJECT DESIGN DOCUMENT FORM (CDM PDD) - Version 03.1. CDM – Executive Board page 43 for the purpose of calculating expected emission reductions in section B.5 Description of measurement methods and procedures to be applied:
The truck operator will provide the distance travelled by the truck between the fuel supply site
QA/QC procedures to be applied:
Consistency of distance records provided by the truckers will be checked by comparing recorded distances with information from other sources
Any comment: This data is used to calculate project emissions from biomass transportation Data / Parameter: TLy
Data unit: Tonnes Description: Average truck load of the trucks used for transportation of biomass Source of data to be used:
BASL
Value of data applied for the purpose of calculating expected emission reductions in section B.5
10
Description of measurement methods and procedures to be applied:
Average carrying capacity of trucks
QA/QC procedures to be applied:
Weigh bridges used for measuring the truck loads will be calibrated periodically
Any comment: This data is used to calculate project emissions from biomass transportation Data / Parameter: EFkm, CO2
Data unit: t CO2/km Description: Average CO2 emission factor for transportation of biomass with trucks
Source of data to be used:
IPCC and Truck operator
Value of data applied for the purpose of calculating expected emission reductions in section B.5
0.6478
Description of measurement methods and procedures to be applied:
Declaration from the truck operators

PROJECT DESIGN DOCUMENT FORM (CDM PDD) - Version 03.1. CDM – Executive Board page 44 QA/QC procedures to be applied:
Check consistency of measurements and local / national data with default values by the IPCC. If the values differ significantly from IPCC default values, possibly collect additional information or conduct measurements.
Any comment: Local or national data will be used.
Default values from the IPCC will be used alternatively and chosen in a conservative manner.
Data / Parameter: FFproject plant i,y Data unit: Tonnes Description: Onsite fossil fuel consumption of type ‘i’ for co-firing in the project plant Source of data to be used:
BASL
Value of data applied for the purpose of calculating expected emission reductions in section B.5
0
Description of measurement methods and procedures to be applied:
The quantity of fossil fuel is measured at the weigh bridge before their unloading into the project site.
QA/QC procedures to be applied:
The consistency of metered fuel consumption quantities will be checked with purchase receipts
Any comment: Data / Parameter: FFproject site i,y Data unit: Tonnes Description: Onsite fossil fuel consumption of type ‘i’ used in the project site apart from co-
firing Source of data to be used:
BASL
Value of data applied for the purpose of calculating expected emission reductions in section B.5
0
Description of measurement methods and procedures to be applied:
The quantity of fossil fuel is measured at the weigh bridge before their unloading into the project site.
QA/QC procedures to be applied:
The consistency of metered fuel consumption quantities will be checked with purchase receipts
Any comment:

PROJECT DESIGN DOCUMENT FORM (CDM PDD) - Version 03.1. CDM – Executive Board page 45 Data / Parameter: NCVi,FF Data unit: Kcal/kg Description: Calorific value of fossil fuel Source of data to be used:
BASL
Value of data applied for the purpose of calculating expected emission reductions in section B.5
-
Description of measurement methods and procedures to be applied:
The NCV is determined in calibrated calorimeters of a certified agency
QA/QC procedures to be applied:
Check consistency of measurements and local / national data with default values by the IPCC. If the values differ significantly from IPCC default values, possibly collect additional information or conduct measurements.
Any comment: The value will be determined when fossil fuel is used Data / Parameter: EGproject plant,y Data unit: MWh Description: Net quantity of electricity generated in the project plant during the year y Source of data to be used:
BASL
Value of data applied for the purpose of calculating expected emission reductions in section B.5
119,106
Description of measurement methods and procedures to be applied:
Calibrated energy meters of BASL Frequency: Daily in BASL meters
QA/QC procedures to be applied:
The consistency of metered net electricity generation will be cross-checked with receipts from sales (if available) and the quantity of biomass fired (e.g. check whether the electricity generation divided by the quantity of biomass fired results in a reasonable efficiency that is comparable to previous years)
Any comment: Data / Parameter: BFi,y Data unit: Tonnes

PROJECT DESIGN DOCUMENT FORM (CDM PDD) - Version 03.1. CDM – Executive Board page 46 Description: Quantity of biomass type i combusted in the project plant during year y Source of data to be used:
BASL
Value of data applied for the purpose of calculating expected emission reductions in section B.5
291,000
Description of measurement methods and procedures to be applied:
Monthly and annual mass and energy balance in the sugar plant supported by RT 8C forms submitted to the Government of India
QA/QC procedures to be applied:
Any direct measurements with mass or volume meters at the plant site will be cross-checked with annual energy balance that is based on fuel generated in-house, purchased quantities and stock exchanges
Any comment: Data / Parameter: Moisture content of the biomass residues
Data unit: % water content
Description: Moisture content of each biomass residue
Source of data to be
used:
On-site measurements
Value of data applied
for the purpose of
calculating expected
emission reductions in
section B.5
50% (Bagasse)
Description of
measurement methods
and procedures to be
applied:
It is monitored continuously where the mean values are calculated at least annually
QA/QC procedures to
be applied:
-
Any comment: -
Data / Parameter: NCVi,BF
PROJECT DESIGN DOCUMENT FORM (CDM PDD) - Version 03.1. CDM – Executive Board page 47 Data unit: Kcal/kg Description: Net calorific value of biomass Source of data to be used:
BASL
Value of data applied for the purpose of calculating expected emission reductions in section B.5
1,800
Description of measurement methods and procedures to be applied:
The NCV is determined in calibrated calorimeters of BASL
QA/QC procedures to be applied:
Check consistency of measurements and local / national data with default values by the IPCC. If the values differ significantly from IPCC default values, possibly collect additional information or conduct measurements.
Any comment: Data / Parameter: εel,project plant,y Data unit: MWh electricity per MWh heat input Description: Average net energy efficiency of electricity generation in the project plant
Source of data to be used:
BASL
Value of data applied for the purpose of calculating expected emission reductions in section B.5
0.1956
Description of measurement methods and procedures to be applied:
Calculated using formula provided in ACM0006 based on estimated electricity generation and fuel consumption
QA/QC procedures to be applied:
Check consistency with manufacturer’s information or the efficiency of comparable plants.
Any comment: Other parameters specified in ACM0006 are not applicable to this project activity.
B.7.2 Description of the monitoring plan:
>> Bannari Amman Sugars Limited will incorporate a special team for implementing the monitoring
procedures as described in sections B6.2 and B7.1. The team will comprise of relevant personnel from
various departments, who will be assigned the task of monitoring and recording specific CDM parameters

PROJECT DESIGN DOCUMENT FORM (CDM PDD) - Version 03.1. CDM – Executive Board page 48 relevant to their department. The monitored values will be periodically cross-checked by the respective
department heads and sent to the CDM team head for compilation and analysis. Any deviation of monitored
values from estimated values will be investigated and appropriate action would be taken. The monitored
values would be recorded and stored in paper and electronically for verification. Elaborate monitoring
information is provided in Annexure 4.
B.8 Date of completion of the application of the baseline study and monitoring methodology and the name of the responsible person(s)/entity(ies) >> B.8.1 Date of completing the final draft of this baseline section:
16/05/2007
B.8.2 Name of person/entity determining the baseline:
M/s. Bannari Amman Sugars Limited
Unit I – Alathukombai Village
Sathyamangalam – 638 401
Tamil Nadu, India

PROJECT DESIGN DOCUMENT FORM (CDM PDD) - Version 03.1. CDM – Executive Board page 49
SECTION C. Duration of the project activity / crediting period C.1 Duration of the project activity: C.1.1. Starting date of the project activity: >>
27/03/2001
C.1.2. Expected operational lifetime of the project activity: >>
20 years 0 months
C.2 Choice of the crediting period and related information: C.2.1. Renewable crediting period C.2.1.1. Starting date of the first crediting period: >> Not Applicable C.2.1.2. Length of the first crediting period: >> Not Applicable C.2.2. Fixed crediting period: C.2.2.1. Starting date: >> 01/09/2007 or on Registration with UNFCCC whichever is later C.2.2.2. Length: >> 10 years 0 months
PROJECT DESIGN DOCUMENT FORM (CDM PDD) - Version 03.1. CDM – Executive Board page 50 SECTION D. Environmental impacts >> D.1. Documentation on the analysis of the environmental impacts, including transboundary impacts: >>
A detailed assessment of Environmental Impact due to the project activity has been carried out and the
report is available as Enclosure – I. The cogeneration power plant uses environmentally sustainable grown
bagasse as fuel, which leads to zero net GHG emissions. The GHG emissions of the combustion process,
mainly CO2, will be consumed by sugar cane plant species, representing a cyclic process. Since, the
bagasse contains only negligible quantities of other elements like Nitrogen, Sulphur etc. release of other
GHG are considered as negligible. The bagasse contains 50% moisture & this will keep the temperatures at
steam generator burners low enough not to produce nitrogen oxides.
D.2. If environmental impacts are considered significant by the project participants or the host Party, please provide conclusions and all references to support documentation of an environmental impact assessment undertaken in accordance with the procedures as required by the host Party: >>
A host party regulation requires BASL to obtain environmental clearance in the form of “No Objection
Certificate” from the TamilNadu Pollution Control Board (TNPCB). The other condition is that the site of
the project has to be approved from the environmental angle and that the Environmental Management Plans
(EMPs) are to be prepared and submitted to the pollution control board. The assessment of environmental
impacts due to the project activity has been carried out to understand if there are any significant
environmental impacts and a management plan has been prepared to minimise adverse environmental
impact. The study indicates that the impact of the project is not significant.
The following documents were obtained from the TamilNadu (State) Pollution Control Board (TNPCB) for
the project activity (20 MW bagasse based cogeneration plant) towards environmental clearance:
• Consent under Section 21 of the Air (Prevention and Control of Pollution) Act, 1981 (Central Act
14 of 1981) as amended

PROJECT DESIGN DOCUMENT FORM (CDM PDD) - Version 03.1. CDM – Executive Board page 51
• Consent under Section 25/26 of the Water (Prevention and Control of Pollution) Act, 1974
(Central Act 6 of 1974) as amended

PROJECT DESIGN DOCUMENT FORM (CDM PDD) - Version 03.1. CDM – Executive Board page 52 SECTION E. Stakeholders’ comments >> E.1. Brief description how comments by local stakeholders have been invited and compiled: >> Identification of Stakeholders
Bannari Amman Sugars Limited (BASL) established the project activity (20 MW bagasse based
cogeneration plant) at their sugar factory premises during August 2002. The project activity uses mill-
generated bagasse as fuel and some amount of coal is co fired, when there is inadequate availability of
bagasse. The GHG emissions of the combustion process, mainly CO2, are sequestered by sugar cane / plant
species, representing a cyclic process. So the project activity leads to zero net GHG on-site emissions.
The stakeholders identified for the project activity are as under.
Ø Elected body of representatives administering the local area (village Panchayat)
Ø TamilNadu Electricity Board (TNEB)
Ø TamilNadu Pollution Control Board (TNPCB)
Ø Non Governmental Organizations (NGO’s)
Ø Consultants
Ø Equipment manufacturers / suppliers
Stakeholders list includes the government and non-government parties, which are involved in the project
activity at various stages. BASL communicated to the relevant stakeholders to provide their comments on
the project activity for which the stakeholders have responded with their comments. BASL has recorded
these comments and will produce it during the time of Validation. BASL also has obtained necessary
clearances from the government for setting up the project activity.
E.2. Summary of the comments received: >>

PROJECT DESIGN DOCUMENT FORM (CDM PDD) - Version 03.1. CDM – Executive Board page 53
Stakeholders Involvement
Local population
The consent / permission of the village Panchayat / local elected body of representatives is required to set
up the project activity. BASL has already obtained the consent and documented their approval for the
project activity. Local population comprises the local people in and around the project area. The role of the
local people is as a beneficiary of the project activity. They supply raw material i.e. sugar cane for sugar
mills and biomass for cogeneration. In addition to this, it also includes local manpower working at the plant
site. Since, the project activity provides good direct and indirect employment opportunities, the local
populace encouraged the project activity.
The project activity has not displaced any local population. Since, the distance between the electrical
substation for power evacuation and the plant is only 2 Km, installation of transmission lines did not create
any inconvenience to the local population. Thus, the project activity has not caused any adverse social
impacts on local population rather has helped in improving their quality of life.
TamilNadu Pollution Control Board (TNPCB)
The project activity has received No Objection Certificate (NOC) from the TNPCB and Consent for
operating the plant under Section 21 of the Air (Prevention and Control of Pollution) Act 1981 as amended.
TNPCB in their consent has prescribed stack heights for the cogeneration plant boiler. TNPCB has also
prescribed standards of environmental compliance for the stack emissions from the cogeneration plant.
BASL would have to periodically monitor the stack emissions to ensure compliance with standards.
The project activity has also received consent to operate for the discharge of sewage trade effluent under
Section 25/26 of the Water (Prevention and Control of Pollution) At 1974 (Central Act 6 of 1974) as
amended. The TNPCB has laid out special conditions to be followed by the project activity for effluent
discharge to ensure compliance with environmental standards. TNPCB has also laid out maximum daily
effluent discharge limits for the cogeneration plant effluents. The water requirement for the project activity
is met through river infiltration wells and stored in the raw water tank.
TamilNadu Electricity Board (TNEB)
PROJECT DESIGN DOCUMENT FORM (CDM PDD) - Version 03.1. CDM – Executive Board page 54 As a buyer of the power, the TNEB is a major stakeholder in the project activity. They hold the key to the
commercial success of the project activity. TNEB has cleared the project activity and BASL has signed
Power Purchase Agreement (PPA) with TNEB.
The TNEB and BASL have signed an agreement for parallel operation and supply/ purchase of surplus
power from BASL, Sathyamangalam on 24th April 2002. The TNEB shall draw power and therefore pay
under the Section 43 of the Electricity (Supply) Act, 1948. The sugar mill agreed that a deduction of 2% be
made from the total energy exported to the grid towards line losses. As per the agreement, the sugar mill is
permitted to wheel the bagasse-based power to its subsidiary company situated within a radius of 25 km
from the sugar mill by paying wheeling charges of 2%.
Project Consultants
Project consultants were involved in the project activity to take care of various pre contract and post
contract project activities like preparation of Detailed Project Report (DPR), preparation of basic and
detailed engineering documents, preparation of tender documents, selection of vendors / suppliers,
supervision of project implementation, Successful commissioning and trial runs.
Equipment suppliers
Equipment suppliers supplied the equipments as per the specifications finalized for the project activity and
were responsible for successful erection & commissioning of the same at the site and for performance.
Stakeholder’s Comments
BASL has received the necessary approvals and consents from various authorities prior to project
implementation. The approvals include those from TNPCB, TNEB, Panchayat (Public and local people
around Sathyamangalam). All the comments from stakeholders were positive, encouraging the development
of project activity and no negative comments were received.
E.3. Report on how due account was taken of any comments received: >>

PROJECT DESIGN DOCUMENT FORM (CDM PDD) - Version 03.1. CDM – Executive Board page 55 The comments and important clauses mentioned in the project documents like Detailed Project Report
(DPR), environmental clearances; local clearances etc were considered while preparing the CDM project
design document. No corrective action was undertaken as no negative comments were received. The PDD
will be published at the validator’s website for public comments, as per the UNFCCC requirement.
PROJECT DESIGN DOCUMENT FORM (CDM PDD) - Version 03.1. CDM – Executive Board page 56
Annex 1
CONTACT INFORMATION ON PARTICIPANTS IN THE PROJECT ACTIVITY Organization: Bannari Amman Sugars Limited Street/P.O.Box: Unit-I, Alathukombai Village Building: Engineers’ Office Building City: Sathyamangalam Taluk, Erode District State/Region: Tamilnadu Postfix/ZIP: 638401 Country: India Telephone: 91-4295-220387, 220363, 220414-418, FAX: 91-4295-220695, 222362 (Fax) E-Mail: [email protected] URL: www.bannari.com Represented by: Title: Executive President Salutation: Mr. Last Name: P Middle Name: First Name: Dharmalingam Department: Administration Mobile: Direct FAX: Direct tel: Personal E-Mail:

PROJECT DESIGN DOCUMENT FORM (CDM PDD) - Version 03.1. CDM – Executive Board page 57
Annex 2
INFORMATION REGARDING PUBLIC FUNDING
No public funding for this project.

PROJECT DESIGN DOCUMENT FORM (CDM PDD) - Version 03.1. CDM – Executive Board page 58
Annex 3
BASELINE INFORMATION The Central Electricity Authority (CEA) has published the baseline emission factors database for the
various electricity grids in India. The emission factors have been calculated based on UNFCCC guidelines
(ACM0002). For further details on the calculation methods and data used, please refer the following web-
link:
http://www.cea.nic.in/planning/c%20and%20e/Government%20of%20India%20website.htm
In the CEA database, the simple operating margin, build margin and combined margin emission factors of
the regional electricity grids have been provided separately for two cases; Including electricity imports and
Excluding electricity imports from other regional grids. Since, emission factors excluding imports are
lower, the same has been considered as a conservative approach. The combined margin emission factor for
the southern regional grid (0.86 tCO2/MWh) has been considered for this project activity. CENTRAL ELECTRICITY AUTHORITY: CO2 BASELINE DATABASE VERSION 1.1
DATE 21 Dec
2006 BASELINE METHODOLOGY
ACM0002 / Ver 06
EMISSION FACTORS Simple Operating Margin (tCO2/MWh) (excl. Imports) 2000-01 2001-02 2002-03 2003-04 2004-05 North 0.98 0.98 1.00 0.99 0.97 East 1.22 1.22 1.20 1.23 1.20 South 1.02 1.00 1.00 1.01 1.00 West 0.98 1.01 0.98 0.99 1.01 North-East 0.67 0.66 0.68 0.62 0.66 India 1.02 1.02 1.02 1.03 1.03 Build Margin (tCO2/MWh) (excl. Imports) 2000-01 2001-02 2002-03 2003-04 2004-05 North 0.53 East 0.90 South 0.72 West 0.78 North-East 0.10 India 0.70 Combined Margin (tCO2/MWh)

PROJECT DESIGN DOCUMENT FORM (CDM PDD) - Version 03.1. CDM – Executive Board page 59 (excl. Imports) 2000-01 2001-02 2002-03 2003-04 2004-05 North 0.76 0.76 0.77 0.76 0.75 East 1.06 1.06 1.05 1.07 1.05 South 0.87 0.86 0.86 0.86 0.86 West 0.88 0.89 0.88 0.88 0.90 North-East 0.39 0.38 0.39 0.36 0.38 India 0.86 0.86 0.86 0.86 0.86
PROJECT DESIGN DOCUMENT FORM (CDM PDD) - Version 03.1. CDM – Executive Board page 60
Annex 4
MONITORING INFORMATION
MONITORING PLAN
Description of the Monitoring Plan
The Monitoring and Verification (M&V) plan defines a project-specific requirement against which the
project's performance (i.e. GHG reductions) and conformance with all relevant criteria will be monitored
and verified. It includes developing suitable data collection methods and data interpretation techniques for
monitoring and verification of GHG emissions with specific focus on technical / efficiency / performance
parameters. It also allows scope for review, scrutinize and benchmark all this information against reports
pertaining to M & V protocols.
As per ACM0006 methodology, some parameters that require monitoring are described below:
Bagasse Requirement and Utilization
Availability of Bagasse
The major fuel being used by the cogeneration power plant is bagasse, saved by the sugar producing unit
of BASL. The bagasse generated by the sugar mill is being supplied to cogeneration plant. Hence,
production of electricity is mainly dependent on the bagasse produced at the sugar mill. The receipt of
bagasse to cogeneration plant mainly depends on the following parameters.
• Total cane crushed by the sugar mill
• Variety / fiber content of the sugar cane crushed
• In-house bagasse consumption by sugar mill
The supplementary fuel in relatively smaller measure used in this cogeneration plant is cane trash.
Quantity of the Bagasse fuel used in the boiler
The total amount of saved bagasse received from the sugar unit will be based on the total sugar cane
crushing, bagasse generated and use for internal consumption.
The bagasse from the sugar mill is conveyed to the boiler by a combination of belt and chain slat
conveyors. The system has the provision of returning the excess bagasse to the storage yard and also has
the provision of back-feeding the bagasse from the storage yard to the boiler. There are 3 different
bagasse paths as given below:
PROJECT DESIGN DOCUMENT FORM (CDM PDD) - Version 03.1. CDM – Executive Board page 61
• Feeding the bagasse to the cogeneration steam generator directly from the sugar mill
• Feeding the bagasse to the cogeneration steam generator from the storage yard
• Storing the bagasse in the covered storage yard in case of cogeneration steam generator not
operating
The handling of cane trash if used in the boiler during off-season operation, will be through the same
handling system as used for bagasse.
The bagasse generated at the sugar mill is quantified by using the mass-balance equation. The inputs to
the sugar mill are sugar cane and water for imbibition, which are measured and recorded and the output
from the mill are juice and bagasse. The juice is weighed and recorded and the weight of bagasse
generated is calculated as the balance quantity i.e. Sugar cane + Imbibition water = Cane juice +
Bagasse. This value is recorded on a daily basis. Of this 5% of bagasse is used for vacuum filtration as
bagacillo and conveying losses. The remaining quantity of bagasse is used for steam generation
purposes.
Since it is mandatory for sugar industries to submit yearly performance record (RT-8C form), which
also includes above parameters, to the government, these figures are to be crosschecked from this record.
The biomass (cane trash) used in the boiler is measured by weighing the load in the weighbridge and
monitoring manually in the yard. The control of cane trash is done manually and the data is entered in the
logbook on a daily basis.
In case any fossil fuel is purchased this would become evident from the audit report. In this case, the net
calorific value (NCV) and the CO2 emission factor of the fossil fuel will be required to estimate the
project emissions.
Bagasse used in the boiler
The main fuel used for the power generation is bagasse, which is supplemented with small quantities of
cane trash. The properties of the bagasse fuels like ultimate analysis, calorific value, ash composition
etc. are already established and will be consistent in the region. However, various properties of bagasse
fuels are monitored by taking samples at random from the fuel lots from the processed fuel so that in
case of any drastic change in the properties, corrective actions can be taken. Bagasse emerging from the
sugar mill is sampled once in 4 hours for its moisture % and sugar % and from this analysis the gross
and net calorific values are calculated using the formulas:

PROJECT DESIGN DOCUMENT FORM (CDM PDD) - Version 03.1. CDM – Executive Board page 62 Gross Calorific Value: GCV = 4600 – 12S – 46W
Net Calorific Value: NCV = 4600 – 12S – 48.5W
Where, W is the Moisture % Bagasse and S – Sugar % Bagasse
The measurement of fuel properties like ultimate analysis, calorific value etc. will be done at reputed
laboratories as per international practices and data or documents will be kept open for verifiers. The data
will also be computerized and monitored through management information system of the DCS.
Operational Parameters of the Cogeneration Unit
Total Power Generated
The total power generated by the power project is being measured in the plant premises to the best
accuracy and is recorded, monitored on a continuous basis through DCS. All measurement devices are
microprocessor based with best accuracy, which have been procured from reputed manufacturers. All
instruments are calibrated at regular intervals. All instruments carry tag plates, which indicate the date of
calibration and the date of next calibration. The parameter will substantiate the smooth operations of the
cogeneration. During verification the total power generated would be verified as compared to the power
exported to the grid. All the parameters are also recorded manually and in the DCS and can be retrieved
when necessary.
Power consumed by the plant auxiliaries
The project developer has installed all metering and check metering facilities within the plant premises as
well as in the grid substation where exported power is connected to the grid. The measurement will be
recorded and monitored on a continuous basis by both TNEB and the project developer through DCS. In
addition to the records maintained by the promoter, TNEB also monitors the actual power exported to
the grid and certify the same. All measurement devices are microprocessor based with best accuracy and
procured from reputed manufacturers. All instruments will be calibrated at regular intervals. All
instruments carry tag plates, which indicate the date of calibration and the date of next calibration.
Power Exported to grid
The total power exported by the power project would be recorded, monitored on a continuous basis.
During verification the total power generated and auxiliary power consumed by the cogeneration plant
would be verified as compared to the power exported to the grid. All the parameters are monitored
regularly and retrieved when necessary.
All the above parameters / factors will demonstrate the performance of the project at any point of time.
PROJECT DESIGN DOCUMENT FORM (CDM PDD) - Version 03.1. CDM – Executive Board page 63 The following major project parameters which affects the emission claims need to be verified, based on the
available operating data is as under:
• Cane crushing by the BASL sugar unit
• Quantity of bagasse available
• Type and quantity of biomass fuels used in the boiler
• Total generation of power and captive & auxiliary power requirements.
• Power exported to the grid
PROJECT DESIGN DOCUMENT FORM (CDM PDD) - Version 03.1. CDM – Executive Board page 64
Appendices
PROJECT DESIGN DOCUMENT FORM (CDM PDD) - Version 03.1. CDM – Executive Board page 65
Appendix A Abbreviations
BASL Bannari Amman Sugars Limited
CC Climate Change
CDM Clean Development Mechanism
CEA Central Electricity Authority
CER Certified Emission Reductions
CMIE Centre for Monitoring Indian Economy
CO Carbon mono-oxide
CO2 Carbon di-oxide
CPU Central Power Units
DCS Distributed Control System
DPR Detailed Project Report
DM De-Mineralised
EGEAS Electric Generation Expansion Analysis System
EPS Electric Power Survey
ESP Electro Static Precipitator
EIA Environmental Impact Assessment
FD Forced Draft
FYP Five Year Plan
GHG Greenhouse Gas
GOI Government of India
GWh Gega Watt hour
HP High Pressure
HV High Voltage
ID Induced Draft
IPCC Intra-governmental Panel for Climate Change
IPP Independent Power Producers
IREDA Indian Renewable Energy Development Agency
PROJECT DESIGN DOCUMENT FORM (CDM PDD) - Version 03.1. CDM – Executive Board page 66 ISPLAN Integrated System Plan
KP Kyoto Protocol
Km Kilo meters
KV Kilo Voltage
KW Kilo Watt
KWh Kilo Watt hour
NCES Non-Conventional Energy Sources
LP Low Pressure
1 Lakh 1,00,000
MkWh Million Kilo Watt hour
MU Million units
MNES Ministry of Non-conventional Energy Sources
MoP Ministry of Power
MoU Memorandum of Understanding
MSW Municipal Solid Waste
MT Metric Ton
MW Mega Watt
NCE Non Conventional Energy
NEDA Non conventional Energy Development Agency
Nox Nitrogen Oxides
NTPC National Thermal Power Corporation
NOC No Objection Certificate
p.a Per annum
PLF Plant Load Factor
PPA Power Purchase Agreement
PIN Project Idea Note
PRDS Pressure regulating and de-superheating station
REP Renewable Energy Projects
SA Secondary Air
PROJECT DESIGN DOCUMENT FORM (CDM PDD) - Version 03.1. CDM – Executive Board page 67 SEB State Electricity Board
SO2 Sulphur Di-oxide
SPM Solid Particulate Matter
STG Steam Turbine Generator
TCD Tones of Crushing per Day
TDS Total Dissolved Solids
TERI Tata Energy Research Institute
TJ Trillion Joules
TNEB Tamilnadu Electricity Board
TNPCB Tamilnadu Pollution Control Board
TPH Tones Per Hour
UNFCCC United Nations Framework Convention on Climate Change
PROJECT DESIGN DOCUMENT FORM (CDM PDD) - Version 03.1. CDM – Executive Board page 68
Appendix B Reference List
Sr.No Particulars of the references
Kyoto protocol / UNFCCC Related
1. Kyoto Protocol to the United Nations Framework Convention on Climate Change
2. Website of United Nations Framework Convention on Climate Change (UNFCCC),
http://unfccc.int
Project Related
3. Detailed Project Report on 20 MW Non-Conventional renewable Sources bagasse Cogeneration Power Plant at BASL, Sathyamangalam
4. Various project related information / documents / data received from BASL.
Baseline Related
5. Website of Center for Monitoring Indian Economy (CMIE) Pvt. Ltd., Mumbai, India –
www.cmie.com
6. Website of Central Electricity Authority (CEA), Ministry of Power, Govt. of India -
www.cea.nic.in
7. Website of Ministry of Power (MoP), Govt. of India www.powermin.nic.in
8. Website of Ministry Non-Conventional Energy Sources (MNES), Govt. of India –
www.mnes.nic.in
PROJECT DESIGN DOCUMENT FORM (CDM PDD) - Version 03.1. CDM – Executive Board page 69
9. Website of Indian Renewable Energy Development Agency (IREDA), www.ireda.nic.in
10. Official website of Government of Tamilnadu
http://www.tn.gov.in
11. Infraline web site. http://www.infraline.org
12. South India Sugar Manufacturer’s Assosiation (SISMA)
13. www.indianelectricity.com
PROJECT DESIGN DOCUMENT FORM (CDM PDD) - Version 03.1. CDM – Executive Board page 70
Enclosures

PROJECT DESIGN DOCUMENT FORM (CDM PDD) - Version 03.1. CDM – Executive Board page 71
Enclosure I
Report on Environmental Impact
The environmental impacts can be either categorized as primary or secondary impacts. Primary impacts are
those that can be attributed directly to the project itself while secondary impacts are those, which are
induced indirectly because of the development activity which may be triggered by the primary impact. The
secondary impacts typically include the associated investment and changed patterns of social and economic
activity by the project activity.
The impact of the project on the environment can occur at two stages:
3. Construction phase
4. Operational phase
The project activity concerned has been set up adjacent to the existing sugar manufacturing unit at
Sathyamangalam.
Impacts during construction phase
The impacts during construction phase due to the construction of the 20 MW bagasse based cogeneration
plant are listed as given here:
Air quality impacts:
• Due to particulate emissions from site clearing
• Due to particulate emissions from quarrying operations offsite
• Due to vehicular emissions from transportation of raw materials such as cement, sand, gravel etc
• Due to particulate emissions from construction activities such as pre-casting, fabrication, welding
etc
Noise level increase:
• From earth moving equipments used for site clearing
• From quarrying operations offsite
• From transportation of raw materials such as cement, sand, gravel etc
• From construction activities onsite
PROJECT DESIGN DOCUMENT FORM (CDM PDD) - Version 03.1. CDM – Executive Board page 72
Land and soil impacts:
• From change/ replacement of existing land-use by site clearing
• From soil erosion due to removal of vegetation
• From solid wastes disposed on land from construction activities
Water environment impacts
• From consumption of water for construction purposes
Impacts on ecology
• Removal of vegetation at the site
Impacts on socioeconomic environment
• Employment opportunities to local people
The above represents a broad range of environmental impacts that would have occurred during the
construction phase of the cogeneration plant.
It should be noted that the impacts due to construction activities are mostly short-term and cease to exist
beyond the construction phase.
Impacts during operational phase
The operational phase involves power generation from bagasse. The cogeneration plant feeds surplus
power to the grid and indirectly prevents the pollutants otherwise let out into the atmosphere from the
thermal power plants (coal, gas and diesel based) of the State grid. Also bagasse being a biomass –
renewable fuel does not add any net CO2 to the atmosphere as the carbon gets recycled during cane growth.
Alternative methods of bagasse disposal being currently practiced in sugar plants includes inefficient
burning of bagasse in boilers or letting it to decompose, which would lead to more dust and GHG emissions
when compared to the present project activity. The impacts during operational phase of the cogeneration
plant are as given here:
Air quality impacts:
The cogeneration plant discharges the following pollutants into the air:
PROJECT DESIGN DOCUMENT FORM (CDM PDD) - Version 03.1. CDM – Executive Board page 73
• Suspended Particulate Matter (SPM) from fly ash in the flue gas
• Oxides of Nitrogen (NOx) in the flue gas
• Carbon dioxide (CO2)
The ash content in bagasse is less than 2%. As the pollution control regulations limit the particulate matter
emissions from bagasse fired steam generators to 150 mg/ Nm3, electrostatic precipitators (ESP’s) are used
in the cogeneration plant to contain the dust emission from the plant to less than 150mg/Nm3 during
bagasse firing.
The fly ash collected from the ESP hoppers and air heater hoppers and the ash collected from the furnace
bottom hoppers are used as landfill during the seasonal operation of the plant when bagasse is the main
fuel. Considering the high potash content in the bagasse, the ash is used as manure.
As there is no sulphur in bagasse, SO2 emissions do not occur. The temperatures encountered in the steam
generators while burning high moisture bagasse are low enough not to produce nitrogen oxides. Carbon
dioxide produced by firing bagasse is absorbed by sugar cane plantation and hence recycled.
To reduce to ground level air contaminants, a 77 m stack is used for baggase-fired boiler. This has helped
in faster dispersion of air pollutants into the atmosphere thus reducing the impact on the project
surroundings.
During off-season the biomass (cane trash) is transported from nearby cane fields to the project site.
However considering 3 truck trips per day for transporting 18 tons/day of cane trash from 50 Km distance,
the air emissions are very negligible.
The air emissions i.e. SO2, NOx, CO and SPM emissions released from the stacks attached to the boiler of
the cogeneration plant are being monitored as per the Section 21 of the Air (Prevention & Control of)
Pollution Act 1981.
Noise level increase:
The sound pressure level generated by the noise sources decrease with increasing distance from the source
due to wave divergence. Sound attenuation occurs due to atmospheric effects and its interaction with
PROJECT DESIGN DOCUMENT FORM (CDM PDD) - Version 03.1. CDM – Executive Board page 74 objects in the transmission path. As Satyamangalam has lot of trees & greenery the noise levels get
attenuated significantly.
In a cogeneration plant, noise level increase is primarily from:
• Cogeneration plant operation
• Transportation of vehicles carrying the biomass i.e. cane trash to the cogeneration power plant.
The rotating equipment of the cogeneration plant is designed to operate with a total noise level which will
not exceed 85 – 90 db (A) as per the requirement of the Occupational Health and Safety Administration
(OSHA) standards. The rotating equipment is provided with silencers wherever required to meet the noise
pollution regulations. As per OSHA, the damage risk criteria enforced to reduce hearing loss stipulates that
the noise level upto 90 dBA is acceptable for 8 working hours per day.
The vehicular transport of biomass from nearby cane fields to the cogeneration plant includes only 3 truck
trips per day and hence the impact is negligible.
The green belt has been provided around the plant area for noise attenuation. Also the workers are
instructed to wear ear masks to reduce noise level impacts.
Water quality impacts:
The effluents generated from the project activity are being treated in the effluent treatment plant to ensure
that there is no environmental deterioration.
The wastewater generated from the project activity are as given below:
• Effluent from DM plant: Hydrochloric acid and sodium hydroxide are used as regenerants in the
DM water plant for boilers and the acid and alkali effluent are neutralized in an epoxy line
neutralizing pits. Generally these effluents are self-neutralizing however, provisions are made such
that the effluents are completely neutralized by addition of acid/ alkali. The effluent will then be
pumped into the effluent treatment ponds which are a part of the effluent disposal system
• Chlorine in the condenser cooling water is about 0.2 ppm and this value would not result in
chemical pollution and meets the national standards for liquid effluent
PROJECT DESIGN DOCUMENT FORM (CDM PDD) - Version 03.1. CDM – Executive Board page 75
• The effluent from boiler: The blow down water generated from the boiler would have high pH and
temperature from the pollution viewpoint. The effluent is generated at 1.22 TPH having a high pH
of 9.8 – 10.3 and temperature of 100 deg C and is disposed into the trench and then through sugar
plant effluent ponds
• Sewage from various buildings in the plant are conveyed through separate drains into the septic
tank
Wastewater treatment plant has been provided for the adequate treatment of the cogeneration plant
effluents. The wastewater is treated to suit its use for irrigation purposes.
The characteristics of effluents from the cogeneration plant are maintained so as to meet the requirements
of TNPCB and minimum national standards from thermal power plants.
Ecological impacts:
There are no ecological impacts as the wastewater from the cogeneration plant are treated appropriately
before final disposal.
Also as trees have been planted around the plant, it gives a cool atmosphere in the operational area and
providse as a barrier for air emissions and noise level increase.
Land and soil impacts:
The solid wastes generated from the cogeneration plant are the dry fly ash and wet bottom ash from Grate.
Considering the high potash content in the ash generated from bagasse firing, the same is being used as
manure in nearby cane fields. Also since the filter press mud from the sugar plant also has good land
nutrient value, ash is mixed with press mud and the same is sold to farmers for use in cane fields.
Socio-economic impacts
The cogeneration plant has contributed to socio economic growth in the following ways;
• Generating employment to 50 technical experts in various fields like mechanical, electrical,
electronics, instrumentation, chemical engineering etc
• Feeding of surplus power to the grid thereby bridging the gap between demand and supply in a
power deficit State
PROJECT DESIGN DOCUMENT FORM (CDM PDD) - Version 03.1. CDM – Executive Board page 76
• Offering environmentally friendly solution for additional power generation without using fossil
fuels
• Improving financial position of the sugar plant
• Reducing the fuel transportation costs
• Reducing the transmission losses
• Self reliance of power in rural areas
Environmental Management Plan (EMP)
The EMP is to mitigate and manage the various impacts arising from construction and operational phases
of the cogeneration power plant.
Construction phase
Air environment
The following mitigative measures were undertaken during construction phase
• Spraying of water at regular intervals to control fugitive dust emissions from construction activities
• Closing materials in trucks with tarpaulin during transportation of raw materials to the site to
prevent dust emissions
• Regular and periodic emission check for transportation vehicles
• Use of personal protective equipment (PPE) like goggles and nose masks to reduce impact of dust
emissions during construction activities
Noise environment
• Periodic noise control checks on transportation vehicles
• Provision of ear plugs, work rotation, adequate training
Operational phase
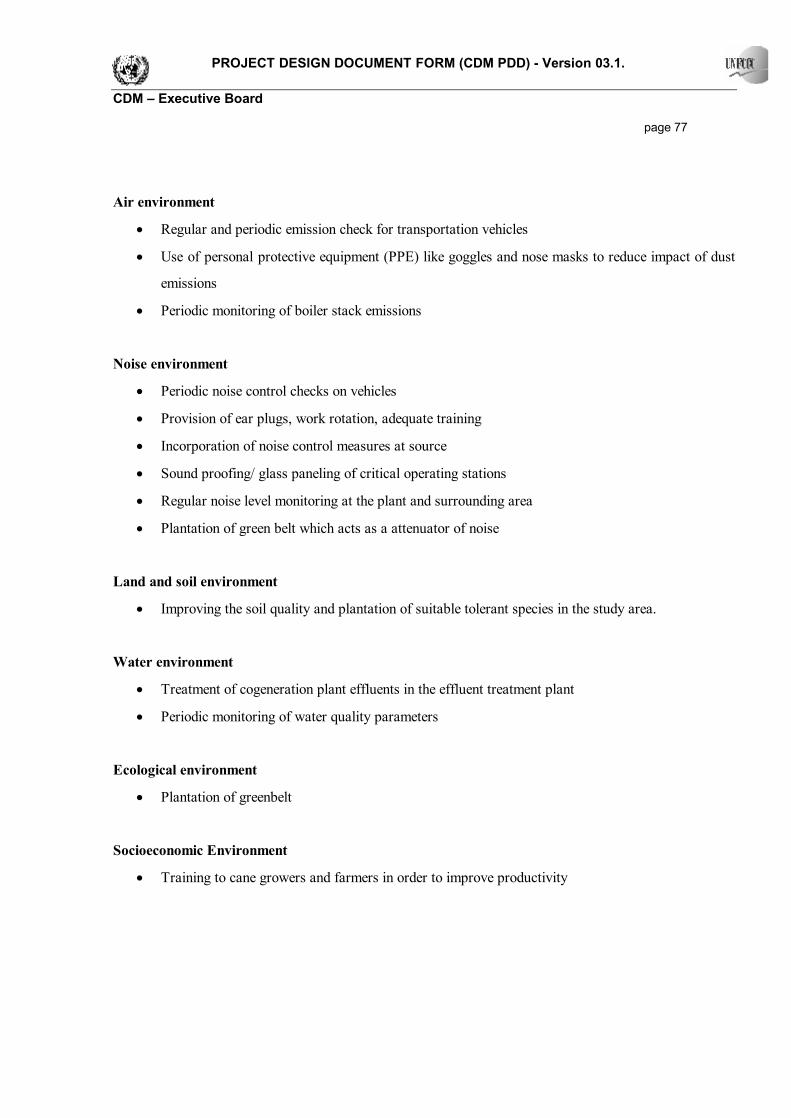
PROJECT DESIGN DOCUMENT FORM (CDM PDD) - Version 03.1. CDM – Executive Board page 77
Air environment
• Regular and periodic emission check for transportation vehicles
• Use of personal protective equipment (PPE) like goggles and nose masks to reduce impact of dust
emissions
• Periodic monitoring of boiler stack emissions
Noise environment
• Periodic noise control checks on vehicles
• Provision of ear plugs, work rotation, adequate training
• Incorporation of noise control measures at source
• Sound proofing/ glass paneling of critical operating stations
• Regular noise level monitoring at the plant and surrounding area
• Plantation of green belt which acts as a attenuator of noise
Land and soil environment
• Improving the soil quality and plantation of suitable tolerant species in the study area.
Water environment
• Treatment of cogeneration plant effluents in the effluent treatment plant
• Periodic monitoring of water quality parameters
Ecological environment
• Plantation of greenbelt
Socioeconomic Environment
• Training to cane growers and farmers in order to improve productivity
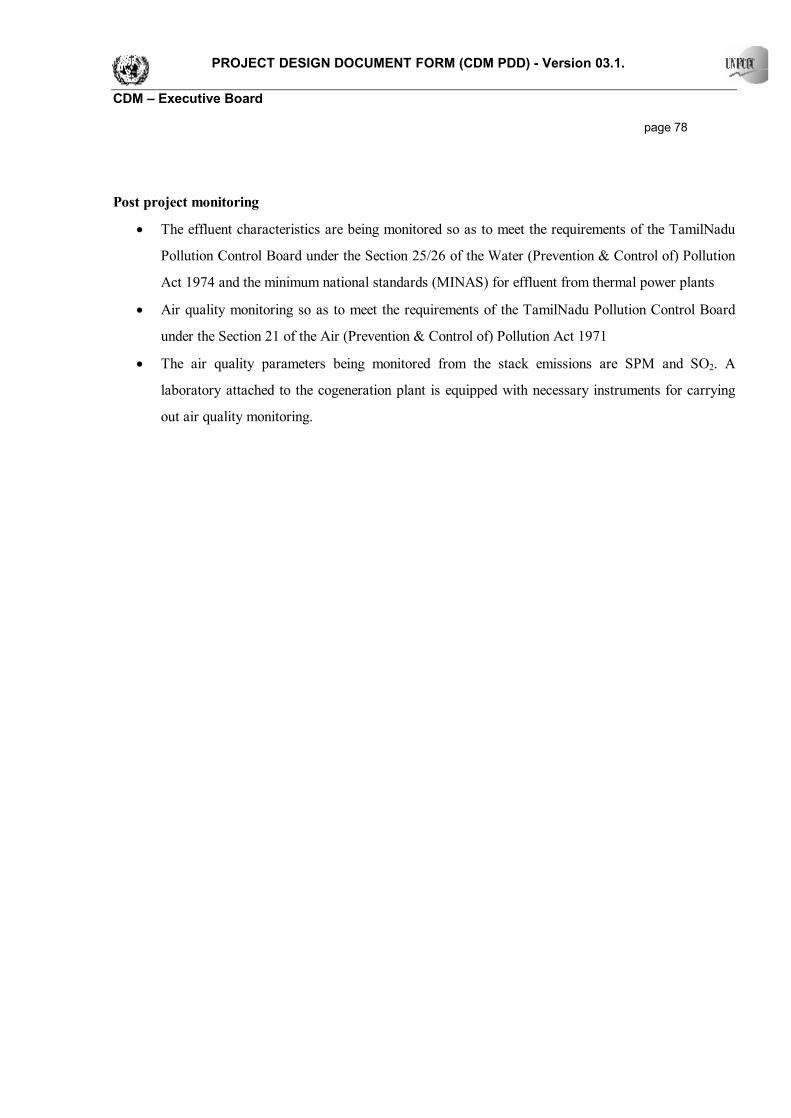
PROJECT DESIGN DOCUMENT FORM (CDM PDD) - Version 03.1. CDM – Executive Board page 78
Post project monitoring
• The effluent characteristics are being monitored so as to meet the requirements of the TamilNadu
Pollution Control Board under the Section 25/26 of the Water (Prevention & Control of) Pollution
Act 1974 and the minimum national standards (MINAS) for effluent from thermal power plants
• Air quality monitoring so as to meet the requirements of the TamilNadu Pollution Control Board
under the Section 21 of the Air (Prevention & Control of) Pollution Act 1971
• The air quality parameters being monitored from the stack emissions are SPM and SO2. A
laboratory attached to the cogeneration plant is equipped with necessary instruments for carrying
out air quality monitoring.