Embed Size (px)
Citation preview
C l e a n a i r i n P o r t se U l i F e + P r o j e c t „ C l e a n a i r “

iMPrint
© 2015, NABUNaturschutzbund Deutschland e.V. www.NABU.de
TextJulia Balz, Sönke Diesener, Malte Siegert
Designhallo-heide.de
Layoutjudithkeller.com
Picturesfotograf-hamburg.de: cover; 3; 4; 11; 19;20; 24; 23; 25; 29; 26; 27; 30 and 35. michael1959/iStock: 6. NABU/Buschkühl: 12. NABU: 13 and 22. Scandlines: 15. Jan Arrhénborg/AGA: 16. SkySails: 17. NABU/Lampe: 27; 32; 34. Hamburg Port Authority: 31. 36clicks/iStock: 36.
www.cleanair-europe.org
i n t r o D U C t i o n
11
a ir pollution in and from ports is a serious problem not only in the European Union. It seems as if the impact of ports on air quality in Europe is currently underesti-
mated and little investigated. This is more of a problem where ports are located either close to or even in city centres such as in Antwerp, Amsterdam and Hamburg. Annually, air pollution causes over 420,000 premature deaths throughout the Europe-an Union (2010, EU-27).1 Of these, 50,000 premature deaths are attributed to shipping in European waters.2 Moreover, air pol-lution diminishes biodiversity, contributes to climate change, harms nature and damages buildings and monuments.
Ports are hubs of air pollution because many emitters operate there: numerous kinds of transport and port machinery with diesel engines without exhaust treatment systems or even running on a comparatively dirty fuel. Some of these forms of transports and machinery, such as ocean-going vessels, do not fall under the strict(er) land-based regulations, but enjoy pollu-tion privileges as allowed by international maritime laws. But even where - European or national - legal limits for air emissions exist, the limits are not strict enough and, moreover, some are breached without consequences for the emitters. And for some pollutants, such as black carbon (BC), there are no limits at all.
But the picture is not as bleak as this first impression sug-gests – there is light on the horizon. There are already many examples of ports where stakeholders voluntarily implement measures to clean up the air. Unfortunately, these examples and what it takes to implement them are not very well known. That is one of the reasons why the German Nature and Biodi-versity Conservation Union (NABU) started the project Clean Air in Ports. It was part of the umbrella project Clean Air funded by EU LIFE+ funds (2012–2015). Eight environmen-tal organisations from six European countries campaigned for better air quality throughout Europe. Over the three-year period, the project Clean Air in Ports held six workshops in European port cities (Hamburg, Antwerp, London, Copen-hagen, Barcelona and Gdansk). The workshops not only aimed to bring experts, relevant stakeholders and policymak-ers together that either have an interest in or the possibility to contribute to better air quality in and from ports, but also to inform people about the problem of air pollution and to pre-sent, collect and discuss best practices and examples for clean air in ports. This manual collects what we learned during the
run-time of the project. It gives an introduction into the topic of air pollution and the legal framework, and presents an array of measures, broken down into different groups of emitters. Since there are no ‘one size fits all’ solutions, stakeholders can choose which measures fit and work best in their specific situ-ation to reduce air pollution to a level where human health, na-ture and the climate are harmed as little as possible. Annex B lists stakeholders and measures they could implement. The manual also shows political decision makers why legal frame-works and stricter regulation in ports and for port operation are urgently needed to help clean up the air.
We hope that this manual raises the awareness of all the rel-evant stakeholders and policymakers who are directly or indi-rectly responsible for air quality in cities and ports, and that, as a consequence, they initiate or implement measures to re-duce air pollution in ports. This paper focuses on the primary air pollution topics, even though there are many other envi-ronmental aspects that ports should deal with, such as the use of land and how to deal with waste. Many of these issues are closely linked to air pollution. These other topics are impor-tant too, and need to be addressed by other projects. We also hope that the manual helps stakeholders to get in touch with companies and institutions in order to get more information and realise air quality improvement measures. To support this, Annex B lists institutions, experts and companies that were part of the project in one way or another. Please do contact us if you need help getting in touch with someone or need more information on a specific topic.
The NABU project team wishes to point out that we are not scientific experts on the measures and topics discussed and that, while we tried our best to validate all the information, we therefore do not accept liability for the content. Please do not hesitate to report errors if you find them, so that we can take them into consideration for a second version of this paper.
We wish to thank everyone – stakeholders from ports, authorities, other NGOs and politicians – who supported our work during the last three years. Many thanks especially to the experts who contributed to making this manual as good as pos-sible – the speakers at our workshops, the conference organisers and port authorities who successfully supported the organisa-tion of our workshops and contributed to the content.
i n t r o D U C t i o n
introDUCtion
2
introduction 1
1. air Pollution in Ports – What are the Harmful Pollutants? 3
2. effects of air Pollution 52.1. Health Effects of Air Pollution 2.2. Environmental Damage Caused by Air Pollution 2.3. Climate Change and Air Pollution 2.4. Buildings and Air Pollution
3. emissions in Ports 73.1. Who Are the Emitters in Ports? 3.2. How Much Do Ports Emit? 3.3. Air Quality Regulations 3.4. Specific Regulations for Air Quality in Ports
4. emission reduction Measures for single emitters 11
4.1. Water Transport: Inland and Ocean-Going Vessels 4.1.1. Eco-Sailing 4.1.2. Slow Steaming 4.1.3. Virtual Arrival 4.1.4. Use of Low-Sulphur Fuel While at Berth4.1.5. Diesel Particulate Filters4.1.6. Selective Catalytic Reduction4.1.7. Fuel Cells 4.1.8. Hybrid Ships 4.1.9. Ships Running on Batteries 4.1.10. Liquefied Natural Gas 4.1.11. Methanol. 4.1.12. Ships with a Plug for an Onshore Power Supply 4.1.13. Ships with Wind Propulsion 4.1.14. Exhaust Gas Recirculation 4.1.15. Scrubbers
4.2. Road Transport 194.2.1. Efficient Coordination of Arrival and Departure 4.2.2. Driver Training 4.2.3. Ban on Polluting Trucks 4.2.4. Shifting Cargo from the Road to Waterways 4.2.5. Exhaust Treatment Systems 4.2.6. Alternative Fuels 4.2.7. Electric Drives 4.2.8. Fuel Cells 4.2.9. Electrification of the Track
4.3. Non-Road Mobile Machinery: Cranes, Straddle Carriers and Construction Machinery 234.3.1. Efficient Coordination of Loading and Unloading 4.3.2. Diesel Particulate Filters 4.3.3. Gas-Fuelled Forklifts 4.3.4. Fuel Cells 4.3.5. Electric Machinery 4.3.6. Hybrid-Fuel/Electric Machinery 4.3.7. Hydrogen Injection 4.3.8. Regenerative Braking Gantry Cranes
4.4. Rail Transport 264.4.1. Diesel Particulate Filters 4.4.2. (Diesel-)Electric Drives 4.4.3. Light Cargo Wagons 4.4.4. Emulsified Fuel 4.4.5. Locomotives with Idling Control
4.5. Measures for Port Authorities, Terminal Operators and Industries 284.5.1. Energy Efficiency 4.5.2. Renewable Energy 4.5.3. Raising Awareness and Training Employees 4.5.4. In-Port Low-Emission Traffic 4.5.5. Ship Indices 4.5.6. Electrical Equipment Wherever Feasible 4.5.7. Power Supply from Alternative Sources 4.5.8. Energy-Efficient Buildings 4.5.9. Lighting 4.5.10. External Power Supply for Ships in Port 4.5.11. External Exhaust Treatment
5. Port Policy 32
5.1. Environmental Port Management 5.1.1. The World Port Climate Initiative5.1.2. EcoPorts 5.1.3. GreenPort Congress 5.1.4. ESPO Green Guide 5.2. Emission Reduction Strategies for Ports 5.3. Including Ports in Low-Emission Zones5.4. Economic Instruments 5.4.1. Incentives for Modal Shift 5.4.2. Ecological Port Fees for Cleaner Ships
5.4.3. Environmental Port Index
summary and outlook 36
Annex A: Overview | Actors and Actions Annex B: Glossary Annex C: Contacts
Please note: Institutions marked with an asterisk* can be found in Annex C: Contacts
C o n t e n t
3
Carbon dioxide (CO2) is not a ‘traditional’ air pollutant, but is nevertheless harmful, especially for the climate as a so-called greenhouse gas. The NABU project Clean Air in Ports did not take CO2 into account, instead focusing on ‘traditional’ air pollutants only. Nevertheless, CO2 emissions from ports and ships are enormous and must be reduced. Fortunately, there is a big overlap: many measures aiming to reduce air-polluting emissions in ports also reduce CO2 emissions and vice versa. Actually, most measures aiming to improve energy efficiency, thus reducing energy consumption, will have benefits in terms of CO2 and air pollution. Although emission factors may de-pend on combustion conditions etc., air pollution is often re-lated in one way or another to the use of energy or fuel.
Sulphur dioxide (SO2) emissions arise from the combustion of sulphur-containing fuels; the pollutant can be transported over very long distances by the wind. That is how remote coastal and even hinterland regions get polluted by emissions from shipping and port activities. When SO2 is oxidised into SO4, it forms sulphate aerosols that are classed as secondary particulate matter (PM). SO2 molecules in the atmosphere function as cloud condensation nuclei (CCN) that promote the formation of clouds.
i n the EU, about 420,000 people die prematurely because of poor air quality. According to the World Health Organization (WHO), 95% of Europeans living in urban environments are exposed to levels of air pollution considered dangerous to human health. In port cities,
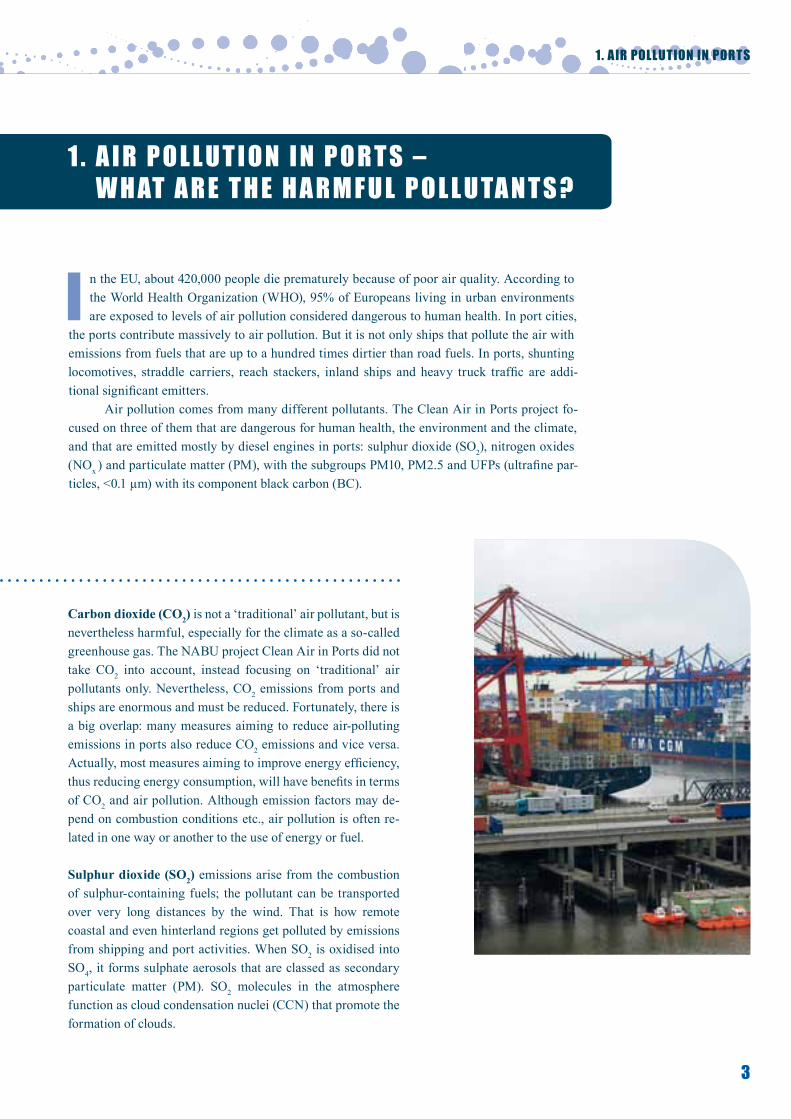
the ports contribute massively to air pollution. But it is not only ships that pollute the air with emissions from fuels that are up to a hundred times dirtier than road fuels. In ports, shunting locomotives, straddle carriers, reach stackers, inland ships and heavy truck traffic are addi-tional significant emitters.
Air pollution comes from many different pollutants. The Clean Air in Ports project fo-cused on three of them that are dangerous for human health, the environment and the climate, and that are emitted mostly by diesel engines in ports: sulphur dioxide (SO2), nitrogen oxides (NOx ) and particulate matter (PM), with the subgroups PM10, PM2.5 and UFPs (ultrafine par-ticles, <0.1 µm) with its component black carbon (BC).
1 . a i r P o l l U t i o n i n P o r t s – W H at a r e t H e H a r M F U l P o l l U ta n t s ?
1. air PollUtion in Ports
4
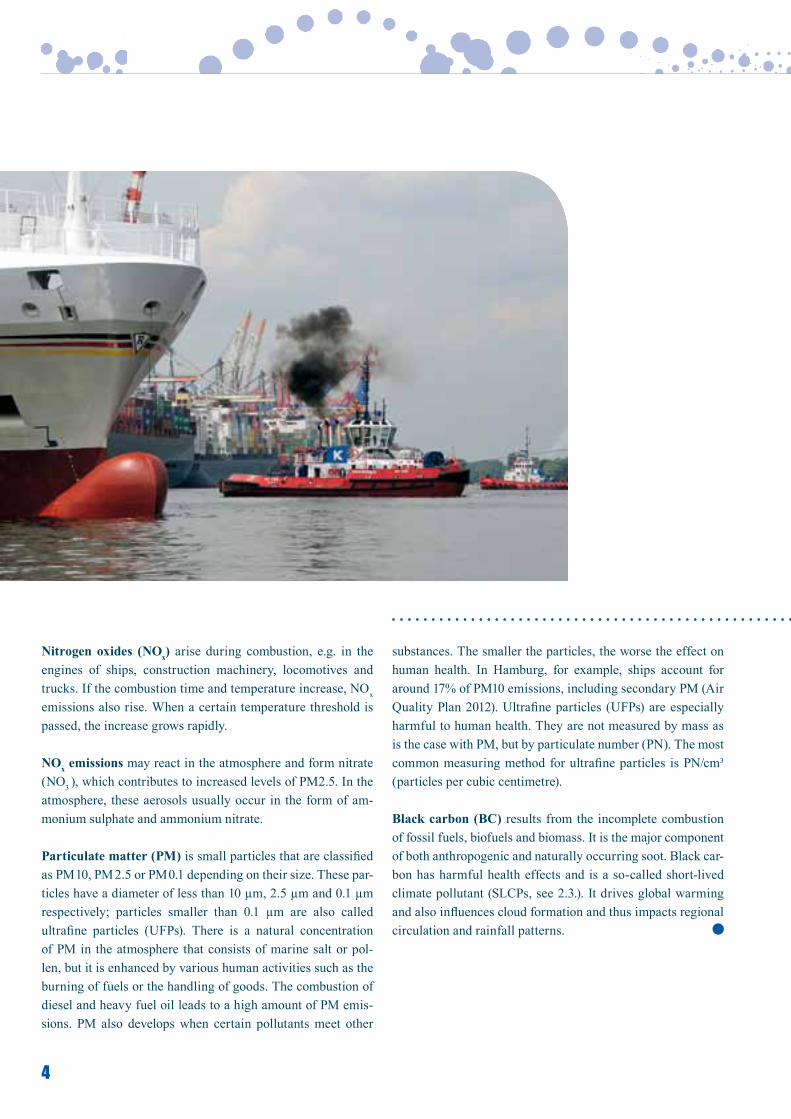
Nitrogen oxides (NOx) arise during combustion, e.g. in the engines of ships, construction machinery, locomotives and trucks. If the combustion time and temperature increase, NOx emissions also rise. When a certain temperature threshold is passed, the increase grows rapidly.
NOx emissions may react in the atmosphere and form nitrate (NO3 ), which contributes to increased levels of PM2.5. In the atmosphere, these aerosols usually occur in the form of am-monium sulphate and ammonium nitrate.
Particulate matter (PM) is small particles that are classified as PM10, PM2.5 or PM0.1 depending on their size. These par-ticles have a diameter of less than 10 µm, 2.5 µm and 0.1 µm respectively; particles smaller than 0.1 µm are also called ultra fine particles (UFPs). There is a natural concentration of PM in the atmosphere that consists of marine salt or pol-len, but it is enhanced by various human activities such as the burning of fuels or the handling of goods. The combustion of diesel and heavy fuel oil leads to a high amount of PM emis-sions. PM also develops when certain pollutants meet other
2 . e F F e C t s o F a i r P o l l U t i o n
substances. The smaller the particles, the worse the effect on human health. In Hamburg, for example, ships account for around 17% of PM10 emissions, including secondary PM (Air Quality Plan 2012). Ultrafine particles (UFPs) are especially harmful to human health. They are not measured by mass as is the case with PM, but by particulate number (PN). The most common measuring method for ultrafine particles is PN/cm³ (particles per cubic centimetre).
Black carbon (BC) results from the incomplete combustion of fossil fuels, biofuels and biomass. It is the major component of both anthropogenic and naturally occurring soot. Black car-bon has harmful health effects and is a so-called short-lived climate pollutant (SLCPs, see 2.3.). It drives global warming and also influences cloud formation and thus impacts regional circulation and rainfall patterns.
5
2.1. Health effects of air PollutionEmissions from diesel engines contribute greatly to the large number of people who fall ill or even die prematurely because of air pollution: in June 2012, the World Health Organization (WHO) published a report that classified diesel exhausts as being as carcinogenic as asbestos.3 The International Agency for Research on Cancer (IARC) has likewise classified diesel exhaust particles as a human carcinogen.4
Emissions of sulphur dioxide (SO2) are respiratory irritants and are thought to be partly responsible for increased mortality rates in, for example, the coastal areas of North America and Europe (Corbett et al. 2007).5 The main reason why both SO2 and NOx contribute to morbidity and premature mortality is because of the impacts of (secondary) PM, at least according to the studies and modelling carried out so far.
NOx emissions diminish the function of the lungs and increase the risk of cardiovascular disease. NOx is also a precursor of ground-level ozone (O3, also known as tropospheric ozone), a powerful greenhouse gas which is likewise detrimental to human health. O3 can cause irritation and inflammation of the respiratory system, headaches, an impairment of physical abil-ity and an increase in the frequency of asthma attacks. High concentrations of ground-level ozone in cities – known as summer smog – are responsible for the death of elderly people and people with poor health conditions.
PM emissions are correlated with more frequent asthma attacks, cardiac arrests, chronic bronchitis and lung cancer. It is assumed that children get more infections of the middle ear with increased PM exposure. In general, morbidity and mortality in-
crease with higher ambient PM. The smaller the particles, the deeper they get into the lungs, where they cause more serious consequences. According to the European Environment Agency (EEA), almost five million lost life years could be attributed to exposure to PM2.5 in 32 European countries in 2005.6
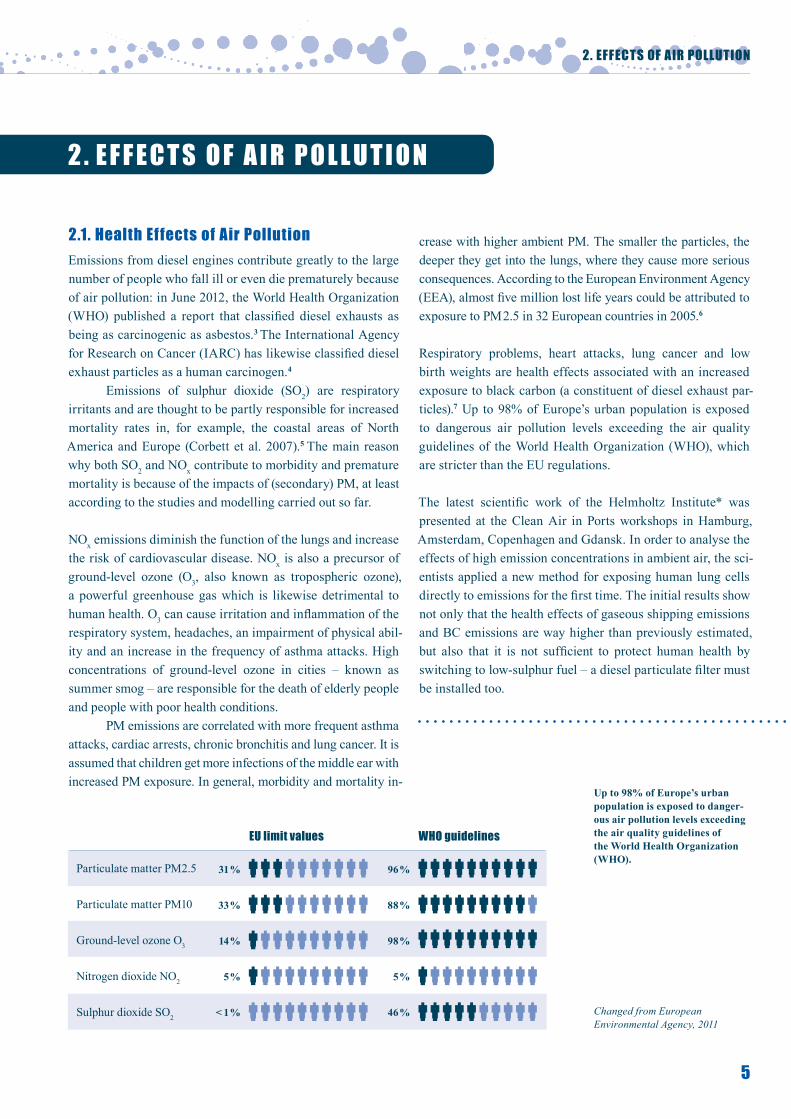
Respiratory problems, heart attacks, lung cancer and low birth weights are health effects associated with an increased exposure to black carbon (a constituent of diesel exhaust par-ticles).7 Up to 98% of Europe’s urban population is exposed to dangerous air pollution levels exceeding the air quality guidelines of the World Health Organization (WHO), which are stricter than the EU regulations.
The latest scientific work of the Helmholtz Institute* was presented at the Clean Air in Ports workshops in Hamburg, Amsterdam, Copenhagen and Gdansk. In order to analyse the effects of high emission concentrations in ambient air, the sci-entists applied a new method for exposing human lung cells directly to emissions for the first time. The initial results show not only that the health effects of gaseous shipping emissions and BC emissions are way higher than previously estimated, but also that it is not sufficient to protect human health by switching to low-sulphur fuel – a diesel particulate filter must be installed too.
2 . e F F e C t s o F a i r P o l l U t i o n
Changed from European Environmental Agency, 2011
Up to 98% of Europe’s urban population is exposed to danger-ous air pollution levels exceeding the air quality guidelines of the World Health Organization (WHO).
WHo guidelines
Particulate matter PM2.5
Particulate matter PM10
Ground-level ozone O3
Nitrogen dioxide NO2
Sulphur dioxide SO2
eU limit values
31 %
33 %
14 %
5 %
< 1 %
96 %
88 %
98 %
5 %
46 %
2. eFFeCts oF air PollUtion
6
2.2. environmental Damage Caused by air Pollution
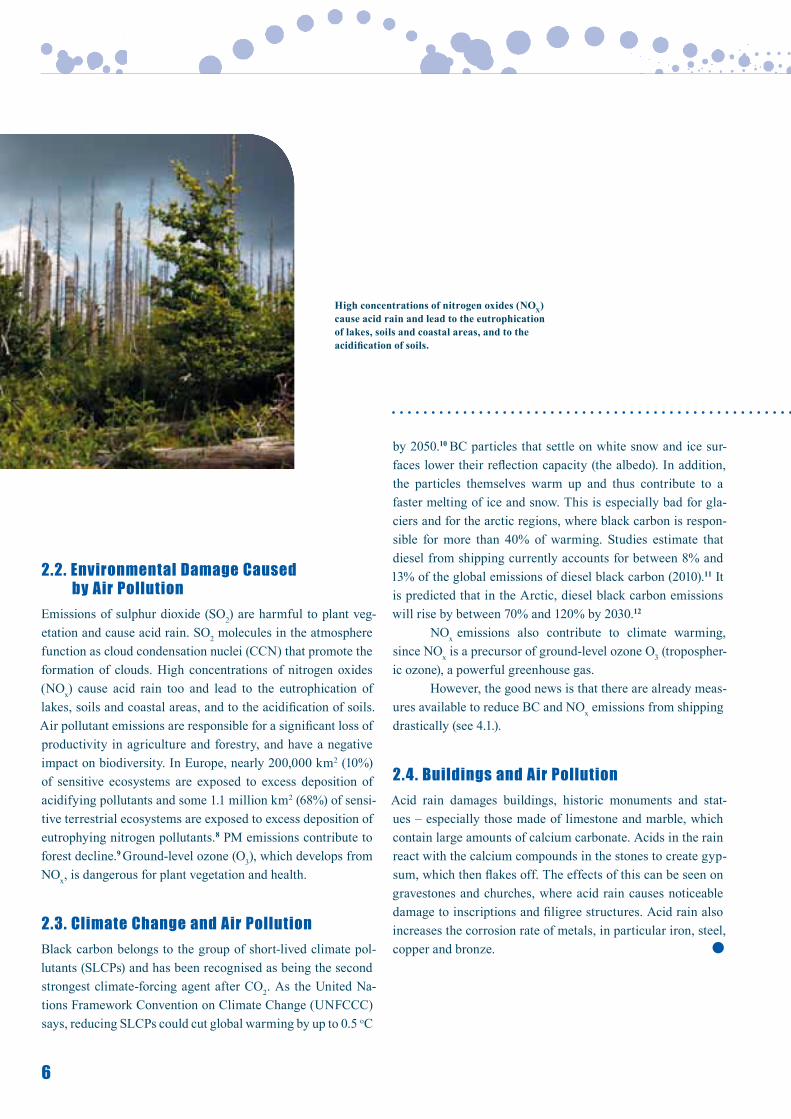
Emissions of sulphur dioxide (SO2) are harmful to plant veg-etation and cause acid rain. SO2 molecules in the atmosphere function as cloud condensation nuclei (CCN) that promote the formation of clouds. High concentrations of nitrogen oxides (NOx) cause acid rain too and lead to the eutrophication of lakes, soils and coastal areas, and to the acidification of soils. Air pollutant emissions are responsible for a significant loss of productivity in agriculture and forestry, and have a negative impact on biodiversity. In Europe, nearly 200,000 km2 (10%) of sensitive ecosystems are exposed to excess deposition of acidifying pollutants and some 1.1 million km2 (68%) of sensi-tive terrestrial ecosystems are exposed to excess deposition of eutrophying nitrogen pollutants.8 PM emissions contribute to forest decline.9 Ground-level ozone (O3 ), which develops from NOx, is dangerous for plant vegetation and health.
2.3. Climate Change and air Pollution Black carbon belongs to the group of short-lived climate pol-lutants (SLCPs) and has been recognised as being the second strongest climate-forcing agent after CO2. As the United Na-tions Framework Convention on Climate Change (UNFCCC) says, reducing SLCPs could cut global warming by up to 0.5 oC
by 2050.10 BC particles that settle on white snow and ice sur-faces lower their reflection capacity (the albedo). In addition, the particles themselves warm up and thus contribute to a faster melting of ice and snow. This is especially bad for gla-ciers and for the arctic regions, where black carbon is respon-sible for more than 40% of warming. Studies estimate that diesel from shipping currently accounts for between 8% and 13% of the global emissions of diesel black carbon (2010).11 It is predicted that in the Arctic, diesel black carbon emissions will rise by between 70% and 120% by 2030.12
NOx emissions also contribute to climate warming, since NOx is a precursor of ground-level ozone O3 (tropospher-ic ozone), a powerful greenhouse gas.
However, the good news is that there are already meas-ures available to reduce BC and NOx emissions from shipping drastically (see 4.1.).
2.4. Buildings and air PollutionAcid rain damages buildings, historic monuments and stat-ues – especially those made of limestone and marble, which contain large amounts of calcium carbonate. Acids in the rain react with the calcium compounds in the stones to create gyp-sum, which then flakes off. The effects of this can be seen on gravestones and churches, where acid rain causes noticeable damage to inscriptions and filigree structures. Acid rain also increases the corrosion rate of metals, in particular iron, steel, copper and bronze.
3 . e M i s s i o n s i n P o r t s
High concentrations of nitrogen oxides (NOX) cause acid rain and lead to the eutrophication of lakes, soils and coastal areas, and to the acidification of soils.
7
3.1. Who are the emitters in Ports?There are several sources of air pollution in ports and in every port the various emitters contribute to the pollution to a dif-ferent extent. The Clean Air in Ports project focuses on the emitters of PM, SO2 and NOx that belong to immediate port business: ships (seagoing and inland vessels), non-road mobile machinery (NRMM) such as straddle carriers, reach stackers, automated guided vehicles (AGVs), rubber-tyred gantry cranes (RTGs) and construction machinery, trucks, trains, conveyor vehicles and cars. Most of these engines are diesel-powered and the burning of diesel causes a lot of PM, SO2 and NOx emissions, especially if the exhaust is not treated. The Clean Air in Ports project does not deal with other emission sources such as from dry bulk handling or industrial sites. Depending on the port in question, these sources could be industrial sites such as power plants, refineries and metal production plants that have a significant impact on air emissions in the vicinity. These emissions are not addressed within this paper.
The following passages present regulations for the air pollutants and possible measures for cleaning up the emissions from the different sources, followed by overall port strategies and policy instruments. 3.2. How Much Do Ports emit? As mentioned above, the amount of air pollution from a port de-pends on its size, the number of diesel engines running and the actual regulations in place. No two ports are alike. Some ports
3 . e M i s s i o n s i n P o r t s
try to estimate how much air pollution they cause and in which proportions in order to set up a plan to reduce air pollution.
With an ‘emission inventory’ as a first step, specifically determined emissions of a port such as NOx, SO2, VOC, PM10 and PM2.5 are calculated and attributed to different sources such as ocean-going vessels, harbour vessels, cargo handling equipment, locomotives and vehicles. An inventory provides a baseline from which mitigation strategies can be created, de-veloped and implemented, and on the basis of which the per-formance and success of the port in reducing its emissions can be tracked over time. Emission inventories have been issued for several American ports such as Corpus Christi, Beaumont/Port Arthur, Houston/Galveston, Los Angeles*, Long Beach, Oakland*, New York/New Jersey and Portland by consulting companies such as Starcrest*, Environ, ACES and Bridgewater that also consult other major ports worldwide.
At the workshop in Gdansk, two projects presented how they conduct air emission measurements and inventories: the Polish ARMAAG Foundation* runs air pollution measure-ment stations in the area of the ‘tricity’ Gdansk, Sopot and Gdynia. They found out that the ports in Gdynia and Gdansk contribute 9.7% and 7.3% respectively to the air pollution in the region of the three cities.
The Antwerp Port Authority (APA)* has conducted an emission modelling project for ocean-going vessels as part of the INTERREG-subsidised project Clean North Sea Shipping (CNSS) (see 5.2.) in order to get a more accurate view of ship emissions.
3. eMissions in Ports
8
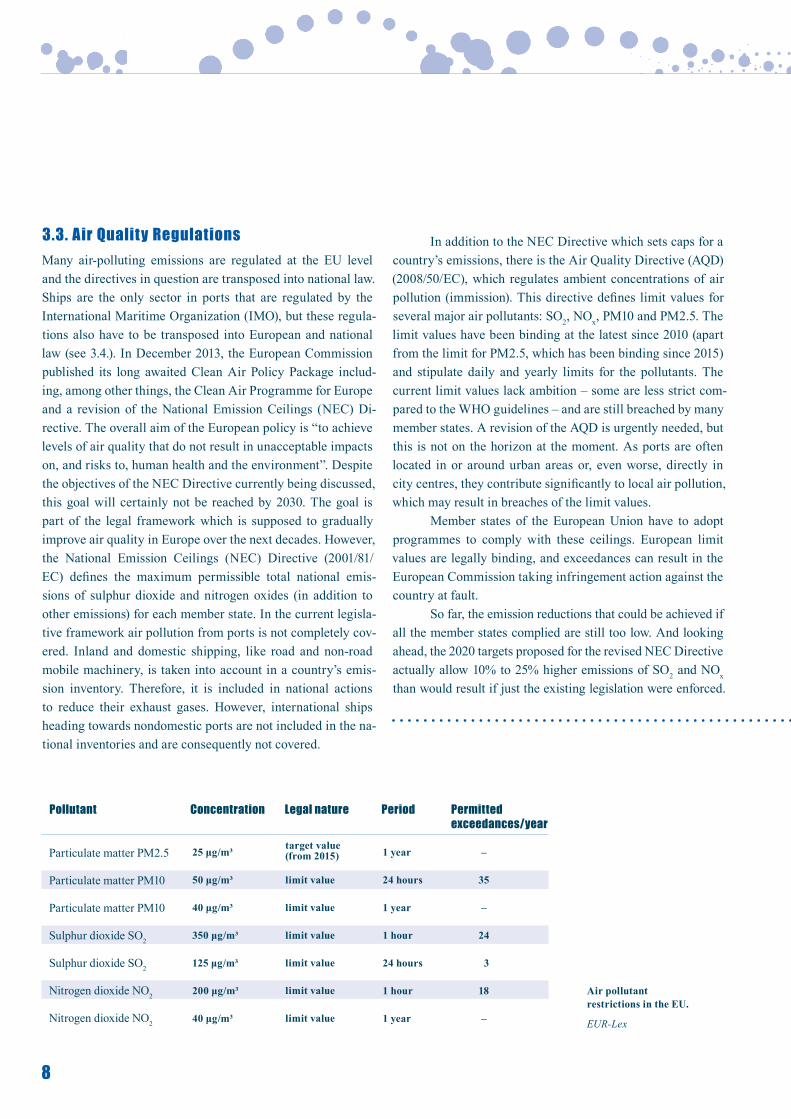
3.3. air Quality regulationsMany air-polluting emissions are regulated at the EU level and the directives in question are transposed into national law. Ships are the only sector in ports that are regulated by the International Maritime Organization (IMO), but these regula-tions also have to be transposed into European and national law (see 3.4.). In December 2013, the European Commission published its long awaited Clean Air Policy Package includ-ing, among other things, the Clean Air Programme for Europe and a revision of the National Emission Ceilings (NEC) Di-rective. The overall aim of the European policy is “to achieve levels of air quality that do not result in unacceptable impacts on, and risks to, human health and the environment”. Despite the objectives of the NEC Directive currently being discussed, this goal will certainly not be reached by 2030. The goal is part of the legal framework which is supposed to gradually improve air quality in Europe over the next decades. However, the National Emission Ceilings (NEC) Directive (2001/81/EC) defines the maximum permissible total national emis-sions of sulphur dioxide and nitrogen oxides (in addition to other emissions) for each member state. In the current legisla-tive framework air pollution from ports is not completely cov-ered. Inland and domestic shipping, like road and non-road mobile machinery, is taken into account in a country’s emis-sion inventory. Therefore, it is included in national actions to reduce their exhaust gases. However, international ships heading towards nondomestic ports are not included in the na-tional inventories and are consequently not covered.
In addition to the NEC Directive which sets caps for a country’s emissions, there is the Air Quality Directive (AQD) (2008/50/EC), which regulates ambient concentrations of air pollution (immission). This directive defines limit values for several major air pollutants: SO2, NOx, PM10 and PM2.5. The limit values have been binding at the latest since 2010 (apart from the limit for PM2.5, which has been binding since 2015) and stipulate daily and yearly limits for the pollutants. The current limit values lack ambition – some are less strict com-pared to the WHO guidelines – and are still breached by many member states. A revision of the AQD is urgently needed, but this is not on the horizon at the moment. As ports are often located in or around urban areas or, even worse, directly in city centres, they contribute significantly to local air pollution, which may result in breaches of the limit values.
Member states of the European Union have to adopt programmes to comply with these ceilings. European limit values are legally binding, and exceedances can result in the European Commission taking infringement action against the country at fault.
So far, the emission reductions that could be achieved if all the member states complied are still too low. And looking ahead, the 2020 targets proposed for the revised NEC Directive actually allow 10% to 25% higher emissions of SO2 and NOx than would result if just the existing legislation were enforced.
Air pollutant restrictions in the EU.
EUR-Lex
Particulate matter PM2.5
Particulate matter PM10
Particulate matter PM10
Sulphur dioxide SO2
Sulphur dioxide SO2
Nitrogen dioxide NO2
Nitrogen dioxide NO2
25 μg/m³
50 μg/m³
40 μg/m³
350 μg/m³
125 μg/m³
200 μg/m³
40 μg/m³
target value (from 2015)
limit value
limit value
limit value
limit value
limit value
limit value
1 year
24 hours
1 year
1 hour
24 hours
1 hour
1 year
–
35
–
24
3
18
–
Pollutant Concentration legal nature Period Permitted exceedances/year
9
BC is not currently included in the NEC Directive, but might be after the current NEC revision. This process is an opportunity to achieve significant air pollution reductions and, as such, to contribute to health, environment and climate protection, but so far the proposals lack ambition. The revision of the NEC Direc-tive has to include black carbon and methane and also ambitious emission reduction goals for 2020, 2025 and 2030. New and strengthened sector legislation is needed which covers all kinds of sources, including shipping, to support the NEC Directive as are measures to ensure compliance and enforcement.
EU air quality standards need to be in line with the WHO’s recommendations (they are currently below them).
“The benefits of taking action far outweigh the costs in every policy scenario put forward by the Commission, yet the Com-mission’s proposal is far from ambitious. Air pollution has high health, economic and environmental costs. To reduce these to a minimum within what is technically feasible would cost €51 bn a year but the health benefits would range between €58–207 bn per year 13. As the EU is, like the US, a strong mar-ket, it could introduce limits earlier or make them stricter than the IMO without having to fear market distortions.
3.4. specific regulations for air Quality in Ports
In addition to the NEC Directive and the AQD, there are a number of other EU directives that set specific emission limit values for the various emitters:
The sulphur emissions of ships are regulated by the so-called Sulphur Directive (2012/33/EU) that transposes in-ternational law from the International Maritime Organization (IMO) into EU law. This also has to be transposed into na-tional law. According to this directive, since 2010, ships must use fuel with a maximum of 0.1% sulphur when at berth at a European port for two hours or more. The directive also al-lows ships to use other technical abatement technologies that achieve the same levels of emission reductions, provided it can be demonstrated that these technologies do not adversely af-fect the marine environment. The abatement technology most often mentioned is the desulphurisation of exhaust gases by means of scrubbing (see 4.1.15.). The EU Sulphur Directive also specifies a maximum sulphur limit of 0.5% as from 2020 in all EU sea areas (except SECAs [see table]).
emission Control areas (eCas)
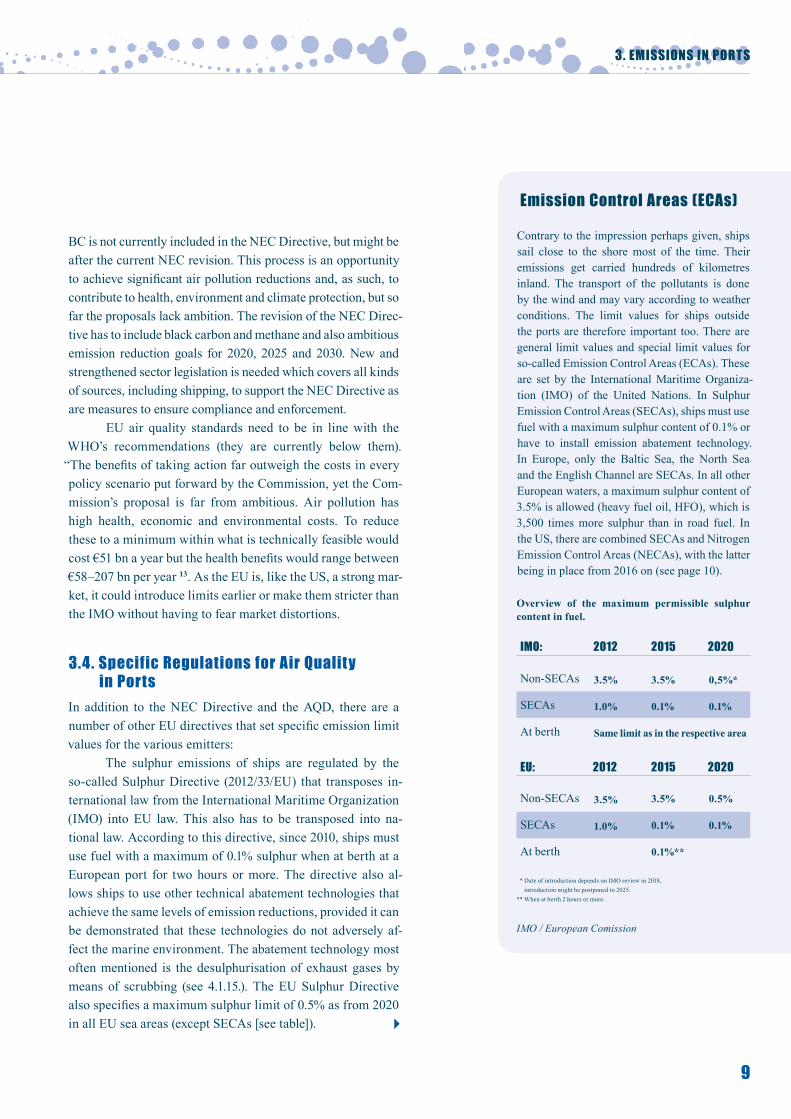
Contrary to the impression perhaps given, ships sail close to the shore most of the time. Their emissions get carried hundreds of kilometres inland. The transport of the pollutants is done by the wind and may vary according to weather conditions. The limit values for ships outside the ports are therefore important too. There are general limit values and special limit values for so-called Emission Control Areas (ECAs). These are set by the International Maritime Organiza-tion (IMO) of the United Nations. In Sulphur Emission Control Areas (SECAs), ships must use fuel with a maximum sulphur content of 0.1% or have to install emission abatement technology. In Europe, only the Baltic Sea, the North Sea and the English Channel are SECAs. In all other European waters, a maximum sulphur content of 3.5% is allowed (heavy fuel oil, HFO), which is 3,500 times more sulphur than in road fuel. In the US, there are combined SECAs and Nitrogen Emission Control Areas (NECAs), with the latter being in place from 2016 on (see page 10).
3. eMissions in Ports
Overview of the maximum permissible sulphur content in fuel.
* Date of introduction depends on IMO review in 2018, introduction might be postponed to 2025.** When at berth 2 hours or more.
IMO / European Comission
iMo: 2012 2015 2020
Non-SECAs
SECAs
At berth
3.5%
1.0%
Same limit as in the respective area
0,5%*
0.1%
3.5%
0.1%
3.5%
1.0%
Non-SECAs
SECAs
At berth
3.5%
0.1%
0.1%**
eU: 2012 2015 2020
0.5%
0.1%
10
There is currently no international or EU legislation lim-iting BC emissions from ships at sea or in ports. The IMO has set limits for NOx emissions from ships, called “Tier I/II/III”. Globally, Tier II limits are in place for new ships since 2011. The stricter Tier III limits apply in NECAs, which will be in place in North American and US Caribbean waters as of 1 January 2016. In order to limit air pollution from international shipping effec-tively, SECAs and NECAs are needed in all European waters. TIER III limits apply to new built ships after a fixed date only, so NOx limits for the existing fleet are needed.
Legally, port equipment, construction machinery, in-land ships and trains are grouped as so-called non-road mobile machinery (NRMM). Directive 2012/46/EU deals with PM, SO2 and NOx (and other) emissions of different NRMM and is under review (as at 2015). A problematic issue is that very dif-ferent limit values apply for the various engine types and that these limits are often too weak. A possible approach would be to align all NRMM values with the EURO norms for cars and trucks. The NRMM Directive also needs to include PN limit values as UFPs are extremely harmful to human health. How-ever, whereas different polluters from inland waterway vessels and other NRMM are regulated by this directive, the only pol-lutant from ocean-going vessels regulated by specific legisla-tion is the sulphur (European Sulphur Directive).
Cars and trucks cause emissions in ports too. Their PM, VOC, SO2 and NOx (as well as CO2) emissions are regulated by Directive 715/2007/EC and Directive 2005/55/EC. At the moment, many diesel cars do not meet NOx limits in real-world driving.
The highest standard for diesel cars and trucks that even include PN, the so-called EURO 6/EURO VI standard, is quite ambitious and has the potential to significantly reduce air pol-lution levels – but only if the required EURO standards are not only met during the official testing procedure, but also on the road. In addition, the limits are not yet in place for gasoline cars – and they will apply only to new vehicles entering the market (in 2017 and 2019). So considering a turnover period of about ten years, many vehicles with high emissions will still be on the (port) roads years after stricter standards have been set.
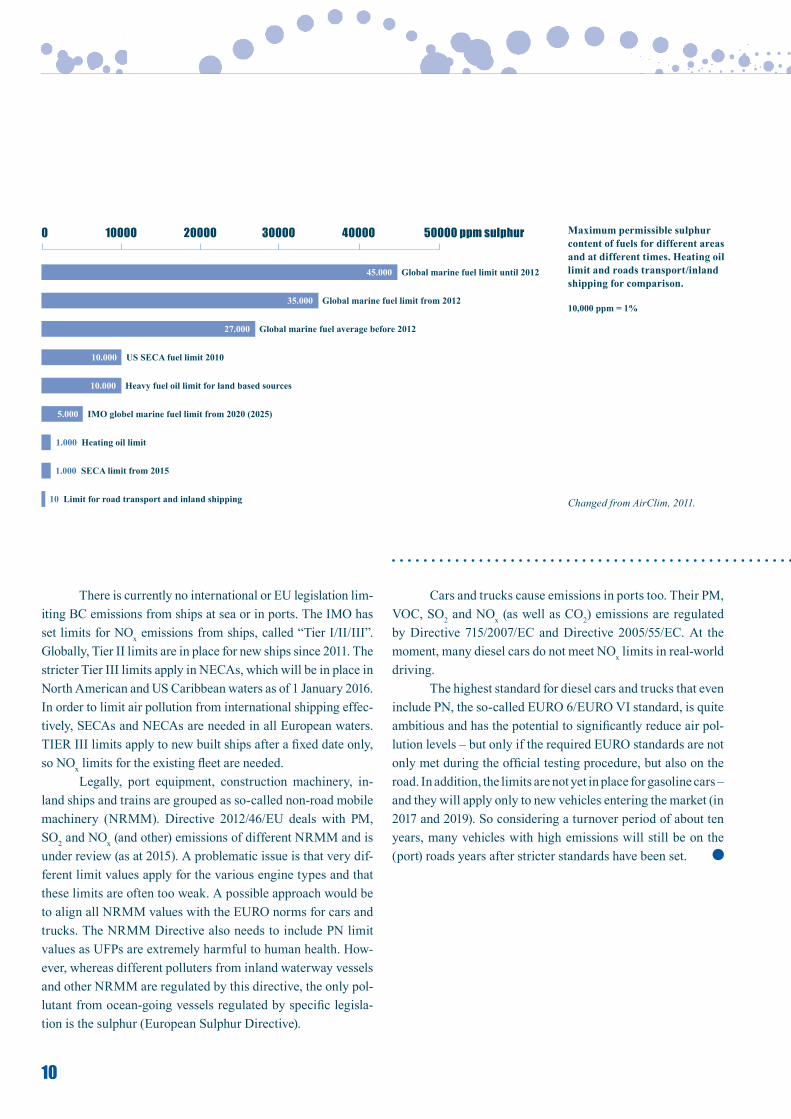
45.000 Global marine fuel limit until 2012
35.000 Global marine fuel limit from 2012
27.000 Global marine fuel average before 2012
10.000 US SECA fuel limit 2010
10.000 Heavy fuel oil limit for land based sources
5.000 IMO globel marine fuel limit from 2020 (2025)
1.000 Heating oil limit
1.000 SECA limit from 2015
10 Limit for road transport and inland shipping
0 10000 20000 30000 40000 50000 ppm sulphur Maximum permissible sulphur content of fuels for different areas and at different times. Heating oil limit and roads transport/inland shipping for comparison.
10,000 ppm = 1%
Changed from AirClim, 2011.
11
4.1. Water transport: inland and ocean-Going Vessels orGanisational MeasUres
4.1.1. eco sailing
Like car drivers, ship sailors can be trained to sail energy ef-ficiently. The training can range from machinery treatment to the inclusion of weather conditions in route or driving deci-sions. Fuel-efficient driving has to be a crucial factor for the crew. Example:
Scandlines* has achieved substantial fuel savings thanks to crew training and the implementation of a fuel ef-ficiency strategy.
4.1.2. slow steaming
Sailing more slowly can save a significant amount of fuel and thus avoid costs and emissions. A study conducted by CE Delft, the The International Council on Clean Transportation (ICCT)* and Mikis Tsimplis 14 shows that an average speed re-duction of 10% results in a 19% reduction in CO2 emissions and assumes that SO2, NOx and probably BC emissions are reduced considerably with the lower consumption of fuel too. It also shows that slow steaming is at least cost-neutral when
done correctly. Taking direct and indirect costs into account, the benefits of slow steaming even outweigh the costs. A port can require ships to slow down when entering the port wa-ters. Outside ports, reduced ship speed contributes to marine safety and is likely to reduce whale strikes and other harmful wildlife interactions. Examples:
The tugboats in the Port of Antwerp* sail more slowly and consequently save 5% to 15% fuel.
The Port of Long Beach and the Port of Los Angeles* respectively have the Green Flag Program and the Vessel Speed Reduction Incentive Program in place. These reward participating ships with a reduced dockage fee of 25% (or 15%) for slowing down to 12 knots or less during 90% of their annual calls when they get as close as 40 NM (or 20 NM) to the port. In 2009, 70% (or 90%) of all ships calling at the Port of Long Beach qualified for the reduction.
4 . e M i s s i o n r e D U C t i o n M e a s U r e s F o r s i n G l e e M i t t e r s
4. eMission reDUCtion MeasUres For sinGle eMitters
12
The California Air Resources Board (ARB) estimated in a study that if all ships were to reduce their speed to 12 knots starting 40 NM outside the port, air pollution would be de-creased: PM by 31%, NOx by 36%, SO2 by 29%. It has to be taken into consideration that most shipowners stated in a sur-vey that they would speed up once they left the 40 NM zone, which would diminish or even undo the effects on air quality. This leads to considerations of having a general speed reduc-tion and/or combining speed reduction in ports with ‘virtual arrival’ (see below).
4.1.3. Virtual arrival (ocean-Going Vessels) At present, some ships still head for a port and when they reach it have to wait until there is a berthing slot available. The con-cept of ‘virtual arrival’ is an option for ships to agree on a de-fined arrival time. Weather conditions and algorithms are used to calculate a notional ‘just in time’ arrival. By introducing this slot system, ships can optimise their operations: they plan their journey and adapt their individual speed to the expected arrival time. Firstly, ‘virtual arrival’ contributes to significantly re-duced (bunker) fuel consumption on a voyage and also a radi-cal reduction in emissions. And secondly, this management can lead to less congestion and more safety in a port.
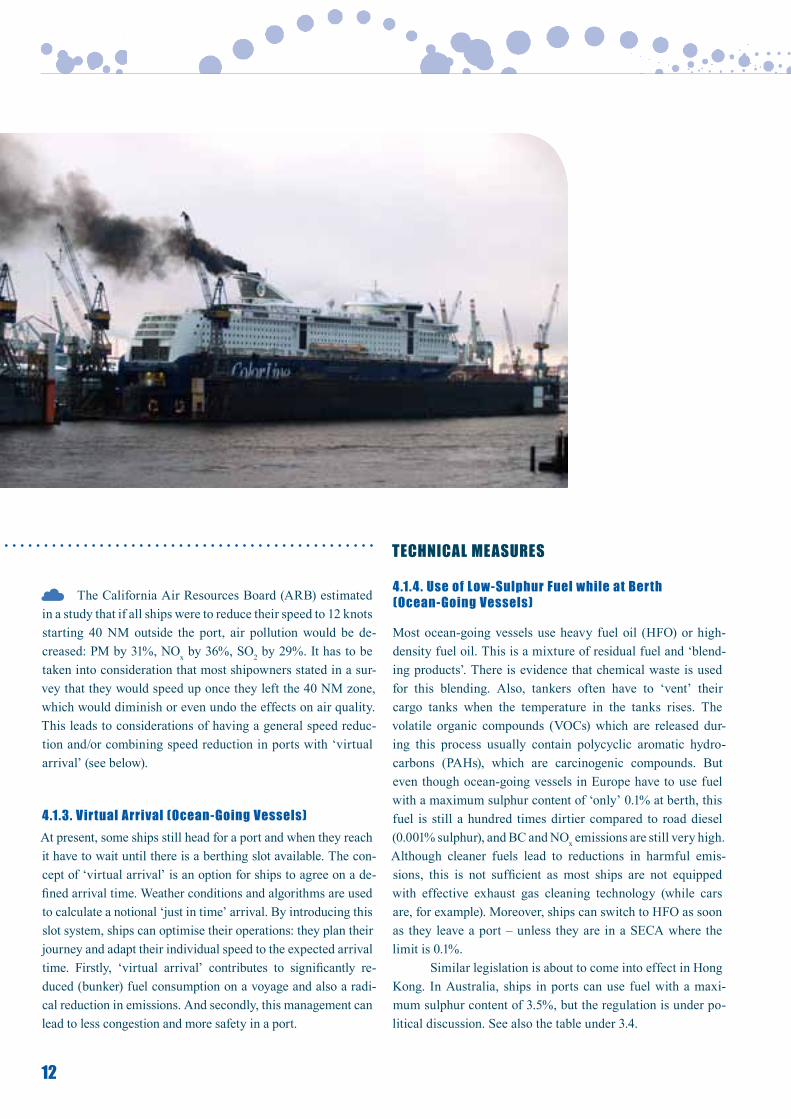
4.1.4. Use of low-sulphur Fuel while at Berth (ocean-Going Vessels)
Most ocean-going vessels use heavy fuel oil (HFO) or high-density fuel oil. This is a mixture of residual fuel and ‘blend-ing products’. There is evidence that chemical waste is used for this blending. Also, tankers often have to ‘vent’ their cargo tanks when the temperature in the tanks rises. The volatile organic compounds (VOCs) which are released dur-ing this process usually contain polycyclic aromatic hydro-carbons (PAHs), which are carcinogenic compounds. But even though ocean-going vessels in Europe have to use fuel with a maximum sulphur content of ‘only’ 0.1% at berth, this fuel is still a hundred times dirtier compared to road diesel (0.001% sulphur), and BC and NOx emissions are still very high. Although cleaner fuels lead to reductions in harmful emis-sions, this is not sufficient as most ships are not equipped with effective exhaust gas cleaning technology (while cars are, for example). Moreover, ships can switch to HFO as soon as they leave a port – unless they are in a SECA where the limit is 0.1%.
Similar legislation is about to come into effect in Hong Kong. In Australia, ships in ports can use fuel with a maxi-mum sulphur content of 3.5%, but the regulation is under po-litical discussion. See also the table under 3.4.
teCHniCal MeasUres
13
4.1.5. Diesel Particulate Filters (DPF)
Diesel particulate filters (DPFs) are exhaust gas treatment sys-tems that significantly reduce PM and BC emissions from die-sel-fuelled vehicles and equipment by up to 99.9%. DPFs typi-cally use a porous ceramic or cordierite substrate or metallic filter to physically trap particulate matter (PM) and remove it from the exhaust stream. DPFs can be coupled with closed crankcase ventilation, selective catalytic reduction (SCR, see 4.1.6.) or lean NOx catalyst technologies for additional emis-sion reductions.
The installation of a DPF can reduce soot emissions from a ship almost completely, especially the UFPs that are not reduced by switching to low-sulphur fuel (LSF). A prereq-uisite for the installation of such a filter is the use of fuel with a maximum sulphur content of 0.5%. Passive filters require operating temperatures high enough to initiate combustion of the collected soot. In addition, filters require periodic main-tenance to clean out non-combustible materials such as ash. For ocean-going vessels, DPFs are ready to use. Some smaller ships in ports (for example tugboats) and inland ships already utilise DPFs. Examples:
In 2011, Mitsui O.S.K. Lines (MOL) started a dem-onstration test of a diesel particulate filter (DPF) system in-stalled on the diesel engine used for power generation on its ocean-going vessel. According to MOL, the self-cleaning DPF jointly developed by the company and Akasaka Diesels was the world’s first application of such a system on an ocean-go-ing vessel. The DPF filters use silicon carbide ceramic fibres and can collect more than 80% of PM produced by the engine.
As the first ocean-going vessel, the German science ship Heincke was equipped with a DPF and an SCR system in 2015. In cooperation with the Alfred Wegener Institute for Polar and Marine Research, the German Federal Ministry of Education and Research gave the order to retrofit its 25-year-old ship Heincke with three new engines with a DPF and an SCR catalyst. The technology reduces black carbon emissions by 99.9%, sulphur emissions by about 90% and nitrogen ox-ides by 70% to 80%.
In 2013, AIDA Cruises announced it would install diesel particulate filters in combination with SCR systems and scrub-bers on its entire fleet, but would continue to burn heavy fuel oil.
4.1.6. selective Catalytic reduction (sCr)
Selective catalytic reduction (SCR) systems convert NOx emis-sions into N2 (nitrogen gas) and water. SCR systems eliminate most of the NOx emissions from a ship’s exhaust fumes (70% to 80%). The fumes need to have a certain temperature for SCR to function. Data logging must be performed to deter-mine whether the exhaust gas temperatures meet the specific SCR system’s requirements. A reductant such as ammonia or urea has to be added to the exhaust gas and is absorbed into the catalyst. Particulate filters (see 4.1.5.) and SCR systems can be combined. Today, more than 500 ocean-going vessels are equipped with an SCR catalyst. Examples:
As the first ocean-going vessel, the German science ship Heincke was equipped with a DPF and an SCR system in 2015 (see 4.1.5. examples).
The Antwerp Port Authority (APA)* has conducted a pilot project with an SCRT (SCR with integrated soot filter) ex-haust gas treatment on the auxiliary engines of a tugboat. As soon as the results of emission measurements prove that the system complies with the EURO V standard (for trucks), the system will be rolled out over the whole of the APA’s tug fleet.
The cruise ship MS Europa 2 (Hapag-Lloyd Cruises), which was launched in 2013, is equipped with an SCR system designed to eliminate 95% of NOx emissions.
4. eMission reDUCtion MeasUres For sinGle eMitters
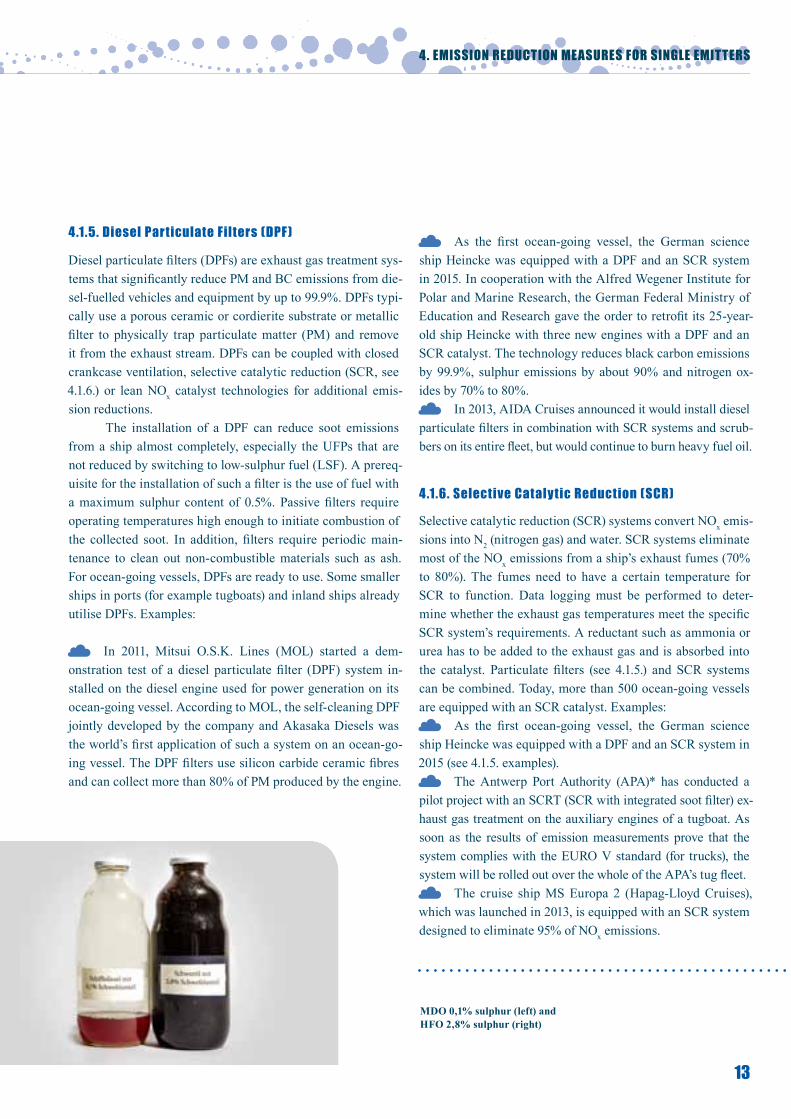
MDO 0,1% sulphur (left) and HFO 2,8% sulphur (right)
14
4.1.7. Fuel Cells
Fuel cells generate energy by means of an electrochemical re-action, commonly between hydrogen and oxygen. They also cause very little noise and zero emissions of sulphur dioxide, nitrogen oxide, particulates and CO2. The only emissions are water vapour and heat. The propulsion power is provided by an electric drive. Fuel cells have high efficiency levels, but the production of hydrogen as a fuel is not yet very energy-efficient. If the electricity for the hydrogen production comes from renewable sources, fuel cells are a zero-emission tech-nology. Fuel cells can easily be combined with all kinds of electric propulsion. They can produce electricity to serve an electric engine or to charge a battery. Fuel cells are used in everything from small forklifts to seagoing ships. Examples:
The 100-passenger ship Alsterwasser in Hamburg uses a hydrogen-oxygen fuel cell. Launched in 2008, it was the world’s first regular-service passenger ship with a fuel cell.
The ocean-going vessel Viking Lady uses a 330 kW molten-carbonate fuel cell that complements the LNG electric propulsion.
FutureShip*, a company of the former Germanischer Lloyd, has developed a concept for Scandlines* that uses fuel cells as the primary source of propulsion in its 150-me-tre ferries. The zero-emission propulsion system will use ex-cess electricity from wind turbines in northern Germany and Denmark to produce the hydrogen for use in the on-board fuel cells to power the electric drives. Excess electricity on board is stored in batteries for peak demand.
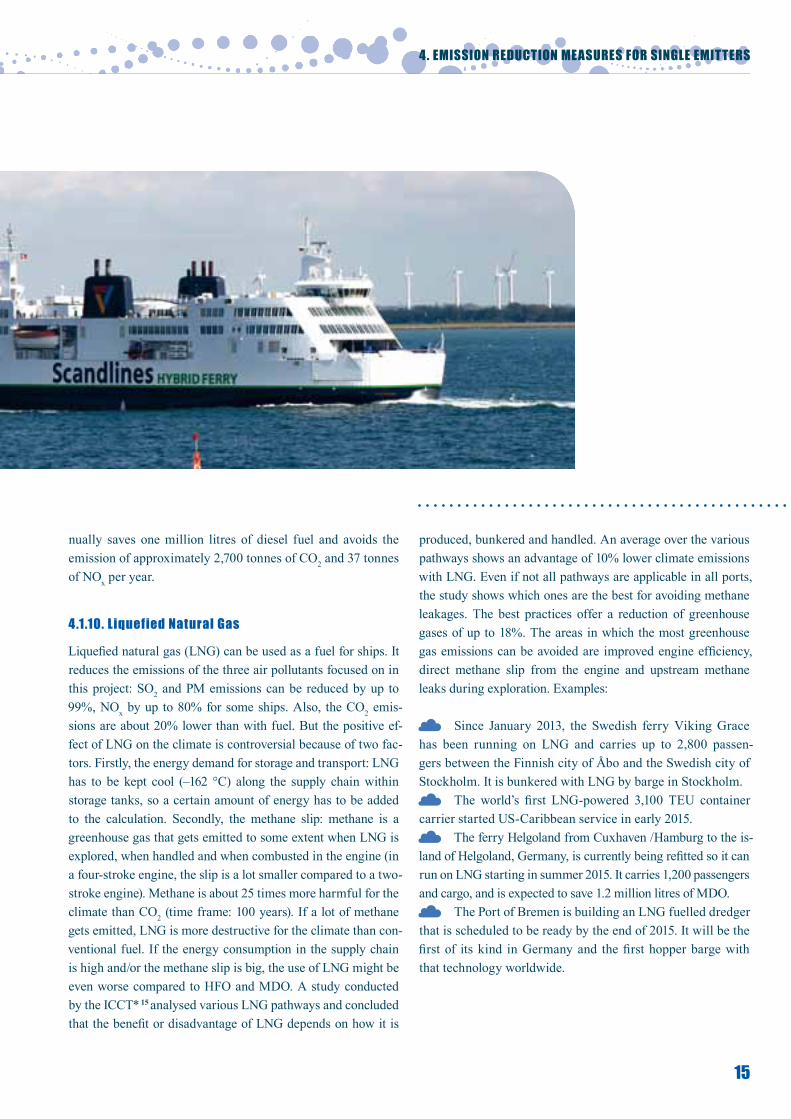
4.1.8. Hybrid ships
‘Hybrid’ means that ships equipped with a diesel- or gas-elec-tric drive have an additional battery. This battery is charged whenever there is excess power generated by the combustion engine or using shoreside electricity. The energy from the bat-teries can be used when the ship is at berth in the harbour, for sailing at low speed or to boost the main engine when there is a high power demand (such as in tugboats). Consequently, the main engine can be smaller and can run on more constant revolutions. This saves fuel and emissions. Examples:
Scandlines* has equipped four ferries with 2.7 MWh batteries. The batteries are charged by the main engine when there is excess energy and provide the electric drive with extra electricity for acceleration. Thereby the main engine can run on constant revolutions per minute (rpm) and can be smaller. This saves fuel and maintenance costs, and also in-creases the lifetime of the engine. The hybrid ferries save 24% fuel and thus reduce CO2 emissions by around 24%. Addition-ally, these ferries are equipped with scrubbers.
The Antwerp Port Authority (APA)* is running a fea-sibility study on the hybrid propulsion of tugboats. The first results are expected in the summer of 2015.
The towing company KOTUG operates three hybrid tugboats that are equipped with batteries. When not towing, the tugs use the electric drive for transit. When more pow-er is needed, diesel generators are started. The batteries are charged by the diesel engine.
4.1.9. ships running on Batteries
Ships equipped with batteries can sail without causing any emissions (if the electricity is generated using renewable sources). Currently, due to the capacity of the batteries, these ships can sail only short distances and need charging capacity in the ports they serve. Batteries with a bigger capacity there-fore need to be developed. Example:
The MS Fjordlys has been in operation on Norway’s Sognefjord since the end of 2014. The 80-metre aluminium cat-amaran runs 100% electric on two electric motors of 450 kW. In the ports, the lithium-ion battery recharges in just ten min-utes. The electricity comes from hydropower. The ferry an-
Financing Cleaner ships
The Norwegian NOx Fund is a programme that came about when Norway introduced a tax on NOx emissions in 2007. Instead of a company paying the tax, an environmental agreement can be signed. In so doing, companies commit to the obligations of the NOx Fund. On the other hand, companies can apply for financial support for their NOx reducing measures.
15
nually saves one million litres of diesel fuel and avoids the emission of approximately 2,700 tonnes of CO2 and 37 tonnes of NOx per year.
4.1.10. liquefied natural Gas
Liquefied natural gas (LNG) can be used as a fuel for ships. It reduces the emissions of the three air pollutants focused on in this project: SO2 and PM emissions can be reduced by up to 99%, NOx by up to 80% for some ships. Also, the CO2 emis-sions are about 20% lower than with fuel. But the positive ef-fect of LNG on the climate is controversial because of two fac-tors. Firstly, the energy demand for storage and transport: LNG has to be kept cool (–162 °C) along the supply chain within storage tanks, so a certain amount of energy has to be added to the calculation. Secondly, the methane slip: methane is a greenhouse gas that gets emitted to some extent when LNG is explored, when handled and when combusted in the engine (in a four-stroke engine, the slip is a lot smaller compared to a two-stroke engine). Methane is about 25 times more harmful for the climate than CO2 (time frame: 100 years). If a lot of methane gets emitted, LNG is more destructive for the climate than con-ventional fuel. If the energy consumption in the supply chain is high and/or the methane slip is big, the use of LNG might be even worse compared to HFO and MDO. A study conducted by the ICCT* 15 analysed various LNG pathways and concluded that the benefit or disadvantage of LNG depends on how it is
produced, bunkered and handled. An average over the various pathways shows an advantage of 10% lower climate emissions with LNG. Even if not all pathways are applicable in all ports, the study shows which ones are the best for avoiding methane leakages. The best practices offer a reduction of greenhouse gases of up to 18%. The areas in which the most greenhouse gas emissions can be avoided are improved engine efficiency, direct methane slip from the engine and upstream methane leaks during exploration. Examples:
Since January 2013, the Swedish ferry Viking Grace has been running on LNG and carries up to 2,800 passen-gers between the Finnish city of Åbo and the Swedish city of Stockholm. It is bunkered with LNG by barge in Stockholm.
The world’s first LNG-powered 3,100 TEU container carrier started US-Caribbean service in early 2015.
The ferry Helgoland from Cuxhaven /Hamburg to the is-land of Helgoland, Germany, is currently being refitted so it can run on LNG starting in summer 2015. It carries 1,200 passengers and cargo, and is expected to save 1.2 million litres of MDO.
The Port of Bremen is building an LNG fuelled dredger that is scheduled to be ready by the end of 2015. It will be the first of its kind in Germany and the first hopper barge with that technology worldwide.
4. eMission reDUCtion MeasUres For sinGle eMitters
16
4.1.12. ships with a Plug for an onshore Power supply
If ships have a plug for an onshore power supply (OPS) (see 4.5.10.), they can use electricity from the shore while at berth and can shut down their engines. After many years of negotia-tions, an international standard for cold ironing was adopted in 2012, making it more attractive for ports and shipowners to invest in this. Many American ports such as the Port of Los Angeles*, the Port of Long Beach and the Port of Oakland* already offer or even demand OPS connectivity for container vessels. OPS options are also offered in some European ports. The challenge for shipowners is the different voltages on the various continents (see 4.5.10). Due to high energy consump-tion, e.g. of cruise ships, onshore power supplies might be a challenge for the local grid. Examples:
The Color Line ferry service between the cities of Kiel, Germany, and Oslo, Norway, has ferries with a plug. The OPS in Oslo was created in 2012, while Kiel will follow in 2015. The ferry operator claims that in Oslo this measure cuts emis-sions by 50 tonnes of NOx, 2.5 tonnes of SO2 and 3,000 tonnes of CO2 each year.
4.1.11. Methanol
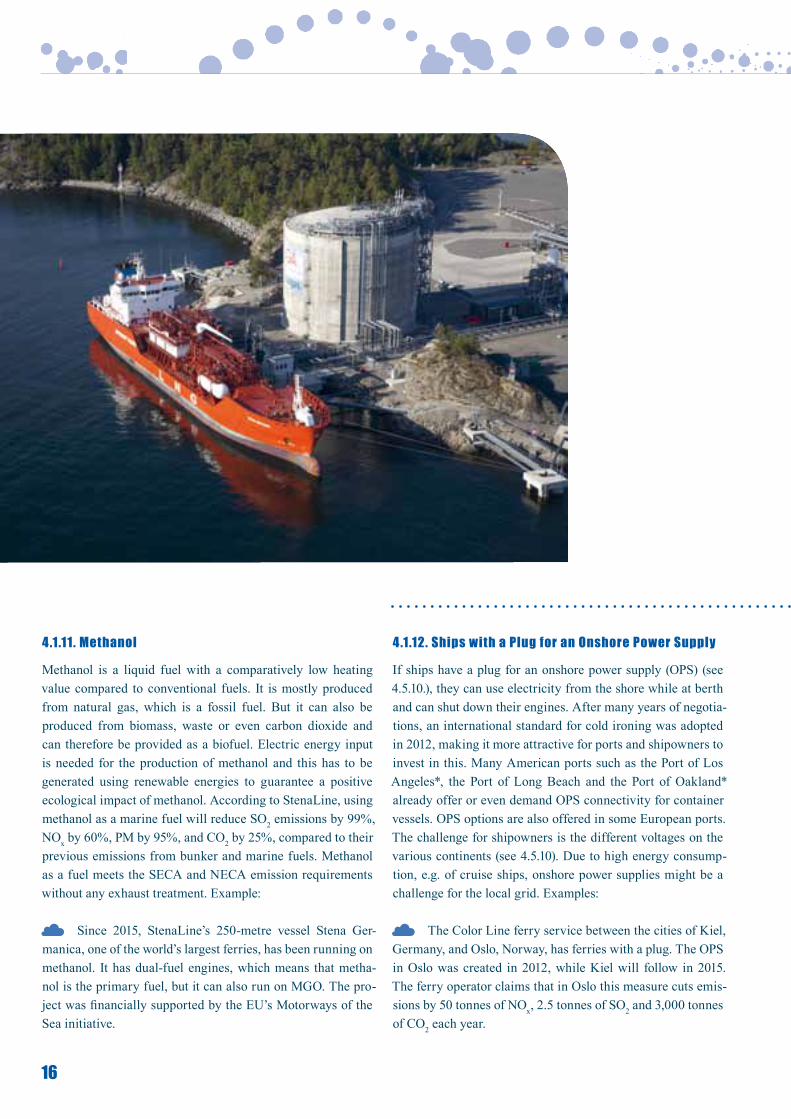
Methanol is a liquid fuel with a comparatively low heating value compared to conventional fuels. It is mostly produced from natural gas, which is a fossil fuel. But it can also be produced from biomass, waste or even carbon dioxide and can therefore be provided as a biofuel. Electric energy input is needed for the production of methanol and this has to be generated using renewable energies to guarantee a positive ecological impact of methanol. According to StenaLine, using methanol as a marine fuel will reduce SO2 emissions by 99%, NOx by 60%, PM by 95%, and CO2 by 25%, compared to their previous emissions from bunker and marine fuels. Methanol as a fuel meets the SECA and NECA emission requirements without any exhaust treatment. Example:
Since 2015, StenaLine’s 250-metre vessel Stena Ger-manica, one of the world’s largest ferries, has been running on methanol. It has dual-fuel engines, which means that metha-nol is the primary fuel, but it can also run on MGO. The pro-ject was financially supported by the EU’s Motorways of the Sea initiative.
17
AIDA Cruises announced it would equip its entire fleet with plugs for OPS that can utilise electricity from the on-shore grid as well as from power barges (see 4.5.10.).
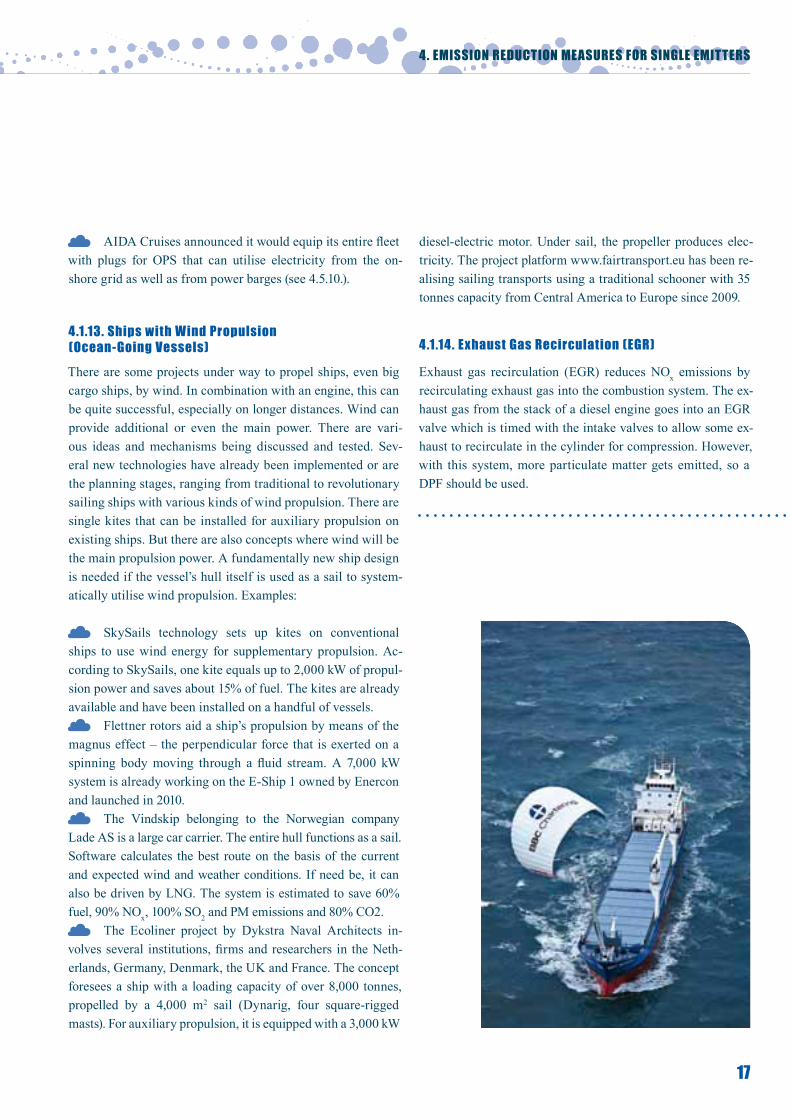
4.1.13. ships with Wind Propulsion (ocean-Going Vessels) There are some projects under way to propel ships, even big cargo ships, by wind. In combination with an engine, this can be quite successful, especially on longer distances. Wind can provide additional or even the main power. There are vari-ous ideas and mechanisms being discussed and tested. Sev-eral new technologies have already been implemented or are the planning stages, ranging from traditional to revolutionary sailing ships with various kinds of wind propulsion. There are single kites that can be installed for auxiliary propulsion on existing ships. But there are also concepts where wind will be the main propulsion power. A fundamentally new ship design is needed if the vessel’s hull itself is used as a sail to system-atically utilise wind propulsion. Examples:
SkySails technology sets up kites on conventional ships to use wind energy for supplementary propulsion. Ac-cording to SkySails, one kite equals up to 2,000 kW of propul-sion power and saves about 15% of fuel. The kites are already available and have been installed on a handful of vessels.
Flettner rotors aid a ship’s propulsion by means of the magnus effect – the perpendicular force that is exerted on a spinning body moving through a fluid stream. A 7,000 kW system is already working on the E-Ship 1 owned by Enercon and launched in 2010.
The Vindskip belonging to the Norwegian company Lade AS is a large car carrier. The entire hull functions as a sail. Software calculates the best route on the basis of the current and expected wind and weather conditions. If need be, it can also be driven by LNG. The system is estimated to save 60% fuel, 90% NOx, 100% SO2 and PM emissions and 80% CO2.
The Ecoliner project by Dykstra Naval Architects in-volves several institutions, firms and researchers in the Neth-erlands, Germany, Denmark, the UK and France. The concept foresees a ship with a loading capacity of over 8,000 tonnes, propelled by a 4,000 m2 sail (Dynarig, four square-rigged masts). For auxiliary propulsion, it is equipped with a 3,000 kW
diesel-electric motor. Under sail, the propeller produces elec-tricity. The project platform www.fairtransport.eu has been re-alising sailing transports using a traditional schooner with 35 tonnes capacity from Central America to Europe since 2009.
4.1.14. exhaust Gas recirculation (eGr)
Exhaust gas recirculation (EGR) reduces NOx emissions by recirculating exhaust gas into the combustion system. The ex-haust gas from the stack of a diesel engine goes into an EGR valve which is timed with the intake valves to allow some ex-haust to recirculate in the cylinder for compression. However, with this system, more particulate matter gets emitted, so a DPF should be used.
4. eMission reDUCtion MeasUres For sinGle eMitters
18
4.1.15. scrubbers (ocean-Going Vessels)
So-called ‘scrubbers’ wash a ship’s exhaust gases in a subse-quent treatment process to remove harmful particles and resi-dues. Scrubbers reduce SO2 emissions by between 70% and 95%, and also lower PM and NOx emissions to some extent. Since they lower the temperature of the exhaust fumes, they cannot be combined with an SCR system (see 4.1.6.) without further energy expenditure. There are different types: open scrubbers, closed-loop scrubbers and hybrid scrubbers that are able to work in both modes. An open-loop scrubber uses seawater which is discharged back into the sea after treatment. A closed-loop scrubber uses fresh water added with caustic soda that is reprocessed on board.
In both cases, so-called ‘sludge’ which is classified as hazardous waste is produced, which has to be carried on board and further processed on land. Sludge contains toxic sub-stances such as heavy metals, metalloids, polycyclic aromatic hydrocarbons (PAHs), polychlorinated diphenyls (PCBs) and oil hydrocarbonates. Currently, there is uncertainty about the handling of the waste on land as well as about the assessment of scrubber water discharge. There is no legal standard, but in several ports and coastal areas the operation of open-loop system is already forbidden in order to protect the marine en-vironment (as at 2015). Moreover, there is no sufficient surveil-lance system that guarantees the proper disposal of scrubber waste. In addition, there is a risk that scrubbers may be turned off intentionally since they cause additional energy consump-tion costs and produce waste that has to be disposed on land.
However, about 80 ships worldwide, most of them fer-ries or cruise ships, operate with open-loop or hybrid scrubbers in order to comply with the sulphur regulations in SECAs.
A study by the renowned Dutch research institute CE Delft (2015)16 showed with case studies that there are only a few business cases in which a scrubber is cheaper than a switch
to low-sulphur fuel. The study takes into account the costs of retrofitting old ships or equipping new ones with scrubbers as well as ongoing maintenance costs and waste disposal fees. Instead of scrubbing, the more environmentally friendly ap-proach for a ship is to install DPFs and SCR systems (see 4.1.5. and 4.1.6.) combined with a switch to MDO or to other types of less polluting fuels (e.g. LNG), also for the benefit of health and the climate. The combination of environmental concerns and the doubtful business case make scrubber a highly ques-tionable technology.
One main problem is that the IMO did not assess the environmental impact of scrubbers on the marine environ-ment before declaring them a proper ‘solution’ in order to comply with the existing sulphur limits: the CE delft study on the environmental and economic impact of scrubbers in-dicates that harmful substances stemming from scrubber dis-charge water are very likely to cause problems in the sensitive ecosystems of the oceans, especially along highly frequented shipping routes and in estuaries. In fact, from an environmen-tal point of view, scrubbers are not a solution for the shipping industry’s massive air pollution problem at all, as they only shift the issue from the air into the water.17 Moreover, the uti-lisation of scrubbers prolongs the usage of heavy fuel with all its environmental dangers including the enormous ecological impacts in case of accidents and spills.
19
4.2. road transport
orGanisational MeasUres
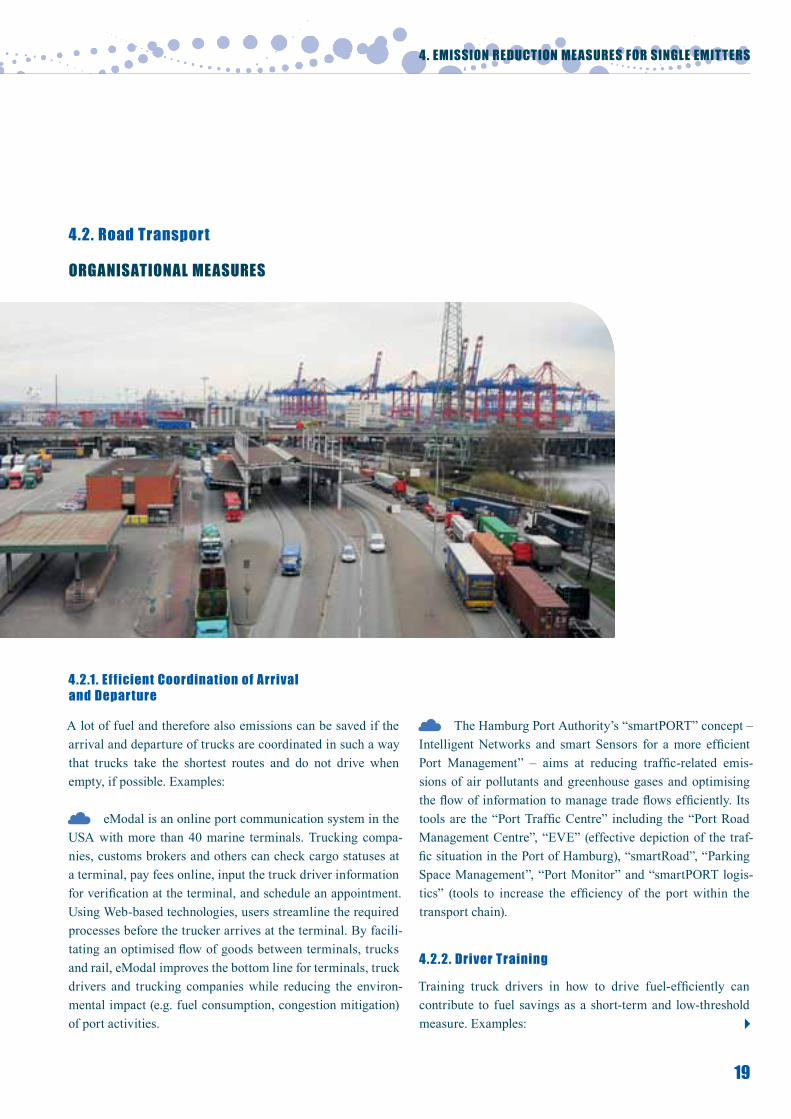
The Hamburg Port Authority’s “smartPORT” concept – Intelligent Networks and smart Sensors for a more efficient Port Management” – aims at reducing traffic-related emis-sions of air pollutants and greenhouse gases and optimising the flow of information to manage trade flows efficiently. Its tools are the “Port Traffic Centre” including the “Port Road Management Centre”, “EVE” (effective depiction of the traf-fic situation in the Port of Hamburg), “smartRoad”, “Parking Space Management”, “Port Monitor” and “smartPORT logis-tics” (tools to increase the efficiency of the port within the transport chain).
4.2.2. Driver training
Training truck drivers in how to drive fuel-efficiently can contribute to fuel savings as a short-term and low-threshold measure. Examples:
4. eMission reDUCtion MeasUres For sinGle eMitters
4.2.1. efficient Coordination of arrival and Departure
A lot of fuel and therefore also emissions can be saved if the arrival and departure of trucks are coordinated in such a way that trucks take the shortest routes and do not drive when empty, if possible. Examples:
eModal is an online port communication system in the USA with more than 40 marine terminals. Trucking compa-nies, customs brokers and others can check cargo statuses at a terminal, pay fees online, input the truck driver information for verification at the terminal, and schedule an appointment. Using Web-based technologies, users streamline the required processes before the trucker arrives at the terminal. By facili-tating an optimised flow of goods between terminals, trucks and rail, eModal improves the bottom line for terminals, truck drivers and trucking companies while reducing the environ-mental impact (e.g. fuel consumption, congestion mitigation) of port activities.
20
Eurogate* recorded a saving of around 7% in fuel con-sumption after truck driver training.
In cooperation with Volkswagen, NABU* frequently offers training sessions for car and truck drivers.
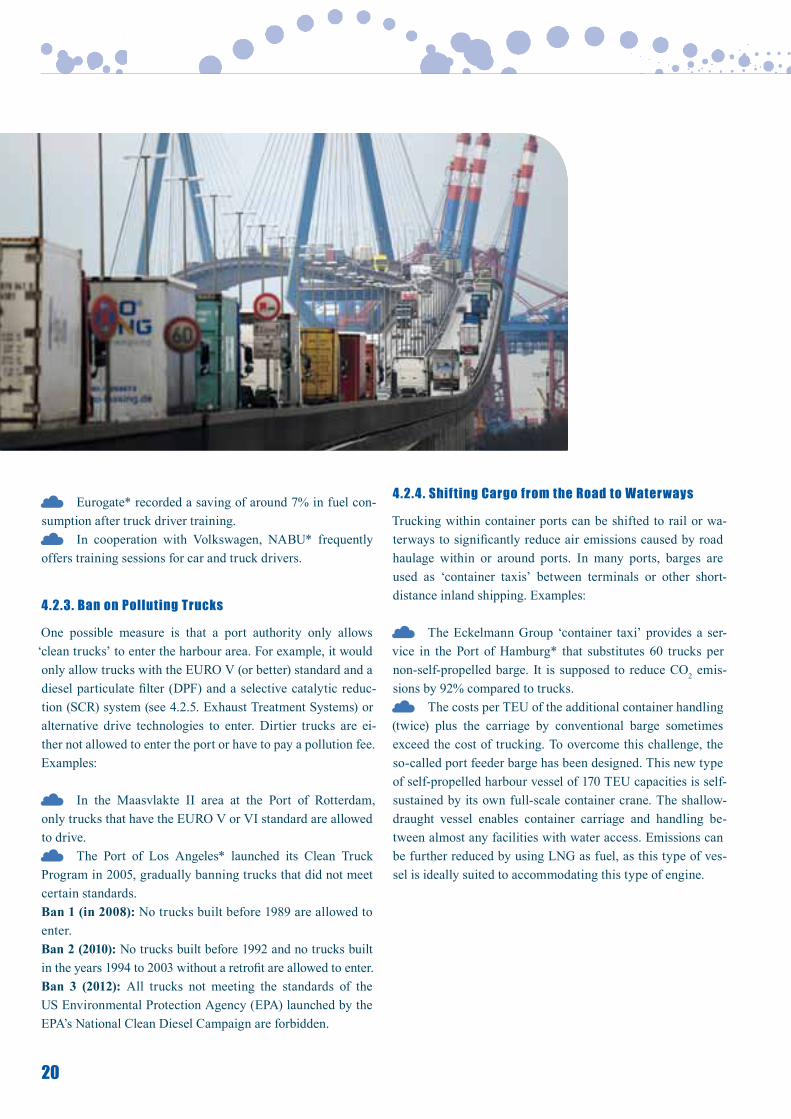
4.2.3. Ban on Polluting trucks
One possible measure is that a port authority only allows ‘clean trucks’ to enter the harbour area. For example, it would only allow trucks with the EURO V (or better) standard and a diesel particulate filter (DPF) and a selective catalytic reduc-tion (SCR) system (see 4.2.5. Exhaust Treatment Systems) or alternative drive technologies to enter. Dirtier trucks are ei-ther not allowed to enter the port or have to pay a pollution fee. Examples:
In the Maasvlakte II area at the Port of Rotterdam, only trucks that have the EURO V or VI standard are allowed to drive.
The Port of Los Angeles* launched its Clean Truck Program in 2005, gradually banning trucks that did not meet certain standards. Ban 1 (in 2008): No trucks built before 1989 are allowed to enter. Ban 2 (2010): No trucks built before 1992 and no trucks built in the years 1994 to 2003 without a retrofit are allowed to enter. Ban 3 (2012): All trucks not meeting the standards of the US Environmental Protection Agency (EPA) launched by the EPA’s National Clean Diesel Campaign are forbidden.
4.2.4. shifting Cargo from the road to Waterways
Trucking within container ports can be shifted to rail or wa-terways to significantly reduce air emissions caused by road haulage within or around ports. In many ports, barges are used as ‘container taxis’ between terminals or other short-distance inland shipping. Examples:
The Eckelmann Group ‘container taxi’ provides a ser-vice in the Port of Hamburg* that substitutes 60 trucks per non-self-propelled barge. It is supposed to reduce CO2 emis-sions by 92% compared to trucks.
The costs per TEU of the additional container handling (twice) plus the carriage by conventional barge sometimes exceed the cost of trucking. To overcome this challenge, the so-called port feeder barge has been designed. This new type of self-propelled harbour vessel of 170 TEU capacities is self-sustained by its own full-scale container crane. The shallow-draught vessel enables container carriage and handling be-tween almost any facilities with water access. Emissions can be further reduced by using LNG as fuel, as this type of ves-sel is ideally suited to accommodating this type of engine.
21
teCHniCal MeasUres
4.2.5. exhaust treatment systems
[Please refer to 4.1.5. and 4.1.6. for a description of diesel par-ticulate filters (DPFs) and selective catalytic reduction (SCR) systems]. Most trucks have a diesel engine that causes high soot emissions. Due to their bigger size and their larger en-gines, their soot emissions are up to 30% higher (per km) than those from cars. Trucks can be retrofitted with particulate fil-ters, and the technology for this is on the market, but EU regu-lations do not currently require (retro)fitting. Only trucks built from 2013 onwards have to have a particulate filter.
Trucks also cause high NOx emissions. However, since the current EURO VI standard entered into force in 2014, NOx emissions are expected to come down over the next years – as long as the limits are reproduced on the road and not only in the laboratory. Currently, there is a large deviation between measured results on the test bench and on the road.
produced as a biofuel by fermenting biomass. The availability of an alternative fuelling infrastructure is the key to this task. Examples:
With its Clean Truck Program, the Port of Los Angeles*encourages concessionaires to buy new LNG trucks with a funding and an incentive programme.
The vehicles at the Eurogate* terminal in Bremer haven run on LPG and test vehicles run on natural gas.
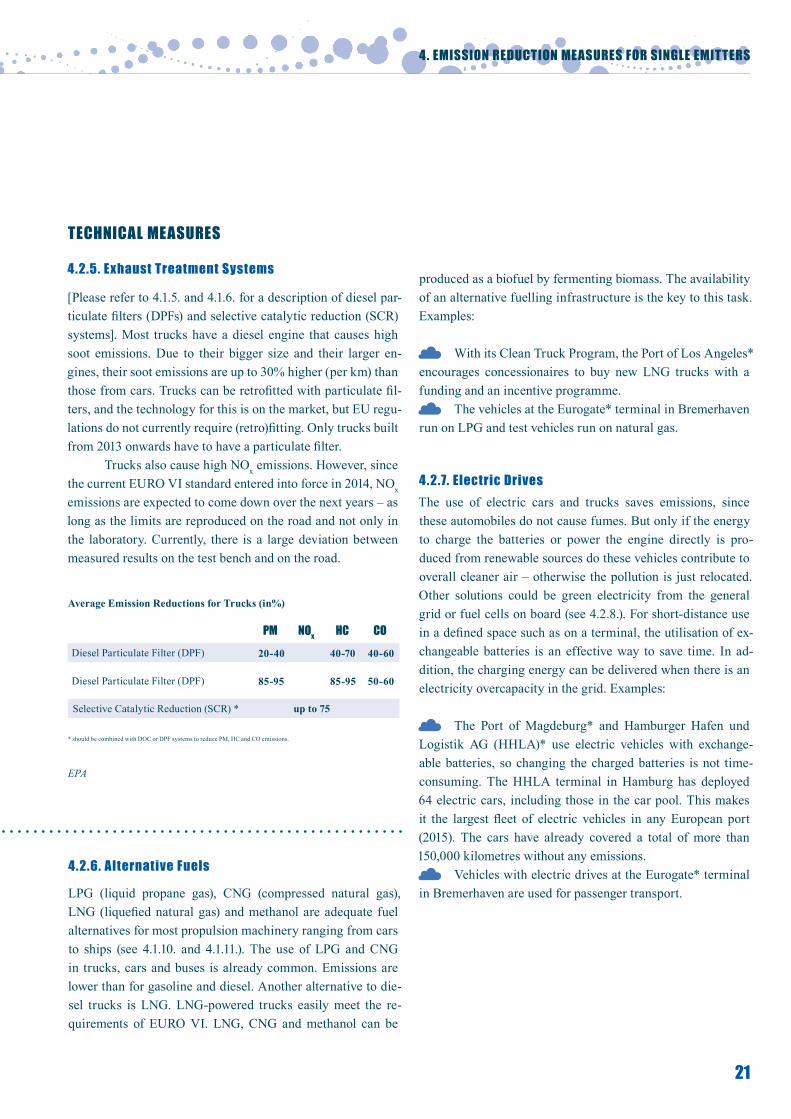
4.2.7. electric Drives The use of electric cars and trucks saves emissions, since these automobiles do not cause fumes. But only if the energy to charge the batteries or power the engine directly is pro-duced from renewable sources do these vehicles contribute to overall cleaner air – otherwise the pollution is just relocated. Other solutions could be green electricity from the general grid or fuel cells on board (see 4.2.8.). For short-distance use in a defined space such as on a terminal, the utilisation of ex-changeable batteries is an effective way to save time. In ad-dition, the charging energy can be delivered when there is an electricity overcapacity in the grid. Examples:
The Port of Magdeburg* and Hamburger Hafen und Logistik AG (HHLA)* use electric vehicles with exchange-able batteries, so changing the charged batteries is not time-consuming. The HHLA terminal in Hamburg has deployed 64 electric cars, including those in the car pool. This makes it the largest fleet of electric vehicles in any European port (2015). The cars have already covered a total of more than 150,000 kilometres without any emissions.
Vehicles with electric drives at the Eurogate* terminal in Bremerhaven are used for passenger transport.
4. eMission reDUCtion MeasUres For sinGle eMitters
Average Emission Reductions for Trucks (in%)
* should be combined with DOC or DPF systems to reduce PM, HC and CO emissions.
Diesel Particulate Filter (DPF)
Diesel Particulate Filter (DPF)
PM
85-95
20-40
HC
85-95
40-70
Co
50-60
40-60
Selective Catalytic Reduction (SCR) *
nox
up to 75
EPA
4.2.6. alternative Fuels
LPG (liquid propane gas), CNG (compressed natural gas), LNG (liquefied natural gas) and methanol are adequate fuel alternatives for most propulsion machinery ranging from cars to ships (see 4.1.10. and 4.1.11.). The use of LPG and CNG in trucks, cars and buses is already common. Emissions are lower than for gasoline and diesel. Another alternative to die-sel trucks is LNG. LNG-powered trucks easily meet the re-quirements of EURO VI. LNG, CNG and methanol can be
22
4.2.8. Fuel Cells
Fuel cells generate energy by means of an electrochemical re-action, commonly between hydrogen and oxygen. They also cause very little noise and zero emissions of sulphur dioxide, nitrogen oxide, particulates and CO2. The only emissions are water vapour and heat. Fuel cells can extend the range of electric propulsion systems and provide independence from charging. Hydrogen fuel cell drives are already in use in cars, NRMM and ships. The production of hydrogen has to be pow-ered by renewable energies; otherwise the required high input of electric energy would generate a great amount of emissions (see also 4.1.7. and 4.3.4.). Example:
There are heavy-duty hauling trucks in the Port of Los Angeles* and the Port of Long Beach with a range of 200 miles between hydrogen filling.
4.2.9. electrification of the track
In addition to battery or fuel cell technology, especially for heavy vehicles like trucks, track electrification seems to be a suitable option. In busy harbours with cargo handling, the electrification of cranes and container gantries is not possible for every track, because it hinders the access to wagons from above. And if electrification is installed at ground level, it pre-vents the tracks from being passed by other vehicles. Track electrification is only appropriate for routes between hubs. The vehicles therefore need to be able to drive without exter-nal energy input for a certain amount of time. Example:
Siemens* eHighway opts to electrify short but highly fre-quented routes for the usage of hybrid trucks with an additional battery, fuel cell or diesel engine. As a demonstration project, the Siemens system is being built at Port of Los Angeles*.
23
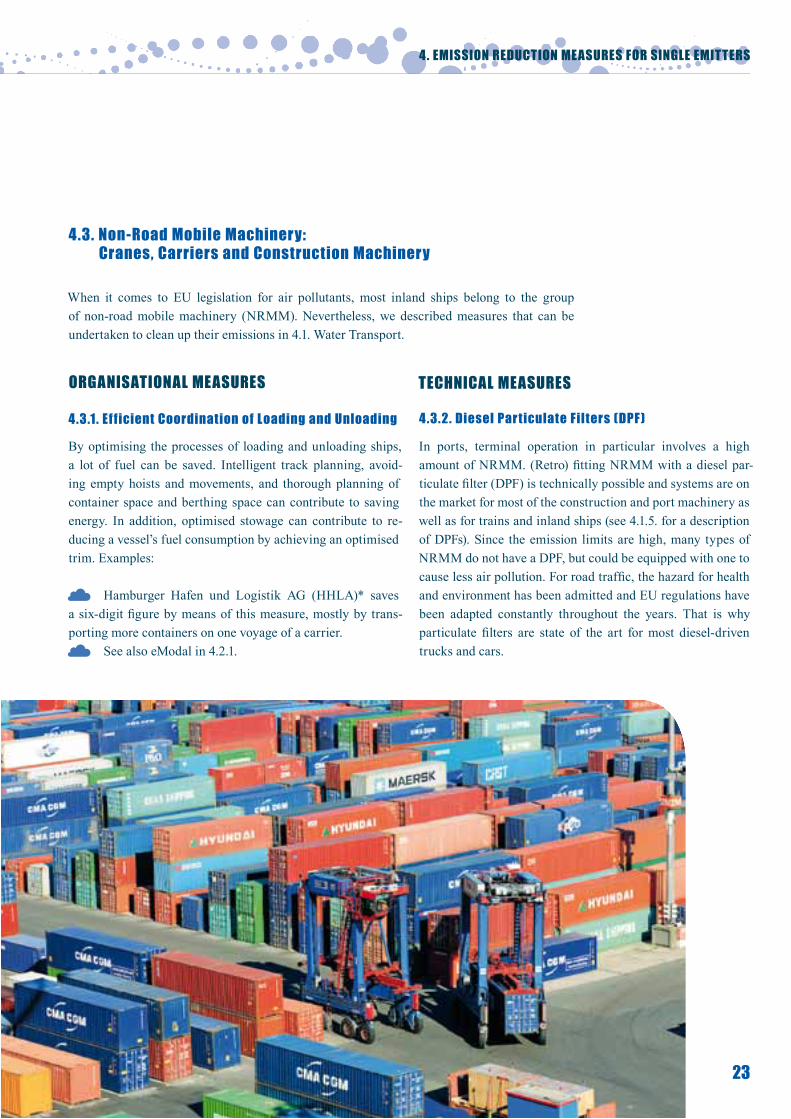
4.3.1. efficient Coordination of loading and Unloading
By optimising the processes of loading and unloading ships, a lot of fuel can be saved. Intelligent track planning, avoid-ing empty hoists and movements, and thorough planning of container space and berthing space can contribute to saving energy. In addition, optimised stowage can contribute to re-ducing a vessel’s fuel consumption by achieving an optimised trim. Examples:
Hamburger Hafen und Logistik AG (HHLA)* saves a six-digit figure by means of this measure, mostly by trans-porting more containers on one voyage of a carrier.
See also eModal in 4.2.1.
4.3. non-road Mobile Machinery: Cranes, Carriers and Construction Machinery
When it comes to EU legislation for air pollutants, most inland ships belong to the group of non-road mobile machinery (NRMM). Nevertheless, we described measures that can be undertaken to clean up their emissions in 4.1. Water Transport.
orGanisational MeasUres teCHniCal MeasUres 4.3.2. Diesel Particulate Filters (DPF)
In ports, terminal operation in particular involves a high amount of NRMM. (Retro) fitting NRMM with a diesel par-ticulate filter (DPF) is technically possible and systems are on the market for most of the construction and port machinery as well as for trains and inland ships (see 4.1.5. for a description of DPFs). Since the emission limits are high, many types of NRMM do not have a DPF, but could be equipped with one to cause less air pollution. For road traffic, the hazard for health and environment has been admitted and EU regulations have been adapted constantly throughout the years. That is why particulate filters are state of the art for most diesel-driven trucks and cars.
4. eMission reDUCtion MeasUres For sinGle eMitters
24
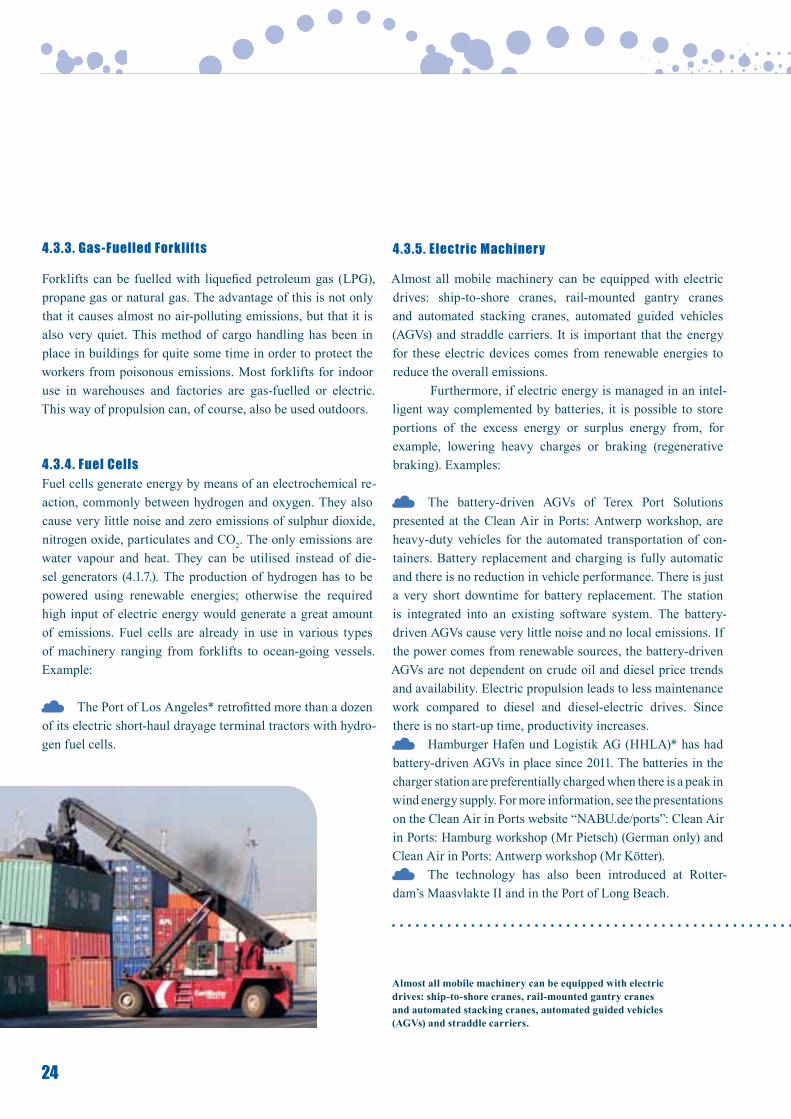
4.3.3. Gas-Fuelled Forklifts
Forklifts can be fuelled with liquefied petroleum gas (LPG), propane gas or natural gas. The advantage of this is not only that it causes almost no air-polluting emissions, but that it is also very quiet. This method of cargo handling has been in place in buildings for quite some time in order to protect the workers from poisonous emissions. Most forklifts for indoor use in warehouses and factories are gas-fuelled or electric. This way of propulsion can, of course, also be used outdoors.
4.3.4. Fuel Cells Fuel cells generate energy by means of an electrochemical re-action, commonly between hydrogen and oxygen. They also cause very little noise and zero emissions of sulphur dioxide, nitrogen oxide, particulates and CO2. The only emissions are water vapour and heat. They can be utilised instead of die-sel generators (4.1.7.). The production of hydrogen has to be powered using renewable energies; otherwise the required high input of electric energy would generate a great amount of emissions. Fuel cells are already in use in various types of machinery ranging from forklifts to ocean-going vessels. Example:
The Port of Los Angeles* retrofitted more than a dozen of its electric short-haul drayage terminal tractors with hydro-gen fuel cells.
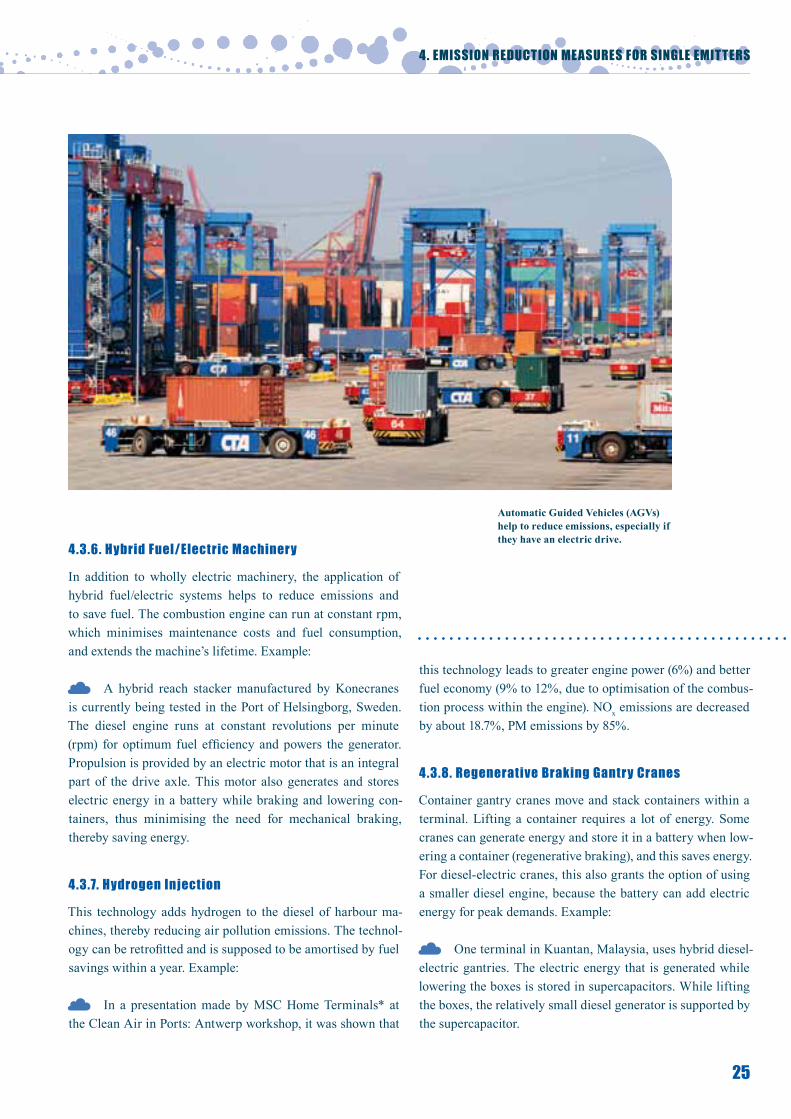
4.3.5. electric Machinery
Almost all mobile machinery can be equipped with electric drives: ship-to-shore cranes, rail-mounted gantry cranes and automated stacking cranes, automated guided vehicles (AGVs) and straddle carriers. It is important that the energy for these electric devices comes from renewable energies to reduce the overall emissions.
Furthermore, if electric energy is managed in an intel-ligent way complemented by batteries, it is possible to store portions of the excess energy or surplus energy from, for example, lowering heavy charges or braking (regenerative braking). Examples:
The battery-driven AGVs of Terex Port Solutions presented at the Clean Air in Ports: Antwerp workshop, are heavy-duty vehicles for the automated transportation of con-tainers. Battery replacement and charging is fully automatic and there is no reduction in vehicle performance. There is just a very short downtime for battery replacement. The station is integrated into an existing software system. The battery-driven AGVs cause very little noise and no local emissions. If the power comes from renewable sources, the battery-driven AGVs are not dependent on crude oil and diesel price trends and availability. Electric propulsion leads to less maintenance work compared to diesel and diesel-electric drives. Since there is no start-up time, productivity increases.
Hamburger Hafen und Logistik AG (HHLA)* has had battery-driven AGVs in place since 2011. The batteries in the charger station are preferentially charged when there is a peak in wind energy supply. For more information, see the presentations on the Clean Air in Ports website “NABU.de/ports”: Clean Air in Ports: Hamburg workshop (Mr Pietsch) (German only) and Clean Air in Ports: Antwerp workshop (Mr Kötter).
The technology has also been introduced at Rotter-dam’s Maasvlakte II and in the Port of Long Beach.
Almost all mobile machinery can be equipped with electricdrives: ship-to-shore cranes, rail-mounted gantry cranesand automated stacking cranes, automated guided vehicles(AGVs) and straddle carriers.
25
4. eMission reDUCtion MeasUres For sinGle eMitters
4.3.6. Hybrid Fuel/electric Machinery
In addition to wholly electric machinery, the application of hybrid fuel/electric systems helps to reduce emissions and to save fuel. The combustion engine can run at constant rpm, which minimises maintenance costs and fuel consumption, and extends the machine’s lifetime. Example:
A hybrid reach stacker manufactured by Konecranes is currently being tested in the Port of Helsingborg, Sweden. The diesel engine runs at constant revolutions per minute (rpm) for optimum fuel efficiency and powers the generator. Propulsion is provided by an electric motor that is an integral part of the drive axle. This motor also generates and stores electric energy in a battery while braking and lowering con-tainers, thus minimising the need for mechanical braking, thereby saving energy.
4.3.7. Hydrogen injection
This technology adds hydrogen to the diesel of harbour ma-chines, thereby reducing air pollution emissions. The technol-ogy can be retrofitted and is supposed to be amortised by fuel savings within a year. Example:
In a presentation made by MSC Home Terminals* at the Clean Air in Ports: Antwerp workshop, it was shown that
this technology leads to greater engine power (6%) and better fuel economy (9% to 12%, due to optimisation of the combus-tion process within the engine). NOx emissions are decreased by about 18.7%, PM emissions by 85%.
4.3.8. regenerative Braking Gantry Cranes
Container gantry cranes move and stack containers within a terminal. Lifting a container requires a lot of energy. Some cranes can generate energy and store it in a battery when low-ering a container (regenerative braking), and this saves energy. For diesel-electric cranes, this also grants the option of using a smaller diesel engine, because the battery can add electric energy for peak demands. Example:
One terminal in Kuantan, Malaysia, uses hybrid diesel-electric gantries. The electric energy that is generated while lowering the boxes is stored in supercapacitors. While lifting the boxes, the relatively small diesel generator is supported by the supercapacitor.
Automatic Guided Vehicles (AGVs) help to reduce emissions, especially if they have an electric drive.
26
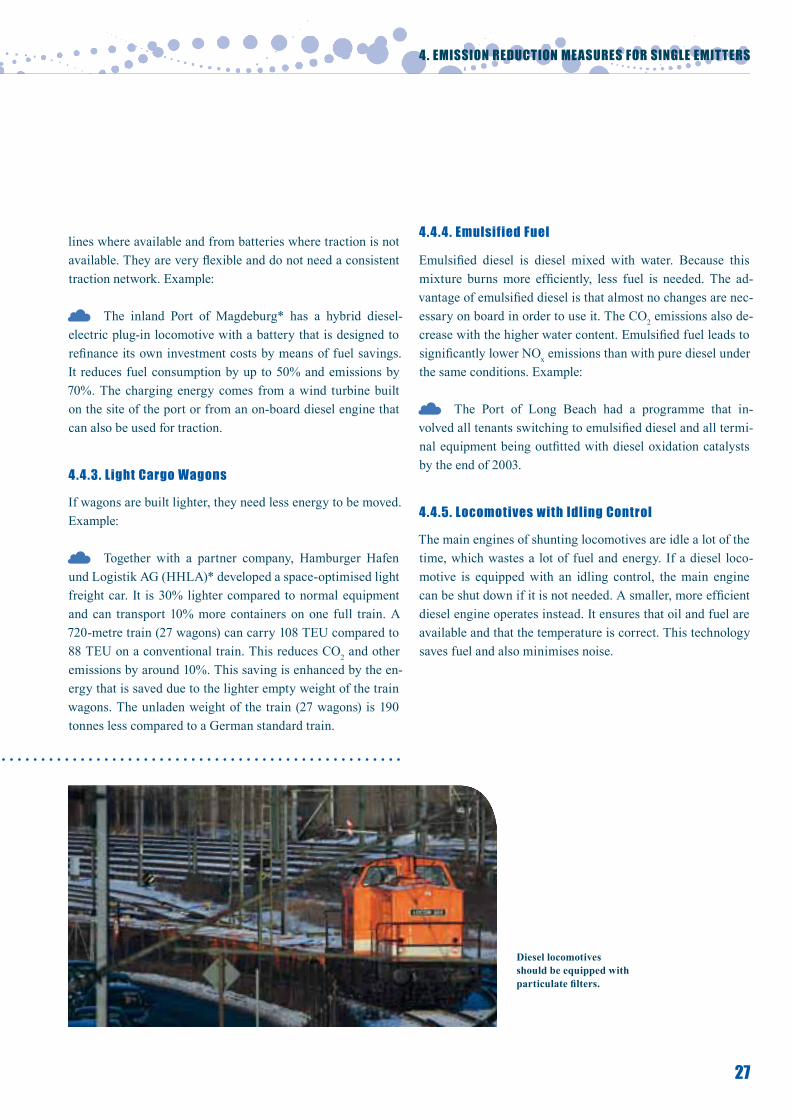
4.4.1. Diesel Particulate Filters
Diesel locomotives can likewise be equipped with diesel par-ticulate filters (DPFs). Again, this filters 99.9% of the soot par-ticles of the fumes. It also reduces about 90% of hydrocarbons and carbon monoxides – both substances harmful to human health. A port could require railway companies that operate in the port to only use locomotives that are equipped with a filter. Example:
Since 2012, the Hamburg Port Authority (HPA)* has been granting discounts for locomotives equipped with par-ticulate filters and has recorded a remarkable increase in such locomotives. Of 230 registered locomotives running in the port, 35 have installed a particulate filter. Movements of retrofitted locomotives had an increase from 5% to 28% in 2014 alone.
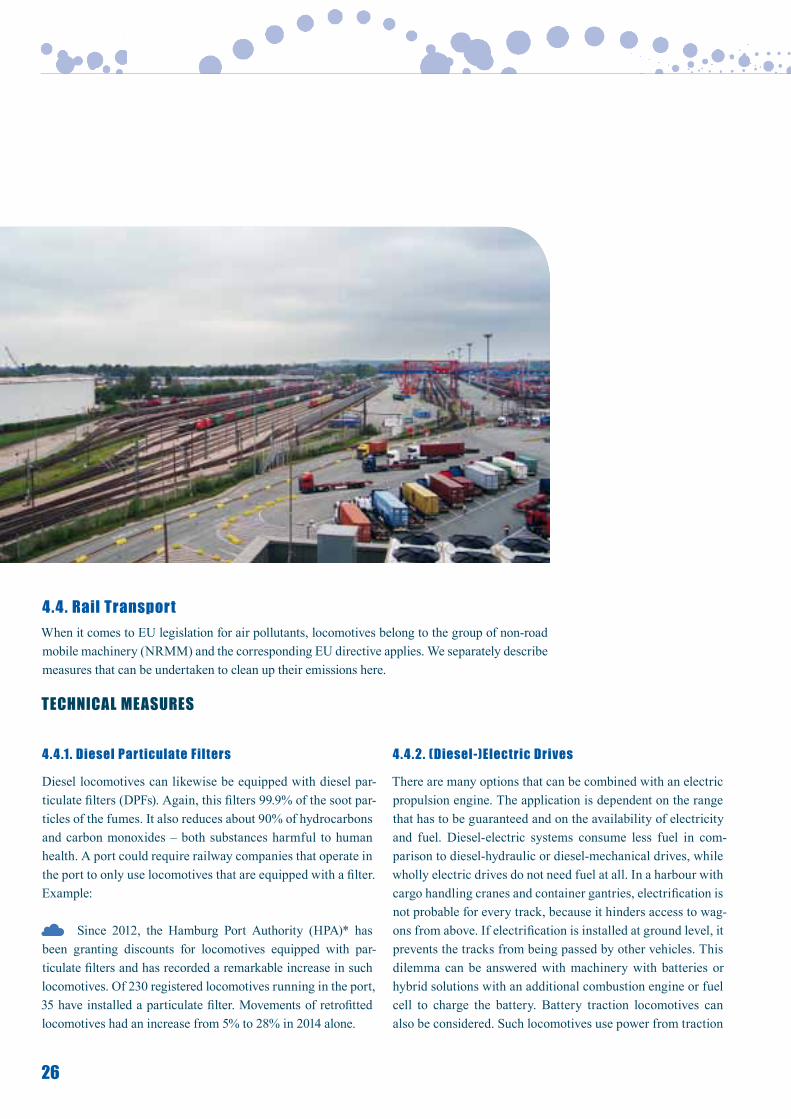
4.4. rail transportWhen it comes to EU legislation for air pollutants, locomotives belong to the group of non-road mobile machinery (NRMM) and the corresponding EU directive applies. We separately describe measures that can be undertaken to clean up their emissions here.
teCHniCal MeasUres
4.4.2. (Diesel-)electric Drives
There are many options that can be combined with an electric propulsion engine. The application is dependent on the range that has to be guaranteed and on the availability of electricity and fuel. Diesel-electric systems consume less fuel in com-parison to diesel-hydraulic or diesel-mechanical drives, while wholly electric drives do not need fuel at all. In a harbour with cargo handling cranes and container gantries, electrification is not probable for every track, because it hinders access to wag-ons from above. If electrification is installed at ground level, it prevents the tracks from being passed by other vehicles. This dilemma can be answered with machinery with batteries or hybrid solutions with an additional combustion engine or fuel cell to charge the battery. Battery traction locomotives can also be considered. Such locomotives use power from traction
27
lines where available and from batteries where traction is not available. They are very flexible and do not need a consistent traction network. Example:
The inland Port of Magdeburg* has a hybrid diesel-electric plug-in locomotive with a battery that is designed to refinance its own investment costs by means of fuel savings. It reduces fuel consumption by up to 50% and emissions by 70%. The charging energy comes from a wind turbine built on the site of the port or from an on-board diesel engine that can also be used for traction.
4.4.3. light Cargo Wagons
If wagons are built lighter, they need less energy to be moved. Example:
Together with a partner company, Hamburger Hafen und Logistik AG (HHLA)* developed a space-optimised light freight car. It is 30% lighter compared to normal equipment and can transport 10% more containers on one full train. A 720-metre train (27 wagons) can carry 108 TEU compared to 88 TEU on a conventional train. This reduces CO2 and other emissions by around 10%. This saving is enhanced by the en-ergy that is saved due to the lighter empty weight of the train wagons. The unladen weight of the train (27 wagons) is 190 tonnes less compared to a German standard train.
4. eMission reDUCtion MeasUres For sinGle eMitters
4.4.4. emulsified Fuel
Emulsified diesel is diesel mixed with water. Because this mixture burns more efficiently, less fuel is needed. The ad-vantage of emulsified diesel is that almost no changes are nec-essary on board in order to use it. The CO2 emissions also de-crease with the higher water content. Emulsified fuel leads to significantly lower NOx emissions than with pure diesel under the same conditions. Example:
The Port of Long Beach had a programme that in-volved all tenants switching to emulsified diesel and all termi-nal equipment being outfitted with diesel oxidation catalysts by the end of 2003.
4.4.5. locomotives with idling Control
The main engines of shunting locomotives are idle a lot of the time, which wastes a lot of fuel and energy. If a diesel loco-motive is equipped with an idling control, the main engine can be shut down if it is not needed. A smaller, more efficient diesel engine operates instead. It ensures that oil and fuel are available and that the temperature is correct. This technology saves fuel and also minimises noise.
Diesel locomotives should be equipped with particulate filters.

28
4.5. Measures for Port authorities, terminal operators and industries
orGanisational MeasUres
4.5.1. energy efficiency
Generally improved energy efficiency reduces both air pol-lution and costs. When less energy is needed, less fuel is burnt and fewer emissions are set free. One way in which to increase energy efficiency is by implementing an energy management system with professional monitoring and control. Such a system can help to lower energy consumption in com-plex processes. Example:
Eurogate* reduced the energy demand per handled container by 13.5% from 2008 to 2014 by using a monitoring system.
4.5.2. renewable energy
Wherever energy from fossil fuels is replaced by energy from renewable sources, emissions are reduced by about 100%. Ports can do this by buying green energy from the energy pro-vider or by installing their own renewable power systems such as wind or solar power (see 4.5.7.).
4.5.3. raising awareness and training employees
One relevant measure to foster environmental changes – for air quality and others such as less noise or waste – is to raise awareness about the topic among all the people working in a port (e.g. working for companies doing business in the port, for the port authority or for shipping companies). Each per-son can contribute and make a change with actions and new ideas. Building on this, employees should be given training about air pollution measures in their specific field of work. Examples:
Hamburger Hafen und Logistik AG (HHLA)* and Euro gate* provide such training.
The Netherlands-based ProSea Foundation (www.pro-sea.info) provides marine awareness training courses for sea-farers and port operators to show the importance and diversity
of the marine environment and to raise awareness of the im-pacts of human activities on marine ecosystems.
4.5.4. in-Port low-emission traffic
Port authorities or terminal operators can change their car fleets to cleaner vehicles (see 4.2.). Examples: Hamburger Hafen und Logistik AG (HHLA)* has the biggest fleet of electric cars within northern range ports. The Antwerp Port Authority (APA)* uses bicycles for service and for commuting, and continues to improve the so-called eco-score of its car fleet. It has decided to replace most of its diesel-powered cars for short distances with (hybrid) gasoline- or CNG-driven cars.
4.5.5. ship indices
Worldwide, there are about 50 different indices for clean(er) ships that rate their environmental performance by means of different methodologies. Perhaps the most widely recognised of these is the Environmental Ship Index (ESI), which is a pro-ject of the World Ports Climate Initiative (WPCI) (see 5.1.1.). In many ports, ships with above-average environmental per-formance can get reduced harbour fees. In 2015, more than 3,000 ships had a valid ESI score. 30 international seaports in Europe, America and Asia are participating as incentive pro-viders. A presentation including calculation of the score can be found in the presentation given by Mr van de Laar at the Clean Air in Ports: Gdansk workshop. Examples:
Since 2011, the Port of Rotterdam and the Antwerp Port Authority (APA)* have granted ships with an ESI score of 31 points or more a 10% discount on parts of their port dues. The Port of Rotterdam awarded discounts worth €1.2 million for 1,413 ships in 2014.
The Clean Shipping Index gives real-time, quantified insights into the environmental performance of individual ships. Ships and carriers are evaluated on the basis of their
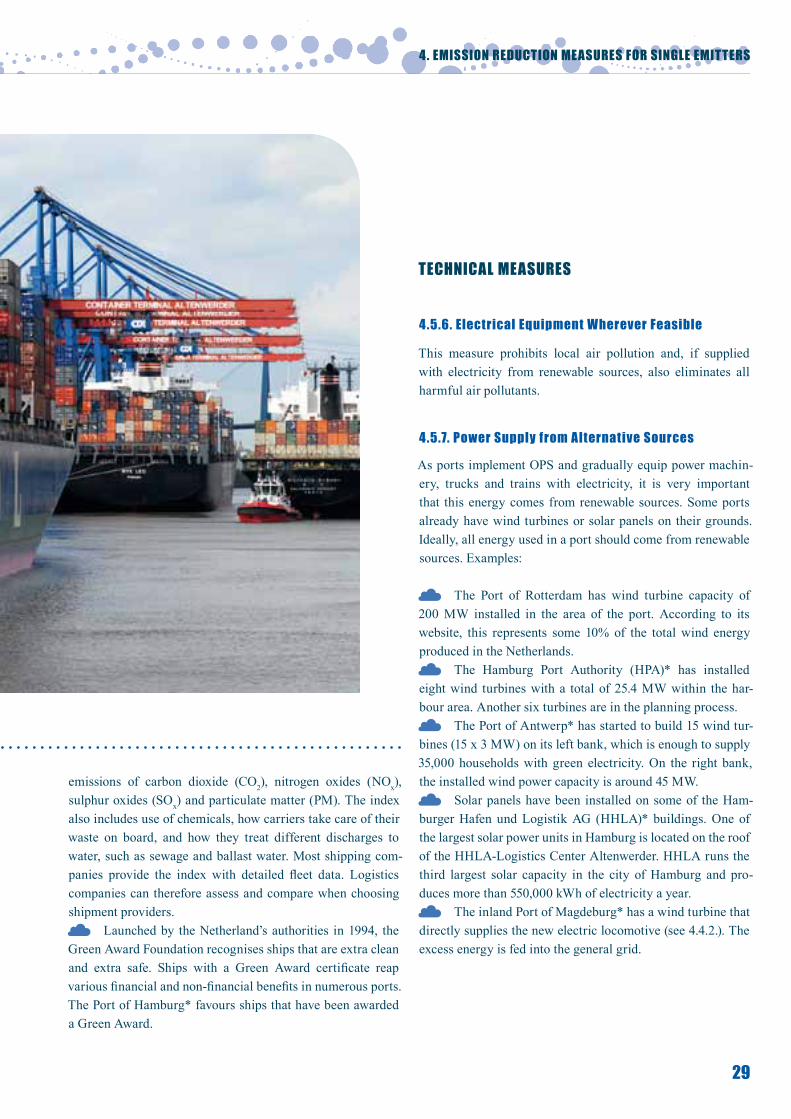
29
emissions of carbon dioxide (CO2), nitrogen oxides (NOx), sulphur oxides (SOx) and particulate matter (PM). The index also includes use of chemicals, how carriers take care of their waste on board, and how they treat different discharges to water, such as sewage and ballast water. Most shipping com-panies provide the index with detailed fleet data. Logistics companies can therefore assess and compare when choosing shipment providers.
Launched by the Netherland’s authorities in 1994, the Green Award Foundation recognises ships that are extra clean and extra safe. Ships with a Green Award certificate reap various financial and non-financial benefits in numerous ports. The Port of Hamburg* favours ships that have been awarded a Green Award.
teCHniCal MeasUres
4.5.6. electrical equipment Wherever Feasible
This measure prohibits local air pollution and, if supplied with electricity from renewable sources, also eliminates all harmful air pollutants.
4.5.7. Power supply from alternative sources
As ports implement OPS and gradually equip power machin-ery, trucks and trains with electricity, it is very important that this energy comes from renewable sources. Some ports already have wind turbines or solar panels on their grounds. Ideally, all energy used in a port should come from renewable sources. Examples:
The Port of Rotterdam has wind turbine capacity of 200 MW installed in the area of the port. According to its website, this represents some 10% of the total wind energy produced in the Netherlands.
The Hamburg Port Authority (HPA)* has installed eight wind turbines with a total of 25.4 MW within the har-bour area. Another six turbines are in the planning process.
The Port of Antwerp* has started to build 15 wind tur-bines (15 x 3 MW) on its left bank, which is enough to supply 35,000 households with green electricity. On the right bank, the installed wind power capacity is around 45 MW.
Solar panels have been installed on some of the Ham-burger Hafen und Logistik AG (HHLA)* buildings. One of the largest solar power units in Hamburg is located on the roof of the HHLA-Logistics Center Altenwerder. HHLA runs the third largest solar capacity in the city of Hamburg and pro-duces more than 550,000 kWh of electricity a year.
The inland Port of Magdeburg* has a wind turbine that directly supplies the new electric locomotive (see 4.4.2.). The excess energy is fed into the general grid.
4. eMission reDUCtion MeasUres For sinGle eMitters
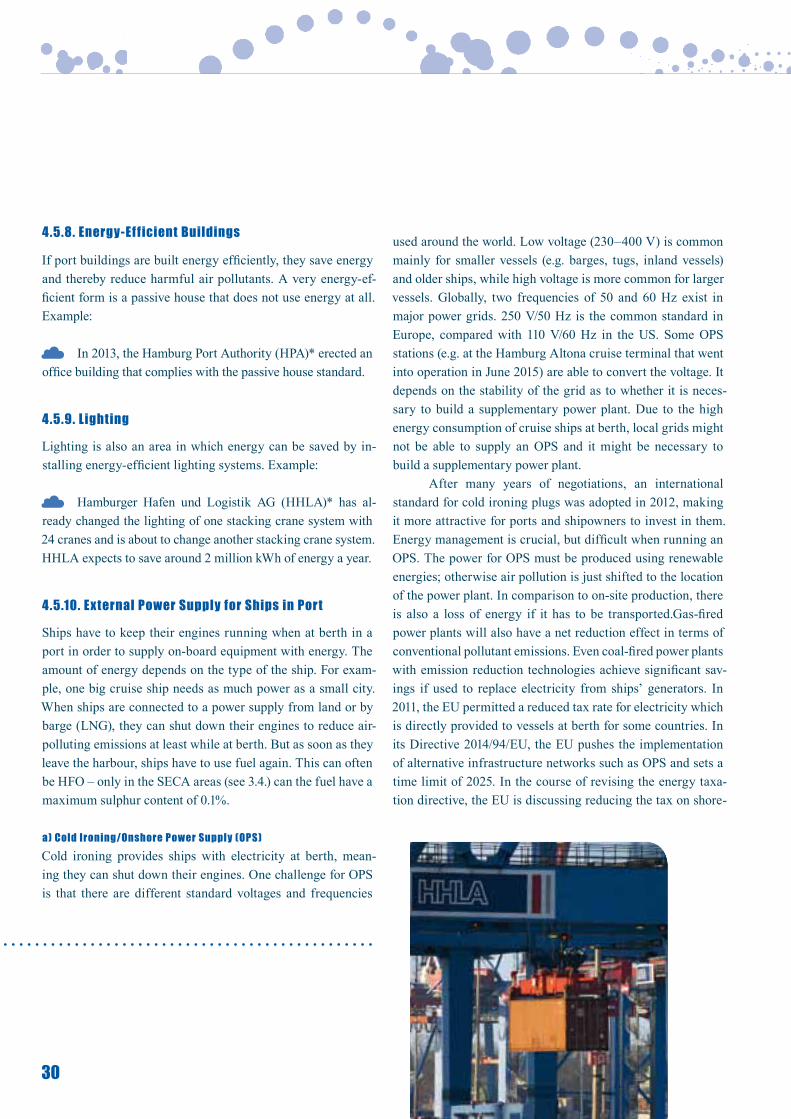
30
4.5.8. energy-efficient Buildings
If port buildings are built energy efficiently, they save energy and thereby reduce harmful air pollutants. A very energy-ef-ficient form is a passive house that does not use energy at all. Example:
In 2013, the Hamburg Port Authority (HPA)* erected an office building that complies with the passive house standard.
4.5.9. lighting
Lighting is also an area in which energy can be saved by in-stalling energy-efficient lighting systems. Example:
Hamburger Hafen und Logistik AG (HHLA)* has al-ready changed the lighting of one stacking crane system with 24 cranes and is about to change another stacking crane system. HHLA expects to save around 2 million kWh of energy a year.
4.5.10. external Power supply for ships in Port
Ships have to keep their engines running when at berth in a port in order to supply on-board equipment with energy. The amount of energy depends on the type of the ship. For exam-ple, one big cruise ship needs as much power as a small city. When ships are connected to a power supply from land or by barge (LNG), they can shut down their engines to reduce air-polluting emissions at least while at berth. But as soon as they leave the harbour, ships have to use fuel again. This can often be HFO – only in the SECA areas (see 3.4.) can the fuel have a maximum sulphur content of 0.1%.
a) Cold ironing/onshore Power supply (oPs) Cold ironing provides ships with electricity at berth, mean-ing they can shut down their engines. One challenge for OPS is that there are different standard voltages and frequencies
used around the world. Low voltage (230–400 V) is common mainly for smaller vessels (e.g. barges, tugs, inland vessels) and older ships, while high voltage is more common for larger vessels. Globally, two frequencies of 50 and 60 Hz exist in major power grids. 250 V/50 Hz is the common standard in Europe, compared with 110 V/60 Hz in the US. Some OPS stations (e.g. at the Hamburg Altona cruise terminal that went into operation in June 2015) are able to convert the voltage. It depends on the stability of the grid as to whether it is neces-sary to build a supplementary power plant. Due to the high energy consumption of cruise ships at berth, local grids might not be able to supply an OPS and it might be necessary to build a supplementary power plant.
After many years of negotiations, an international standard for cold ironing plugs was adopted in 2012, making it more attractive for ports and shipowners to invest in them. Energy management is crucial, but difficult when running an OPS. The power for OPS must be produced using renewable energies; otherwise air pollution is just shifted to the location of the power plant. In comparison to on-site production, there is also a loss of energy if it has to be transported.Gas-fired power plants will also have a net reduction effect in terms of conventional pollutant emissions. Even coal-fired power plants with emission reduction technologies achieve significant sav-ings if used to replace electricity from ships’ generators. In 2011, the EU permitted a reduced tax rate for electricity which is directly provided to vessels at berth for some countries. In its Directive 2014/94/EU, the EU pushes the implementation of alternative infrastructure networks such as OPS and sets a time limit of 2025. In the course of revising the energy taxa-tion directive, the EU is discussing reducing the tax on shore-
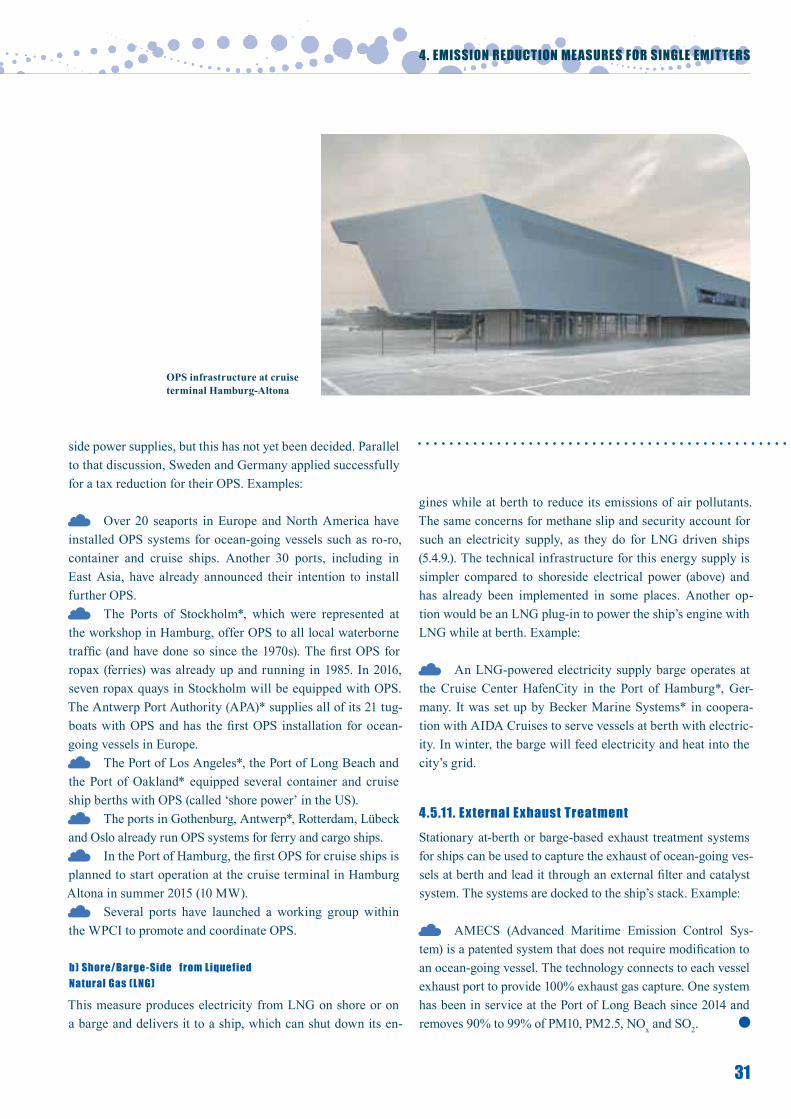
31
side power supplies, but this has not yet been decided. Parallel to that discussion, Sweden and Germany applied successfully for a tax reduction for their OPS. Examples:
Over 20 seaports in Europe and North America have installed OPS systems for ocean-going vessels such as ro-ro, container and cruise ships. Another 30 ports, including in East Asia, have already announced their intention to install further OPS.
The Ports of Stockholm*, which were represented at the workshop in Hamburg, offer OPS to all local waterborne traffic (and have done so since the 1970s). The first OPS for ropax (ferries) was already up and running in 1985. In 2016, seven ropax quays in Stockholm will be equipped with OPS. The Antwerp Port Authority (APA)* supplies all of its 21 tug-boats with OPS and has the first OPS installation for ocean-going vessels in Europe.
The Port of Los Angeles*, the Port of Long Beach and the Port of Oakland* equipped several container and cruise ship berths with OPS (called ‘shore power’ in the US).
The ports in Gothenburg, Antwerp*, Rotterdam, Lübeck and Oslo already run OPS systems for ferry and cargo ships.
In the Port of Hamburg, the first OPS for cruise ships is planned to start operation at the cruise terminal in Hamburg Altona in summer 2015 (10 MW).
Several ports have launched a working group within the WPCI to promote and coordinate OPS.
b) shore/Barge-side from liquefied natural Gas (lnG)
This measure produces electricity from LNG on shore or on a barge and delivers it to a ship, which can shut down its en-
gines while at berth to reduce its emissions of air pollutants. The same concerns for methane slip and security account for such an electricity supply, as they do for LNG driven ships (5.4.9.). The technical infrastructure for this energy supply is simpler compared to shoreside electrical power (above) and has already been implemented in some places. Another op-tion would be an LNG plug-in to power the ship’s engine with LNG while at berth. Example:
An LNG-powered electricity supply barge operates at the Cruise Center HafenCity in the Port of Hamburg*, Ger-many. It was set up by Becker Marine Systems* in coopera-tion with AIDA Cruises to serve vessels at berth with electric-ity. In winter, the barge will feed electricity and heat into the city’s grid.
4.5.11. external exhaust treatmentStationary at-berth or barge-based exhaust treatment systems for ships can be used to capture the exhaust of ocean-going ves-sels at berth and lead it through an external filter and catalyst system. The systems are docked to the ship’s stack. Example:
AMECS (Advanced Maritime Emission Control Sys-tem) is a patented system that does not require modification to an ocean-going vessel. The technology connects to each vessel exhaust port to provide 100% exhaust gas capture. One system has been in service at the Port of Long Beach since 2014 and removes 90% to 99% of PM10, PM2.5, NOx and SO2.
4. eMission reDUCtion MeasUres For sinGle eMitters
OPS infrastructure at cruise terminal Hamburg-Altona
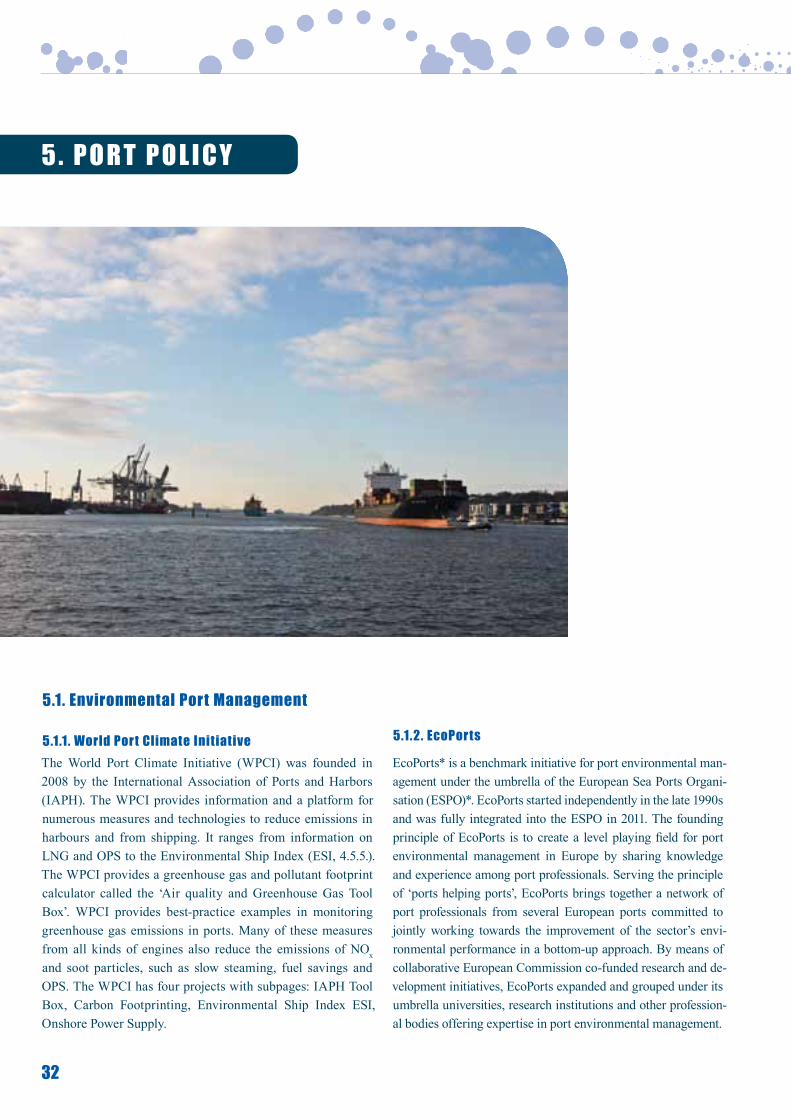
32
5.1. environmental Port Management
5.1.1. World Port Climate initiative The World Port Climate Initiative (WPCI) was founded in 2008 by the International Association of Ports and Harbors (IAPH). The WPCI provides information and a platform for numerous measures and technologies to reduce emissions in harbours and from shipping. It ranges from information on LNG and OPS to the Environmental Ship Index (ESI, 4.5.5.). The WPCI provides a greenhouse gas and pollutant footprint calculator called the ‘Air quality and Greenhouse Gas Tool Box’. WPCI provides best-practice examples in monitoring greenhouse gas emissions in ports. Many of these measures from all kinds of engines also reduce the emissions of NOx and soot particles, such as slow steaming, fuel savings and OPS. The WPCI has four projects with subpages: IAPH Tool Box, Carbon Footprinting, Environmental Ship Index ESI, Onshore Power Supply.
5 . P o r t P o l i C y
5.1.2. ecoPorts
EcoPorts* is a benchmark initiative for port environmental man-agement under the umbrella of the European Sea Ports Organi-sation (ESPO)*. EcoPorts started independently in the late 1990s and was fully integrated into the ESPO in 2011. The founding principle of EcoPorts is to create a level playing field for port environmental management in Europe by sharing knowledge and experience among port professionals. Serving the principle of ‘ports helping ports’, EcoPorts brings together a network of port professionals from several European ports committed to jointly working towards the improvement of the sector’s envi-ronmental performance in a bottom-up approach. By means of collaborative European Commission co-funded research and de-velopment initiatives, EcoPorts expanded and grouped under its umbrella universities, research institutions and other profession-al bodies offering expertise in port environmental management.
33
ESPO now offers two main tools to the European ports at ecoports.com. Firstly, there is the Self Diagnosis Method (SDM) checklist, which is a comprehensive self-risk assess-ment tool that assists ports to identify environmental priorities and take appropriate action. Upon completion of the SDM, a port joins the network and achieves the EcoPorts status for sharing data on the performance of its environmental man-agement programme and for contributing to the up-to-date maintenance of the ESPO European benchmark of perfor-mance. The second EcoPorts tool is the Port Environmental Review System (PERS), the only port sector-specific environ-mental management standard. PERS incorporates the main elements of recognised environmental management systems such as ISO 14001 and EMAS, but adapts them to fit the spe-cific port sector requirements. PERS is independently certified by Lloyd’s Register Quality Assurance. The EcoPorts network currently comprises around 80 ports in more than 20 countries.
5.1.3. GreenPort Congress
The GreenPort Congress* takes place in a European port city annually. It aims to provide decision makers from the port community – port authorities, terminal operators, shipping lines, logistics operators – with a meeting place to both learn about and discuss the latest in sustainable development and environmental practices, to enable them to effectively imple-ment the changes needed to reduce their carbon footprint and to be more aware of environmental considerations. The con-gresses highlight the innovations in equipment and technol-ogy to allow port users to adhere to policy, while illustrating practical solutions on the basis of case studies from the global logistics chain.
5.1.4. esPo Green Guide
The ‘ESPO Green Guide: Towards excellence port environmen-tal management and sustainability’ was published in 2012 and constitutes the environmental policy of the European port au-thorities. The Green Guide establishes the common principles of the sector and introduces a common framework for action based on the ‘five Es’: exemplify, enable, encourage, engage and enforce. The ‘five Es’ framework clearly dictates an ap-proach that starts by demonstrating excellence in managing op-
erations and assets under the direct control of the port authority and extends towards influencing performance in the port area and the logistics chain. The Green Guide favours a bottom-up approach in which port authorities proactively take responsibil-ity and live up to the expectations of their communities.
With the Green Guide, the ESPO* encourages ports to constantly evaluate their environmental performance to see where they stand, what they have already achieved and what would be the next steps towards further environmental improvement. The guide is accompanied by two online an-nexes. Annex 1 consists of exemplary response options and good practices that are in place in European ports. The cur-rent version contains 76 contributions from 26 European port authorities in 12 countries. Annex 2 summarises the key EU legislation that influences the environmental management of port areas. Both annexes are dynamic and as such are subject to periodic review by the ESPO.
5.2. emission reduction strategies for PortsSome ports have adopted their own air quality strategies that aim to make planning, the coordination of efforts and the cal-culation of the benefits for the environment easier. As a first step, it is important to calculate a port’s emissions and attrib-ute them to different sources. From that baseline, a plan can be developed with a deadline for reducing emissions by a cer-tain amount based on location and the approach taken. It is crucial to have a valid monitoring system for such a project. Examples:
The Port of New York/New Jersey, the Port of Los Angeles*, the Port of Long Beach, the Port of Oakland* and together the Ports of Seattle, Tacoma and Vancouver (North-west Ports Clean Air Strategy) all have a clean air strategy for their ports.
Hamburger Hafen und Logistik AG (HHLA)* aims to develop a zero-emission terminal.
The Port of Antwerp* has conducted an emission mod-elling project for ocean-going vessels as part of the INTER-REG-subsidised project Clean North Sea Shipping (CNSS) and presented it during the workshop in Gdansk. Their model is based on ship characteristics and shipping activity data, and makes it possible for the first time to attribute emissions
5. Port PoliCy
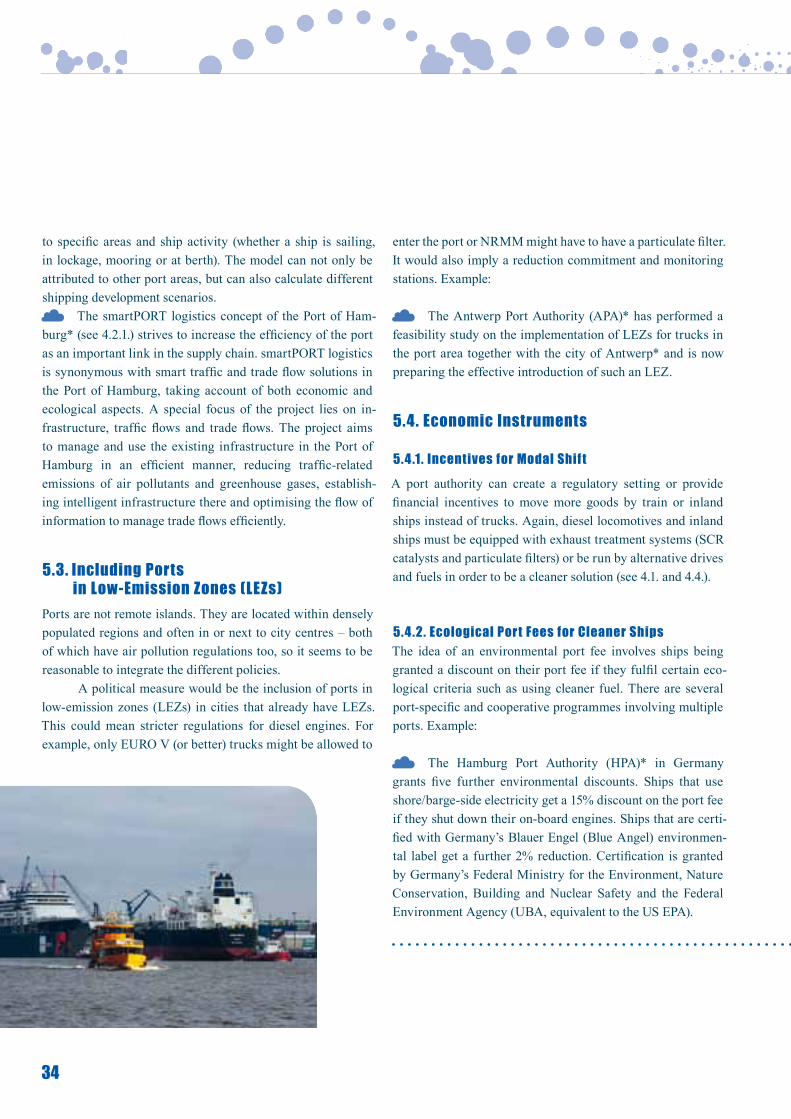
34
to specific areas and ship activity (whether a ship is sailing, in lockage, mooring or at berth). The model can not only be attributed to other port areas, but can also calculate different shipping development scenarios.
The smartPORT logistics concept of the Port of Ham-burg* (see 4.2.1.) strives to increase the efficiency of the port as an important link in the supply chain. smartPORT logistics is synonymous with smart traffic and trade flow solutions in the Port of Hamburg, taking account of both economic and ecological aspects. A special focus of the project lies on in-frastructure, traffic flows and trade flows. The project aims to manage and use the existing infrastructure in the Port of Hamburg in an efficient manner, reducing traffic-related emissions of air pollutants and greenhouse gases, establish-ing intelligent infrastructure there and optimising the flow of information to manage trade flows efficiently.
5.3. including Ports in low-emission Zones (leZs)
Ports are not remote islands. They are located within densely populated regions and often in or next to city centres – both of which have air pollution regulations too, so it seems to be reasonable to integrate the different policies.
A political measure would be the inclusion of ports in low-emission zones (LEZs) in cities that already have LEZs. This could mean stricter regulations for diesel engines. For example, only EURO V (or better) trucks might be allowed to
enter the port or NRMM might have to have a particulate filter. It would also imply a reduction commitment and monitoring stations. Example:
The Antwerp Port Authority (APA)* has performed a feasibility study on the implementation of LEZs for trucks in the port area together with the city of Antwerp* and is now preparing the effective introduction of such an LEZ.
5.4. economic instruments
5.4.1. incentives for Modal shiftA port authority can create a regulatory setting or provide financial incentives to move more goods by train or inland ships instead of trucks. Again, diesel locomotives and inland ships must be equipped with exhaust treatment systems (SCR catalysts and particulate filters) or be run by alternative drives and fuels in order to be a cleaner solution (see 4.1. and 4.4.).
5.4.2. ecological Port Fees for Cleaner ships The idea of an environmental port fee involves ships being granted a discount on their port fee if they fulfil certain eco-logical criteria such as using cleaner fuel. There are several port-specific and cooperative programmes involving multiple ports. Example:
The Hamburg Port Authority (HPA)* in Germany grants five further environmental discounts. Ships that use shore/barge-side electricity get a 15% discount on the port fee if they shut down their on-board engines. Ships that are certi-fied with Germany’s Blauer Engel (Blue Angel) environmen-tal label get a further 2% reduction. Certification is granted by Germany’s Federal Ministry for the Environment, Nature Conservation, Building and Nuclear Safety and the Federal Environment Agency (UBA, equivalent to the US EPA).
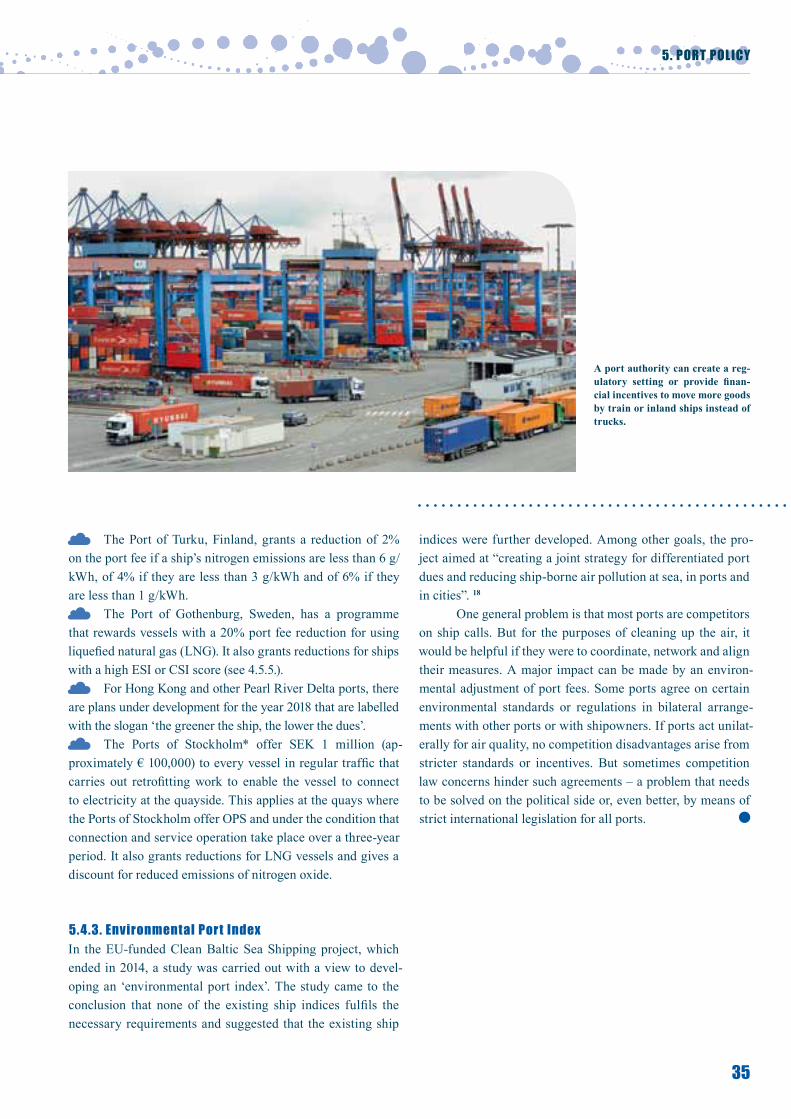
35
The Port of Turku, Finland, grants a reduction of 2% on the port fee if a ship’s nitrogen emissions are less than 6 g/kWh, of 4% if they are less than 3 g/kWh and of 6% if they are less than 1 g/kWh.
The Port of Gothenburg, Sweden, has a programme that rewards vessels with a 20% port fee reduction for using liquefied natural gas (LNG). It also grants reductions for ships with a high ESI or CSI score (see 4.5.5.).
For Hong Kong and other Pearl River Delta ports, there are plans under development for the year 2018 that are labelled with the slogan ‘the greener the ship, the lower the dues’.
The Ports of Stockholm* offer SEK 1 million (ap-proximately € 100,000) to every vessel in regular traffic that carries out retrofitting work to enable the vessel to connect to electricity at the quayside. This applies at the quays where the Ports of Stockholm offer OPS and under the condition that connection and service operation take place over a three-year period. It also grants reductions for LNG vessels and gives a discount for reduced emissions of nitrogen oxide.
5.4.3. environmental Port indexIn the EU-funded Clean Baltic Sea Shipping project, which ended in 2014, a study was carried out with a view to devel-oping an ‘environmental port index’. The study came to the conclusion that none of the existing ship indices fulfils the necessary requirements and suggested that the existing ship
indices were further developed. Among other goals, the pro-ject aimed at “creating a joint strategy for differentiated port dues and reducing ship-borne air pollution at sea, in ports and in cities”. 18
One general problem is that most ports are competitors on ship calls. But for the purposes of cleaning up the air, it would be helpful if they were to coordinate, network and align their measures. A major impact can be made by an environ-mental adjustment of port fees. Some ports agree on certain environmental standards or regulations in bilateral arrange-ments with other ports or with shipowners. If ports act unilat-erally for air quality, no competition disadvantages arise from stricter standards or incentives. But sometimes competition law concerns hinder such agreements – a problem that needs to be solved on the political side or, even better, by means of strict international legislation for all ports.
5. Port PoliCy
A port authority can create a reg-ulatory setting or provide finan-cial incentives to move more goods by train or inland ships instead of trucks.
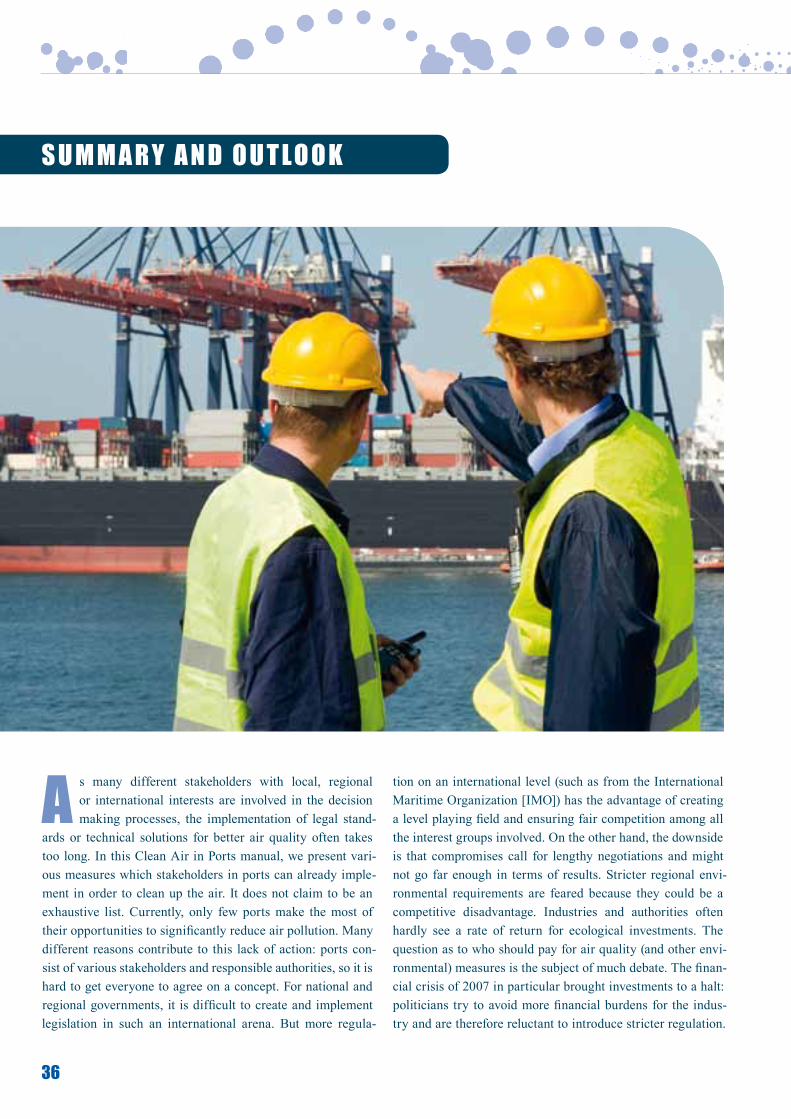
36
s U M M a r y a n D o U t lo o k
a s many different stakeholders with local, regional or international interests are involved in the decision making processes, the implementation of legal stand-
ards or technical solutions for better air quality often takes too long. In this Clean Air in Ports manual, we present vari-ous measures which stakeholders in ports can already imple-ment in order to clean up the air. It does not claim to be an exhaustive list. Currently, only few ports make the most of their opportunities to significantly reduce air pollution. Many different reasons contribute to this lack of action: ports con-sist of various stakeholders and responsible authorities, so it is hard to get everyone to agree on a concept. For national and regional governments, it is difficult to create and implement legislation in such an international arena. But more regula-
tion on an international level (such as from the International Maritime Organization [IMO]) has the advantage of creating a level playing field and ensuring fair competition among all the interest groups involved. On the other hand, the downside is that compromises call for lengthy negotiations and might not go far enough in terms of results. Stricter regional envi-ronmental requirements are feared because they could be a competitive disadvantage. Industries and authorities often hardly see a rate of return for ecological investments. The question as to who should pay for air quality (and other envi-ronmental) measures is the subject of much debate. The finan-cial crisis of 2007 in particular brought investments to a halt: politicians try to avoid more financial burdens for the indus-try and are therefore reluctant to introduce stricter regulation.
37
The maritime industry struggles to spend money for measures that go beyond the legislation. But private companies not only have economic pressures, but also a rising corporate social re-sponsibility:
All these reasons are economically comprehensible. But considering a sustainable approach and the fact that so-lutions are available and affordable, this attitude is not sup-portable: health costs and the costs of environmental damage caused by air pollution are very high and it is currently so-ciety that pays these costs – for the benefit of industry. This needs to change – the ‘polluter pays’ principle would be fair and economically prudent at the national level. Consequent-ly polluting investments and behaviour need to be regulated more strictly and must be punished. On the other hand, com-munication is needed regarding the areas in which air quality measures are affordable or even save money. Where this is not the case, stakeholder groups in ports should find creative ways of generating the money needed for air quality measures and should take into account that many energy-saving measures are ultimately self-paying.
Incentives are a good way for ports to trigger better environmental performance. For ships, at this point in time, indices are useful to differentiate them according to their en-vironmental performance.
Again, all parties have to contribute to cleaning up the air. In addition to the activities of port authorities and politi-
cians at the national level, international regulations that apply everywhere are needed to encourage ports and shipowners to take action for better air quality.
But whenever discussing air quality measures, it needs to be made sure that measures are not just short-term solutions, but also work in the long run. Additionally, invest-ments should be both economically wise and environmentally friendly. Questions such as “Who should bear the costs: com-panies or society?” need to be addressed and discussed with many stakeholders.
However, these and general questions regarding air quality should not only be discussed within an interest group, but also among different groups – with the surrounding com-munity and country, within a port and among ports. This is es-pecially important so that cleaning up the air does not mean a competitive disadvantage, but a joint strength. Only by means of intensive communication can emission reduction targets be set and measures be defined. All stakeholders and policymak-ers need to contribute to cleaning the air. We hope that our project and this manual in particular contribute to cleaning up the air in ports.
the questions of air quality should not only be discusses within an interest group, but also between different groups. With the surrounding community and country. Within a port and among ports. this is especially important so cleaning up the air does not mean a competitive disadvantage, but a joint strength.
sUMMary anD oUtlook
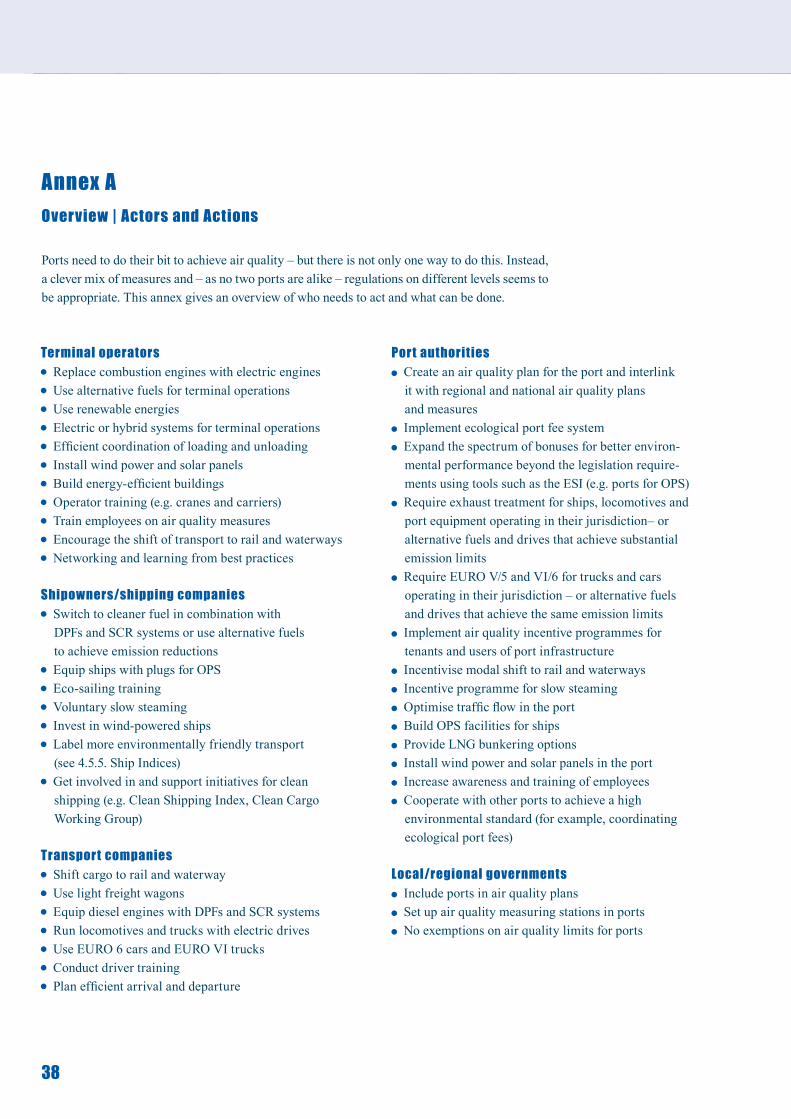
38
annex a
overview | actors and actions
Ports need to do their bit to achieve air quality – but there is not only one way to do this. Instead, a clever mix of measures and – as no two ports are alike – regulations on different levels seems to be appropriate. This annex gives an overview of who needs to act and what can be done.
terminal operators Replace combustion engines with electric engines Use alternative fuels for terminal operations Use renewable energies Electric or hybrid systems for terminal operations Efficient coordination of loading and unloading Install wind power and solar panels Build energy-efficient buildings Operator training (e.g. cranes and carriers) Train employees on air quality measures Encourage the shift of transport to rail and waterways Networking and learning from best practices
shipowners/shipping companies Switch to cleaner fuel in combination with
DPFs and SCR systems or use alternative fuels to achieve emission reductions
Equip ships with plugs for OPS Eco-sailing training Voluntary slow steaming Invest in wind-powered ships Label more environmentally friendly transport
(see 4.5.5. Ship Indices) Get involved in and support initiatives for clean
shipping (e.g. Clean Shipping Index, Clean Cargo Working Group)
transport companies Shift cargo to rail and waterway Use light freight wagons Equip diesel engines with DPFs and SCR systems Run locomotives and trucks with electric drives Use EURO 6 cars and EURO VI trucks Conduct driver training Plan efficient arrival and departure
Port authorities Create an air quality plan for the port and interlink
it with regional and national air quality plans and measures
Implement ecological port fee system Expand the spectrum of bonuses for better environ-
mental performance beyond the legislation require-ments using tools such as the ESI (e.g. ports for OPS)
Require exhaust treatment for ships, locomotives and port equipment operating in their jurisdiction– or alternative fuels and drives that achieve substantial emission limits
Require EURO V/5 and VI/6 for trucks and cars operating in their jurisdiction – or alternative fuels and drives that achieve the same emission limits
Implement air quality incentive programmes for tenants and users of port infrastructure
Incentivise modal shift to rail and waterways Incentive programme for slow steaming Optimise traffic flow in the port Build OPS facilities for ships Provide LNG bunkering options Install wind power and solar panels in the port Increase awareness and training of employees Cooperate with other ports to achieve a high
environmental standard (for example, coordinating ecological port fees)
local/regional governments Include ports in air quality plans Set up air quality measuring stations in ports No exemptions on air quality limits for ports
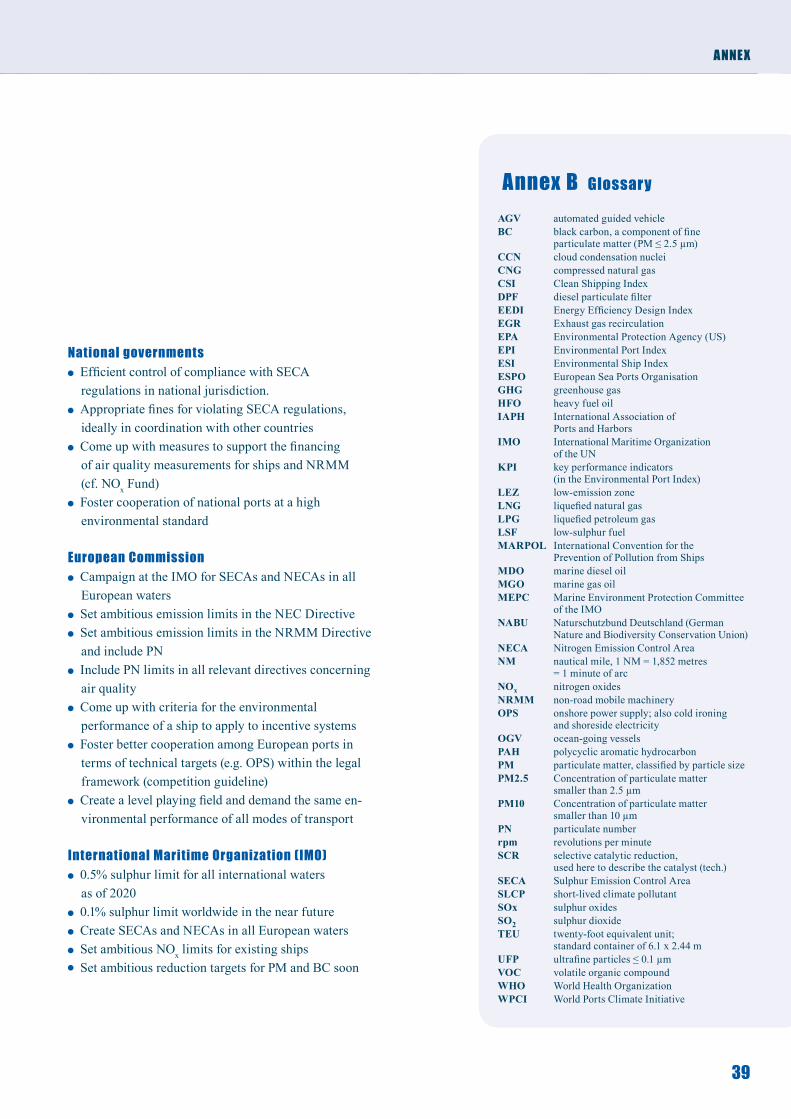
39
national governments Efficient control of compliance with SECA
regulations in national jurisdiction. Appropriate fines for violating SECA regulations,
ideally in coordination with other countries Come up with measures to support the financing
of air quality measurements for ships and NRMM (cf. NOx Fund)
Foster cooperation of national ports at a high environmental standard
european Commission Campaign at the IMO for SECAs and NECAs in all
European waters Set ambitious emission limits in the NEC Directive Set ambitious emission limits in the NRMM Directive
and include PN Include PN limits in all relevant directives concerning
air quality Come up with criteria for the environmental
performance of a ship to apply to incentive systems Foster better cooperation among European ports in
terms of technical targets (e.g. OPS) within the legal framework (competition guideline)
Create a level playing field and demand the same en-vironmental performance of all modes of transport
international Maritime organization (iMo) 0.5% sulphur limit for all international waters
as of 2020 0.1% sulphur limit worldwide in the near future Create SECAs and NECAs in all European waters Set ambitious NOx limits for existing ships Set ambitious reduction targets for PM and BC soon
annex B Glossary
AGV automated guided vehicleBC black carbon, a component of fine particulate matter (PM ≤ 2.5 µm)CCN cloud condensation nucleiCNG compressed natural gasCSI Clean Shipping IndexDPF diesel particulate filterEEDI Energy Efficiency Design IndexEGR Exhaust gas recirculation EPA Environmental Protection Agency (US)EPI Environmental Port IndexESI Environmental Ship IndexESPO European Sea Ports OrganisationGHG greenhouse gasHFO heavy fuel oilIAPH International Association of Ports and HarborsIMO International Maritime Organization of the UNKPI key performance indicators (in the Environmental Port Index)LEZ low-emission zoneLNG liquefied natural gasLPG liquefied petroleum gasLSF low-sulphur fuelMARPOL International Convention for the Prevention of Pollution from ShipsMDO marine diesel oilMGO marine gas oilMEPC Marine Environment Protection Committee of the IMONABU Naturschutzbund Deutschland (German Nature and Biodiversity Conservation Union)NECA Nitrogen Emission Control AreaNM nautical mile, 1 NM = 1,852 metres = 1 minute of arcNOx nitrogen oxidesNRMM non-road mobile machineryOPS onshore power supply; also cold ironing and shoreside electricityOGV ocean-going vesselsPAH polycyclic aromatic hydrocarbon PM particulate matter, classified by particle sizePM2.5 Concentration of particulate matter smaller than 2.5 µmPM10 Concentration of particulate matter smaller than 10 µmPN particulate numberrpm revolutions per minuteSCR selective catalytic reduction, used here to describe the catalyst (tech.)SECA Sulphur Emission Control AreaSLCP short-lived climate pollutantSOx sulphur oxidesSO2 sulphur dioxideTEU twenty-foot equivalent unit; standard container of 6.1 x 2.44 m UFP ultrafine particles ≤ 0.1 µmVOC volatile organic compoundWHO World Health OrganizationWPCI World Ports Climate Initiative
annex
40
annex C Contacts
This is a list of companies, individuals and institutions that have spoken at our workshops or that contributed to the project in other ways. The list does not claim to be exhaustive in terms of institutions, companies and individuals that can be helpful to learn more about and imple-ment measures to counteract air pollution in ports.
AirClim, Air Pollution & Climate SecretariatGothenburg, Sweden CHRISTER Å[email protected] www.airclim.org
Antwerp Port Authority Antwerp, Belgium LUC VAN ESPENTechnisch Manager [email protected] www.portofantwerp.com
ARMAAG FoundationGdansk, Poland MICHALINA BIELAWSKAmichalina.bielawska @armaag.gda.plwww.armaag.gda.pl
Axel Friedrich, International Consultant, Germany DR AxEL [email protected]
Becker Marine SystemsHamburg, Germany MAx [email protected]
City of Antwerp (Stad Antwerpen, Samen Leven)Antwerp, Belgium ERIK DE BRUYNCoördinator [email protected]
Clean Shipping Coalition JOHN MAGGS, [email protected] www.cleanshipping.org
Danish PortsCopenhagen, Denmark BJARNE LøF HENRIKSENCommercial and Political AdviserEU Affairs and [email protected]://danskehavne.dk
Environmental Ship Index (ESI)IAPH EuropeKK Nieuwerkerk IJsselThe Netherlands FER VAN DE LAR Managing [email protected]://www.iaphworldports.org/http://esi.wpci.nl/Public/Home
EcoPortsBrussels, Belgium DR ANTONIS MICHAILEcoPorts [email protected]/
European Sea Ports Organisation (ESPO)Brussels, Belgium ANTONIS MICHAIL Senior Advisor, Environment, Health, Safety and [email protected] www.espo.be/
EurogateHamburg, Germany HANNA BLANCHETUmweltmanagement/[email protected]
Flemish Government. The Environment, Nature and Energy Department Division Air, Nuisance, Risk management, Environment & Health Brussels, Belgium JASPER WOUTERSAir Quality Policy [email protected]/en
Future ShipHamburg, Germany DR URS VOGLERTeam Leader LNG & [email protected]
GreenPort CongressFareham, United Kingdom ISOBEL ROBERTSHead of [email protected] www.greenport.com
Hamburger Hafen und Logistik AGHamburg, Germany JAN HENDRIK PIETSCHCorporate Sustainability [email protected]://hhla.de/en/home.html
Hamburg Port AuthorityHamburg, Germany MANFRED LEBMEIERLeiter Umweltstrategie [email protected] www.hamburg-port-authority.de
Hapag-Lloyd AGHamburg, Germany CAPTAIN WOLFRAM GUNTERMANN, Director Environmental Fleet Management, Ship [email protected] https://www.hapag-lloyd.de
King’s College London, Environmental Research GroupLondon, United KingdomSTEPHEN HEDLEYPrincipal Environmental Health [email protected]/lsm/research/divisions/aes/research/ERG/index.aspx
NABU Headquarters Berlin, GermanyJULIA BALZTransport Policy [email protected]
NABU Regional Office HamburgHamburg, GermanyMALTE SIEGERTHead Environmental [email protected]
annex
North Sea FoundationUtrecht, The Netherlands EELCO LEEMANSExecutive [email protected]
MSC Home TerminalsAntwerp, Belgium JAN CUPPENSManager Technology and Projects [email protected]/bel
Port Feeder BargeHamburg, Germany PROF. ULRICH [email protected]
Port of Los AngelesLos Angeles, USA LISA WUNDERAssistant Supervisor Air QualityEnvironmental Management [email protected]
Port of MagdeburgMagdeburg, Germany KARL-HEINZ [email protected]
Port of OaklandOakland, USA RICHARD SINKOFFDirector of Environmental Programs and [email protected]
Ports of StockholmStockholm, Sweden GUN RUDEBERGLegal Counsel and Head of Environmental Affairs [email protected] www.stoports.com
Scandlines Deutschland GmbHJOHANNES WASMUTHSenior Captain [email protected]
Seas At RiskBrussels, BelgiumJOHN MAGGSSenior Policy [email protected] www.seas-at-risk.org
Siemens eHighwayGermany HASSO GRüNJESMobility & Logistics [email protected]
StarcrestUSA BRUCE ANDERSONPrincipalAir Quality [email protected]
The International Council on Clean Transportation (ICCT)Washington DC, USA Dr Haifeng WangSenior Policy [email protected]
Transport and EnvironmentBrussels, Belgium SOTIRIS RAPTISPolicy [email protected] www.transportenvironment.org
DCE – Danish Centre for Environment and Energy at Aarhus UniversityCopenhagen, Denmark HELGE RøRDAM OLESENSenior [email protected] http://dce.au.dk/en/authorities/air/
Wärtsilä Moss AS., OsloOslo, NorwayOLE-JOHAN øBY SVENDSENSales [email protected]
ZAUM - Center of Allergy & Environmenta joint institute of the Technische Universität München and Helmholtz Zentrum MünchenPROF DR JEROEN BUTERS [email protected] Zentrum München – German Research Centre for Environmental Health PROF DR RALF ZIMMERMANNSpokesperson of the Virtual Institute [email protected]
1 http://ec.europa.eu/environment/pubs/pdf/factsheets/air/en.pdf 2 J. Brandt et al. (2011) http://ceeh.dk/CEEH_Reports/Report_3/CEEH_Scientific_Report3.pdf3 www.iarc.fr/en/media-centre/pr/2012/pdfs/pr213_E.pdf 4 www.iarc.fr/en/media-centre/pr/2012/pdfs/pr213_E.pdf 5 http://pubs.acs.org/doi/pdf/10.1021/es071686z6 http://acm.eionet.europa.eu/docs/ETCACC_TP_2009_1_European_PM2.5_HIA.pdf and
www.eea.europa.eu/soer/synthesis/synthesis/chapter5.xhtml 7 www.epa.gov/airscience/air-blackcarbon.htm8 Posch, Slootweg, Hettelingh (eds). (2012): Modeling and mapping of atmospherically induced ecosystem impacts in Europe.
Coordination Centre for Effects, the Netherlands. http://wge-cce.org/Publications/CCE_Status_Reports/Status_Report_20129 www.juraforum.de/wissenschaft/wie-feinstaeube-zum-waldsterben-beitragen-443420 10 http://unfccc.int/files/press/application/pdf/slcp_timetoact_graphic.pdf11 http://theicct.org/sites/default/files/publications/ICCT_black-carbon-maritime-shipping_20150324.pdf 12 www.theicct.org/blogs/staff/edit-blog-post-arctic-maritime-shipping-and-black-carbon 13 www.eeb.org/EEB/?LinkServID=29F833A5-5056-B741-DBC48B05D65EEE0614 www.transportenvironment.org/sites/te/files/media/Slow%20steaming%20CE%20Delft%20final.pdf 15 www.theicct.org/sites/default/files/publications/ICCTwhitepaper_MarineLNG_130513.pdf16 www.nabu.de/downloads/150312-Scrubbers.pdf17 www.nabu.de/downloads/150312-Scrubbers.pdf18 www.clean-baltic-sea-shipping.com/uploads/files/Clean_Baltic_Sea_Shipping_Position_Document.pdf
Each year more than 400,000 people die prematurely from the direct consequences of poor air quality through-out the European Union. That is one of the reasons why in September 2012, the German Nature and Biodiversity Conservation Union (NABU) and eight environmental organizations from six European countries started the EU-LIFE+ project Clean Air, campaigning for better air quality throughout Europe. The project is supported by the EU-Commission. Please find further Information on the project at www.cleanair-europe.org
t h e e U - P r o j e c t C l e a n a i r
a project by
project coordination
co-financed by the EU’s LIFE financial instrument associated campagne