Embed Size (px)
Citation preview
Clay NeslerVP, Global Energy and SustainabilityPulse 2010 Summit – Las Vegas 22 February 2010
Smart BuildingsIntegrated Energy and Asset Management

Copyright 2010 – Johnson Controls, Inc.
Introduction
• Johnson Controls is a global leader in facility management, energy management and building systems technology
Manage 1.3B ft2 in 75 countries; process 10M work orders per year
Manage $1B of energy spend and 63 million metric tons of GHG emissions for 5,000 buildings located in 88 countries
Installed 25,000 Building Management Systems in 125 countries
• IBM is a global leader in asset management, network management, advanced analytics and data visualization
• Together, our integrated smart building solutions can provide 10-20% savings in energy costs, greenhouse gas emissions, real estate footprint, asset inventory and maintenance costs
2
Copyright 2010 – Johnson Controls, Inc.
0
9
18
0
2
4
6
8:00 PM 12:00 AM 4:00 AM 8:00 AM 12:00 PM 4:00 PM
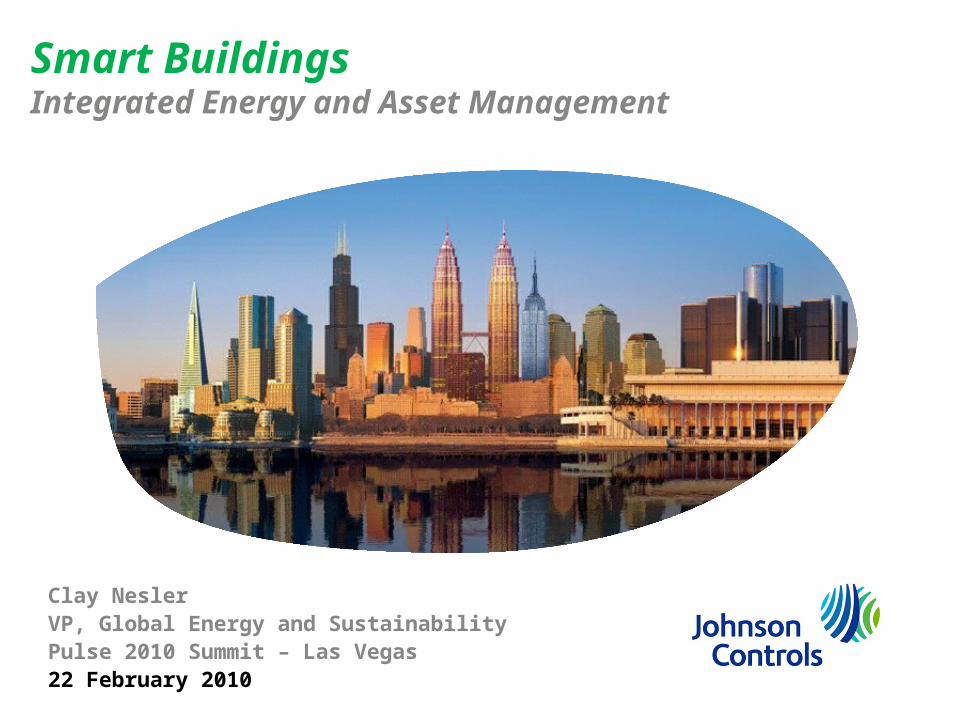
Typical Profile Smart Building Profile Electricity Price (¢/kWh)Building Power Demand (W/sf)
PowerPrice
(¢/kWh)
Smart Buildings for a Smart Grid
A Day in the Life
How the smart grid building manager will create business value in, for example, a 500,000 sq. ft tenant-occupied office building on an hourly real
time electricity pricing tariff
3
Copyright 2010 – Johnson Controls, Inc.
0
9
18
0
2
4
6
8:00 PM 12:00 AM 4:00 AM 8:00 AM 12:00 PM 4:00 PM
Typical Profile Smart Building Profile Electricity Price (¢/kWh)Building Power Demand (W/sf)
PowerPrice
(¢/kWh)
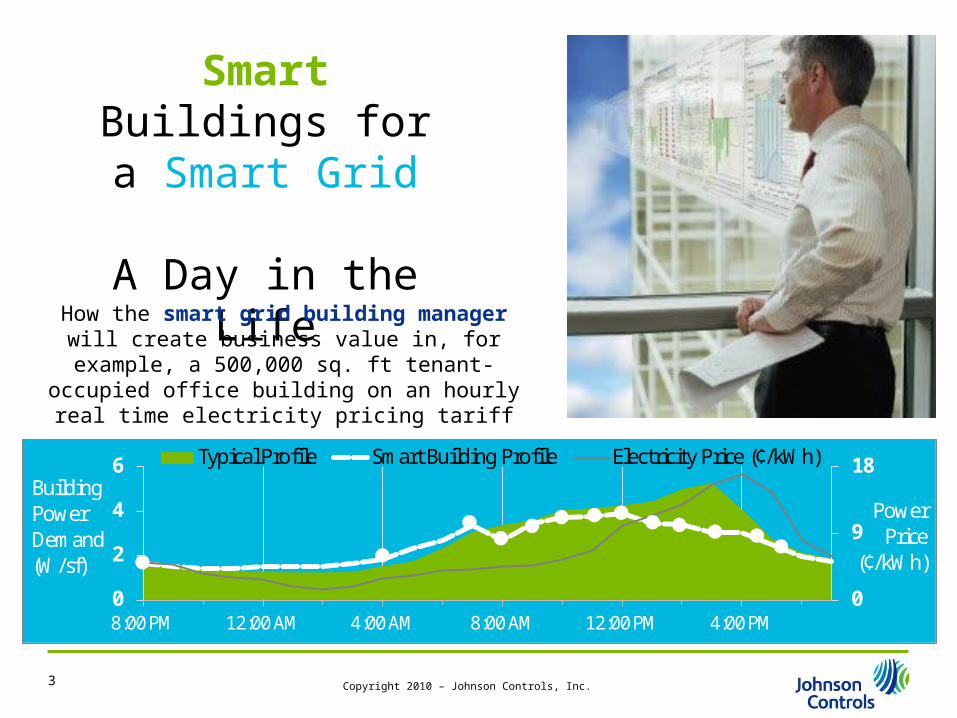
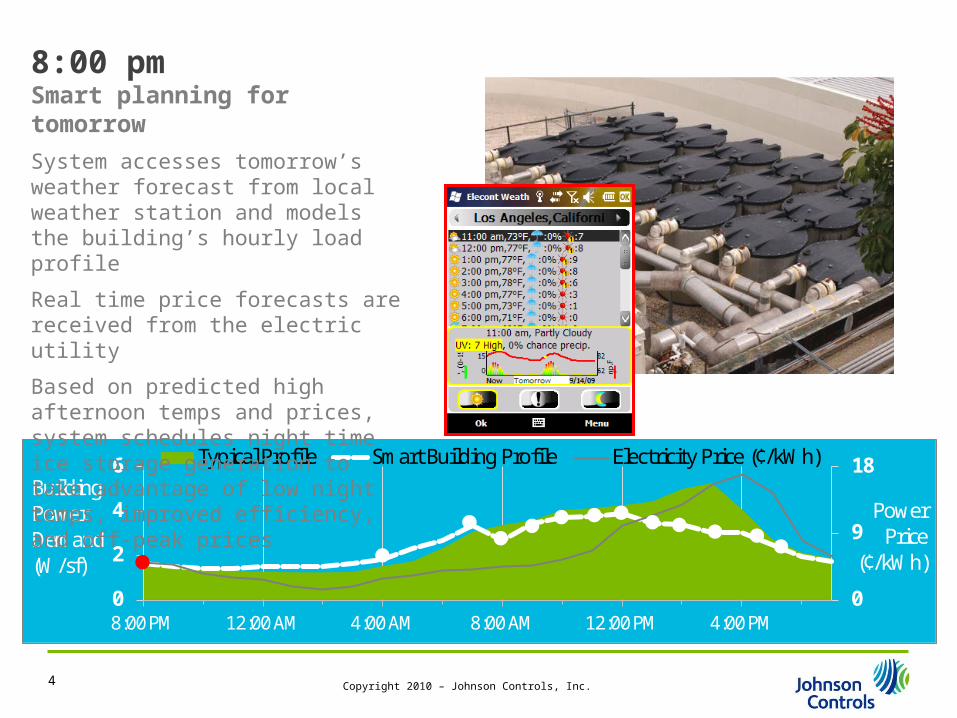
8:00 pmSmart planning for tomorrow
System accesses tomorrow’s weather forecast from local weather station and models the building’s hourly load profile
Real time price forecasts are received from the electric utility
Based on predicted high afternoon temps and prices, system schedules night time ice storage generation to take advantage of low night temps, improved efficiency, and off-peak prices
93°F94°F
97°F98°F98°F98°F98°F98°F
4

Copyright 2010 – Johnson Controls, Inc.
0
9
18
0
2
4
6
8:00 PM 12:00 AM 4:00 AM 8:00 AM 12:00 PM 4:00 PM
Typical Profile Smart Building Profile Electricity Price (¢/kWh)Building Power Demand (W/sf)
PowerPrice
(¢/kWh)
4:00 amChiller fault detected
During night time ice generation, the diagnostics engine determines a chiller valve has failed, resulting in a reduction in glycol flow, system efficiency, and ice storage charging speed
System calculates costs associated with this fault based on real time price forecasts
Due to the high projected cost impact, the system auto-generates a work order and notifies facility manager by smart phone for approval
5
Copyright 2010 – Johnson Controls, Inc.
0
9
18
0
2
4
6
8:00 PM 12:00 AM 4:00 AM 8:00 AM 12:00 PM 4:00 PM
Typical Profile Smart Building Profile Electricity Price (¢/kWh)Building Power Demand (W/sf)
PowerPrice
(¢/kWh)
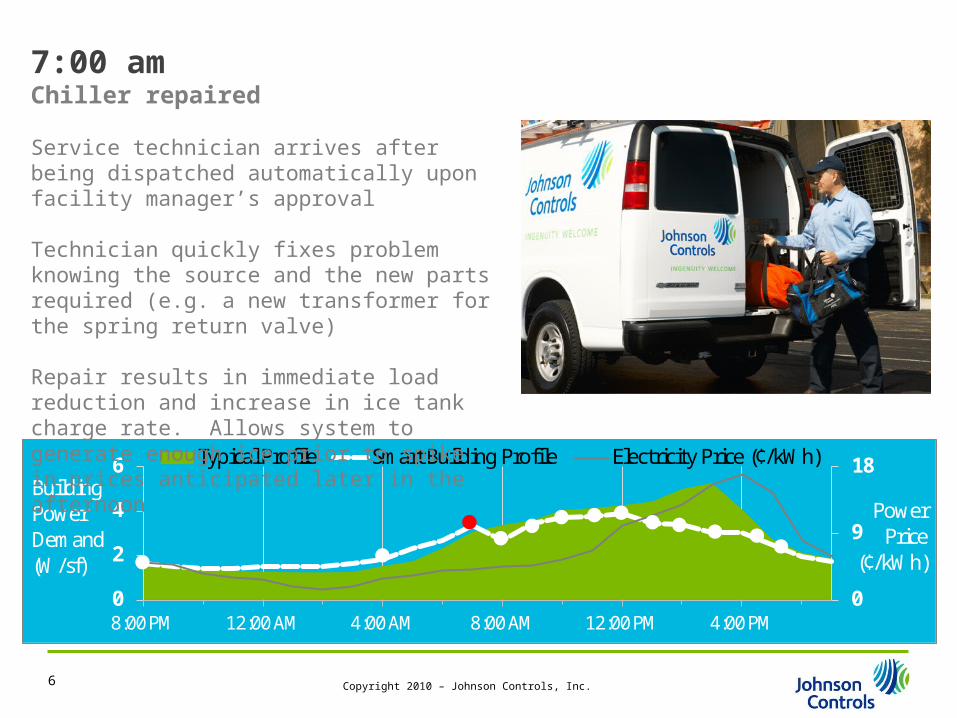
7:00 amChiller repaired
Service technician arrives after being dispatched automatically upon facility manager’s approval
Technician quickly fixes problem knowing the source and the new parts required (e.g. a new transformer for the spring return valve)
Repair results in immediate load reduction and increase in ice tank charge rate. Allows system to generate enough ice prior to spike in prices anticipated later in the afternoon
6
Copyright 2010 – Johnson Controls, Inc.
0
9
18
0
2
4
6
8:00 PM 12:00 AM 4:00 AM 8:00 AM 12:00 PM 4:00 PM
Typical Profile Smart Building Profile Electricity Price (¢/kWh)Building Power Demand (W/sf)
PowerPrice
(¢/kWh)
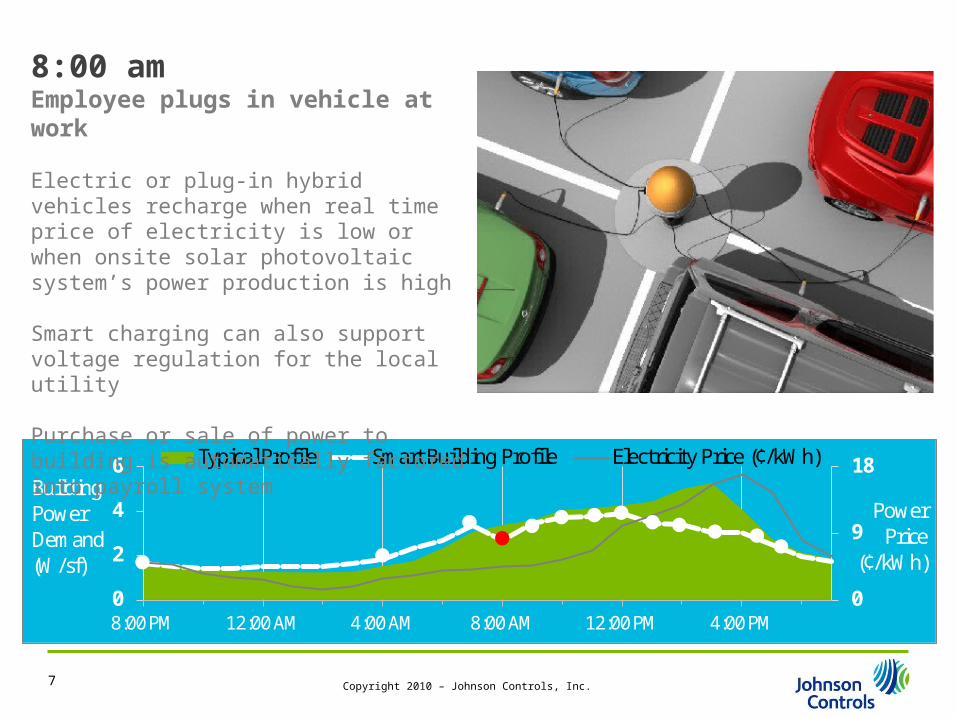
8:00 amEmployee plugs in vehicle at work
Electric or plug-in hybrid vehicles recharge when real time price of electricity is low or when onsite solar photovoltaic system’s power production is high
Smart charging can also support voltage regulation for the local utility
Purchase or sale of power to building is automatically factored into payroll system
7
Copyright 2010 – Johnson Controls, Inc.
0
9
18
0
2
4
6
8:00 PM 12:00 AM 4:00 AM 8:00 AM 12:00 PM 4:00 PM
Typical Profile Smart Building Profile Electricity Price (¢/kWh)Building Power Demand (W/sf)
PowerPrice
(¢/kWh)
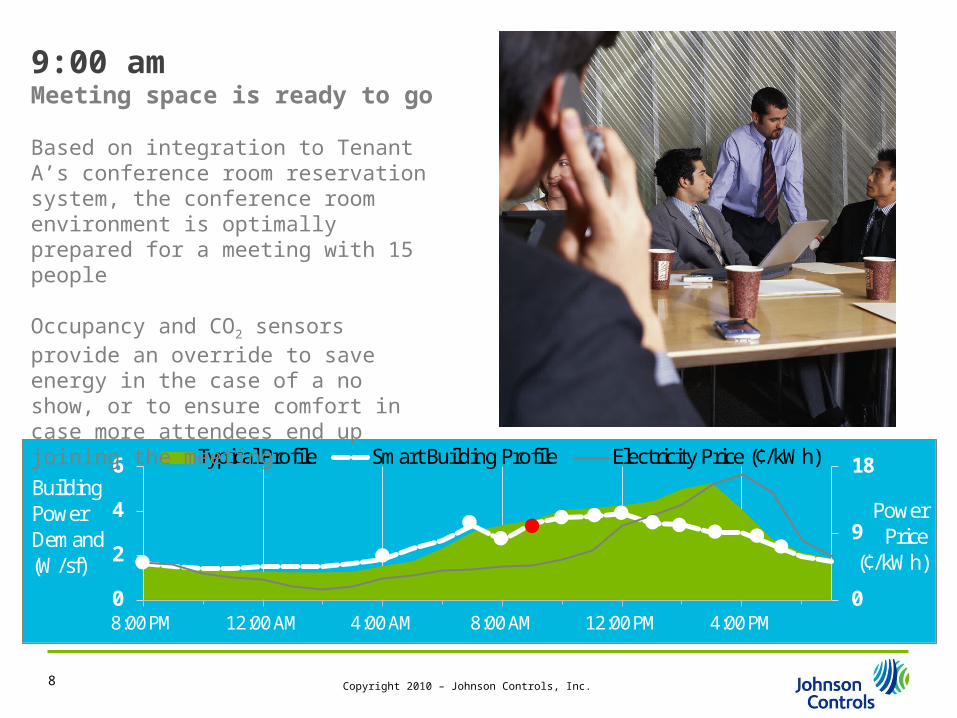
9:00 amMeeting space is ready to go
Based on integration to Tenant A’s conference room reservation system, the conference room environment is optimally prepared for a meeting with 15 people
Occupancy and CO2 sensors provide an override to save energy in the case of a no show, or to ensure comfort in case more attendees end up joining the meeting
8

Copyright 2010 – Johnson Controls, Inc.
0
9
18
0
2
4
6
8:00 PM 12:00 AM 4:00 AM 8:00 AM 12:00 PM 4:00 PM
Typical Profile Smart Building Profile Electricity Price (¢/kWh)Building Power Demand (W/sf)
PowerPrice
(¢/kWh)
10:00 amCFO calls for carbon reporting data
A market analyst firm has posed questions to a CFO about the business’ carbon risk and strategies that have been implemented to reduce the greenhouse gas intensity of the economy
At the click of a mouse, real estate executive pulls up data in an enterprise application dashboard for carbon emissions for the most recent quarter and the verified carbon reductions the organization has achieved through programs and projects
9
Copyright 2010 – Johnson Controls, Inc.
0
9
18
0
2
4
6
8:00 PM 12:00 AM 4:00 AM 8:00 AM 12:00 PM 4:00 PM
Typical Profile Smart Building Profile Electricity Price (¢/kWh)Building Power Demand (W/sf)
PowerPrice
(¢/kWh)
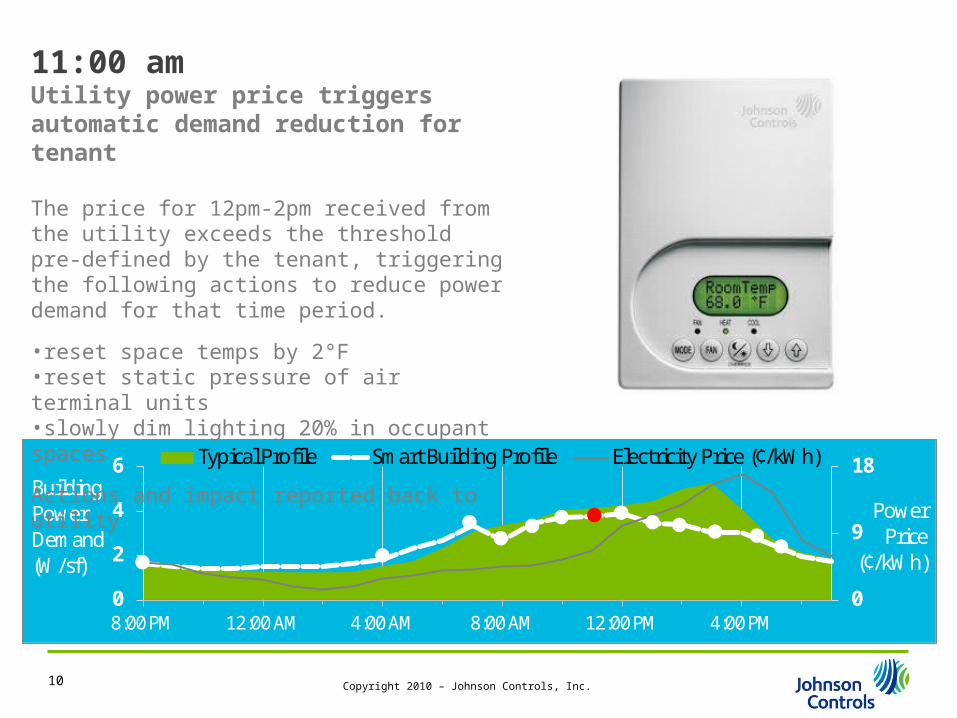
11:00 amUtility power price triggers automatic demand reduction for tenant
The price for 12pm-2pm received from the utility exceeds the threshold pre-defined by the tenant, triggering the following actions to reduce power demand for that time period.
•reset space temps by 2°F•reset static pressure of air terminal units•slowly dim lighting 20% in occupant spaces
Actions and impact reported back to utility
10
Copyright 2010 – Johnson Controls, Inc.
0
9
18
0
2
4
6
8:00 PM 12:00 AM 4:00 AM 8:00 AM 12:00 PM 4:00 PM
Typical Profile Smart Building Profile Electricity Price (¢/kWh)Building Power Demand (W/sf)
PowerPrice
(¢/kWh)
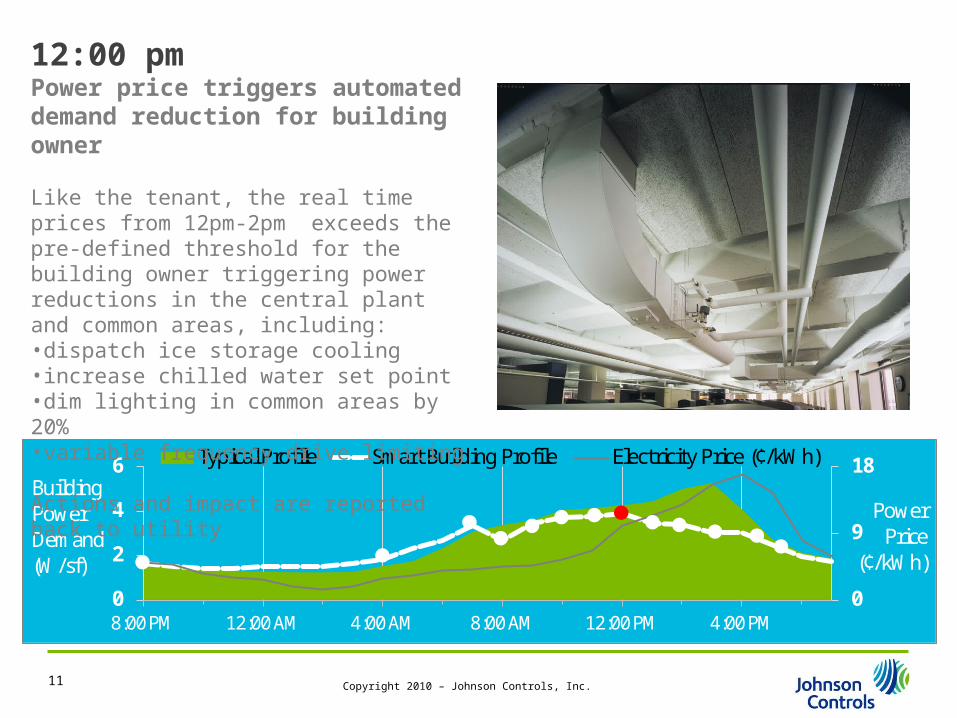
12:00 pmPower price triggers automated demand reduction for building owner
Like the tenant, the real time prices from 12pm-2pm exceeds the pre-defined threshold for the building owner triggering power reductions in the central plant and common areas, including:•dispatch ice storage cooling•increase chilled water set point•dim lighting in common areas by 20%•variable frequency drive limiting
Actions and impact are reported back to utility
11

Copyright 2010 – Johnson Controls, Inc.
0
9
18
0
2
4
6
8:00 PM 12:00 AM 4:00 AM 8:00 AM 12:00 PM 4:00 PM
Typical Profile Smart Building Profile Electricity Price (¢/kWh)Building Power Demand (W/sf)
PowerPrice
(¢/kWh)
1:00 pmPower price triggers triggers more aggressive automated reductions for tenant.
The real time price for 2pm-5pm from the utility well exceeds the defined threshold for the tenant triggering more aggressive power reductions, including:•dim lighting by 40% •reset space temps by 4°F•throttle non-production servers
Actions and impact reported back to utility
12
Copyright 2010 – Johnson Controls, Inc.
0
9
18
0
2
4
6
8:00 PM 12:00 AM 4:00 AM 8:00 AM 12:00 PM 4:00 PM
Typical Profile Smart Building Profile Electricity Price (¢/kWh)Building Power Demand (W/sf)
PowerPrice
(¢/kWh)
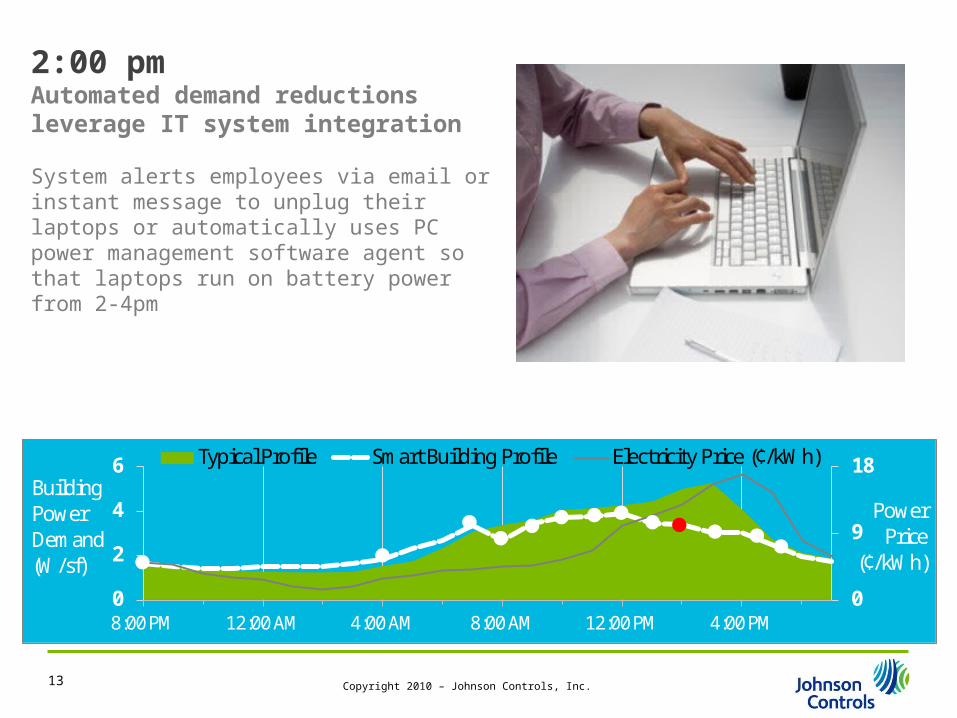
2:00 pmAutomated demand reductions leverage IT system integration
System alerts employees via email or instant message to unplug their laptops or automatically uses PC power management software agent so that laptops run on battery power from 2-4pm
13
Copyright 2010 – Johnson Controls, Inc.
0
9
18
0
2
4
6
8:00 PM 12:00 AM 4:00 AM 8:00 AM 12:00 PM 4:00 PM
Typical Profile Smart Building Profile Electricity Price (¢/kWh)Building Power Demand (W/sf)
PowerPrice
(¢/kWh)
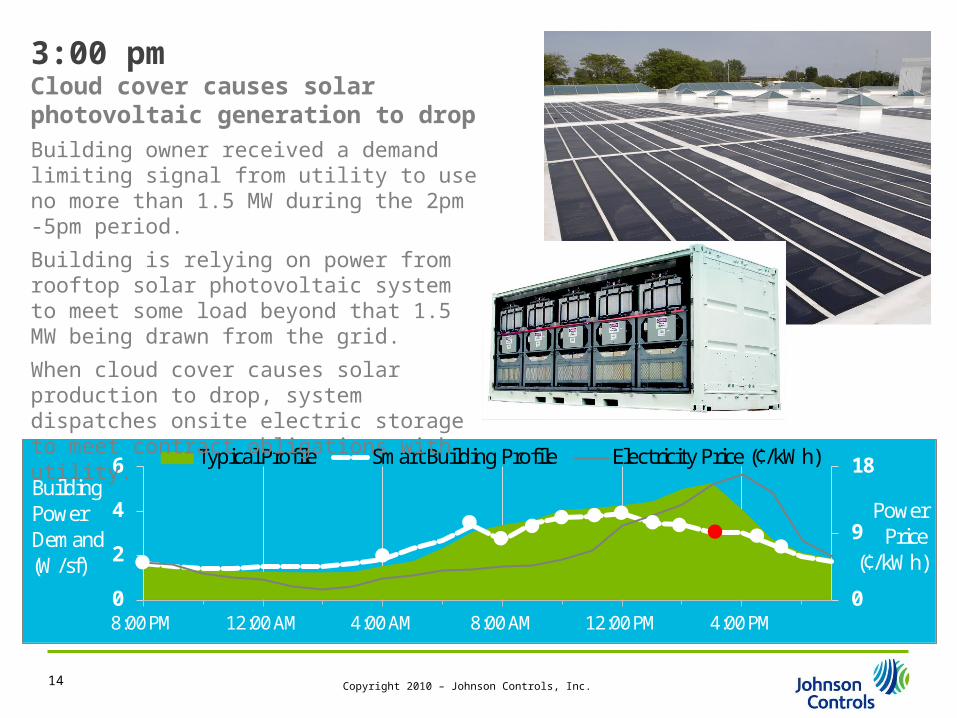
3:00 pmCloud cover causes solar photovoltaic generation to drop
Building owner received a demand limiting signal from utility to use no more than 1.5 MW during the 2pm -5pm period.
Building is relying on power from rooftop solar photovoltaic system to meet some load beyond that 1.5 MW being drawn from the grid.
When cloud cover causes solar production to drop, system dispatches onsite electric storage to meet contract obligations with utility.
14
Copyright 2010 – Johnson Controls, Inc.
0
9
18
0
2
4
6
8:00 PM 12:00 AM 4:00 AM 8:00 AM 12:00 PM 4:00 PM
Typical Profile Smart Building Profile Electricity Price (¢/kWh)Building Power Demand (W/sf)
PowerPrice
(¢/kWh)
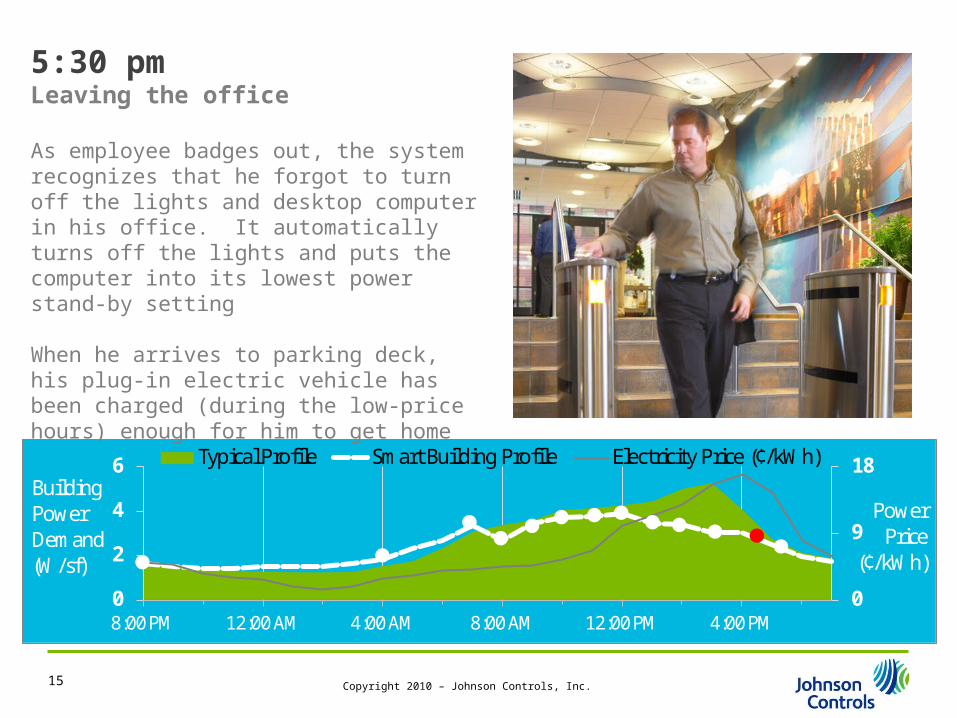
5:30 pmLeaving the office
As employee badges out, the system recognizes that he forgot to turn off the lights and desktop computer in his office. It automatically turns off the lights and puts the computer into its lowest power stand-by setting
When he arrives to parking deck, his plug-in electric vehicle has been charged (during the low-price hours) enough for him to get home
15

Copyright 2010 – Johnson Controls, Inc.
0
9
18
0
2
4
6
8:00 PM 12:00 AM 4:00 AM 8:00 AM 12:00 PM 4:00 PM
Typical Profile Smart Building Profile Electricity Price (¢/kWh)Building Power Demand (W/sf)
PowerPrice
(¢/kWh)
6:30 pmEnd of the workday
System controls lighting and HVAC to follow janitorial staff in order to maximize convenience while only lighting the occupied spaced in building
Video surveillance system counts occupants remaining in each part of the building after hours and adjusts zone set points and lighting accordingly
16
Copyright 2010 – Johnson Controls, Inc.
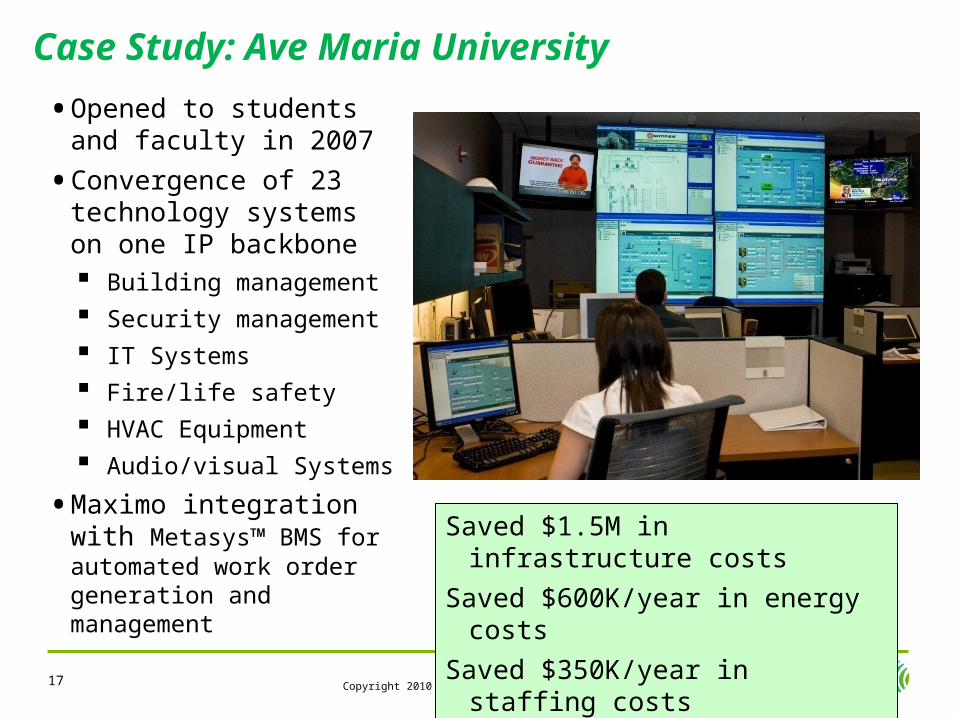
Case Study: Ave Maria University
17
• Opened to students and faculty in 2007
• Convergence of 23 technology systems on one IP backbone Building management
Security management
IT Systems
Fire/life safety
HVAC Equipment
Audio/visual Systems
• Maximo integration with Metasys™ BMS for automated work order generation and management
Saved $1.5M in infrastructure costs
Saved $600K/year in energy costs
Saved $350K/year in staffing costs
Copyright 2010 – Johnson Controls, Inc.
Energy ManagementEnergy Management
Building Use ManagementBuilding Use Management
Technical Operations (BMS)Technical Operations (BMS)
Life SafetyLife Safety
SecuritySecurity
CateringCatering
Interconnect ExperienceInterconnect Experience
Communications ConnectivityCommunications Connectivity
Office ServicesOffice Services
Visitor ManagementVisitor Management
Resource & Room BookingResource & Room Booking
Audio & Video ConferencingAudio & Video Conferencing
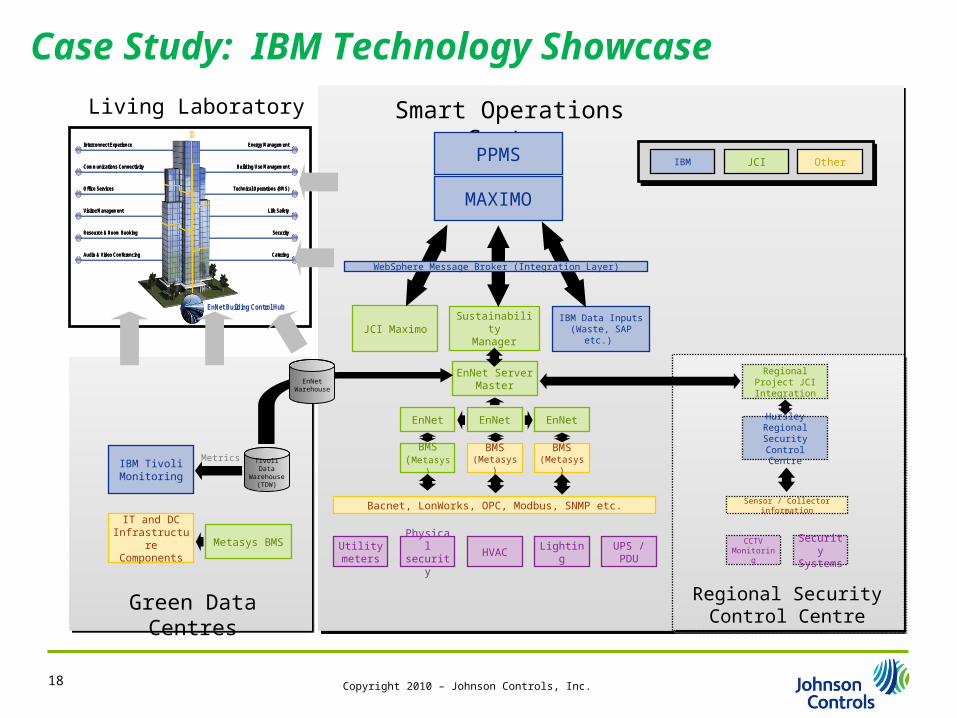
EnNet Building Control Hub
EnNet ServerMaster
Physical security
HVAC LightingUPS / PDU
Utility meters
Bacnet, LonWorks, OPC, Modbus, SNMP etc.
EnNet
BMS(Metasys)
EnNet
BMS(Metasys)
EnNet
BMS(Metasys)
SustainabilityManager
Smart Operations Centre
PPMS
JCI Maximo
IT and DCInfrastructureComponents
Metasys BMS
IBM TivoliMonitoring
Green Data Centres
Metrics
Regional Security Control Centre
Regional Project JCI Integration
Hursley Regional Security Control
Centre
CCTV Monitoring
Security Systems
Sensor / Collector information
IBM Data Inputs (Waste, SAP etc.)
EnNetWarehouse
Tivoli Data Warehouse
(TDW)
WebSphere Message Broker (Integration Layer)
IBM JCI Other
Living Laboratory
MAXIMO
Case Study: IBM Technology Showcase
18
Copyright 2010 – Johnson Controls, Inc.
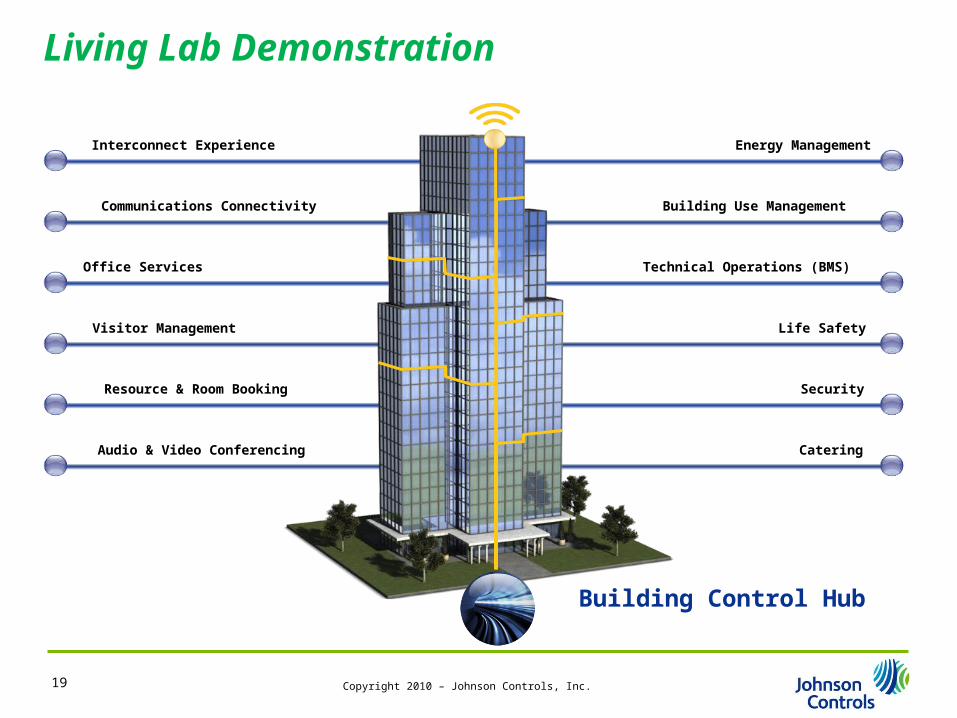
Living Lab Demonstration
Energy Management
Building Use Management
Technical Operations (BMS)
Life Safety
Security
Catering
Interconnect Experience
Communications Connectivity
Office Services
Visitor Management
Resource & Room Booking
Audio & Video Conferencing
Building Control Hub
19

Copyright 2010 – Johnson Controls, Inc.20
Smart BuildingsIntegrated Energy and Asset Management