Embed Size (px)
Citation preview

Scholars' Mine Scholars' Mine
Masters Theses Student Theses and Dissertations
1970
Clay mineralogy and compaction characteristics of residual clay Clay mineralogy and compaction characteristics of residual clay
soils used in earth dam construction in the Ozark Province of soils used in earth dam construction in the Ozark Province of
Missouri Missouri
Arthur David Alcott
Follow this and additional works at: https://scholarsmine.mst.edu/masters_theses
Part of the Civil Engineering Commons
Department: Department:
Recommended Citation Recommended Citation Alcott, Arthur David, "Clay mineralogy and compaction characteristics of residual clay soils used in earth dam construction in the Ozark Province of Missouri" (1970). Masters Theses. 7177. https://scholarsmine.mst.edu/masters_theses/7177
This thesis is brought to you by Scholars' Mine, a service of the Missouri S&T Library and Learning Resources. This work is protected by U. S. Copyright Law. Unauthorized use including reproduction for redistribution requires the permission of the copyright holder. For more information, please contact [email protected].
CLAY MINERALOGY AND COMPACTION CHARACTERISTICS OF RESIDUAL CLAY SOILS USED IN EARTH DAM CONSTRUCTION
IN THE OZARK PROVINCE OF MISSOURI
BY
ARTHUR DAVID ALCOTT, 1941-
A
THESIS
submitted to the faculty of
UNIVERSITY OF MISSOURI - ROLLA
in partial fulfillment of the requirements for the
Degree of
MASTER OF SCIENCE IN CIVIL ENGINEERING
Rolla, Missouri
1970 19C853

ii
ABSTRACT
The clay mineralogy and Standard Proctor compaction
characteristics of clayey residual soils developed on the
Salem Plateau of the Ozark Physiographic Province and used
in earth dam construction were studied.
A review of the geology of the Salem Plateau is
presented along with a discussion of the factors controlling
the development of soils on carbonate bedrock in a high
leaching environment. The predominant soil clay mineral
was found to be a poorly crystallized kaolinite rather
than halloysite as has been postulated by others. Minor
amounts of triple-layer minerals and an undetermined amount
of an alumino-silicate gel are indicated. The effects of
particle size and degree of crystallinity on the tests
used to determine clay mineralogy are discussed.
The effects of several soil properties on the
laboratory compaction of the clayey residual soils were
investigated. Since the clay mineralogy was similar for
all of the soils investigated, this factor was discarded
as not being responsible for compaction differences. The
percent clay was found to have the highest correlation
with the maximum dry density and the optimum moisture
content of the soils. The plastic limit and cation
exchange capacity were also closely correlated with the
compaction characteristics.
lll
It was determined that the pedular structure character
istic of the residual soils was not destroyed upon laboratory
compaction, particularly compaction dry of optimum moisture
content. A theory of the compaction of clay soils is
postulated which deals primarily with the behavior and
changes in this ped structure with increasing moisture
content.
Scanning electron microscopy was used to illustrate
points brought out in the discussions on the morphology of
the soil clays and on the compaction characteristics of
the clays.

iv
ACKNOWLEDGEMENT
I wish to thank my adviser, Dr. N. 0. Schmidt, for his
assistance and guidance during the period that I have
attended graduate school and particularly during the period
that this paper has been written.
I also wish to express my appreciation to Dr. William
Hayes, Chief Geologist, and the Missouri Geological Survey
for financing the expenses related to the gathering of the
test soils and other field data and for allowing the author
to initiate an electron microscope study at the Survey's
expense. Without this assistance, the project would not
have been feasible.
The clay mineralogy investigation required equipment
and technology found only from outside sources. I wish to
thank Mr. W. M. Dressel for permitting the DTA and TGA
studies to be performed at the U.S. Bureau of Mines, Rolla,
Missouri. I also acknowledge with thanks the assistance of
Mr. R. Rickey and Mr. M. Adams for performing the tests and
for their suggestions with regard to interpretation.
The transmission microscopy was performed by
Mr. Kuldip Chopra at the Ceramics Department, University of
Missouri - Rolla. The scanning electron microscopy
investigation was performed at the Materials Research Center,
also at the University of Missouri - Rolla. My sincere
thanks for their assistance.
Dr. W. D. Keller was most helpful in allowing the

v
author to use the x-ray diffraction facilities at the
University of Missouri - Columbia. His discussions regarding
testing technique and data interpretation were invaluable
to this study.
Special thanks is also offered to Dr. J. L. Eades of
the Geology faculty of the University of Illinois. His
independent analysis of the nature of the clay mineralogy
substantiated that of the author and is most appreciated.
The encouragement and assistance over the past two
years of Mr. J. H. Williams and Mr. E. E. Lutzen of the
Missouri Geological Survey is gratefully acknowledged.
Finally I wish to thank my wife, Molly, for her
understanding and help, particularly during the period
when this paper was being prepared.

vi
TABLE OF CONTENTS
ABSTRACT . . . .
ACKNOWLEDGEMENT
LIST OF FIGURES
LIST OF TABLES .
Page
ii
iv
X
xiv
I.
II.
II I.
IV.
v.
INTRODUCTION
LITERATURE REVIEW . .
A. GEOLOGY . . . . ..
B. SOIL FORMATION
1
5
5
8
1. Soils derived from limestones . . . . 8
2. Formation of Kaolins 11
3. Kaolinite morphology . . . . . 12
C. COMPACTION CHARACTERISTICS . . . . 15
1. Soil gradation and index properties . 16
2. Cation-exchange capacity
3. Clay particle structure .
FIELD INVESTIGATION . . . . . . . .
MATERIALS . . . . . .
TEST PROCEDURES . . . . . . . A. SOIL GRADATION . . . . . . . . . . . .
1. Sample preparation . . .
2. Coarse sieve analysis . . . .
3. Hydrometer analysis . . . . . . . . ·
B. ATTERBERG LIMITS TESTS ....... · · ·
1. Liquid limits .. . . .
18
26
32
35
40
40
40
40
41
41
41

Table of Contents Continued
2. Wet liquid limits
3. Dispersed liquid limit .
4 . Plastic limits .
C. MOISTURE-DENSITY RELATIONSHIPS
1 . Natural samples . . 2 . Dispersed samples . . .
D. X-RAY DIFFRACTION . . . . . . . 1. General . . . . . . . . . . . . 2 . Preparation of samples . 3. Powdered samples . . . . . . . 4. Potassium acetate treatment
E. DIFFERENTIAL THERMAL ANALYSIS . 1. General . . . . . 2 . Sample preparation and testing .
F. THERMOGRAVIMETRIC ANALYSIS . . . . . G. TRANSMISSION ELECTRON MICROSCOPY (TEM)
H. SCANNING ELECTRON MICROSCOPY (SEM) . I . LOW-POWER MICROSCOPY (LPM)
J. SOIL CLAY CHEMISTRY . . . . . 1 . General . . . . . . . . 2 . Chemical analysis . . . . 3 . Soil pH in water . . . 4. Cation-exchange capacity
5. Flame photometry . . . . . 6. Absorption spectrophotometry . .
K. SPECIFIC GRAVITY . . . . . . . . . .
. .
. .
. .
. .
. .
. .
. .
. .
. .
. .
. .
. .
. .
. . .
. .
. .
.
.
.
.
.
.
.
.
.
.
.
.
.
.
.
vii
Page
41
42
53
53
53
53
55
55
57
58
58
60
60
61
63
64
66
72
72
72
72
73
75
75
77
77

viii
Table of Contents Continued Page
L. CORRELATION TESTS 79
VI. ANALYSIS OF RESULTS 82
A. CLAY MINERALOGY . 1 . X-ray analysis . 2 . Differential thermal analysis
3 . Thermogravimetric analysis
4. Electron microscopy
5 . Chemical analysis
6. Summary . . .
. . . 82
82
90
100
102
110
112
B. SOIL CLASSIFICATION AND CATION-EXCHANGE CAPACITY . . . . . 113
C. COMPACTION CHARACTERISTICS 123
1. Atterberg Limits . . . 123
2. Gradation and cation-exchange capacity 135
3. Soil clay structure 135
VII. CONCLUSIONS 147
A. GENERAL . 147
B. CLAY MORPHOLOGY 147
C. SOIL CLASSIFICATION AND CATION-EXCHANGE CAPACITY . . . . . . . . . . . 148
D. CORRELATIONS WITH COMPACTION RESULTS 150
E. THEORY OF RESIDUAL SOIL COMPACTION 150
F. APPLICATION OF TEST RESULTS . 152
1. Correlations 152
2. Dam design - construction 152
G. RECOMMENDATIONS FOR FURTHER STUDY 157
VIII. APPENDIX A - Dam Reports 159

Table of Contents Continued
IX. BIBLIOGRAPHY .
X. VITA ....
lX
Page
176
184

Figure
1.
2 •
3 .
4 .
5 .
6 .
7 .
8.
9 .
10.
11.
1 2 .
13.
14.
15.
16.
17.
18.
LIST OF FIGURES
Clay Distribution in Clarksville Soil (from Scrivner, 1960).
Location of Dam Sites.
Particle-Size Analysis of Masters #1 and Masters # 2 .
Particle-Size Analysis of Terre Du Lac and Timberline .
Particle-Size Analysis of Sayers, Little Prarie, and Blackwell.
Particle-Size Analysis of Floyd, Ft. Westside, and Rice .
Particle-Size Analysis of Sunrise Central, Sunrise South, and Fabick.
Particle-Size Analysis of Hornsey, Elsey, and Sunnen .
Plasticity Chart Plot of Ozark Soils .
X-Ray Diffractograms of the Sayers Soil.
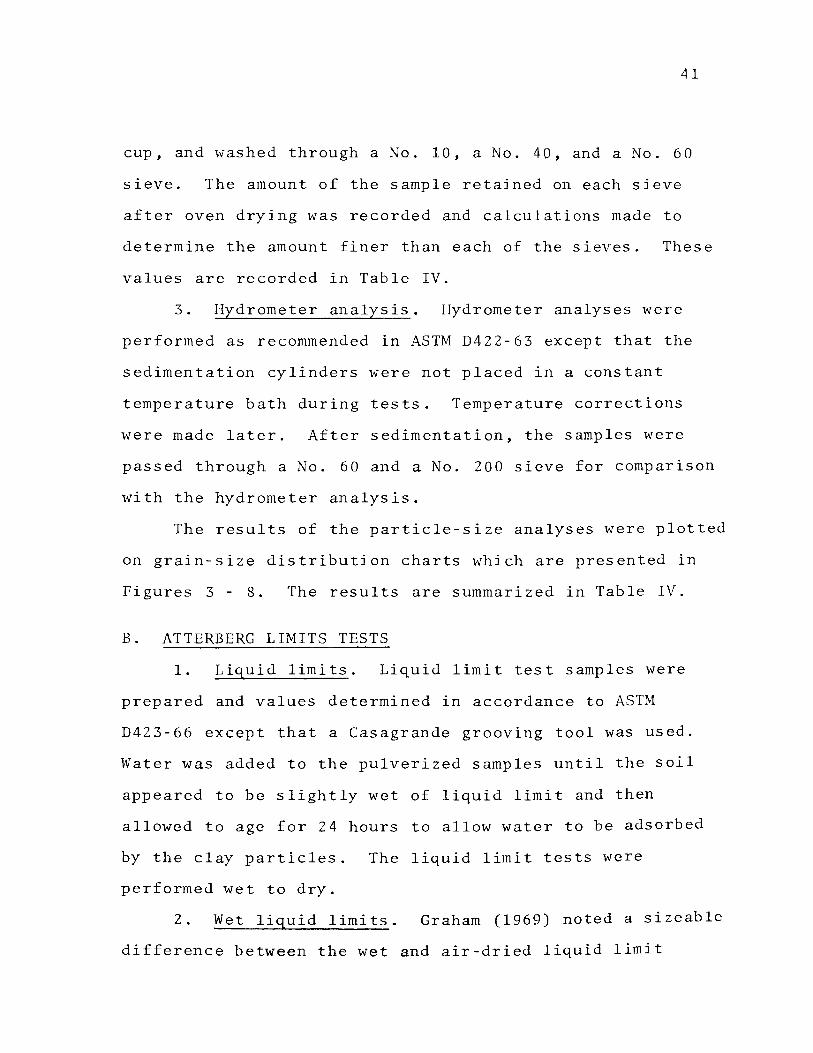
X-Ray Diffractograms of the Masters #1, Timberline, and Terre Du Lac Soils .
Shift in 001 Peak of Georgia Kaolinite When Treated With Potassium Acetate . Differential Thermal Analysis of Georgia Kaolinite and Indiana Halloysite . Differential Thermal Analysis of Ozark Soils
Differential Thermal Analysis of Ozark Soils
Differential Thermal Analysis of Ozark Soils
Differential Thermal Analysis of Ozark Soils
Thermogravimetric Analysis .
X
Page
10
33
44
45
46
47
48
49
52
85
86
87
93
. 94
. 95
. 96
. 97
101

List of Figures continued
Figure 19. TEM Terre DuLac Suspended Sample
2 0 •
21.
2 2.
2 3.
24.
25.
26.
2 7.
28.
29.
30.
31.
(57000X) ..... .
TEM Terre Du Lac Suspended Sample (52000X) ..... .
TEM Terre Du Lac (28000X) .....
Suspended Sample
TEM Terre Du Lac Suspended Sample (20000X). . ..
SEM Terre Du Lac (1000X) .
Powdered Sample
SEM Hornsey (3000X)
Powdered Sample
SEM Hornsey (3000X) ...
SEM Hornsey (10000X).
SEM Hornsey (10000X). . .
Ped Sample
Ped Sample . . . . . . . . Ped Sample . . . . . .
SEM Terre Du Lac Ped Sample (10000X) .......... .
SEM Timberline (10000X) ....
Ped Sample
. .
Clay Content Versus Liquid Limit (Clay Residual Soils) . . . . . .
Clay Content Versus Plastic Limit (Clay Residual Soils)
.
.
xi
Page
103
103
104
104
105
105
106
. . . . . . 106
. . . . . . 108
108
109
115
116
32. Cation-Exchange Capacity Versus Liquid Limit (Clay Residual Soils) . . . . . . . . . . . 118
33. Cation-Exchange Capacity Versus Plastic Limit (Clay Residual Soils) . . . . . . . . . . . . . 119
34. Cation-Exchange Capacity Versus Clay Content (All Soils) . . . . . . . . . . . . . . . 120
35. Clay Content Versus Maximum Dry Density (Clay Residual Soils) . . . ... 124

List of Figures continued
Figure
36.
37.
38.
39 .
40.
41.
42.
43.
44.
45.
46.
47.
48.
49.
50.
Clay Content Versus Optimum Moisture Content (Clay Residual Soils). . . . . . .
Cation-Exchange Capacity Versus Maximum Dry Density (Clay Residual Soils) .
Cation-Exchange Capacity Versus Optimum Moisture Content (Clay Residual Soils) ..
Liquid Limit Versus Maximum Dry Density (Clay Residual Soils).
Liquid Limit Versus Optimum Moisture Content (Clay Residual Soils). . ..
Plastic Limit Versus Maximum Dry Density (Clay Residual Soils). . . ..
Plastic Limit Versus Optimum Moisture Content (Clay Residual Soils). . . . . ..
Clay Content Versus Maximum Dry Density (All Soils) ....
Clay Content Versus Optimum Moisture Content (All Soils) .
Optimum Moisture Content Versus Maximum Dry Density (Clay Residual Soils)
LPM a.) b . )
LPM a.) b.)
SEM a.) b.)
SEM a.) b.)
SEM a.) b.)
Terre Du Lac (Black and White) Compacted 3% Dry of Optimum Compacted 5% Wet of Optimum
Terre Du Lac (Color) Compacted 3% Dry of Optimum Compacted 5% Wet of Optimum
Terre Du Lac (lOOX) •• Compacted 3% Dry of Optimum Compacted 5% Wet of Optimum
Terre DuLac (300X). Compacted 3% Dry of Optimum Compacted 5% Wet of Optimum
Terre Du Lac (3000X) Compacted 3% Dry of Optimum Compacted 5% Wet of Optimum
. . . .
xii
Page
125
126
127
128
129
130
131
132
133
134
137
138
140
141
142

xiii
List of Figures continued
Figure Page
51. The Effect of Dispersion of the Standard Proctor Compaction of Clayey Residual Soils. . 146
52. Graphical Relationship of the Maximum Dry Density to the Plastic Limit and the Clay Content of the Clayey Residual Soils . . 153
53. Graphical Relationship of the Optimum Moisture Content to the Plastic Limit and the Clay Content of the Clayey Residual Soils . . 154
54. Graphical Relationship of the Maximum Dry Density to the Plasticity Index and the Liquid Limit of all Soils. . 155
55. Graphical Relationship of the Optimum Moisture Content to the Plasticity Index and the Liquid Limit of all Soils . . 156

Table
I.
II.
I I I.
IV.
V.
VI.
VII.
VIII.
IX.
X.
XI.
XII.
XIII.
XIV.
XV.
LIST OF TABLES
Affect of Crystal Structure on CationExchange Capacity (after Kelley and Jenny).
Material of Dams Investigated
Comparison of Natural Field Moisture With Atterberg Limits .
Summary of Particle Size Analysis .
Comparison of Wet Liquid Limit And Natural Atterberg Limits.
Comparison of Natural and Dispersed Atterberg Limits.
Summary of Atterberg Limits Tests
Result of Moisture-Density Tests.
X-Ray Machine Specifications.
Summary of Major DTA Temperature Peaks.
Chemical Analysis of Ozark Soils.
Summary of pH and Cation-Exchange Capacity of Ozark Soils.
Concentration of Mg, Ca, Na, and K Cations in meq/100 grams.
Specific Gravity of Ozark Soils
Correlations for Clayey Residual Ozark Soils.
xiv
Page
22
36
39
43
so
so
51
54
56
62
67
74
76
78
80

1
I. INTRODUCTION
Missouri has approximately 1600 man-made earth dams, as
many or possibly more than any other state in the Union.
About 700 of these dams are located in the Ozark
Physiographic Province, a series of plateau surfaces
developed principally on Paleozoic carbonate bedrock
formations. A mantle of clayey residual soils up to 200
feet thick overlies these bedrock surfaces.
Earth dams constructed in this area, particularly
those constructed of the clayey residual soils, have a
history of poor performance. Excess seepage, slope
instability, piping, and total embankment failures have
occured. Further problems will emerge as urban expansion
and increasing numbers of recreational lake developments
extend into the area. The purpose of this investigation
is to study the nature of these residual soils, the factors
which affect the compaction of the soils, and to recommend
procedures to improve the performance of the dams.
The stony nature of most of the embankments prohibited
the collection of near surface undisturbed samples with hand
tools. Owner resistence and the expenses involved in
mobilizing and using mechanized equipment further prohibited
undisturbed sampling.
Only dams with a reservoir surface area greater than 15
acres were investigated. The expectation was that this
restriction would limit the investigation to dams which were

2
constructed using accepted engineering practices. This was
not the case. Almost anything passes for accepted construc
tion practice in this state where there is no legislation to
regulate dam design and construction. Therefore, attempts
to relate dam performance with the nature of the embankment
materials or with the embankment performance were not
feasible. One dam with flat slopes utilizing good materials
but poorly constructed might perform less satisfactorily
than another constructed with steep slopes and less suitable
materials, but well compacted.
The investigation has been directed, therefore, to a
study of the nature of the soils used in dam construction
and to the factors which affect the compaction of these
soils. With this knowledge, it should be possible to assess
the potential for dam construction if good construction
techniques are followed.
The effect of significant soil properties on Standard
Proctor compaction parameters were investigated. These
properties were chosen considering the clayey nature of
the soils. They are: (1) clay mineralogy, (2) Atterberg
Limits and grain-size distribution, (3) cation-exchange
capacity, and (4) soil clay structure.
Evidence indicates that the Tertiary climate of the
Ozark region was semi-tropical or tropical. Where carbonate
bedrock is located in this type of climate, chemical
leaching is prominant and conditions favoring the formation

3
of kaolinitic and halloysitic soils are developed. Terzaghi
(1958) reports the characteristics of a halloysitic soil of
tropical Kenya to be similar to that of the Ozark soils,
Graham (1969) sites the probable presence of halloysite in
the Ozark soils as being responsible for the low maximum
dry density and the high optimum moisture content of the
Springfield soil, an Ozark residual clayey soil. The
mineralogical investigation was designed to determine more
explicitly the nature of the clay and possible changes in
its morphology from one portion of the Ozark Province to
another.
X-ray diffraction, differential thermal analysis,
thermogravimetric analysis, chemical analysis, transmission
electron microscopy, and scanning electron microscopy
techniques were chosen for this investigation. The results
of several of these tests are shown to be affected by
mineral particle size, degree of crystallinity, and other
factors. These factors can lead to errors in interpretation
if they are not recognized and considered. The electron
microscopy studies, particularly those of the transmission
electron microscope, provide keys to clay mineral
identification.
Harris (1969) has made numerous correlations between
independent soil properties as the percent fines, the percent
clay, the liquid and plastic limits and the Standard Proctor
compaction test variables, the maximum dry density and the
optimum moisture content. It was decided to determine if

4
similar correlations exist for the Ozark residual soils.
It was chosen to study the nature of the clay structure
of the laboratory compacted samples with the scanning
electron microscope at various magnifications 1 particularly
samples compacted wet and dry of the optimum moisture
content.

5
II. LITERATURE REVIEW
A. GEOLOGY
The geology of the Missouri Ozarks is illustrated on
the Geologic Map of Missouri published by the Missouri
Geological Survey. The general geology of the Ozark
Plateaus is that of a horizontal sequence of sedimentary
formations deposited by shallow marine seas which moved
onto and off of a Precambrian dome centered in the St.
Francois Mountains. The Ozark Province has been divided
into four subprovinces by Thornbury (1965): (1) the
St. Francois Mountains - the Precambrian igneous core of
the province; (2) the Salem Plateau - underlain by
Cambrian and Ordovician dolomites with some sandstones;
(3) the Springfield Plateau - underlain primarily by
Mississippian and Pennsylvanian limestones; and (4) the
Boston Mountains - rugged topography developed on shales,
limestones and sandstones.
The topography of the northern flank of the Salem
Plateau where the darns investigated are located is char
acterized by steep-sided ridges with closely spaced
drainage. Broad uplands are developed in portions of
Phelps, Dent, and Crawford Counties on the Roubidoux and
Jefferson City formations.
The youngest formation exposed in the area is the
Ordovician Jefferson City dolomite, and oldest is the

6
Cambrian Potosi dolomite. The stratigraphy of these
formations is described in detail in The Stratigraphic
Succession in Missouri published by the Missouri Geological
Survey.
Bretz (1965) attributes the plateau development to
weathering cycles which extended through three periods
of peneplanation forming the three plateau levels. These
stages of peneplanation correspond to, and are the result
of, tectonic pulses triggered within the province dome.
Evidence of later, minor pulses are noted in terraces and
rejuvenated streams.
He dates the plateaus as follows: (1) Boston Mount
ains (pre-Tertiary?), (2) Springfield Plateau (early Ter
tiary?), and (3) Salem Plateau (post-early Eocene). The
minor pulses are dated as Pliocene (?) and pre-Pleisto
cene(?). According to the theoretical cycles of pene
planation, the Salem Plateau is now in the early mature
stage. Bretz bases his postulation on the following
evidences of peneplanation noted in the area: (1)
accordant summits, (2) flat interfluvial divides, and
(3) monadnocks.
Quinn (1956) disputes the hypothesis of peneplanation
and postulates that the plateaus, ". . were eroded in
place by alternating periods of stream entrenchment
providing the escarpments, and periods of escarpment
retreat (pedimentation), forming the plateau surfaces."

7
Valley entrenchment occurs during periods of high
moisture which results in rejuvenation of streams resulting
in erosion. During alternating periods of arid conditions
streams aggrade and mechanical weathering predominates.
Quinn relates these alternating cycles to correspond with
the glacial and interglacial climatic conditions.
The two proposals vary considerable in dating the
development of the Salem Plateau. Bretz dates the plateau
as post-Eocene, pre-Pliocene; Quinn dates the plateau as
late Pleistocene. The age of the residual soils must coin
cide with or be somewhat younger than the plateau itself.
The soils must be older than the Pleistocene loess deposits
which often covers the residium, particularly in the north
eastern portion of the plateau. The exact age of the soils
has not been determined.
During the Tertiary period, what is now the Gulf
of Mexico extended far up into the Mississippi River Valley.
This near-shore (probably tropical) environment could
have provided the moisture required to produce a climate
favorable to laterization forming the clayey residual
soils on carbonate bedrock. Toward the end of the Tertiary
with the advent of the Pleistocene glacial stages, these
favorable conditions ceased and the existing soil forming
cycle was terminated.

8
B. SOIL FORMATION
1. Soils derived from limestones. The residual soils
investigated in this study are classified as Ultisols
(U.S.D.A., 1960). Earlier systems classified the soils
as Red-Yellow Podzolics. Where Red~Yellow Podzolics are
usually developed in tropical climates, Ramann (as reported
in Miller, 1965) noted a tendency of tropical soils to pen
etrate into temperate climates on limestone formation.
This is possible because the permeable limestones, or
dolomites, permit rapid percolation with a resultant
decrease in ground water influence on soil formation.
The principle clay minerals in these Red-Yellow
Podzols developed on limestones are kaolinites and
halloysites. The soils also exhibit an increase in iron
and clay content with depth (Scrivner, 1960).
The laterization process is considered to be the
dominant process in the genesis of these residual soils
(Simonson, 1949). There is little evidence that eluviation
and illuviation have acted as a major process to concen
trate clay in the B horizon. Simonson further suggests
that the dominant process in these soils is the destruction
of clays in the upper horizons and the formation of new
clay minerals in the deeper horizons.
Jenny (1941) notes that in humid regions the limestone
derived soils are closely related to the impurities in the

9
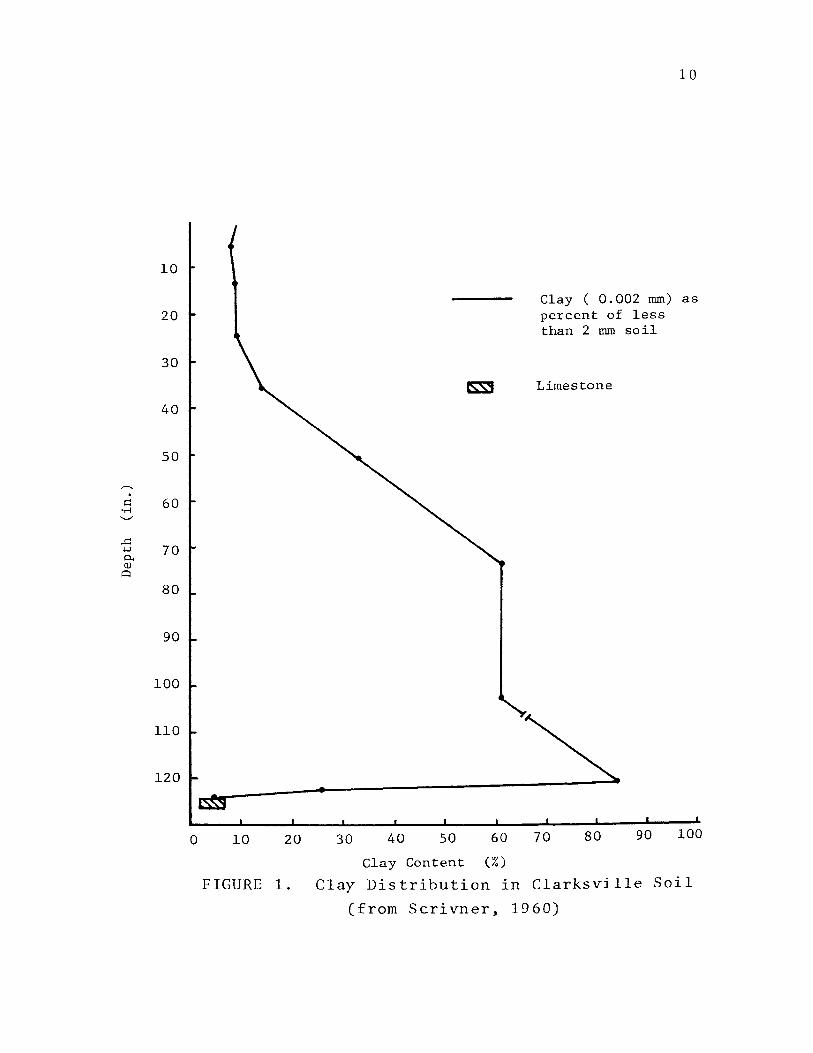
parent material. Carroll and Hathaway (1953) discuss the
soils developed on the Lenoir limestone in Virginia. The
limestone contains partings of hydrous mica and montmoril-
lonite. Their investigation shows that the mica and mont-
morillonite were changed during the leaching process to
kaolinitic and chloritic clay soils. The clay content,
particularly that of kaolinite, and the cation-exchange
capacity increased with depth through the soil profile.
Scrivner (1960) notes this variation of clay content with
depth and a graph from his study illustrating this
variation is presented as Figure 1.
In a study of the Lebanon soil in Missouri, Scrivner
(1960) reports that a limestone which contains illite
weathered by chemical leaching to produce a soil profile
which contains predominantly kaolinite. The soils also
contain some montmorillonite, an intermediate product of
illite weathering.
Miller (1965) studied four Ozark soils developed by
chemical weathering of four different carbonate bedrock
formations. The formations ranged in age from Ordovician
to Mississippian and the sources of the samples were
separated by distances of up to 100 miles. There is a
marked similarity in the soil profiles and mineralogy, 0
which consists primarily of kaolinite and some 14 A
minerals. The only clay mineral present in any
significant amount in the bedrock formations is illite.
10
10
Clay ( 0.002 mm) as 20 percent of less
than 2 mm soil
30
Limestone
40
50
,.-.... . 0 60
·r-f ..__,
...c: .j.J 70 0. Q)
0
80
90
100
110
120
0 10 20 30 40 50 60 70 80 90 100
Clay Content (%)
FIGURE 1. Clay Distribution in Clarksville Soil
(from Scrivner, 1960)
11
2. Formation of Kaolins. The most common minerals
of the kaolin group or family of minerals are allophane,
halloysite (hydrated and non-hydrated), and kaolinite.
Investigators present two primary modes of kaolin for
mation; as precipitated gels and as particles from
solution. Hauser (1952) postulates that after chemical
leaching, hydration and adsorption of ions, the silica and
alumina gels react to form halloysite. Then, by conden
sation, kaolinite and montmorillonite, mica and other
minerals may be formed depending on what ions are present.
Bates (1952) favors the theory of formation of
particles from solution. The kaolin mineral produced
depends on many factors; time, temperature, pressure,
humidity, pH, and the composition of the solution. Sherman
(1952) relates the kaolinite formation to the intensity of
the chemical weathering (amount, intensity, and distri
bution of annual rainfall) and the length of time the
material has been subjected to weathering. Kaolin
formation is maximized by moderate, non-cyclic annual
rainfall and good internal drainage. With increased age
and/or greater annual rainfall, the kaolinitic clays
decompose into their individual hydrated oxides which are
concentrated to form laterites.
Keller (1968) presents a detailed study of the cry
stallization of clay minerals from solution which is beyond
the scope of this investigation. In his summary he states,

" . it may be said that the factors which are important in the development of kaolin-type minerals from alumino-silicates are the complete removal of the metal cations (other than Al and Si) and the introduction of H ions (Ross, 1943), and a relatively low silica~alumina ratio."
12
The conditions required to produce the above factors are
a humid climate where precipitation exceeds evaporation,
permeable bedrock to allow continued leaching, and an
oxidizing environment to remove Fe from solution.
Scrivner (1960) presents a mechanism whereby alumino
silicates arrive in solution from which they are subse-
quently precipitated as kaolins. His research describes
the destruction o£ the illite, alumina feldspars, and
quartz from the carbonate bedrock by an acid soil
environment to produce a solution of alumino-silicates.
The metallic Mg and Ca ions are removed by leaching from
the solution and the Fe is oxidized to Fe 2o3 . The
requirements outlined above by Keller have been satisfied.
A pH change immediately above bedrock from acidic to
basic keys the precipitation of a kaolinitic mineral out
of solution.
3. Kaolinite morphology. In the preceeding
paragraphs the formation of kaolinitic minerals from
solution has been discussed, but the morphology of these
minerals has not been considered. A number o£ minerals
from well-crystallized kaolinite to halloysite to

13
allophane may be the product of this precipitation.
Keller et al (1970) emphasize the question of kaolin
group morphology when they state,
" A long-standing problem of the kaolin group minerals has been the question: 'What geologic or geochemical environments determine whether wellcrystallized kaolinite; b-axis disordered, 'fire-clay' mineral; kaolinite of hexagonal, elongate plate, tubular or other external morphology; endellite, halloysite, allophane, dickite of differing IR absorptions; or possible other varieties, are formed?' A corallary question asks 'is there a sequence, either possible or necessary, in either direction, between allophane, endell1te, kaolinite, dickite. . ?'"
In a discussion of the interrelationship of morphology
and chemistry, Bates (1959) cites the following factors
that determine the degree of curvature and therefore the
shape of the minerals. The first is the degree of misfit
between the tetrahedral and octahedral sheets which are
affected by the number and size of cations. The second is
the strength of the interlayer bond which is a product
of the size and polarizing power of the cations and the
distribution of H ions. The platy kaolinites are favored
over the lath or tubular materials as the H20 content
decreases and as the Si0 2 :Al 2o3 increases (as the number
of cations decreases).
Bates further postulates that there is a complete
morphological cycle in the kaolin group from the well
crystallized hexagonal plates of kaolinite to elongate

plates, to laths with crystallographic terminations to
curved laths to tubes of halloysite (4H 20). A
halloysite-allophane transition has also been postulated
14
(Sudo and Takahashi, 1956). It is therefore possible that
a complete morphological series from allophane to
well-crystallized kaolinite exists.
In his discussion of soil clays Bramao (1952) notes
three morphological classes: (1) hexagonal plates, (2)
cylindrical or rod-like particles, and (3) irregular
layered particles having curved surfaces. This third
class exhibits x-ray and thermal properties of both
halloysite and kaolinite. The clay particles are
generally fine, have roughly hexagonal or elongate shape
with rounded edges, and a roughness of texture.
Bramao further summarizes the conditions under which
this irregular soil clay kaolin would form.
"The small particle size and evident poor crystallinity of much of the soil kaolin are results of the weathering conditions in soils. Soils are subject to wetting and drying cycles; a kaolinite crystal may begin to synthesize in one part of the cycle, and its growth may be interrupted or retarded during another part. The next increment of crystal growth might be more hydrous, or have a slightly different chemical composition and physical structure. Soil formation is characterized by the simultaneous presence or a large number of free ions and colloidal systems; the latter, particularly the hydrous oxides of aluminum and iron, may well

affect the development of clay mineral crystals. Where halloysite and kaolinite can grow undisturbed in an ideal environment, they can attain their characteristic euhedral forms. Where weathering conditions are dynamic and reflect the interplay of a host of variables, as in soils, perfect crystal formation would be only fortuitous."
Bramao further postulates that halloysite may be a
special form of kaolinite, one which has been deformed by
the presence of excess water molecules. He believes that
the poorly developed kaolin which forms in the above type
of environment is not necessarily a transitional crystal-
line form but one which, ". . may be an equilibrium
form peculiarly developed in a soil environment."
C. COMPACTION CHARACTERISTICS
The compaction of soils is affected by many factors
including such natural variables as mineralogy, gradation,
classification, moisture content, and mechanical variables
as type and intensity of compactive effort. This inves-
tigation proposes to study the effect of three of these
variables; soil gradation and index properties, cation
exchange capacity, and clay-particle structure, on the
compaction characteristics of the Ozark soils. Corre-
lations are made of the interrelationships between these
factors and the compaction characteristics of the soils.
These characteristics are the maximum dry density and
15

16
optimum moisture content as defined by ASTM D 1557-66.
1. Soil gradation and index properties. The effect
of the gravel content of the soil (percentage of material
retained on the No. 4 sieve) has been discussed by several
authors. Holtz and Lewitz (1957) note that the compaction
of the fines is not affected if the soil contains less than
about 30% gravel. For soils containing from 30-50% gravel
there is some interference with the compaction of the fines.
As the plasticity of the fines increases, the soil is able
to tolerate a greater percentage of gravel before the com
paction of the fines is affected.
Zeigler (1948) discusses the effect on the moisture
density relationship which occurs when varying amounts of
gravel are added to a loamy sand. The addition of SO%
gravel (material finer than 3/4" and retained on the No. 4
sieve) increases the maximum dry density from 119.2 pcf
to 133.5 pcf and the optimum moisture content from 13.5%
to 7.5%. The trend of the increase approaches linearity.
Harris (1969) has conducted a detailed investigation
into the interrelationships between independent variables
(soil gradation, index properties) and dependent variables
(engineering properties as cohesion, angle of internal
friction, and compaction characteristics). The major
objection of his study was to develop predictive
relationships for evaluating the dependent variables.

Two recent studies noted by Harris concentrate on the
prediction of the moisture-density values of soils. Ring
et al (1962) conducted studies for the Bureau of Public
Roads. The first study produced curves relating the
liquid and plastic limits to the maximum dry density and
the optimum moisture content. A later study reported by
the same authors developed equations and curves relating
17
the plastic limit and fineness average (defined as one-sixth
of the summation of the percentage of particles finer by
weight than the following sizes in millimeters: 2.0,
0.42, 0.074, 0.020, 0.005, 0.001). It was found that the
values of optimum moisture and maximum dry density are
more closely predicted when related to plastic limit and
fineness average than when related to the plastic limit
and liquid limit. These studies utilize linear regression
to analyze the relationships.
Harris summarizes a report by the U.S. Army Engineer
Waterways Experiment Station (1962) which presents the
relationships between compaction, consolidation and
strength characteristics and the index properties of the
soils. The study develops correlations between index
properties and soil gradation, index properties and
specific gravity of the soils, and the index properties
and the compaction characteristics.
Harris (1969) concentrates his study to correlations

involving plastic fine-grained soils. He finds that the
compaction values are significantly related to the plas
ticity indices and the percent clay. The liquid limit
provides the highest degree of simple correlation. A
very high degree of correlation was obtained for the
optimum moisture content versus maximum dry density.
His study indicates that a high degree of correlation
between the compaction characteristics and the liquid
limit holds also for residual soils. A lesser correlation
is noted with the plastic limit. The correlation of
compaction values with soil gradation is less significant.
For the glacial soils the gradation is more closely
correlated with the optimum moisture and maximum dry
density than with the index properties. The specific
gravity correlates poorly with other properties.
Few of the residual soils studied by Harris exhibit
18
the high percentage of clays, the high degree of plasticity,
or the low density characteristics typical of the soils
tested in this study of Ozark soils. It may well be that
the relationships determined by Harris will not hold for the
Ozark residual soils.
2. Cation-exchange capacity. That cations exdst in
the clay-water system and that they affect the properties
of the system has been known for some time. During the
18th century, it was determined that the process of cation-
exchange occurred and that the phenomenon was restricted
to the clay fraction of the soil (Grim, 1952). Other
19
early studies were carried out by investigators in the field
of soil chemistry.
Hauth and Davidson (1950) and Grim (1953) discuss
three methods by which clay minerals adsorb these cations.
In the first, cations are attracted to the edges of the
clay plates which hold a negative charge. The second
occurs as a result of substitution within the clay lattice.
Substitution of divalent ions for trivalent aluminum ions
results in a deficiency of positive charges which is
satisfied by cations which become strongly attached to the
clay particles. The third method involves the exchange
of the hydrogen in exposed hydroxyls by other cations.
The first method, while active in all clays, is responsible
for most of the exchange capacity of the kaolinite family
minerals. The platy kaolinite minerals which have a layer
of hydroxyls exposed along their basal cleavage surfaces
may also derive some of their exchange potential from
method three. The substitution of cations within the
clay lattice is most prevalent in the triple-layer minerals
where it is responsible for up to 80 percent of the total
cation-exchange capacity (Grim, 1953).
The exchange reaction in clay is very complex and as
of 1958 no one had been able to develop a qualitative

hypothesis which completely describes the reaction or the
sequence in which different cations would become involved
in the exchange reaction (Grim, 1958). As early as 1939,
Grim gave the following approximate order of cation
exchangeability; Na>K>NH 4>Mg>Ca. It appears that divalent
cations replace monovalent cations more readily than vice
versa. Other factors involved in the exchange reaction
include the total population of exchange positions, the
concentration of the replacing ions, the nature and
concentrations of the anions, the size and polarity of the
ions, and the hydration tendency of the ions (Grim, 1952).
20
Certain exchange relationships have been observed and
reported in the literature. Grim (1953), and a number of
other authors, report typical values of the cation-exchange
capacity of clay minerals:
CEC meq/100 gr.
Kaolinite 3 - 15
Halloysite zH 2o 5 - 10
Halloysite 4H 2o 40 - 50
Illite 10 - 40
Montmorillonite 80 - 150
Grim and Bray (1936) examine the properties of a number
of ceramic clays and showed that the cation-exchange capa
city increased as particle size decreases. Harmon and

21
Fraulini (1940) studied the properties of a kaolinite as
a function of particle size. They note a pronounced
increase in the cation-exchange capacity, about four-fold,
as particle size decreased from 10-20 microns to less than
0.1 microns. The authors also devoted a portion of the
study to the relationship between cation-exchange capacity,
specific surface, and permeability showing an increase in
permeability with increasing cation-exchange capacity and
decreasing particle size.
Kelley and Jenny (1936) determined that the cation
exchange capacity of clay minerals increased markedly upon
the breakdown in crystal structure caused by grinding.
Table I modified from Kelly and Jenny shows that the
cation-exchange capacity of a kaolinite increased from 8
to 100 meq/100 gr. as the mineral was ground for 7 days.
Data for other minerals are also included in the Table.
These authors postulate that upon grinding, many OH ions
of the kaolinite lattice become exposed as breaks are
produced across the octahedral layer or parallel thereto.
The increased exchange capacity is due to these exposures
of unsatisfied negative charges.
These studies seem to indicate that the cation-exchange
capacity is a more dominant factor in montmorillonites than
in kaolinites and halloysites, and as the clay particle
size and degree of crystallinity decrease the cation
exchange capacity increases.

22
TABLE I
Affect of Crystal Structure on Cation-Exchange Capacity
(after Kelley and Jenny)
Minerals 100 Mesh Grinding Time
48 hr 72 hr 7 days
Muscovite 10. 5 . . . 76.0 . . . Biotite 3.0 62.0 72.5 . . . Kaolinite 8.0 57.5 70.4 100.5
Montmorillonite 126 I . . . 238 . . .
Baver (1930) shows that the divalent cation Mg and Ca
flocculate at much lower concentrations than Na and K
cations and that they produce a structure which is favorable
to the movement of water and air; a structure which is
relatively stable. Baver (1956) notes that, "The high
hydration and dispersive action of the Na ion makes the
plasticity of the Na-saturated soil greater than those
soils saturated with divalent ions."
Winterkorn and Moorman (1941) present data illustrating
the effect of different exchange ions on Atterberg Limits,
optimum moisture content and maximum dry density, total
consolidation and rate of consolidation, permeability, and
shear strength of compacted samples. Saturating the soils
with different cations also causes changes in the results
with different cations also causes changes in the results
of hydrometer particle size analysis showing the effect of
each cation on the flocculated or dispersed nature of the
clay particles.
23
Davidson and Sheeler (1952) relate the cation-exchange
capacity of loess in southwestern Iowa to certain engineer
ing properties of the soil. At exchange capacities greater
than about 20 meq/100 gr. the curves relating CEC to
Atterberg Limits and percent clay appear to approach
linearity. At least a very strong correlation is established.
Along with these investigations on the nature of the
cation-exchange reaction and its affect on the engineering
properties of clay soils were investigations into the clay
water system itself and how the cation affected the system.
Winterkorn (1940) describes the oriented water film
surrounding clay particles and how if affected the plasticity
indices.
Grim (1952 and 1958) has expanded this explanation.
The properties of the clay-water system are a function of:
(1) the bond between the particles, (2) the amount of
water between the particles, and (3) the nature of the
water adsorbed on the surfaces of the clay mineral
particles.
The bond between particles is dependent largely on the
cations held on the basal and edge surfaces of the clay

24
particles. The valence, geometric size, and tendency of
the ion to hydrate affect the bonding strength. The
geometric nature of this bonding restricts to a degree the
amount of water which can penetrate between particles. The
exchangeable ions also affect the configuration of the water
molecules that envelope the clay surfaces. The water for
some distance out from the surface is not a true liquid
since the molecules are probably arranged in a preferred
orientation different from that of liquid water. There is
an indication that the nature of the water molecule
orientation may vary with the exchangeable ion and the
thickness of the adsorbed water later.
The Na ions tend to develop thick surrounding layers
of oriented water whereas Ca and Mg ions develop only thin
layers; tens of molecular layers for the Na ion versus only
about four for the Ca and Mg ions. In addition there
appears to be no distinct boundary between the oriented and
liquid water systems when the Na ion is involved (Grim,
1958).
The "swarm" of water molecules and cations surrounding
the clay particles have been referred to as the double
layer. A decrease in the thickness of the double layer
causes a reduction in the electrical repulsion between clay
particles. Lambe (1960) has graphically illustrated the
effect of electrolytic concentration, ion valence, dielectric

25
constant, and temperature on the electrical potential of the
double layer system. The higher the ion concentration of
the pore fluid, the greater the particle-to-particle
attraction and the less diffuse the double layer. A similar
relationship exists as the valence of the ions in the pore
fluid increases.
Lambe and Martin (1960) note that the only exchangeable
ions likely to be important in soils are Na, K, Ca, Mg, Fe,
and Al and that of these Ca and Mg generally account for
50 to 90 percent of the exchangeable ions except on extremely
acid soils of humid regions.
Recently in the field of soils stabilization research
the effects of exchangeable cations have been extensively
studied and utilized. Vees and Winterkorn (1967) found that
the liquid and plastic limits of a kaolinitic soil increases
with the valence of the exchangeable ions and that this
indicates an increase in the flocculation effect of the
higher valence ions. The addition of lime to soils acts to
decrease the dry density and to increase the optimum
moisture content of compacted samples (Ladd et al, 1960).
The addition of 10 percent lime caused a drop in dry density
from 98 to 87 pcf for a heavy clay with a liquid limit of
60 and a plastic index of 20.
Lambe (1962) extends the results of earlier studies to
cover the general effects of the addition of aggregates and

26
dispersants to compaction samples. The aggregates produce
a strongly random structure which resists compaction effort
and results in a lowering of the maximum dry density and an
increase in the optimum molding water content. Dispersants
such as sodium tetraphosphate reduce the electrical
attraction between particles causing a decrease in cohesion.
This leads to a significant decrease in the liquid limit.
The repelled clay particles can be easily moved relative to
each other and may be molded into a dense mass by mechanical
compaction. The result is an increase in compaction with
the dispersed structure and a lowering of the optimum
moisture content.
3 • Clay particle structure. Lambe (1953) shows that
marine clays have a more flocculated structure than fresh
water samples. His research also shows that remolded
samples have a more oriented (parallel) fabric. Mitchell
(1956) used a petrographic microscope to illustrate the
improved orientation of clay samples with remolding.
Lambe (1958) contributed a classic paper postulating
the effect of structure on compacted clay samples. In this
paper, Lambe reviews the factors which affect the structure
of natural soils. He also lists several variables which can
be altered by the engineer which will change the structure:
(1) type of compaction, (2) amount of compaction, (3) amount
of water, and (4) additives. Lambe concludes that: (1)

clays compacted dry of optimum owe their low density to a
flocculated structure; (2) this flocculated structure
results in part from a high electrolytic concentration of
ions with strong bonding capacity which prohibits the
development of a thick diffused double layer; and (3) wet
of optimum a dispersed structure is developed which allows
more efficient particle arrangement.
Seed and Chan (1959) conducted a number of tests on
clay samples compacted by different methods wet and dry of
optimum. They investigated and reported the effect of
27
particle arrangement or structure on sample shrinkage,
swelling, and total and effective strength characteristics.
The results of these tests when interpreted in light of
Lambe's theory substantiate his conclusions with regard to
particle structure. The authors also note the effect of
different methods of compaction. They found that the soils
which had undergone the greatest amount of shear strain
had the greater degree of particle orientation and a
lower shear strength.
In his discussion of the physico-chemical properties
of soils, Michaels (1959) reports the possibility of
"packets" of parallel clay particles. He believes the
packets act as "rigid solid entities" which resist attempts
at being forced into a coherent mass because the area of
contact between packets is so small. Relative to

28
individual clay particles, there are few points of attraction
(cohesion) between packets of compacted, dry clay.
Trollope and Chan (1960) discuss a mechanism whereby
packets are formed. They attribute the packets to a
strong electrolytic environment which forces particles to
move together. The authors contend that only in zones of
large shear strains are the particles reoriented and that
compacted clay soils which are generally considered to be
remolded are for the most part not remolded.
Alymore and Quirk (1962) used transmission microscopy
to study the natural structure of clay soils. They report
a "turbostatic" microstructure of clay particles.
"Turbostatic" structure refers to a twisted, swirl-like
clay particle arrangement similar to that noted by Borst
and Keller (1969) and discussed in a later section of this
paper. This type of structure is noted in natural clays,
particularly kaolinite and illite.
Sloan and Kell (1966) used transmission microscopy to
illustrate the structure of compacted kaolin samples. Their
study illustrates the predominance of packets of clay
particles in the compacted samples. Few individual clay
particles were noted. The packets appear to exhibit the
compacted arrangement (flocculated and dispersed) that
Lambe had postulated for single particles. The kaolin
compacted dry of optimum exhibited random packet orientation.

29
Zones affected by higher shear strains (as those close to
the top of each layer in a compacted sample) show greater
orientation. As water is added beyond that required for
optimum, greater packet orientation is observed. Sloan and
Kell further state:
"The addition of molding water in amounts less than that required to produce a slurry or viscous suspension would probably not disrupt the packets; hence persistence of the packets through the compaction process over the relatively limited moisture range in this study could be expected. The relative absence of individual particle edge-to-edge relationships would seem to support this view."
The investigation by Barden and Sides (1970) utilized
the scanning electron microscope to illustrate the compacted
structure of a clayey soil. The structure of the soil
compacted at one-half Standard Proctor compaction effort at
2.8% dry of optimum and 5.2% wet of optimum was investigated.
Their study indicates that at low to moderate magnification
(20-SOOX) the structure of the compacted samples appears to
vary appreciably depending on the molding moisture content.
Dry of optimum, distinct "pellet-like" macropeds were
predominant. Macropeds are packets or groupings of clay
particles. Wet of optimum the structure was more
homogeneous, offering little evidence of macropeds. At
higher magnification (1900-9500X) there was no marked

difference between the micrographs of samples compacted
wet and dry of optimum. This would indicate that the
intrapacket or microstructure of samples is not dependent
on the molding water content. Indeed, there appeared
30
to be little difference between high magnification
micrographs of the natural soils and those of the compacted
samples.
Barden and Sides postulate the following compaction
sequence. At low compaction, moisture, the macropeds appear
to resist deformation and macrospaces filled with air exist
between the macropeds. As more water is added the macropeds
become weaker and distort under compactive effort to reduce
and finally eliminate the macrospaces. At this point the
soil appears fairly homogeneous and the dry density is at
a maximum. The addition of more water causes a reduction
in the dry density as the water layers between soil
particles increases.
Obviously this explanation varies considerably from
that postulated by Lambe (1958) and Seed and Chan (1959)
where the change in particle orientation with change in
molding water content determines the compacted density.
To varying degrees Trollope and Chan (1960) and Sloan and
Kell (1966) had hinted at the compacted nature of clay
soils as outlined by Barden and Sides.
The significance of this "new" explanation of compacted
clay soils is evident. The theories of soil swelling,

shrinkage, consolidation, and shear strength of compacted
clays based on the Lambe (1958) theory must undergo some
re-examination and revision to allow for the presence and
influence of the pedular nature of the compacted samples.
31

32
III. FIELD INVESTIGATION
Sixteen Missouri Ozark earth dams were investigated.
Where possible soils were obtained from the borrow source
of the dams. Where this was not possible, soils from the
vicinity of the dams were sampled. Figure 2 shows the
locations of the dams investigated.
The physical parameters of the dams were determined with
a 100 ft. chain, an abney, and a Brunton compass. The
parameters determined were the width, height, length,
location of water level, and the dimensions of upstream and
downstream embankment slopes. The upstream slope values
are based on the angle of the slope above the reservoir
level. The exact location of the darns were spotted in the
field on U.S.G.S. Quadrangle sheets.
Early attempts to obtain moisture content and
undisturbed samples from the darns with agricultural probes
and small augers were abandoned when it became obvious
that the hand equipment was not adequate to sample the
stony embankment material.
The location of the principle source of embankment
material at each darn was generally apparent or was obtained
from someone in the vicinity of the site. At these sites
approximately 40 pounds of soil were obtained and placed
in a plastic sample bag.
Each darn was visually inspected to assess its per-
forrnance. Particular attention was given to evidence of

34
slope instability and seepage below, around, and through
the darns. The field investigation was completed during
the dry summer months of 1969 making seepage relatively
easy to locate and to differentiate from precipitation. An
attempt was made to determine from the owners which darns
were constructed with a cut-off trench.
The general characteristics of the soils and bedrock
were noted in the field and compared with geologic and
soils maps to determine the soil series and bedrock
geology at each site. Mr. James H. Williams, engineering
geologist with the Missouri Geological Survey, visited a
number of the sites with the investigator and was very
helpful in differentiating between the dolomitic
formations.
The bedrock formations, soil series, the darn parameters,
and a summary of the laboratory soils tests for each darn
site are presented in Appendix A as Darn Reports. A typical
cross-section or cross-sections for most of the darns are
also illustrated.

35
IV. MATERIALS
The soils investigated basically fit into three cat
egories: (1) alluvial-colluvial soils, (2) residuals
developed on sandstones, and (3) residuals developed on
carbonate rocks. Table II outlines the geologic formations
and soil series present at each site. The Sunnen sample
is an alluvial deposit or reworked Gasconade clay residium.
The Masters #1 and Elsey soils appear to be colluvial
deposits also derived from Gasconade clay residium. The
Rice, Fabick, and Ft. Westside soils were developed all or
in part from the sandstones within the Roubidoux formation.
The remaining soils are residuals developed on the
Jefferson City, Gasconade, Eminence, and Potosi formations.
The clay residuals are classified as the Clarksville gravelly
or stony loams. The Hanceville loam and the Lebanon silt
loam are characteristic of the non-clay residuals.
An attempt was made to collect each sample from the
lower B and C horizon. Some, as the Sayers, Terre Du Lac,
and Sunrise Central were collected immediately above bed-
rock. Depth to bedrock at the other sites was not apparent.
The Clarksville cherty residium is the typical soil
developed on the carbonate bedrock of the Salem plateau.
The percent of chert in the soil is highly variable from
site to site and throughout the profile at any one site.
The surface and upper horizons often have a heavy

36
TABLE II
Materials of Dams Investigated
Soil (Dam) Location Bedrock Soil Series (county) Formation
Timberline St. Francois Potosi Clarksville gv.
Terre Du Lac St. Francois Potosi Clarksville gv.
Masters #1 Dent colluvial (?) Clarksville st. Gasconade
Masters #2 Dent Gasconade Clarksville st.
Sunrise South Jefferson Potosi Clarksville st.
Sunrise Cent. Jefferson Potosi Clarksville st.
Elsey Washington Gasconade Clarksville st.
Blackwell Dent Gasconade Clarksville st.
I Floyd Dent Gasconade Clarksville st.
Sayers Washington Potosi Clarksville st.
Hornsey Washington Eminence Clarksville st.
Sunnen Washington alluvial Clarksville st. Gasconade
Rice Crawford Roubidoux Lebanon slt. lm.
Fabick Dent Roubidoux Hanceville lm.
Ft. Westside Crawford Roubidoux (?) Lebanon slt. lm.
Lt. Prarie Phelps Jefferson Ct. Lebanon slt. lm.

37
accumulation of chert. Sloping surfaces accumulate chert
as fines are washed downslope. The Terre Du Lac and
Masters #2 samples contain almost no chert, whereas the
Blackwell and Floyd samples contain up to 50% chert. The
quartz druze (secondary crystalline quartz deposits)
typical o£ the Potosi formation was found in the Timberline
and Sunrise samples.
The clay residuals exhibit many similarities from
one location to another. They are generally deep red in
color~ an indication of high iron content. A high degree
o£ blocky to sub-angular structure is developed throughout
the profiles. The natural aggregate structural units of
soil particles are called peds. The peds occur from coarse
sand to gravel sizes. As a result of this structure which
exists throughout the profile, the natural soil deposits
are well-drained.
There are several factors related to the origin of the
soils which may have contributed to forming this pedular
structure. The formation of the soil is associated with
the solution and lowering of the bedrock level. This
lowering is accompanied by an adjustment (drop) in the
level of the residual mantle. This adjustment could
fracture the soil mass resulting in the ped structure.
The slicken-sided ped surfaces may reflect this movement.
The ped structure may also be the result of dessica-
tion. Later sections of this investigation will show that

38
the residual soils have rather high liquid limit values.
It was noted that the field moisture of the soils was
closer to the plastic limit than the liquid limit, Table III.
This is generally regarded as an indication of dessication.
The soils were formed ( and probably continue to be formed
at a reduced rate) in a humid warm climate.
Baver (1956) notes the specific effect on aggregate
formation caused by drying of the clay-soil mass. He
related the unequal strains developed in the soil caused by
non-uniform drying as a cause of "shrinkage" cracks which
form the peds. Wetting of the dried peds causes unequal
swelling which results in ped fragmentation and development
of smaller peds. Upon wetting, unequal air pressure in
the peds caused by capillary adsorption of water also acts
to break down the larger peds.
The iron may play an important role in prohibiting the
breakdown of the peds by both water and mechanical action.
Iron acts to "cement" the particles together and/or to
increase the cationic concentration and attraction between
particles.
The alluvial deposits do not exhibit well-developed
profiles. The residual clay structure has been modified
but not totally destroyed in most cases. As the residuals
were water-worked, some of the clay was lost and sand was
concentrated. The result is a deposit containing less
clay and more sand than the parent residuals.

TABLE III
Comparison of Natural Field Moisture
With Atterberg Limits
I Field Soil (Dam) LL PL Moisture
Fabick 25 16 17
Rice 27 15 14
Lt. Prarie 57 23 26
Masters #1 84 25 35
Masters #2 103 34 44
Floyd 85 35 38
39

40
V. TEST PROCEDURES
Tests on the Ozark soils were performed to determine
results in four general areas: (1) soil gradation and
Atterberg Limits, (2) compaction characteristics, (3) clay
mineralogy and (4) soil clay chemistry. The procedures
used to determine these values are presented in sections
essentially as outlined above.
A. SOIL GRADATION
1. Sample preparation. A portion of the field sample,
approximately 1 lb., was prepared for soil classification
tests essentially as directed in ASTM D421-58, Dry
Preparation of Soil Samples for Particle-Size Analysis and
Determination of Soil Constants. A Lancaster mixer was
used to break down the air-dried clay soil aggregates
after the stone portion, where size exceeded that of a No.
4 sieve, had been removed by hand. A mortar and pestle
was used to further pulverize the soil for particle-size
analysis (No. 10 sieve) and tests for soil index properties
(No. 40 sieve).
2. Coarse sieve analysis. The pedular structure of
the clayey residual soils investigated in this study does
not break down completely during dry or wet sieving.
Representative 500 gr. samples which passed the No. 4
sieve were presoaked for 24 hours in a 4% sodium
hexametaphosphate (Calgon) solution, mixed in a dispersion
41
cup, and washed through a No. 10, a No. 40, and a No. 60
sieve. The amount of the sample retained on each sieve
after oven drying was recorded and calculations made to
determine the amount finer than each of the sieves. These
values are recorded in Table IV.
3. Hydrometer analysis. Hydrometer analyses were
performed as recommended in ASTM D422-63 except that the
sedimentation cylinders were not placed in a constant
temperature bath during tests. Temperature corrections
were made later. After sedimentation, the samples were
passed through a No. 60 and a No. 200 sieve for comparison
with the hydrometer analysis.
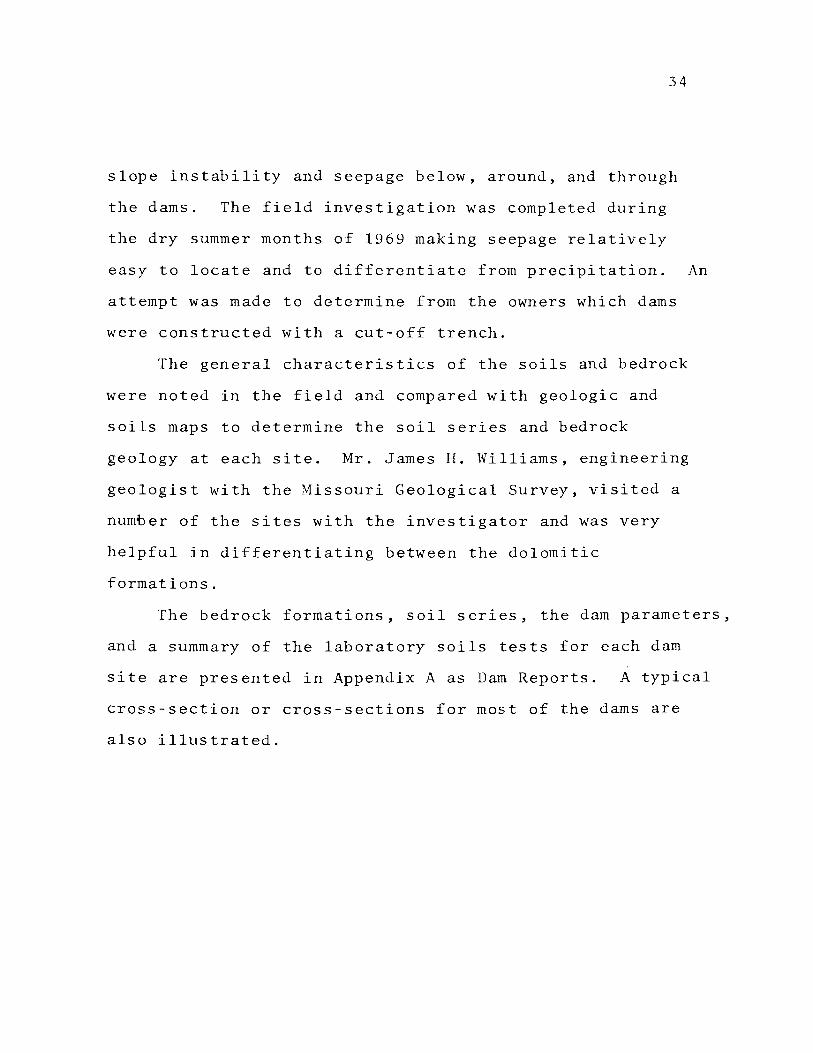
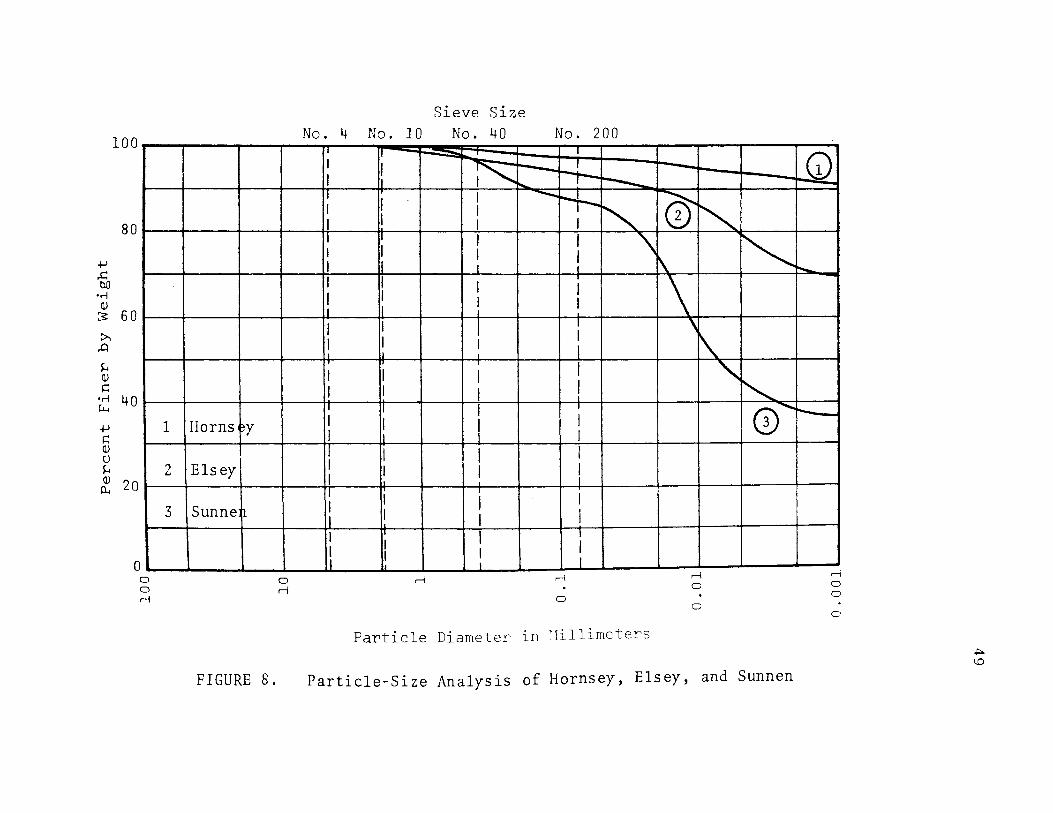
The results of the particle-size analyses were plotted
on grain-size distribution charts which are presented in
Figures 3 - 8. The results are summarized in Table IV.
B. ATTERBERG LIMITS TESTS
1 . Liquid limits. Liquid limit test samples were
prepared and values determined in accordance to ASTM
D423-66 except that a Casagrande grooving tool was used.
Water was added to the pulverized samples until the soil
appeared to be slightly wet of liquid limit and then
allowed to age for 24 hours to allow water to be adsorbed
by the clay particles. The liquid limit tests were
performed wet to dry.
2. Wet liquid limits. Graham (1969) noted a sizeable
difference between the wet and air-dried liquid limit

42
values of a residual soil similar to the soils investigated
in this study. Several of the thesis soils were tested to
determine if a similar pattern was noted.
The wet liquid limit was determined by taking the soil
at field moisture, soaking it for 24 hours in distilled
water, mixing in a dispersion cup, and passing the mixture
through a No. 40 sieve. The prepared mixture was then
placed in a dish and allowed to air dry to a consistency
just wet of the liquid limit. The liquid limit was then
determined as previously. These values are reported along
with normal air dry values in Table V, and compared with
Graham's results for a similar soil.
3. Dispersed liquid limit. In another portion of
this study, samples were mixed with sodium hexametaphosphate,
a dispersant, prior to performing compaction tests. Small
portions of these air-dried samples were prepared and tested
to obtain Atterberg Limits as described in the previous
sections.
It was noted that the samples were particularly sen
sitive to manipulation and that the liquid limit values
vary depending on how long the samples were manipulated
before testing. An attempt was made to be consistent in
preparing and mixing samples in each test, but it is
suggested that the values obtained are only approximate.
These values are reported in Table VI along with normal
air dry values for the same soils.

43
TABLE IV
Summary of Particle Size Analysis
PERCENT FINER
Soil (Darn) #10 #40 #60 #200 10]J 2]J l]J
Terre Du Lac 100.0 99.9 99.4 98 94 92 90
Hornsey 99.4 98.6 98.5 97 95 93 91
Timberline 99.5 94.8 91.2 85 80 79 78
Sunrise Cent. 98.9 94.9 93.4 92 87 83 82
Sunrise South 98.8 92.5 91.0 89 80 72 70
Sunnen 99.6 96.9 92.3 87 57 38 37
Elsey 99.2 97.6 96.0 94 86 71 69
Masters #1 100.0 99.8 99.6 96 83 76 71
Masters #2 100.0 99.6 99.4 99 99 95 94
Sayers 99.8 99.1 98.6 98 96 93 90
Blackwell 98.6 95.3 93.0 85 77 64 56
Ft. Westside 99.8 98.2 94.2 83 56 38 37
Rice 99.8 88.4 70.8 58 35 21 18
Fabick 99.6 94.0 78.0 61 38 19 16
Lt. Prarie 99.5 97.8 97.8 95 80 58 44
Floyd 99.3 98.0 98 98 97 87 83

Sieve Size
100 No. 4 No. 10 No. 40 No. 200 -
I' II I ---~ @ r---I I I ~----I I ~
80
I I I : ~ I I r------I I I I ~
+J ..c: bO
•rl <l)
:s: 60
I II I I
"' I I I I 0 ~ I u I L I I I I I I I I II l
:>, .0
I I I I I I 1
~ <l) ,::::
•rl 40 r.....
+J ,::::
I I I I I I I I I' I
I I I I I ~ I (!) u ~
~ 20 'I
I I I 1 Maste s #2
I I I I 2 Maste s #1
I I I I I u I I I
0
I I I I I I I
II - U.---~ - _j_ l 0 0 rl rl rl rl 0 rl . 0 0
rl 0 . 0 0
0
Particle Diameter in ~1illimeters ~ ~
FIGURE 3. Particle-Size Analysis of Masters #1 and Masters #2

100
80
+J .£.: bO
•rl Q)
~ 60 :>. .0
H Q)
s:: •rl 40 ~
+J s:: Q) u H ~ 20
0 0 0 rl
1
2
Terre
Timbe
Du l ac
line
0 rl
Sieve Size No. 4 No. 10 No. 40 No. 200
fT --r--........ I I ~ I
I I
I I ............... ~ : I l I ..__
I II I I I I I ! I I
I I I I ,! I ! I
I I ! I I I I I II
I I I I I I I !
II I I I I I I I
II I I I I I I I I
1l I I I II I I I I I T
II I I I I
I I rl rl
0
Particle Diameter in ~1illimeters
r-l 0
0
0
FIGURE 4. Particle-Size Analysis of Terre Du Lac and Timberline
0
r-l 0 0
0
.j:lo.
U'1

100
80
.f-1 ..c: bO
•r-l Q)
:3: 60 :>. ..0
~ Q)
s:: •r-l 40 r.....
.f-1 I:: Q) () ~
~ 20
0 0 0 r-1
Sieve Size No. 4 No. 10 No. 40 No. 200
I' I' --...... ~ -K I
I I ---r--..... It
"""""' II I I ~
~ r---...... 0 <D I I II I I I r----.::: -....... 'I II I I
0 ~
~ I I I I I ~ I I ~ I I I i ~ I I 1 I ' II II I I I
I
1\" I I I I ll
I I I I \ I I I I lj I
I 1 Sayer I I I I
jrie 11 I I I
2 Littl Pra I I I I II I I I 3 Black, ell I I I I I I lj I l ~ I I
_l _l
0 r-1 r-1 r-1 r-1
r-1 . 0 0
0 . 0 0 .
0
Particle Diameter in ~1illimeters
FIGURE 5. Particle-Size Analysis of Sayers, Little Prarie, and Blackwell .p. 0\

100
80
+' ..c: bO
•r-i (I)
3 60 :>. ..0
~ (I)
J:! •r-i 40 ~
+' J:! (I) {)
~
~ 20
0 0 0 ,..;
1
2
3
Floyd
Ft. W
Rice
stsi de
0 ,..;
Sieve Size No. 4 No. 10 No. 40 No. 200
I
I ~
" ~ I
I ,! "" I II
I 1\ ' l I ~ I I
II II
!\ I~
~ I I ! I I II I \ I I ! ~ I It II I I !
,.,.
~ "" I I
I " I I I ! I I I
11 I I I I I I I
'I I I I I I l I
II I I I I I I I I I I
I l II I ! ,..; ,..; .
0
Particle Diameter in ~1illirneters
~
1\ \ ~0
1\ (3)' ~
,..; 0
0
" "
~
Q"
'" -... "'
!'.......
!'--..
r---
,..; 0 0 . 0
FIGURE 6. Particle-Size Analysis of Floyd, Ft. Westside, and Rice
.j::. -....]

100
80
f.J ..c:: bO
•o-1 (l)
:3 60 :>,
..0
H (l)
s:: •o-1 40 ~
f.J s:: (l) {)
H ~ 20
0 0 0 rl
1 Sunri:
2 Sunrit
3 Fabid
No. 4 No. 10
Sieve Size No. 40 No. 200
II
I I I I I I I I I
! I ! I I
[I
e Ce ~tra : II
e So ~th I I
0 rl
I
: I
tl
r--.:: r-::: ~ I
I ~ : II
I i \ T-
~ I I I
II I \ I I I ! II I
I I ~ I I ! r---..!.. I I
I
"' I I I
I I I I I I .I I I I I
!I I I I I I I ! I I I I I I
I I I I I I
I I
rl rl
0
Particle Diameter in :1i llimeters
---..... .........___
' •0'
\ 0' "
rl 0
0
"
r--
~'---._
""
0
I'--
rl 0 0
0
FIGURE 7. Particle-Size Analysis of Sunrise Central, Sunrise South, and Fabick
~ 00
100
80
.f.J
.c: bO
•.-! Q)
:3 60 ~
..0
~ Q)
1=: •.-! 40 JJ...
.f.J 1=: Q) ()
~
~ 20
0 0 0 rl
1
2
3
Horns ~y
Elsey
Sunne~
FIGURE 8.
0 rl
Sieve Size No. 4 No. 10 No. 40 No. 200
'I II I
I I --- I
~ -I .....,._
r---. ""'" II
I I ........ H--I I ~ I I I I !I
I I I \ I I I
I I I
I I I I I I ! I I I
I I I I
I I I I I
I I I I I I I ! I I I I I I I I I
I I I I
I I I ! I I I I I II I I I I I I I
tl I I I II I I
rl rl
0
Particle Diameter in 11illimeters
0 ' \
\ ' 1\.
rl 0
0
"
~
~ (j)'
Particle-Size Analysis of Hornsey, Elsey, and Sunnen
G) ~
-
..___
r-1 0 0
0
... \.0

TABLE V
Comparison of Wet Liquid Limit And
Natural Atterberg Limits
% Change Soil (Dam) Wet LL LL PL in LL
Terre Du Lac 132 96 35 37
Hornsey 121 90 43 34
Sunnen 52 42 21 24
Springfield 144.8 105.6 34.0 37
* from Graham (1969)
TABLE VI
Comparison of Natural and Dispersed Atterberg Limits
Natural Dispersed
Soil (Dam) LL PL PI LL PL PI
Terre Du Lac 96 35 61 73 34 39
Floyd 85 35 50 55 28 27
50
I

51
TABLE VI I
Summary of Atterberg Limits Tests
% Soil (Dam) LL PL PI Clay
Timberline 69 30 39 79
Terre Du Lac 96 35 61 92
Masters #1 84 25 59 76
Masters #2 103 34 69 95
Sunrise South 68 30 38 72
Sunrise Central 70 33 37 83
Elsey 84 25 59 71
Blackwell 60 23 37 64
Floyd 85 35 so 87
Sayers 105 41 64 93
Hornsey 90 43 47 93
Sunnen 42 21 21 38
Rice 27 15 12 21
Fabick 25 16 9 19
Ft. Westside 48 21 27 38
Little Prarie 57 23 34 58

52
80
0 Clayey Residual Soils 0
D Sandy Residual Soils 0 60 0
"'"' ~ '--"
~ QJ
'"0 l=l
H
C) 0 ·r-l 0 +J (/)
Cll r-1 A< D
20
D D
0 0 20 40 60 80 100
Liquid Limit (%)
FIGURE 9. Plasticity Chart Plot of Ozark Soils

53
4. Plastic limits. Water was added to the powdered
samples until the approximate consistency of the plastic
limit was reached; the samples were then aged for 24 hours.
The plastic limit was determined in accordance with
ASTM D424-59, and the plasticity index calculated. The
Atterberg Limits for all soils investigated are reported
in Table VII. Figure 9 illustrated how these values plot
on the Plasticity Chart.
C. MOISTURE-DENSITY RELATIONSHIPS
1. Natural samples. Soils for compaction tests were
prepared and tested in accordance with ASTM D698-70,
Moisture-Density Relations of Soils Using 5.5-lb. Rammer
and 12-in. Drop. Method A in which all material larger
than the No. 4 sieve is discarded, was followed. After
mixing with an amount of water predetermined to produce the
desired moisture, the samples were aged 24 hours before
testing.
2. Dispersed samples. Approximately 20 to 25 lb.
samples of several soils were crushed to pass the No. 4
sieve. Each sample was soaked in a 4% solution of sodium
hexametaphosphate (Calgon). The mixture was stirred to
assure that all of the sample was wetted.
After 24 hours of soaking, the sample was further
worked by mixing in a dispersion cup. Additional distilled
water was required to dilute the mixture to a consistency
which could be handled by the dispersion apparatus. Each

54
TABLE VI I I
Result of Moisture-Density Tests
--Soil (Dam) Maximum Optimum
Dry Density Moisture (pcf) (%)
--Timberline 82 36
Terre Du Lac 79 37
Masters #1 84 25
Masters #2 81 36
Sunrise South 88 31
Sunrise Cent. 85 33 --
Elsey 89 26
Blackwell 92 24
Floyd 83 34
Sayers 74 42
Hornsey 77 38
Sunnen 108 18
Rice 121 13
Fabick 121 13
Ft. Westside 100 22
Lt. Prarie 94 27
Floyd - D 87 30 --
Sayers - D 75 35
T. D. Lac - D 80 33
Sunnen - D 107 17

55
portion of the sample was mixed until all lumps had disap
peared, about 5 minutes. The dispersed mixture was then
placed in two, 2' by 2' pans to a depth of less than 1
inch.
The pans were placed before a 20 inch fan and a small
electric heater until the soil dried; generally 3 days
were required.
The dried soil was again crushed to pass a No. 4 sieve,
the moisture content determined, and the sample separated
into portions. Predetermined amounts of water were mixed
with each portion of soil to attain the desired moisture
content and the soil placed in plastic bags to age. After
24 hours the samples were compacted by a procedure identical
to that used for the standard moisture-density tests. The
results of all compaction tests are given in Table VIII.
Portions of the dispersed, dried, and crushed soil mixtures
were saved for Atterberg Limits testing.
D. X-RAY DIFFRACTION
1. General. A number of authors including Bragg
(1949), Brindley (1951), Grim (1953), and Bradley (1964)
discuss the basic principles of x-ray diffraction theory
and technique. The essence of these discussions are out
lined by Schmidt (1965) where it is noted that clay mineral
analysis using x-ray diffraction is basically a determina
tion of the thickness of a unit sheet of the mineral. The
angle of incidence at which reinforcement occurs is directly
related to the thickness of a monomolecular layer of the

Location of Machine
Geology Dept.
UMC
Geology Dept. UMR
TABLE IX
X-Ray Machine Specifications
Type of Time Delay Machine (seconds)
Norelco Wide-Angle 4
Diffractometer
General Electric 2 - 4
Model XRD-5
Counts per Second
100 - 200 i
1000 - 2000
U1 0\

57
mineral. The results of x-ray scanning are recorded on a
chart called a diffractogram which graphs twice the angle
of incidence of the x-ray against the magnitude of the count
of reflected x-rays.
For economic reasons, two x-ray machines were utilized
in this study. This is not ideal since analysis and
comparison of diffractograms from different machines is
difficult. Table IX gives pertinent data for the machines
used.
2. Preparation of samples. An attempt was made to
prepare sample slides using a procedure similar to that
described by Schmidt (1965) where 50 gram portions of soil
were soaked in distilled water for one week, mixed in a
dispersion cup, and sedimented in a 1000 ml. hydrometer
cylinder. Some samples flocculated and settled rapidly.
The supernatent water was poured off, fresh distilled water
added, and the sample sedimented again. After 3 cycles of
mixing with fresh distilled water had failed to disperse
these samples, 5 grams of sodium hexametaphosphate (Calgon)
had to be added to the mix for the samples to be success
fully dispersed.
According to Stokes' Law, after 24 hours all particles
larger than 2 microns (all sand and silt) had settled out
of suspension and a portion of the clay fraction was
siphoned off and concentrated by evaporation. A few drops
of the concentrate was pipetted onto a 1" X 3" X 1 mm.

58
microscopic slide and dried before a heater. The clay
plates tend to orient themselves upon drying.
It was this tendency of the clay plates to so com
pletely orient themselves which rendered the sedimentation
method unsatisfactory in this study. As shown in Brindley
(1951), Bramao (1952) and Grim (1953), the comparison and
identification of the kaolinite group minerals required
in part an analysis of the 020 peak which is not developed
in the oriented sedimented slides.
3. Powdered samples. Samples, pulverized to pass a
No. 200 sieve, were mixed with denatured alcohol before
being poured onto the 1n X 3" slides. As the alcohol
evaporated, a film of sample adhered to the slide. Best
results were obtained when a thin film of powder was pro
duced. This was especially evident at low 8 angles where
a thick film placed the reflection surfaces inside the
focal plane of the scanner resulting in a scattering of
the x-ray.
Powdered samples also develop a preferential orienta
tion due to their platy structure, but there is enough
random orientation to allow development of other peaks not
associated with the c-axis, including the 020 peak
required in analysis of the kaolin group (Figures 10 and 11).
4. Potassium acetate treatment. Halloysite (4H 20) 0
with a basal 001 spacing of about 10.0 A is known to 0
collapse to around 7.2 A as the soil is dried. Early

59
researchers thought this process was irreversible. Wada
(1961) showed the process was reversible and expanded the 0
kaolin group mineral lattice to 14.1 A using potassium
acetate. Upon washing with distilled water the kaolinites 0
collapsed back to 7.2 A whereas the halloysites collapsed 0
to about 10.1 A retaining a water molecule in the expanded
lattice. Miller and Keller (1963) refined the procedure
by using ethylene glycol which helps to retain the expanded 0
10.1 A lattice since ethylene glycol evaporates more
slowly than water.
In accordance with this method, with some modifica-
tions discussed with one of the authors C Keller, 1970),
1.5 grams of potassium acetate was mixed in a small mortar
and pestle with 2.0 grams of air-dried soil passing the
No. 200 sieve. This mixture was allowed to rest for 24
hours in a high humidity environment, after which it was
washed several times through filter paper with distilled
water. A final wash using a solution of equal portions of
distilled water and ethylene glycol was used. The washed
sample was diluted with ethylene glycol and placed on a
glass slide in a thin film. The slide was subjected to
x-ray scanning while the film was still moist. It is
noted that the specimens prepared in this manner remained
moist for longer than 24 hours.
The method of sample preparation used in this study
was tested to check its workability. A sample of pure

60
Georgia Kaolinite was diffracted to determine its base
pattern. Then a sample was x-rayed which had been treated
with potassium acetate and ethylene glycol as described 0
above. There was no shift in the 7.2 A peak indicating no
permanent lattice expansion of the reference kaolinite.
A sample of pure Indiana Halloysite was x-rayed along
with a treated sample, Figure 12 shows the results for
this reference mineral with a definite shift in the basal 0 0
001 peak from 7.2 A to 10.0 A for the treated sample. This
indicated the sample was halloysite and that the method
of sample preparation used in this study did produce the
expected results in the differentiation between control
specimens. The results of similar tests on some of the
Ozark soils are described and presented in a later section.
E. DIFFERENTIAL THERMAL ANALYSIS
1 . General. Differential thermal tests were performed
at the U.S. Bureau of Mines, Rolla, in two furnaces
designed to conform with the specifications outlined by
Berkelhamer (1944). Nickel specimen holders with a capacity
of approximately 0.5 grams were used with chromel-alumel
thermocouples, recommended for their sensitivity. A Leeds
and Northrup automatic programmer was used to control the
rate of heating, 12°C/min. A Leeds and Northrup multiple
thermal differential recorded of the automatic pen-and-ink
type recorded the curves.

61
Samples of Georgia Kaolinite and Indiana Halloysite
were tested to obtain reference curves. They are shown in
Figure 13. Grim and Rowland (1942) show a number of curves
for various clay minerals which can be used for comparison
with test curves of the Ozark residual soils.
2 . Sample preparation and testing. Specimens were
prepared for DTA by sieving a sample of air-dried soil
through a No. 200 sieve. Mackenzie (1957) notes that
sieve size has little influence on the curves but that
the sample should be fairly fine (100 - 200 mesh) to
insure good packing of the specimens.
The nature of the low temperature peak system is
dependent to a degree upon humidity variations, therefore,
the use of air dried samples may result in erroneous low
temperature peaks (Mackenzie, 1957). Similarly, using
samples which have been oven-dried at about 100°C may lead
to the eradication of the low temperature peaks altogether.
Mackenzie suggests that samples be equilibrated over a sat
urated solution of Mg(N0 3 )·6H 20 in a dessicator for
several days. This procedure standardizes the moisture
content of the test samples. Eades (1970) suggests that
the procedure while important for the triple-layer minerals
is not required for the kaolinite group minerals. The
samples tested in this study were not pretreated as
described above.
Where small or very reactive samples are tested, they

62
TABLE X
Summary of Major DTA Temperature Peaks
Peak Temperatures (OC)
Low Major Soil (Dam) Endothermic Endothermic Exothermic
--Masters #1 100 560 minor ?
Masters #2 120 550 925
Sunnen 90 ? 545 905
Terre Du Lac 115 560 925
Sunrise South 120 550 920
Sayers 120 545 915
Blackwell 110 535 minor ?
Timberline (1) 118 555 916
Timberline (2) 120 555 915
Timberline - leached 120 540 945
Hornsey 105 ? 550 915
Hornsey - leached 128 562 930
Elsey (1) 125 540 920
Elsey (2) 110 545 920
Floyd 110 560 930
Floyd oven dried 3 no peak 530 935 -hr. 700C at
Indiana Halloysite 120 580 973
same - oven dried 12 135 595 987 hr. at 70°C
Georgia Kaolinite (1) no peak 605 966
Georgia Kaolinite (2) no peak 610 970

63
are often mixed with an inert material such as calcined
kaolinite or aluminum which has been ground to a particle
size which approaches that of the sample. Base line drift
and sample shrinkage can often be corrected with this
procedure. The DTA base line is a horizontal line along
which the curve should return after recording each
endothermic and exothermic reaction. A disadvantage of
mixtures with inert materials is that they effect the
areas under the peaks which distorts quantitative
determinations. Samples tested in this study were not
mixed with inert material.
Some base line drift was encountered in early tests,
Figure 14, but this was corrected by packing the samples
more firmly in the specimen holder. Factors such as
heating rate, size and construction of specimen holders,
and the degree of packing can radically alter the resulting
DTA curves. Consistency of technique is the key to
obtaining curves which can be compared and analyzed.
Figures 14 thru 17 show DTA curves for a number of the
Ozark soils. Table X summarizes the temperatures of the
important reactions.
F. THERMOGRAVIMETRIC ANALYSIS
Portions of the minus 200 mesh samples prepared for
DTA were saved for thermogravimetric analysis, TGA. A
Ugine-Eyraud Model B-60 Automatic Recording Balance and
furnace were used. The heating rate, 10°C/min., was

64
programmed by a Bristol's Model 565 Round-Chart Dynamaster
Pyrometer. Test results were recorded by a Bristol's
Model 760 Strip-Chart Dynamaster. The equipment and method
of testing is discussed at length in Duval (1963).
One hundred mg. samples of the powder were placed in
the sample holder in the furnace. The balance was zeroed
and the sample heated to approximately 50°C which temper-
ature was held until there was no further noticeable weight
loss. It is believed that most of the hygroscopic moisture
is expelled in this manner. A heating process was utilized
0 in which the temperature was raised in steps of about 50 C
and held until the weight was stabilized. The tests were
terminated at 1000°C,
The data has been transformed to dehydration curves.
Curves for the standard minerals, Georgia Kaolinite and
Indiana Halloysite, were determined, converted to dehydra
tion curves, and plotted along with the curves for several
of the Ozark soils in Figure 18.
G. TRANSMISSION ELECTRON MICROSCOPY (TEM)
A Hitachi Model HU-llA transmission electron microscope
was used to study the size and shape of clay particles of
several soils in this investigation. Both powdered and
colloidal suspension specimens were prepared for analysis.
The major reference for transmission microscopy is an
extensive study performed for the American Petroleum
Institute (Davis et al, 1950). Later studies by Bates and

and Cromer (1955), Brindley and Cromer (1956), and Bates
and Cromer (1959) concentrate on applying transmission
microscopy in determining the morphology of the kaolin
group minerals.
65
A thin carbon film was evaporated (sputtered) onto
glass slides in a vacuum chamber. The powdered sample
(finer than 200 mesh) was dusted onto the film which was
then floated off of the glass slide in a beaker of water.
An electron microscope grid was used to lift the carbon
film with sample from the beaker and mount the specimen in
the microscope. The magnified image of the particles so
mounted was projected onto a screen for viewing and glass
plate photographic slides were obtained.
The 200 mesh powder specimens produced images of
aggregates of clay particles rather than of individual
particles. These were difficult to analyze for particle
parameters such as size and shape.
Soils which had never been air-dried were suspended
in distilled water for a week before testing. They were
agitated often to separate the particles. Before testing,
the suspension was again agitated and a drop of the mixture
placed on the floated carbon film. The sample was then
mounted as before. This method of sample preparation
resulted in a much better segregation of the particles.
Photographs taken of the soil particles when utilizing this
method of sample preparation are presented in Figures 19-22.

66
H. SCANNING ELECTRON MICROSCOPY (SEM)
The scanning electron microscopic investigation was
conducted at the Materials Research Center, University of
Missouri - Rolla. A JEOLCO (Japan Electron Optics Labora
tory Company, Ltd.) Scanning Type Electron Microscope,
Model JSM-2 was used. Samples were mounted on copper
disks, placed in a vacuum and subjected to electron
scanning. Micrographs were taken with a mounted Polaroid
camera.
Initially, specimens were prepared by mounting air
dried pulverized minus 200 mesh samples on the copper disk
with silver paint. Figures 23 and 24 present several
micrographs taken from this portion of the study.
Borst and Keller (1969) present a technique of
mounting samples for scanning with a minimum of sample
disturbance. Air-dried peds were broken to expose a
fresh surface. These chips, about 1 em. by 1 em., were
mounted with silver paint on the disks and coated with a
thin film of gold in a vacuum chamher. The specimens were
then exposed to scanning. Micrographs resulting from this
portion of the study are presented in Figures 25 thru 29.
Compacted clay samples were also analyzed. Chips
with fresh surfaces, as described above, were prepared for
testing. These chips were mounted to expose to scanning
planes oriented perpendicular to and parallel to the dir
ection of applied compactive effort. Micrographs of this

Name of Lake
Analysis
Si0 2 Al 2o3 Fe 2o3 Ti0 2 MnO
CaO
MgO
Na 2o K20
Ignition Loss
- H2o 105°C
+ H20 1000°C
HCl Insol. Residue
HCl Soluble Si0 2 HCl Soluble Al 2o3 HCl Soluble Fe 2o3 Oxides of Al, Fe,
Ti, Mn, P.
Totals
TABLE XI
Chemical Analysis of Ozark Soils
U.S. Bureau of Standards Sample #98
Plastic Clay
59.11
25.54
2. OS
1. 43
0.005
0.21
0. 72
0. 2 8
3.17
7.28
M.G.S. Lab Analysis S amp 1 e # 9 8
Plastic Clay
57.90
27.28
2.33
1. 03
0.16
0.70
0.35
2.40
8.17
0.84 7.33
83.72
0.71
5.36
1. 04
30.64
100.32
Blackwell
%
50.40
24.48
6.81
0.46 --- --
0.50
1. 60
1. 97
1.15
12.18
3.93 8. 2 5
-----
---- -
--- --
7.11
31.60 0\ '-]
99.40

TABLE XI - continued
Name of Lake Sayers Sunnen Sunrise South
Analysis % 0 0 ~0 'o
Si02 40.86 53.06 41.04 Al 2o3 27.06 23.53 27.97 Fe 2o3 9.99 7.84 11. 49 Ti0 2 0.43 0. 71 0.46 MnO - -- -- ----- - -- - -
CaO 0.46 0.18 0.38 MgO 2.20 1.10 1. 31 Na2o 0.23 0.20 0. 13 K20 0.94 1.14 0. 7 2. Ignition Loss 17.96 12. 51 16. 55
- H 0 2 105°C 7.04 4.97 6.36 + H20 1000°C 10.92 7.54 10.19
HCl Insol. Residue 41. 52 ----- -----
HCl Soluble Si0 2 0.79 ----- - ----
HCl Soluble A1 2o3 25.57 ----- -----
HCl Soluble Fe 2o3 9.98 7.59 11.18
Oxides of Al, Fe, 37.48 32.08 39.92 Ti, Mn, P.
0\
Totals 100.13 100.27 100.05 00

TABLE XI - continued
Name of Lake Timberline Terre du Lac Hornsey
Analysis % % !!: 0
Si0 2 42.04 42.6 8 42.32 A1 2o3 28.08 28.60 29.21 Fe2o3 9.99 10.16 8.33 Ti0 2 0.51 0.46 0.36 MnO ----- ----- -----GaO 0.4.8 0.40 0.40 MgO 1. 30 1. 07 1. 61 Na2o 0.13 0.18 0.13 K2o 1. 03 0.65 0.87 Ignition Loss 16.13 16.05 16.73
- H 0 2 105°C 5.59 5.73 6.03 + H20 1000°C 10.54 10.32 10.70
HCl Insol. Residue ----- 45.20 43.11 HCl Soluble Si0 2 ----- 0.75 0.87 HCl Soluble Al 2o3 ----- 26.47 27.56 HCl Soluble Fe 2o3 10.06 10.47 8.91 Oxides of Al, Fe, 38.58 39.22 37.90
Ti, Mn, P. (]\
\.0
Totals 99.69 100.20 99.93

TABLE XI - continued
Name of Lake Floyd Masters #1 Elsey
Analysis % % ~ 0
Si0 2 52.20 56.88 50.68 Al 2o3 24.24 21.17 22.76 Fe 2o3 7.16 6.16 7.42 Ti0 2 0.46 0.41 0.46 MnO ----- ----- -----
CaO 0.10 0.37 0.42 MgO 1. 2 7 1. 58 2.15 Na2o 0.13 0.13 0.23 K20 1. 30 1. 20 1. 33 Ignition Loss 11.96 12.44 15.08
- H 0 2 105°C 3.38 4.81 6.44 + H20 1000°C 8.58 7.63 8.64
HCl Insol. Residue ----- ----------
HC1 Soluble Si0 2 ----- ----- -----
HCl Soluble Al 2o3 ----- ----- -----
HCl Soluble Fe 2o3 7.15 6.15 6.95
Oxides of Al, Fe, 31.86 27.74 30.64 Ti, Mn, P.
"'-J
Totals 98.66 100.30 100.45 0

TABLE XI - continued
Names of Lake Sunrise Central Masters #2
Analysis % %
Si02 40.96 46.30 Al 2o3 29.44 24.68 Fe2o3 10.41 9.66 Ti0 2 0.41 0.36 MnO ----- -----CaO 0.52 0.64 MgO 1. 38 1. 77 Na2o 0.13 0.16 K2o 0.73 1. 00 Ignition Loss 16.29 16.56 - H 0 2 105°C 5.08 6.79 + H20 1000°C 11.21 9.77
HCl Insol. Residue ----- -----HCl Soluble Si0 2 ----- -----HCl Soluble Al 2o3 ----- -----HCl Soluble Fe 2o3 10.38 8.78 Oxides of Al, Fe, 40.26 34.70
Ti, Mn, P. '-I
"'"' Totals 100.28 101.17

72
portion of the study are presented in Figures 48, 49, and SO.
I. LOW-POWER MICROSCOPY (LPM)
A low-power (10-SOX) microscope study of the compacted
samples was conducted at the U.S. Bureau of Mines, Rolla,
Missouri. Micrographs were taken at 17X both in black-and
white and in color of samples of Terre Du Lac compacted
3% dry of optimum and 4.5% wet of optimum. Micrographs
were taken with a Polaroid MP-3 Land Camera adapted to
accept Bausch and Lomb lenses. A 72 mm lense was used.
These micrographs are presented in Figures 46 and 47.
J. SOIL CLAY CHEMISTRY
1. General. All samples tested for chemical
properties were first air-dried and passed through a No. 4
sieve. Where further preparation was required for specific
tests, it will be noted in the discussion.
2 . Chemical analysis. In general, methods of chemical
analysis as outlined by Scott (1948), Standard Methods of
Chemical Analysis, were followed. All tests were performed
on the clay fraction of the soils and major tests are out-
lined below with results presented in Table XI.
a. Si0 2 - gravimetric. Clay is fused with sodium car-
bonate (Na 2co 3), taken up in dilute hydrochloric
acid, dehydrated, filtered, ignited and silica
volatilized with hydroflouric acid. (Scott,
p. 797-801)

73
b. Al 20 3 - gravimetric. filtrate from Si0 2 is used.
Ammonium hydroxide is added to precipitate hydro
xides of Al, Fe, Ti, etc. Al 2o 3 is calculated
by difference after determination of Fe 2o 3 ,
Ti0 2 , P2o5 , and MnO.
c. Fe 2o 3 - volumetric. Oxides are fused with potas
sium acid sulfate (KHS0 4), taken up in dilute
sulfuric acid (H 2so 4), reduced with test lead,
and titrated with potassium permanganate.
(Scott, p. 470)
d. Tio 2 - colorimetric. Determination of titanium
with hydrogen peroxide. (Scott, p. 987)
e. CaO - volumetric. Oxalate is added to filtrate
from precipitation of Al, Fe, hydroxides, etc.
forming a precipitate of calcium oxalate - dissolved
in dilute H2so 4 and titrated with potassium
p erma n g an ate . ( S cot t , p . 21 0 )
f. MgO - gravimetric. Ammonium acid phosphate
(NH 4) 2HP0 4 is added to filtrate of calcium oxalate
precipitation - forms precipitate which is ignited
to form magnesium pyrophosphate from which MgO
is calculated. (Scott, p. 532)
3. Soil pH in water. Various soil-water ratios have
been used in pH determinations with a pH increase noted as
the soil-water ratio decreases. As recommended by Peech
(1965) in Methods of Soil Analysis a 1:1 ratio was used in

I
TABLE XI I
Summary of pH and Cation-Exchange
Capacity of Ozark Soils
Soil (Darn) pH CEC (rneq/100 gr)
Timberline 5.1 27.8
Terre Du Lac 7.1 27.9
Masters #1 5.4 21.9
Masters #2 7.5 35.8
Sunrise South 6.5 24.6
Sunrise Central 4.9 30.6
Elsey 7. 7 26.9
Blackwell 7.5 24.1
Sayers 7. 5 44.9
Hornsey 4.8 42.1
Sunnen 4.9 11.5
Rice 5.2 8.7
Fabick 5.6 7.6
Ft. Westside 4.6 19.1
Little Prarie 7.8 13.7
Floyd --- ----
74
Si02/Al 20 3
2.55
2.53
4.57
3.20
2.52
2.38
3.79
3.50
2.56
2.46
3.82
----
----
----
----
3.66

75
this study. Twenty grams of soil were added to 20 grams of
distilled water, stirred for several minutes, and allowed
to sit for one hour. A Corning Model 12 Research pH Meter
with a glass electrode was used to measure the pH. Two
readings were taken and their average recorded in Table XII.
4. Cation-exchange capacity. The cation-exchange
capacity, CEC, was determined essentially as outlined by
Chapman (1965). The method utilizing ammonium acetate to
saturate the sample was used.
Two hundred ml. of 1 N ammonium acetate were filtered
through 10 grams of soil placed in a Gooch crucible over a
500 ml. Erlenmeyer flask. The leachate was saved for fur-
ther analysis. The soil was then filtered with 100 ml. of
ethyl alcohol to wash out the excess ammonium acetate.
The leached soil was then placed in a Kjeldahl flask
with about 30 grams of magnesium oxide, a catalyst, and 200
ml. of distilled water and boiled for distillation. Fifty
ml. of 4% boric acid was mixed with 150 ml. of the distillate
with the mixture then titrated with .1 N hydrochloric
acid. The amount of acid in ml. required to reach the
end point is noted and recorded as the value of the
cation-exchange capacity in meq/100 grams. Two samples
of each soil were tested, the results averaged and
reported in Table XII.
5. Flame photometry. Na+ and K+ were determined by
use of a Coleman Flame Photometer with a Coleman Electric

TABLE XIII
Concentration of Mg, Ca, Na
and K Cations in meq/100 grams
Soil (Dam) Mg++ Ca++ K+
Timberline 9.3 10.1 0.50
Terre Du Lac 10.1 12.2 0.40
Masters #1 11.7 5.8 0.36
Masters #2 20.6 11.6 0.76
Sunrise South 11.0 9.4 0.48
Sunrise Cent. 9.3 9.0 0.75
Elsey 21.3 6.5 0.79
Blackwell 14.6 13.6 0.60
Sayers 34.3 12.5 0.71
Hornsey 13.5 10.8 0.90
Sunnen 2. 8 1.4 0.45
Rice 1.4 5.1 0.31
Fabick 1.8 2.7 0.20
Ft. Westside 3.6 4.0 0.42
Lt. Prarie 7. 7 15.3 0.38
76
Na +
0.40
0.90
0.39
1. 50
0.66
0.46
0.41
0.30
1.15
0.41
0.20
0.19
0.21
0.22
0.68

77
Colorimeter. The theory is explained in the article by
Rich (1965) in Methods of Soil Analysis.
The leachate from the CEC determination was placed in
a 250 ml. volumetric flask and brought to volume with the
addition of ammonium acetate. Standard solutions contain-
. k fN+ d + .. lng nown amounts o a an K ln ammonlum acetate were
tested and the results used to construct graphs of colori-
meter readings versus ion concentration of meq/100 gr. of
soil. Two samples of each soil were then tested for each
ion, correlated with the graphs to determine concentration,
the values averaged, and reported in Table XIII.
6. Absorption spectrophotometry. The leachate from
the CEC determination was also used in the determination of
++ ++ Mg and Ca . Five ml. of the leachate was placed in a
50 ml. volumetric flask and brought to volume with 1000
ppm. lanthanum. A Jarrell-Ash Atomic Absorption Flame
Emission Spectrophotometer was used to analyze the samples.
Standard solutions of Mg++ and Ca++ were tested to construct
graphs relating the cation concentrations and the spectra-
photometer values. Two samples of each soil were tested,
the values averaged, and reported in Table XI I I. This
method of testing is described by Prince (1965) in Methods
of Soil Analysis.
K. SPECIFIC GRAVITY
Specific gravity tests were performed essentially as
outlined by ASTM D854-58 (1965). The results of testing

78
TABLE XIV
Specific Gravity of Ozark Soils
Soil (Dam) Specific Gravity
Fabick 2.68
Rice 2.70
Ft. Westside 2. 7 2 ' 2.72
Sunnen I 2. 7 2' 2.73
Blackwell 2.74
Lt. Prarie 2.77
Elsey 2.79
Floyd 2. 8 0' 2.80
Sunrise Cent. 2.82
Sunrise South 2. 8 2
Terre Du Lac 2.82
Timberline 2.83
Masters #1 2.83
Masters #2 2.84
Sayers 2.84
Hornsey 2.84, 2.84

79
are presented in Table XIV. The dessicated nature of the
samples required some special procedures to be followed
to assure sample dispersion. The samples tested were air
dried. Two samples identical to the one tested were oven-
dried for 24 hours at 105°C. The average moisture content
for the two samples was calculated and used as the moisture
content for the tested sample.
The samples were soaked for longer than 24 hours in
distilled water before testing. The method of air
removal by boiling the sample for 10 minutes was followed.
As Table XIV indicates, several soils were tested twice
and reproductive results were obtained~
L. CORRELATION TESTS
Data to be correlated was analyzed by a computer
program written by Capt. W. Vogel, U.S. Army Corps of
Engineers, a graduate student in Civil Engineering at the
University of Missouri - Rolla. A P-PLOT option was
implemented to plot the data and curves developed by the
analysis. A least squares polynomial of the form:
Y = A(O) + A(l)X + A(2)X 2 + •.• + A(N)XN was used to
analyze the data and to evaluate A(O), A(l), ... A(N).
Two values, sigma (a) and the correlation coefficient
(r) were used to evaluate the curve fit where:
where: x = X - X
y = y - y

TABLE XV
Correlations for Clayey Residual
Ozark Soils
x- axis y-axis Sigma Correlation Coordinate Coordinate (a) (r)
Plastic Limit Optimum Moist. 7. 9 0.92
Liquid Limit Optimum Moist. 10.6 0.90
Cation-Exc. Cap. Optimum Moist. 14.3 0.86
% Clay Optimum Moist. I 9.7 0.90
9-D Clay* Optimum Moist. 8.8 0.95
Plastic Limit Max. Dry Density 8.1 -0.89
Liquid Limit Max. Dry Density 19.2 -0.88
Cation-Exc. Cap. Max. Dry Density 23.0 - 0. 8 7
9-0 Clay Max. Dry Density 5.9 -0.96
% Clay* Max. Dry Density 10.9 -0.97
Optimum Moist. Max. Dry Density 15.1 0.90
Cation-Exc. Cap. * % Clay 155 0.88
Cation Exc. Cap. Plastic Limit 9. 2 0.91
Cation Exc. Cap. Liquid Limit 139 0.81
% Clay Plastic Limit 13.4 0.87
% Clay Liquid Limit 61.1 0.95
80
Coef.
------
*Correlations include values for sandy residual soils

and,
a =
2 E(y - Ycalc)
N - k - 1
where:
81
N = no. of data points
k = degree of polynomial
Ycalc = calculated y value for a given x value
The correlation curves resulting from this analysis
were plotted and presented as Figures 30 thru 45 along
with the values of sigma (cr) and the correlation
coefficient (r). These values are summarized in Table
XV.
The correlation coefficient, r, has a range in values
from -1.0 to +1.0. Perfect correlation is demonstrated
where r = ±1.0. Sigma (cr) is a common statistic used in
the earth sciences to express the summation of deviations
of data from a curve fitted through that data. The value
of sigma which indicates a significant relationship depends
on the order of magnitude of values being correlated.

82
VI. ANALYSIS OF RESULTS
A. CLAY MINERALOGY
The mineralogy of the residual soils will be discussed
in sections corresponding to the method of testing. No
method of testing in itself produced definitive data on
which to identify the clay mineralogy of the soils, but
when they are considered along with the probable environ-
ment of soil formation, a clear picture of the mineralogy
is developed.
1. X-ray analysis. Several x-ray diffractograms of
the soils investigated in this study are shown in Figures 10
and 11. Powder slides were x-rayed to produce the diffracto-
grams.
The major peaks shown on these diffractograms are
0 0 located at the following 28 angles: 12.0-12.4 , 20.0 , 0
21.0°, 25.0-25.4°, and 26.7°. The peaks at 21.0° (4.26 A) 0
and 26.7° (3.34 A) are quartz peaks. The 12.0-12.4° 0 0
(7.15± A) and 25.0-25.4° (2.54± A) peaks represent basal 0
001 and 002 kaolinite reflections and the peak at 20.0 0
(4.45± A) represents the 020 kaolinite mineral reflection.
The reflections which occur for some soils at 20 angles of 0 0
24°± (3.71 A) and 33°± (2.72 A) appear to represent the
021 and 022 reflections of the same group. 0
The reflections which occur at 10± A (Masters #1 and
Floyd) are probably basal illite peaks whereas those in the

83
0
area of 13.4-15± A (Timberline, Terre DuLac, etc.)
probably represent chlorite or montmorillonite group
minerals in the soil. The weak peaks indicate that only
minor amounts of these minerals are present.
The apparent major constituent of the soils studied,
based on the spacing~ magnitude and size of the reflection;
is a mineral of the kaolin family, probably halloysite or
kaolinite. Brindley (1961) describes the x-ray character-
istics of each in detail. In attempts to distinguish
between the two~ he used the relative intensity of the 0
basal 001 peak and those near 4.4 A, the 020 reflection.
For kaolinites, the usual situation is for the magnitude
of the 001 reflection to be twice that of the 020 reflection.
For poorly crystallized kaolinites, the reflections may be
more nearly equal; for halloysite the 020 reflection is
usually greater than that of the 001 reflection (Figure 10) .
Bramao et al (1952) compares the 002 and 020 reflec
tions. Where the intensity of the 002 peak is greater
than that of the 020 peak, kaolinite is indicated; where
the intensity of the 020 peak exceeds that of the 002 peak,
halloysite is predominant. In the diffractograms of the
residual soils studied in this investigation, the 020 peak
intensity exceeds that of both the 001 and 002 basal peaks;
therefore, halloysite is indicated. The broadness of the
basal 001 and 002 peaks is also a characteristic of hal
loysites (Grim, 1953).

84
Several features of the x~rays indicate that halley~
site may not be the major clay constituent of the Ozark
soils. The 001 peak for most of the samples occurs between 0
7.0 and 7.2 A. This peak is generally located between 0 0
7.35 and 7.5 A for halloysites versus 7.15 A for kaolinites,
even poorly crystallized kaolinites.
Tests of several samples treated with potassium acetate
and ethylene glycol, as recommended by Miller and Keller
(1963), indicate no permanent expansion of the crystal
lattice from the area of the 001 peak at 7.2 A. Figure 12
illustrates the results of these tests. This indicates
that halloysite is not a major constituent of these
samples.
Grim (1953) discusses three factors which affect the
diffractograms of the kaolin minerals. The first is the
effect of displacement of the unit sheets with respect
to each other, particularly in the a and b~axis directions.
The displacement results in broad diffraction patterns
rather than sharp peaks. Secondly, a particular kaolin
mineral may be interlayered with another kaolin mineral or
a number of other clay minerals. Weakened and displaced
peaks result. Finally he notes that the shape and size
of particles affect the diffractograms.
Brindley (1961) discusses the affects of b~axis
disordered kaolinites (similar to the kaolinite pM of
Mackenzie, 1957) on x~ray patterns. He states that the

85
Treated with Potassium Acetate
Untreated
002
30 26 24 22 20 18 16 14 12 10 8 6
2 8 in Degrees
FIGURE 10. X-Ray Diffractograms of the Sayers Soil
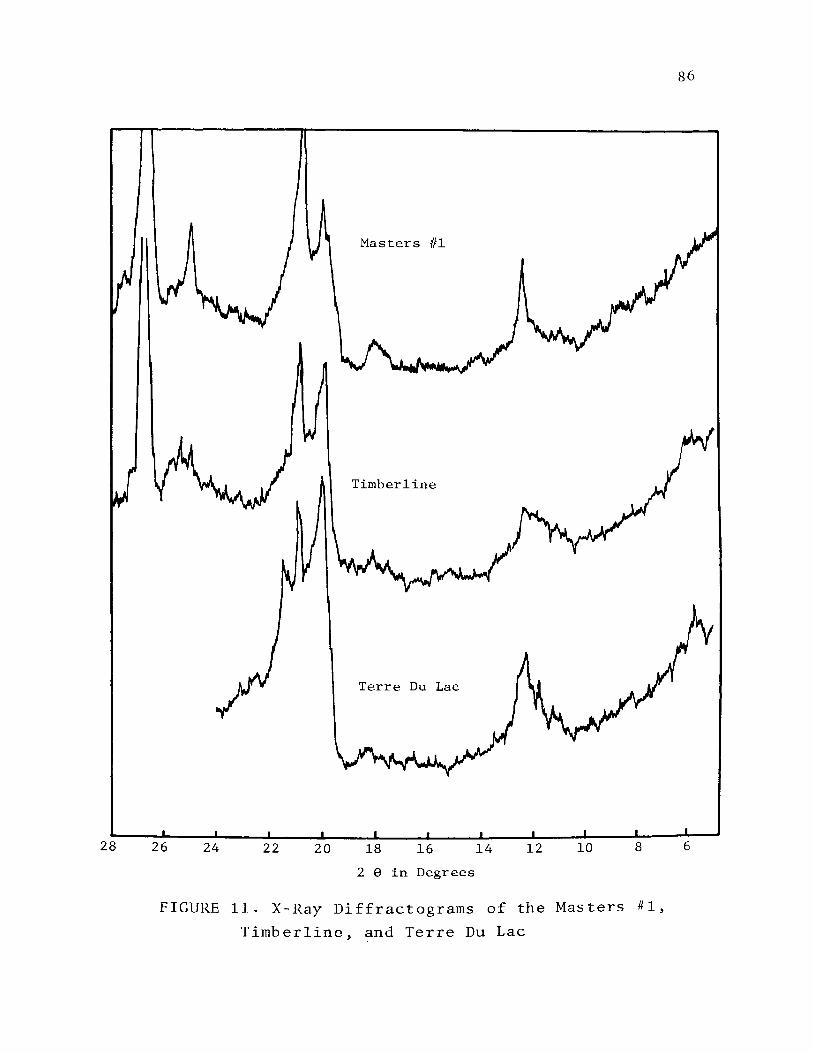
28
Masters Ill
Timberline
Terre Du Lac
24 22 14
2 8 in Degrees
FIGURE 11. X-Ray Diffractograms of the Masters #1,
Timberline, and Terre Du Lac
86

26
Shift in
Kaolinite Treated with
Potassium Acetate
Untreated Georgia Kaolinite
24 22 20 18 l6 14 12 10 8
2 6 in Degrees
FIGURE 12. Shift in 001 Peak of Georgia Kaolinite
When Treated With Potassium Acetate
87
6

88
only visible effect of this disordering is the strengthening
of the 020 diffraction band and a sharp low-angle termin
ation of that peak. These features are evident in the
diffractograms of most of the soils tested in this study,
including the Sayers soil, Figure 10.
Brindley and Robinson (1947) illustrate broadening
and lowering of intensity of peaks with a decrease in cry
stallinity. Murray and Lyons (1956) present data to sub
stantiate this effect of degree of crystallinity. They
also demonstrate that particle size varies directly with
the degree of crystallinity, larger particles being better
crystallized.
Conflicting data for the special case of a b-axis
disordered kaolinite are presented in Robertson et al
(1954). This kaolinite exhibits very good crystallinity
even with very fine particle size, on the order of 0.2
microns. The low intensity and broad peaks of the
diffractograms are the result of fine particle size, not
of poor crystallinity. It would appear that in most
soils, both decreasing clay mineral particle size and
degree of crystallinity act to broaden and weaken the
reflections of x-ray peaks.
The residual soil x-rayed in this study shows a
marked degree of asymmetry of the 001 peak sloped to the
low-angle side. Keller (1968), in a study of flint clays
which shows similar patterns, attributes this feature to

89
mixed layering of the kaolinite, probably with water but
possibly with illite. Mixed layering of kaolinite and
chlorite (Brindley and Hillery, 1953) also produces 0
similar asymmetry. The reflection around 10 A and 0
13-15 A noted in several of the sample diffractograms may
be an indicator of mixed layering.
Grim (1953) states that chlorite may be confused with
kaolinite, especially if the clay is iron rich. The iron 0
can result in weak first order (14 A) and third order 0
(4.7 A) basal peaks. This leaves the second order 0
chlorite peak at 7.2 A to be confused with the 001 basal
peak of kaolinite. A sample of Sayers soil was leached
with HCl and showed no reduction of the intensity of the 0
7.2 A peak. This indicates that chlorite which is more
soluble in HCl than kaolinite is probably not a major
soil constituent.
The possibility that iron oxide might "coat" the clay
particles in some manner scattering the x-rays and contri-
buting to the broadness and lack of intensity of the 001
peak was considered. The Sayers sample which was leached
with HCl to remove the acid soluble oxides, including
iron, when x-rayed showed no sharpening of the 001 peak.
This indicates that the iron oxide is not the factor
responsible for the shape of the peaks (Figure 10).
In summary, the diffractograms show some character
istics of halloysite, kaolinite, some mixed layering, and

90
minor amounts of chlorite, illite, and montmorillonite.
First appearances suggest halloysite to be the major clay
mineral in the soils. Further study shows that these fea
tures which suggest halloysite may also be the product of
a fine-grained and/or poorly crystallized kaolinite which
possibly exhibits some b-axis disordering.
Some mixed layering, probably with water, is indicated
and adds to the confusion. Results of tests on the samples
treated and x-rayed as outlined by Miller and Keller (1963)
are a solid indicator that halloysite is not the major
clay mineral. Several authors note the risks of clay
mineral identification based on x-ray data alone since
so many factors may combine to affect the final diffrac
tograms.
2. Differential thermal analysis. Differential ther
mal curves for the clay minerals vary with several factors
related to both test procedures and the nature of the
minerals tested. Careful and consistent sample preparation
and testing should eliminate variations between curves due
to these factors.
The curves obtained in the current study all show
to varying degrees the following characteristics: (1) a
low temperature endothermic peak which generally occurs
between 100-135°C, (2) a major endothermic peak which
occurs in the area of 535-560°C, and (3) an exothermic
peak generally developed between 910-930°C. A number of

91
these curves are presented as Figures 13 thru 17. A
summary of the temperatures at which the endothermic and
exothermic peaks occur are reported in Table X. Two samples
of several soils (Timberline, Elsey, Georgia kaolinite) were
tested and the peak temperatures of the two samples agree
very well.
According to Mackenzie (1957) the low temperature
(100-135°C) peak is due to the removal of: (1) water
adsorbed on the surface of clay particles, (2) interlayer
water, or (3) water associated with amorphous silica or
alumina gels. The major endothermic peak at 535-560°C is
related to the expulsion of water from the crystal lattice.
There is disagreement as to the cause of the exothermic
peak, but researchers believe it is due to the formation
of a-Al 2o3 and/or mullite. This reaction begins at a
temperature of about 900°C and extends well past 1000°C.
Bradley and Grim (1951) present a more detailed investi
gation of the nature of the high temperature reaction
which goes beyond the scope of this investigation.
Kaolinite pM (Mackenzie, 1957), which has disordered
shifts in the stacking of the unit sheets, and halloysite
produce differential thermal curves which appear much like
those obtained in this study. The curves also have many
of the features of a mixture of illite and kaolinite as
studied by Grim (1947). Mixtures of kaolinite with other
triple-layer minerals might also produce these features.

92
Two features of the curves tend to indicate that the
soils are not predominantly halloysite. A sample of the
reference halloysite, Indiana Halloysite, was dried in an
oven for 12 hours at 70°C and then subjected to DTA. This
sample shows a pronounced low temperature water loss even
after oven drying. A sample of Floyd soil was oven dried
for only 3 hours at 70°C, but all trace of the low
temperature water loss disappeared. If a significant
amount of halloysite was contained in the Floyd sample,
some low temperature water loss should have been indicated.
These comparisons are illustrated in Figure 16. A sample
of Masters #2 which was oven dried for 12 hours at 70°C
still showed a significant low temperature peak.
Bramao (1952) studied the shape of the major endo
thermic curve, particularly the degree of asymmetry devel
oped when halloysite soils were analyzed. He expresses
the asymmetry as the Slope Ratio (S.R. = tana/tanS), and
found values for kaolinites varied from 1.78 to 2.39 with
a mean of 1.55 while values for halloysite varied from
2.50 to 3.80 with a mean of 3.11. Correlation with test
results of other published DTA curves for the two minerals
confirmed his observations. The maximum slope ratio for
soils tested in this study is in the order of 2.10, indi
cating that halloysite is not a major constituent of the
soil, but other factors as particle size and degree of
crystallinity probably affect values of slope ratio.

GEORGIA KAOLINITE
INDIANA HALLOYSITE
FIGURE 13. Differential Thermal Analysis of
Georgia Kaolinite and Indiana Halloysite
;0 ... 0.
1.0 VI

M A S T E R S n o. 2
M A S T E R S n o. 1
BLACKWELL
E L S E Y
FIGURE 14. Differential Thermal Analysis of Ozark Soils \.0 ~
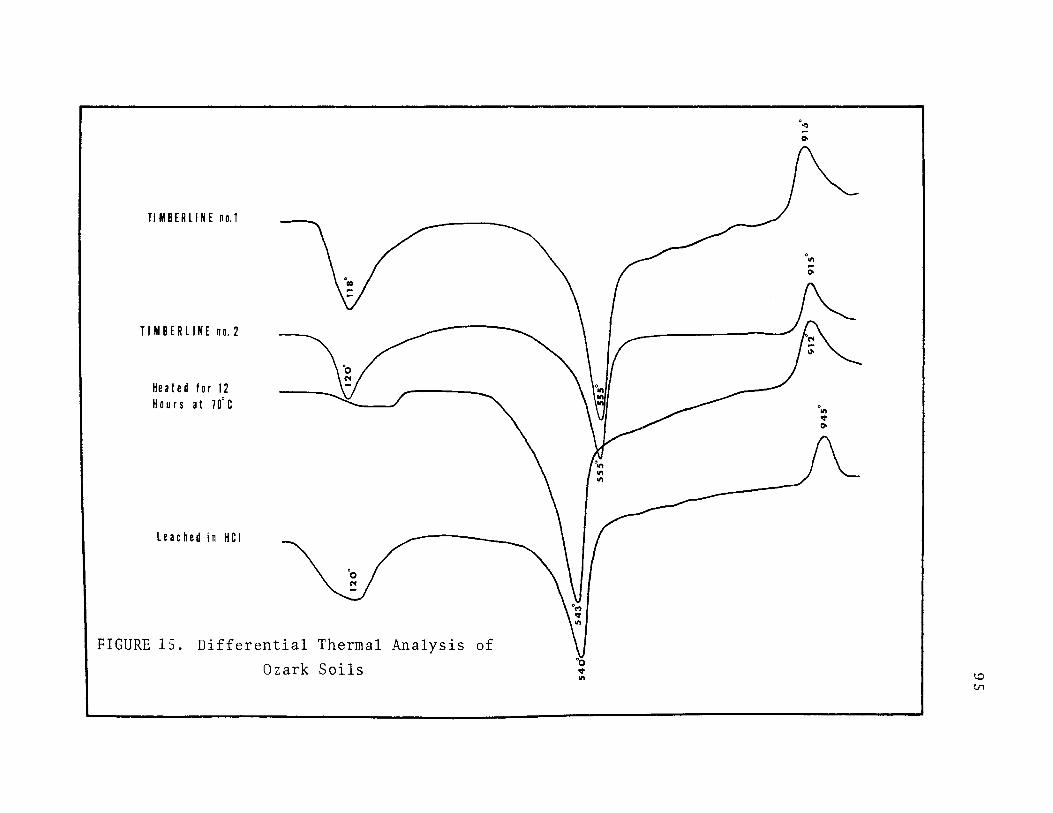
TIMBERLINE no.l
T I M B E R Ll N E no. 2
He a ted for 12 H o u r s at 7 o· c
Leached in HCI
FIGURE 15. Differential Thermal Analysis of
Ozark Soils •o .. Ill
·.., -0.
.Ill
1.0 (/1

HORNSfY
HORNSfY-Ieached
fL 0 Y D
FLOYD- dried for 3 h o u r s a t 7 o' c
FIGURE 16. Differential Thermal Analysis
of Ozark Soils
0 Ill
o-
\D 0\

SUNRISE SOUTH
TERRE DULAC
SAYERS
~
FIGURE 17. Differential Thermal Analysis of Ozark Soils
..... ~ .,
"o " 0.
~ "'-l

98
Some features of these curves do not correlate with
curves of kaolinite, even the disordered kaolinite pH.
They show the major endothermic peak reaction around 535~
560°C versus 550-580°C for kaolinite pM and about 580°C
for halloysite. The depressed exothermic peak for the
soils tested in this study occur at 910-930°C versus
960-980°C for kaolinites and 970~980°C for halloysite.
Several factors might act singularly or together to
lower these peak temperatures. Speil (1944) reports sev
eral effects of a decrease in particle size induced by dry
grinding including: (1) a gradual increase in the size of
the low temperature endothermic peak, (2) a decrease in
the size and reduction of the temperature of the major
endothermic peak, and (3) a reduction in the size of the
exothermic peak. The curves of the Ozark soils, when compared
with the standard kaolinite and halloysite, exhibit these
effects. Carthew (1955) substantiates Speilts findings but
found the effect of particle size only related to the minus
2 micron fraction.
In reporting their study of refractory clays,
Grimshaw et al (1945) produce data which conflicts with
Speil's and Carthewts finding in that they noted a lowering
of the peak temperatures due to a decrease in crystallinity,
but not due to a decrease in particle size alone, This
conclusion has been substantiated in a study by Volostnykl
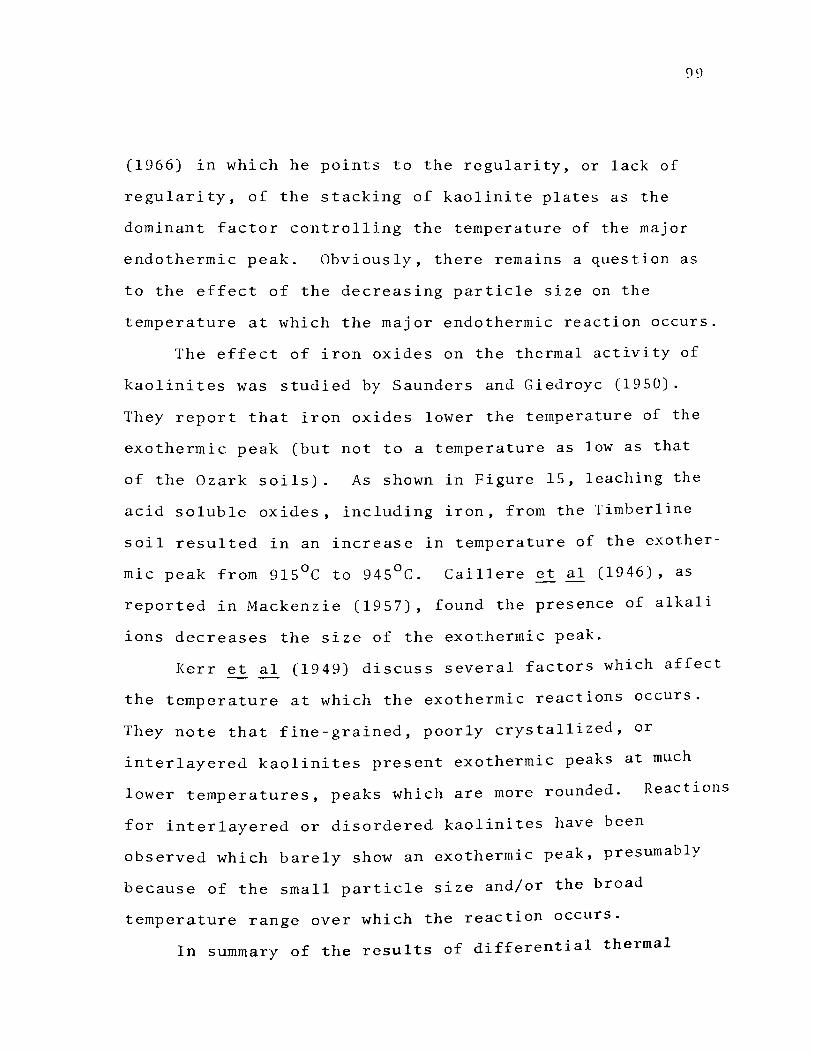
99
(1966) in which he points to the regularity, or lack of
regularity, of the stacking of kaolinite plates as the
dominant factor controlling the temperature of the major
endothermic peak. Obviously, there remains a question as
to the effect of the decreasing particle size on the
temperature at which the major endothermic reaction occurs.
The effect of iron oxides on the thermal activity of
kaolinites was studied by Saunders and Giedroyc (1950).
They report that iron oxides lower the temperature of the
exothermic peak (but not to a temperature as low as that
of the Ozark soils). As shown in Figure 15, leaching the
acid soluble oxides, including iron, from the Timberline
soil resulted in an increase in temperature of the exother
mic peak from 915°C to 945°C. Caillere et al (1946), as
reported in Mackenzie (1957), found the presence of alkali
ions decreases the size of the exothermic peak.
Kerr et al (1949) discuss several factors which affect
the temperature at which the exothermic reactions occurs.
They note that fine-grained, poorly crystallized, or
interlayered kaolinites present exothermic peaks at much
lower temperatures, peaks which are more rounded. Reactions
for interlayered or disordered kaolinites have been
observed which barely show an exothermic peak, presumably
because of the small particle size and/or the broad
temperature range over which the reaction occurs.
In summary of the results of differential thermal

100
analysis, the similarity of curves for most of the soils
studied indicates similar mineralogy. Analysis of the
DTA curves and the factors which might have affected them
indicate the probability that the major constituent of the
soils is a kaolinite with perhaps a minimum amount of hal
loysite with the possibility of triple-layer clay minerals.
The size and generally low temperature at which the various
endothermic and exothermic reactions occur is probably the
result of poor crystallinity and small particle size of
the clay minerals. The iron content, the presence of
alumino-silicate gels, possibly allophane, and the nature
and concentration of adsorbed cations each probably have
an effect to an undetermined degree on the curves.
3. Thermogravimetric analysis. Ross and Kerr (1931,
1934), Nutting (1943), and Mielinz et al (1953) present a
number of dehydration curves of kaolin group minerals.
Dehydration curves of several of the Ozark soils are pre
sented in Figure 18 along with the curves of the reference
halloysite and kaolinite. Except for the curve obtained
from the test on Georgia Kaolinite, the curves display
some low temperature water loss, major water loss between
500-600°C (related to the major DTA endothermic peak) and
very little water loss above 600°C.
Grim (1953) notes, "Variations in the specific char
acteristics of the minerals being studied, such as grain
size, crystallinity, nature of adsorbed ions, etc., affect

,......_ ~ ..._,
UJ UJ 0
,...l
1-< (!)
4-J
~
16~-4------~------~~~~======!
10
8
6
• Sayers
• Terre Du Lac
4 • :f\fasters 1
• Georgia Kaolinite .. Indiana Ha1loysite
2
0 ____ _. ________ ~--------~~--------~------~
200
FIGURE 18.
400 600 0
Temperature C
800
Thermogravimetric Analysis
1000
] 0 1

102
dehydration results." The Ozark soils do exhibit rather
high initial water loss which even exceeds that of the
reference halloysite. The factors of fine particle size,
poor crystallinity, and/or presence of alumino-silicate
gels probably produce this unusual water loss. It is not
possible to isolate the exact clay mineralogy from these
curves.
4. Electron microscopy. Clay particle size and shape
parameters are best determined from transmission electron
micrographs. The moderately well-developed hexagonal
clay plate and the elongated plate shown in Figures 19
and 20 illustrate the highest degree of crystal development
of any particles observed during this investigation. This
hexagonal plate was the only one observed in a study of
two soils (Hornsey and Terre DuLac); the elongated plates
were fairly common. The several particles in the aggregates
shown in Figures 21 and 22 are somewhat less well developed
and illustrate the most common degree of crystallinity
observed in the micrographs.
These micrographs also illustrate the predominant
particle size range determined from the transmission
microscopy portion of the study. This size is in the
order of 0.4 to 1.0 microns.
The scanning electron micrographs of the powdered
samples also indicate that the clay minerals are poorly
crystallized. Most of the particles appear to exist in

FIGURE 19. TEM Terre Du Lac
Suspended Sample
(57000X)
¥IGURE 20. TEM Terre DuLac
Suspended Sample
• ( SZOOOX)
I-' 0 VI

FIGURE 21. TEM Terre Du Lac
Suspended Sample
(28000X)
4
FIGURE 22 . TEM Terre Du Lac Suspended Samp le
(20000X)
t-' 0 -+:>

FIGURE 23. SEM Terre Du Lac
Powdered Sample
(lOOOX)
FIGURE 24. SEM Hornsey
Powdered Sample
( 3000X) f-' 0 (Jl

FIGURE 25. SEM Hornsey
Ped Sample
(3000X)
FIGURE 26. SEM Hornsey
Ped Sample
(lOOOOX) t-' 0 0\

107
aggregates of several particles which are difficult to
analyze. A number of the particles or aggregates display
curved surfaces. These aggregates average 1 to 10 microns
in length (Figure 23 and 24).
The scanning micrographs of the broken chips of the
air-dried peds show several features of interest. They
substantiate the general low degree of crystallinity of
clay particles shown in the earlier micrographs except for
the Terre Du Lac sample where a fair degree of platy
hexagonal or elongate crystallinity has been developed,
Figure 28.
The crumpled, swirl-like laminated structure exhibited
by the micrographs of the Hornsey sample, Figures 25 and
26, and to a degree by the Terre Du Lac micrographs is
almost identical to that developed in the kaolinitic ball
clays described and photographed by Borst and Keller
(1960). They attribute the probable cause of the deforma
tion in structure to post-depositional stresses. Forces,
possibly due to dessication, which were responsible for the
pedular nature of the Ozark soils may also be responsible
for the distorted structure.
It had been hypothesized by this investigator that as
the dessication process removed moisture from the soil-water
system and the interparticle bonding became stronger, the
clay particles would be drawn into a low density
flocculated position. This does not appear to be the

FIGURE 27 . SEM Hornsey
Ped Sample
(lOOOOX)
FIGURE 28. SEM Terre Du Lac
Ped Sample
(lOOOOX) !-" 0 00
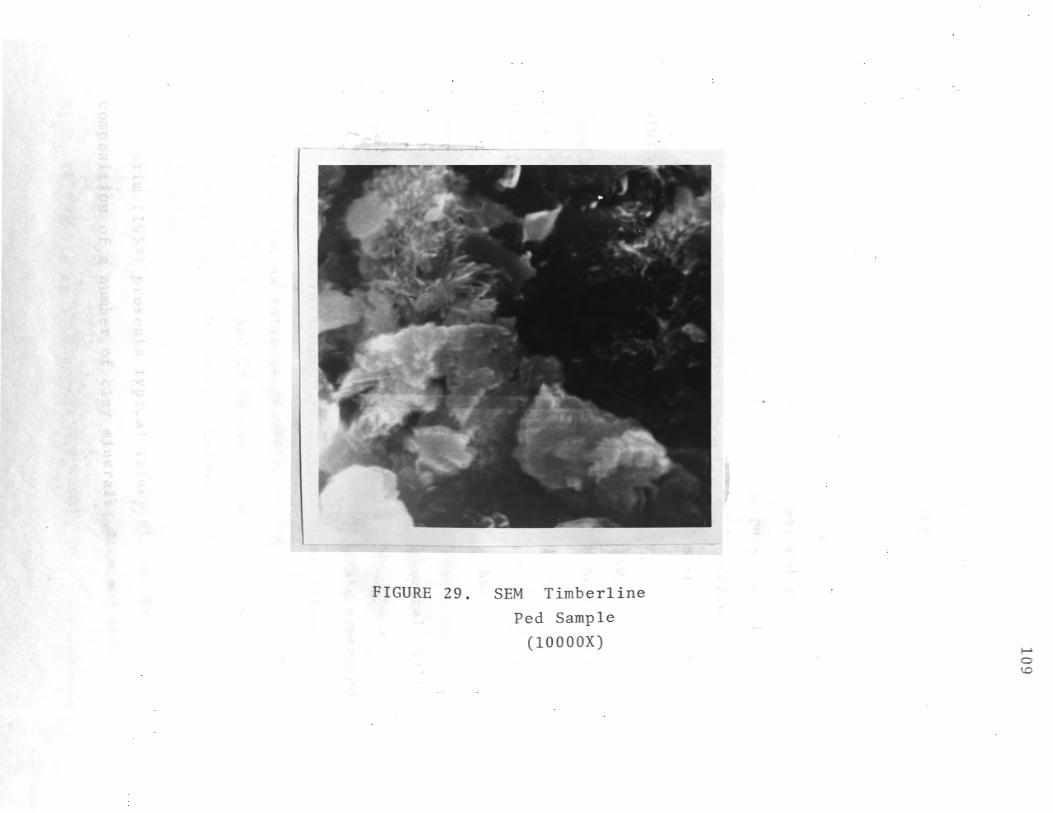
109
(])
!=: •r-1 1'"-i
(])
~
1'"-i ,--.,.
(]) p..
:>< ..0
IS
0 IS
C1l 0
•r-1 rJ)
0 E-<
0 '"d
1'"-i (])
'--'
~
p.. ~
rJ)
Gl
N
~
p:: :::::> (.9
H
~

110
case as a strong degree of parallel particle orientation
is observed in the scanning micrographs. Michaels (1959),
Trollope and Chan (1960) and other authors have postulated
this parallel orientation of particles in packets.
Microscopy studies by Sloan and Kell (1966) and others
have shown this structure to exist. The peds exhibit a
noticeable volume of voids which is probably responsible
in part for the low density of the clay soils in their
natural state.
The microscopy study shows that halloysite, if
present at all, is a minor soil constituent. No transmis
sion micrographs and only one scanning micrograph, Figure 29,
shows a tabular or tubular form which may be halloysite,
but could also be chrysotile or a number of other clay
minerals.
5. Chemical analysis. The results of chemical anal
yses performed at the Missouri Geological Survey on a
number of the soils investigated in the study are presented
as Table XI. A summary of pH, cation-exchange capacity,
and silica-alumina ratio is presented in Table XII. The
content of Na, K Mg, and Ca in meq/100 gr. as determined
at the University of Missouri - Columbia is presented
in Table XIII.
Grim (1953) presents typical values of the chemical
composition of a number of clay minerals; Ross and Kerr

1 1 1
(1934) give values for allophane. A common value used to
compare clays is the silica-alumina ratio, Si0 2/Al 2o3 .
Average values of the silica-alumina ratio as reported by
the above authors for kaolinite (theoretically 2:1) are
2.00:1 to 2.12:1; for halloysite, 2.00:1 to 2.10:1; for
allophane, 1.20:1 to 1.80:1; for illite, 3.20:1 to 4.00:1;
and for montmorillonite, 5.10:1 to 5.95:1. As Table XII
indicates, the typical values for the Ozark clay residual
soils are 2.45:1 to 2.55:1. Higher values are noted in
the alluvial-colluvial soils where silica has been
concentrated. Higher values are also noted in the soils
which have a high chert (silica) content as Floyd and
Blackwell.
The silica-alumina ratio for the residuals of 2.45:1
to 2.55:1 may be caused by a mixing of some illite and
montmorillonite in with kaolinite. Another cause may be
that some octahedral layers may have iron replacing
alumina which would result in a higher ratio. Still
another cause could be the presence of silica-rich gels in
the clay.
The Ozark soils exhibit a relatively high (6-12%)
iron content. A number of possible effects of this
occurrence have been discussed in earlier sections.
Table XI shows that for three soils tested (Sayers,
Terre Du Lac, Hornsey) approximately 90 percent of the
Al 2o3 is soluble in 12.1 normal HCl. This indicates that

112
a majority of the alumina in the soil is not crystallized
or is poorly crystallized. When results of other tests
are considered along with this evidence, the latter,
poorly-developed crystalline state is indicated. Keller
(1970) notes that soil acids can cause the breakdown of
even well-crystallized kaolinites. This effect is thought
to be much more severe for poorly-crystallized or
disordered kaolinites.
6. Summary. The x-ray diffraction, differential
thermal analysis and the thermogravimetric analysis com
bined with a study of the electron micrographs indicates
that the major clay minerals of all of the residual Ozark
soils investigated in this study are poorly crystallized
kaolin minerals. If placed in Bates' (1959) morphological
series, these minerals would be classified as elongate
kaolinite crystals with possibly some particles as a
transitional phase between the elongate crystals and
halloysite.
Two or more phases of clay morphology may be repre
sented in the Ozark soils. One may be the better
crystallized, elongate platy crystals. Another phase
represented by less well-developed crystallinity may be a
precurser (Keller et al, 1970) of kaolinite or halloysite.
This phase or other phases may be the result of post
formational crystal destruction enhanced by soil acids.
Bramao's discussion of the probable mode of formation

113
of these soil clay kaolins aptly describes the Ozark setting
in which the clays were formed. It is to be expected that
the result of changing soil conditions and interrupted
formational cycles would be poorly developed and varying
clay morphology.
Minor amounts of chlorite, illite, and montmorillonite
are indicated. The presence of an undetermined amount of
allophane or an alumino-silicate gel of some nature is
also indicated.
B. SOIL CLASSIFICATION AND CATION-EXCHANGE CAPACITY
The results of Atterberg Limits tests are presented in
Table VII with results plotted on the plasticity chart,
Figure 29. Results of gradation tests are presented as
Figures 3 thru 8. Table IV summarizes the results of the
gradation tests.
Before sieve analysis, all materials retained on the
No. 4 sieve was discarded. This material was predominantly
chert. Earlier sections of this discussion noted that the
proportion of chert throughout the soil varies widely and
that the percentage in any one sample is not a diagnostic
value. The fines is defined as that material passing the
No. 200 sieve. Clay is defined as that material (colloids)
finer than 2 microns (0.002 mm).
Except for the sandy residual soils, the soils invest
igated have 85 percent or more fines and 60 percent or more
clay. Several of the clay residuals have greater than 90

114
percent clay. ThB sandy residual soils have 60 to 80
percent fines but only 20 to 40 percent clay. These soils
are composed primarily of fine sand and silt size particles.
All but three of the soils plot as CH or CL on the
plasticity chart. The Hornsey soil plots just below the
A-line as a MH soil. The Rice and Fabick sandy residuals
are CL-ML soils.
Definite relationships are noted between the Atterberg
Limits and the percent clay. Davidson and Sheeler (1952)
note a general relationship between the clay fraction and
the liquid limit and plastic limit.
The clay content of the clayey residual soils was
correlated with the liquid limit and the plastic limit,
Figures 30 and 31. A linear curve fits both sets of data
fairly well, but a concave upward second or third degree
curve fits both sets of data more closely. It is suggested
that at higher clay contents, notably above 90 percent,
that the soil is more "sensitive" to other factors than to
increases in percent clay. For high clay content soils,
as water is added up to the liquid limit the electro-chemical
nature of the soil-water system has a noticeable effect on
the Atterberg Limit values. The cation-exchange capacity is
a measure of this electro-chemical potential of the clay
soils. Values of the cation-exchange capacity determined
for the Ozark soils are presented in Table XII along with
soil pH and silica-alumino ratio.

"""' IN! '-./
.u ·r-1 s
•r-1 ....:l
"0 •r-1 ;:1 0"
•r-1 ....:l
100 Linear y = -3.81 + 1.05 X rr = 61.1 r = 0.95 2
Best Fit y = 49.47 - 0.61 X+ 0.012 x tr = 50.2
I 0 80
I ~~ 0 0
60
40
20_~------~--------~--------L-------~--------~--------L-------~--------jL 55 -~ 6u 65 85 70 80 75 90 95
Clay Content (%)
FIGURE 30. Clay Content Versus Liquid Limit (Clay Residual Soils) f---0 f---0 Ul

"" ;;-e "-'
+J -M a -M ~
0 ·rl +J {/)
til ..... fl.!
Linear
Best Fit 40
35
30
25
y = 2.52 + 0.36 x cr = 13.4 2 y = 32.70- 0.56 X+ 0.007 X
r = 0.87
cr = 9.6
0
0? '/
/ /0
,
// / 0
0// /, 0
//
0
I
0
o I I
I I
0
20 ' I I I I I I I 30 40 50 60 70 80 90 100
0--:------
Clay Content (%)
FIGURE 31. Clay Content Versus Plastic Limit (Clay Residual Soils)
f-' f-' 0\

117
The Sayers and the Hornsey soils both contain 93
percent clay but the liquid limit of the Sayers is 105
compared to 90 for the Hornsey. The cation-exchange
capacity of the Sayers is 44.9 whereas that of the Hornsey
is 42.1. Masters #2 has 95 percent clay and a cation
exchange capacity of only 35.8. The result is that Masters
#2 has a lower liquid limit and plastic limit than does
Sayers.
This does not mean that the cation-exchange capacity
is by itself the factor controlling the limit indices. The
cation-exchange capacity was correlated with the liquid
and plastic limit, Figure 32 and 33. The degree of
correlation is similar to that of the correlation of the
clay content versus the limit indices. This similarity
suggests that a combination of influence of clay content
and cation-exchange capacity on the limit indices exist.
Data presented above indicates that at higher clay contents,
the cation-exchange capacity of the soil has the dominating
effect on Atterberg Limits.
Cation-exchange capacity is a property of the clay
fraction of the soil. The degree of correlation between
these two factors, cation-exchange capacity and clay content,
was determined and presented in Figure 34. A fairly linear
relationship appears to exist between these factors up to
a clay content of about 90 percent. Above that point the
curve flattens and it is postulated that again the cation-
exchange capacity becomes more important. The soils which

40 0
20L_--~L---~----~----~----~----~----~----~ 5 10 15 20 25 30 35 45 40
Cation-Exchange Capacity (meq/100 gr.)
FIGURE 32. Cation-Exchange Capacity Versus Liquid Limit (Clay Residual Soils)
I-" I-" 00
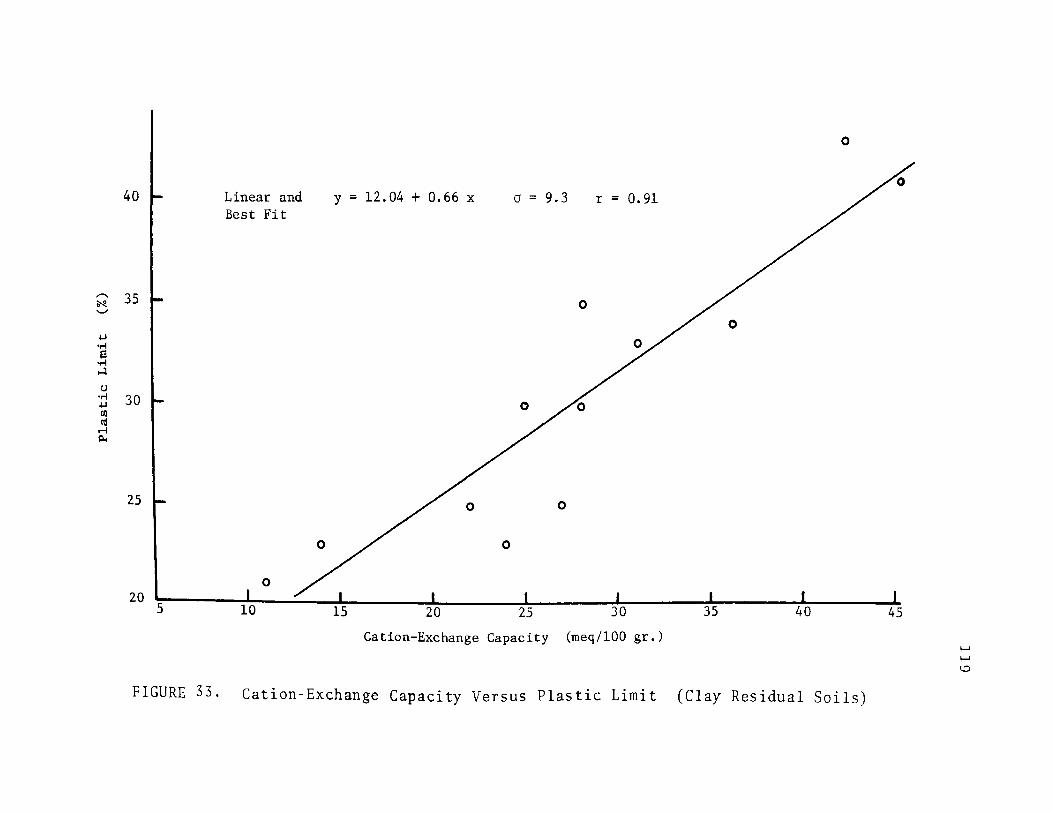
......._ N .......,
.j.J
•rl a
•rl ...:1 t)
•rl .j.J (I)
t\1 ...-t ~
40
35 r 30 r
25
20 5
Linear and Best Fit
0
0
y = 12.04 + 0.66 X cr = 9.3 r = 0.91
0
/ 0
0
0 0
0
20 25 30 35 40
Cation-Exchange Capacity (meq/100 gr.)
FIGURE 33. Cation-Exchange Capacity Versus Plastic Limit (Clay Residual Soils)
45
f-1 f-1 \.0

"'"" IN! .._,
.j.J
~ Q) .j.J
~ 0 u :>. ~ r-i u
100
80
60 I
40
20
0 // / .
~ ~
0
0
/
0 ,o/ //
/./'0 0
// ~o/
Linear y = 15.81 + 2.02 X
Best Fit 2
y = -17.74 + 5.21 X- 0.06 X
0
A"',..... _....~
a = 155.1
a = 89.2
r = 0.88
oL---~----~L------L------L------J------~------~----~--40 45 10 15 20 25 30 35
Cation-Exchange Capacity (meq/100 gr.)
FIGURE 34. Cation-Exchange Capacity Versus Clay Content (All Soils)
1-' N 0

121
appear to control the deviation from linearity of the curve
(Terre Du Lac, Sayers, Masters 2) are the same soils which
have high cation-exchange capacities. The concentrations of
the more common exchangeable cations which compose the
cation-exchange capacity are presented in Table XIII.
These observations are consistent with discussions by
Grim and others covered in the literature review with regard
to the clay-water system and the effect of cation concen-
tration on the system. Increased cation concentration
results in an increase in the attraction between the
particles. More water is required to dilute the concentra-
tion to reduce particle attraction, and to reduce
flocculation, which allows the liquid limit shear failure
to develop.
With regard to the plastic limit, the higher cation
concentration produces a flocculated microstructure which
resists deformation at a fairly high moisture content.
Conversely, soils with lower cation concentrations have a more
dispersed structure which allows manipulation and water
expulsion until a lower moisture content is reached.
The effect on Atterberg Limits of dispersing the clay
soil with sodium is illustrated in Table VI. It is
thought that the sodium acts to lessen the attraction
between clay particles and allows more water between
particles. The result is a lowering of the limit values
as the degree of flocculation and particle attraction
decreases.

122
Table IV illustrates the difference in the liquid
limit values of soils which have never been air dried and
those which have. Though the cation-exchange capacity
of wet samples was not determined, it is thought that the
exchange capacity for soils which have never been dried
would be higher than that of soils which have. This
reduction in capacity would occur if upon drying the
concentration of cations in the clay soil increases as water
evaporated and micropackets of clay particles are formed.
These packets would tend to trap cations, thereby reducing
the cation-exchange potential. Upon rewetting with
distilled water for the limit tests, the packets are not
completely destroyed and all cations would not be available
in the clay-water system, some still being bound up between
plates in the packets. This decrease in cation-exchange
capacity would result in lower particulate attraction and
lower Atterberg Limit values.
Another aspect is that the micropackets which are
formed upon air drying and which do not disperse when
mixed with distilled water effectively reduce the percent
clay-size fraction of the soil. Though the packets them
selves probably have a water film as would the individual
clay particles, the attraction between packets is less;
therefore, less water is required to reach the liquid limit.
The liquid limit of samples which have never been dried and
have the higher cationic concentration and greater particle
attraction would require more water to disperse the structure

123
to a point of failure in the liquid limit device.
C. COMPACTION CHARACTERISTICS
Three factors; soil gradation and Atterberg Limits,
cation-exchange capacity, and clay structure, were studied
with relation to their effect on laboratory compaction of
the Ozark soils. No gross difference was noted in the
clay mineralogy of the soils investigated in this study
so this was eliminated as a prime cause of compaction
differences.
The results of soil compaction tests are presented in
TableVIII. Figures 35 thru 45 illustrate the relation
ships between the factors listed above and the optimum
moisture content and maximum dry density of the soils
tested. Table XV illustrates the correlation coefficient
and sigma value for each relationship tested.
1. Atterberg Limits. As discussed previously, Harris
(1969) showed the best correlation tested was between the
liquid limit values and the maximum dry density and optimum
moisture content. The correlation coefficient for this
relationship for residual soils was on the order of 0.90.
This same range of values (0.88 for maximum dry density
and 0.90 for optimum moisture content) was noted for the
Ozark clayey residuals. The plastic limit was found to
exhibit even a slightly better degree of correlation than
the liquid limit. A correlation coefficient in the order
of 0.90 signifies a high degree of relationship (Harris,

........ 4-4 tJ ~ .....,
:>. ...., ..... til ~ Q) ~
:>. ~ ~
~ ~ ~
90
85
80
75 Linear
Best Fit
y = 125.09 - 0.51 X
2 y = 138.85 - 0.93x + 0.003 x
0
a= 5.9
a = 5.4
0
0
0
~--... ,.... ........ ~ .................
r = -0.96
0
70 I I I I I I I I I 55 60 65 70 75 80 85 90 95
Clay Content (%)
FIGURE 35. Clay Content Versus Maximum Dry Density (Clay Residual Soils)
~
N .s;:.
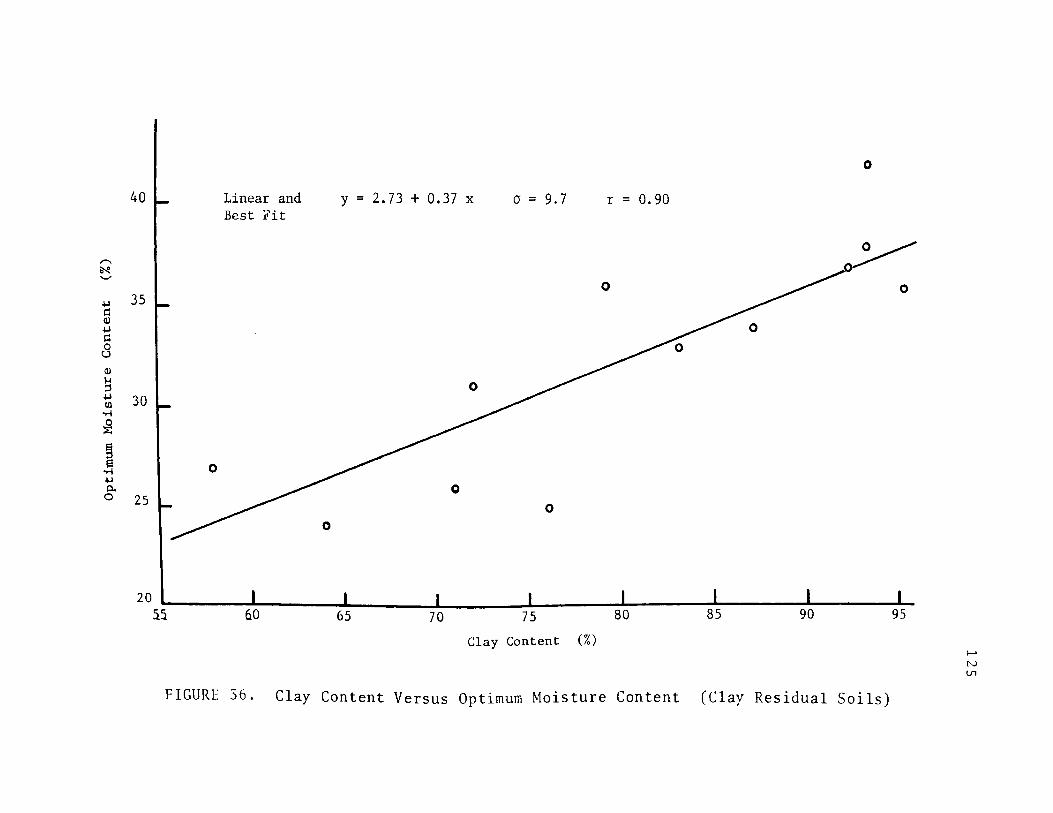
,-... ~ '>.,/
+.1 !::: Q) +.1 !::: 0 u Q) I-I ::l +.1 fJl •rl
jl
~ ·rl +.1 p.. 0
40
35
30
25
20
Linear and Best Fit
y = 2.73 + 0.37 X (j = 9.7 r = 0.90
0
~ 0
~~ 60 65 70 75 80 85 90 95
Clay Content (%)
FIGURE 36. Clay Content Versus Optimum Moisture Content (Clay Residual Soils)
I-' N tn

/""'>
4-1 () 0.
'-../
:>. -IJ ·ri
11.) Q (I)
A
:>. ~
~ ·ri
><
:2
120
110
100
90
80
0
\ \
"
Linear
Best Fit
'\
0
y = 108.40 - 0.80 X
2 3 y = 158.16 - 6.66 X+ 0.21 X - 0.002 X
a = 23.0
0 = 18.8
r = -0.87
70 35 40 45 10 15 20 25 30
Cation-Exchange Capacity (meq/100 gr.)
FIGURE 37. Cation-Exchange Capacity Versus Haximum Dry Density (Clay Residual Soils)
f-'
N 0\

""' ~ '-'
.j..J
Q Q) .j..J
Q 0 u Q) ~ ::l
.j..J
rn ..... :S
~ ..... .j..J
0. 0
40
I /. 0
0 I
35
I 0
30
25 ~ 0
/ 0
0
0
20- Linear and y = 13.83 + 0.62 X cr = 14.3 r == 0.86 Best Fit
0
15 10 15 20 25 30 35 40 45
Cation-Exchange Capacity (meq/100 gr.)
FIGURE 38. Cation-Exchange Capacity Versus Optimum Moisture Content
(Clay Residual Soils)
f-' N "-J

"'"" 11-1 () llo '-'
~ ~ •rl Ill s:: Q)
Q
~
'"' Q
~ or! :< ~
110 t-'\.o Linear y = 117.80- 0.41 X cr = 19.2 r = -0.88
" Best Fit y = 154.50 - 1.44 X+ 0.007 X 2 cr = 13.8
" " 100 " " ~ 90
' 0
80
70 ~------~------~------~-------L------~------~------~~-------30 40 so 60 70 80 90 100
Liquid Limit (%)
FIGURE 39. Liquid Limit Versus Maximum Dry Density (Clay Residual Soils)
..... N 00

50
"""" N "-../
+J 40 !:I Ill +J !:I 0 u Ill
~ +J
.~ 30 ~
Linear y = 8.93 + 0.30 x
Best Fit y = -17.90 + 1.06 x- 0.005 x2
j I ~ / o +J .
0.. 0
20
10 30 40 50 60 70
Liquid Limit (%)
a= 10.6
a= 7.6
80
r = 0.90
90 100
FIGURE 40. Liquid Limit Versus Optimum Moisture Content (Clay Residual Soils)
1-' N \D
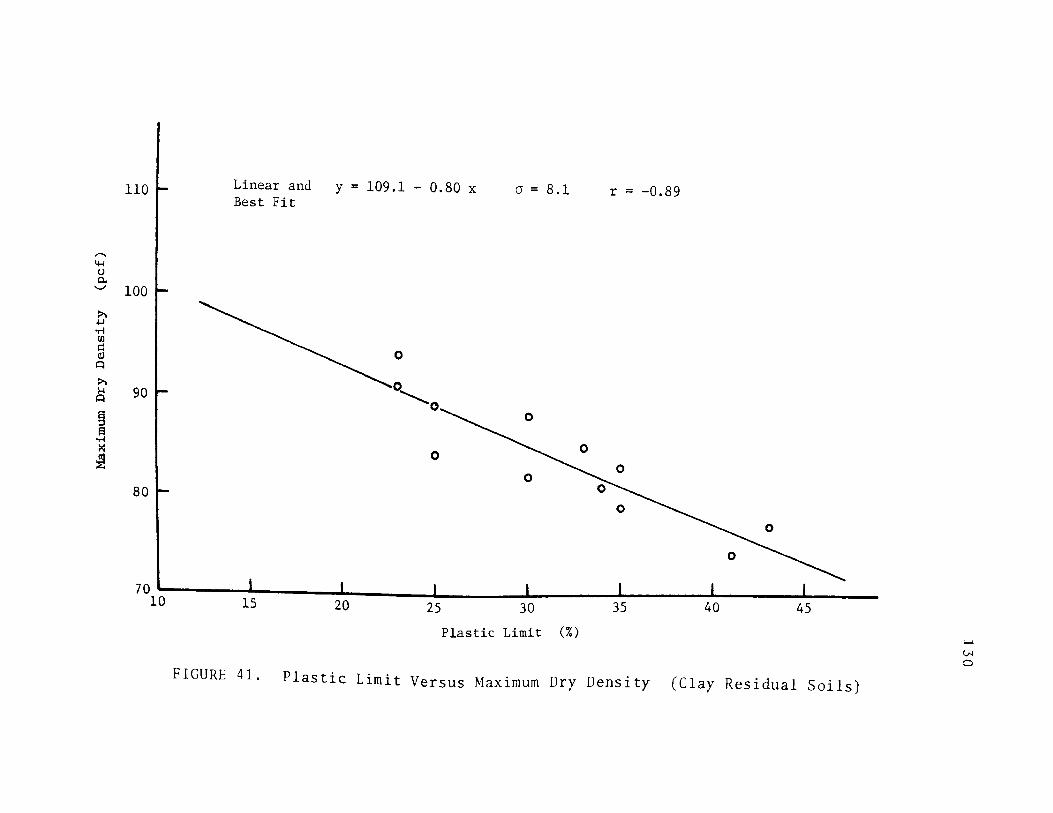
,....... ~ u 0..
'-./
:>. .j..l
•r-i (I)
I:: Q) t:l
:>. 1-1
Q
~ 13
•r-i X
:ill
110
100
I
90 t-I
80
Linear and y = 109.1 - 0.80 x Best Fit
--............_ 0
~0
............ 0
0
a = 8.1 r = -0.89
70 ~------~--------~--------L-------~--------~------~~------~~-----10 15 20 25 30 35 40 45
Plastic Limit (%)
FIGURE 41. Plastic Limit Versus Maximum Dry Density (Clay Residual Soils)
....... tN 0

;-..
N '-"
.j.J
g .j.J
1=1 0
c.>
<1.1
~ .j.J
Ul •r-1
~ § ~ .j.J p.. 0
50
40
30
' 20
Linear y = 3.79 + 0.90 X
Best Fit y = -29.72 + 3.12 x -0.04 x2
0 -~g
a= 7.9
a = 5.6
r = 0.92
10 ~------~--------~-------L--------~------~------~~------~-------10 15 20 25 30 35 40 45
Plastic Limit (%)
FIGURE 42. Plastic Limit Versus Optimum Moisture Content (Clay Residual Soils)
f-' VI f-'

120
110
"'"' Il-l () Q. ......,
t' 100 'rl !ll 1::: Q) ~
>.
'"' ~
m 90
'rl X )!
80
20
Linear y = 128.30 - 0.55 X
Best Fit 2 3 y = 149.52- 1.79 X+ 0.019 X - 0.0004 X
"· ',
30
', '-...,
' 0 ',
40
' ',o ""-, 0
.........
', -o -.........:
so 60 70
Clay Content (%)
80
0 = 10.9
0 = 7.6
r = -0.97
0 ~........ 0
~._,
. ::--.o, 0~ 0
90
FIGURE 43. Clay Content Versus Maximum Dry Density (All Soils)
...... Vl N

50
,....._ N '-"
I +J
40 l=l Q) +J l=l 0 u
I Q)
1-4 ;:I +J til 30 •rl
~
~ •rl +J
I p. 0
20 I
10 20
Linear and Best Fit
30
0
0
y = 6.30 + 0.33 X a= 8.8 r = 0.95
40 50 60 70
Clay Content (%)
FIGURE 44. Clay Content Versus Optimum Moisture Content
0
~ 0
80 90
....... (.N
(.N
(All Soils)

120
110L
""' I 4-l t) p.
'-"
:>-. 1001 -1-1 "T"4 Cll !:l (!) Q
:>-. ~ Q
m 90
•.-1 X til ~
' 80
70 10
Linear
Best Fit
y = 121.19 - 1.14 X
2 3 y = 296.70- 19.01 X+ 0.58 X - 0.006 X
(J = 15.1
(J = 7.3
\ 0
~ \ \
~
0
15 20 25 30 ' 35 40
Optimum Miosture Content (%)
FIGURE 45 • Optimum Moisture Content Versus Maximum Dry Density
(Clay Residual Soils)
r = -0.90
45 1-' V-1 +:>.

135
1969).
2. Gradation and cation-exchange capacity. The
percent fines was not found to have a significant relation
ship with either the maximum dry density or optimum moisture
content. The correlation between the percent clay of all
the soils and the compaction characteristics was very
high, -0.97 for the maximum dry density and 0.95 for the
optimum moisture content. The cation-exchange capacity
also has a high degree of correlation with the optimum
moisture content (0.86) and the maximum dry density (-0.87).
The high degree of correlation between the Atterberg
Limits and the compaction characteristics indicate that the
factors which influence the values of the limit indices also
influence the compaction characteristics. The clay content
and the cation-exchange capacity were determined to strongly
affect the limit values; similarly, they have been shown
to be strongly related to the optimum moisture content and
the maximum dry density.
Lambe (1958) has postulated that the compacted nature
of clayey soils is a result of clay particle structure.
Clay content, cation concentration, and other factors not
studied in this investigation have a strong influence on
the compaction process which is manifested in their affect
on the clay structure.
3. Soil clay structure. The Atterberg Limits and the
cation-exchange capacity are considered indirect measures

136
of clay structure. No direct quantitative measures of
differences in clay structure in compacted samples were
determined, but a qualitative low-power and scanning micro
scopy investigation of the clay structure was conducted.
Particular attention was made in comparing the apparent
validity of the particle-to-particle concept of the structure
of compacted samples and changes in this structure with
different compacting moisture contents as postulated by
Lambe (1958) to the packet-to-packet compacted structure
as postulated by Sloan and Kell (1966) and Barden and
Sides (1970).
Low-power micrographs of the Terre Du Lac soil are
presented in Figures 46 and 47 for two samples; one com
pacted 3% dry of optimum, the other compacted 5% wet of
optimum. Samples compacted at all moisture contents contain
a large number of particles which exhibit residual pedular
structure which apparently has not been destroyed or altered
significantly by the compaction process.
Some differences are observed between the samples
compacted dry and wet of optimum. The dry sample has a
much "rougher" texture, the wet sample an apparent uniform
texture. A large volume of voids, or macrospaces, are also
obvious in the dry sample and which do not appear in the
wet sample. The size of the packets, or macropeds, in
the dry sample is highly variable whereas less variation
is exhibited in the wet sample.

a.) Compacted 3% Dry of Optimum b.) Compacted 5% Wet of Optimum
FIGURE 46. LPM Terre Du Lac (Black and White)
t-' lN -....}

- ~ ~
.a;j IE1 aJ
P!l ,.
~
~
R I
'A·.. .f '•i . )' ~·ij,:r· . ~ ~k.~
, f •.•.' .. , ~~ • io " ..
liiC
~
I ~
[J!l
• • ,":f ~ •fv '9. " 1~ . ! ' ·~ • '·' .. .; . ,~ .• . K .
. . ~· ~, ·\ : ·~. ·,,. ·.• · .. t. -~~
~ ~~. ·~·t· ".· ·~ r ' 'I :li ji . •I'. ,. ... ' • •
• _. ~ I r" , ·-~ ~ ~' .. · . ~ . ;;r 'f. .
··., ~.4·--·· ....... :·,.,
~ :.,)-, • • I' •
~- f~ .. ).' . ... . . ~-\ . '-4···. . ~ .. .. . -. ..
a.) Compacted 3% Dry of Optimum b,) Compacted 5% Wet of Optimum
FIGURE ~7. LPM Terre DuLac (Color)
f-> (A
co

It is suggested that the sample compacted wet of
optimum has been more altered by wetting and compaction
139
than that compacted dry of optimum. Part of this alteration
is probably manifested in the breakdown upon wetting of the
peds due to differential swelling pressure and differential
air pressure as suggested by Baver (1956).
A study of the microstructure was initiated to further
investigate the macropeds and to investigate the particle
to-particle structure of compacted samples with variations
in the compaction moisture content.
Figures 48, 49, and 50 compare the structure of Standard
Proctor samples compacted dry and wet of optimum at magni
fications of lOOX, 300X, and 3000X. All micrographs are
of sample surfaces oriented parallel to the direction of
applied compactive force. At a magnification of lOOX,
the outline of the macropeds are still apparent with similar
patterns of texture, macrospaces, and ped sizes as was
evident in the low-power micrographs. The scanning micro
graphs (lOOX) enhance the significant textural differences
between the samples compacted wet and dry of optimum; the
dry sample with a very random pattern of macropeds, the
wet sample with a uniform pattern. These patterns are still
evident in the 300X micrographs.
Quite a different pattern is observed in Figure 50
for those micrographs taken at 3000X. The microstructure,
or "intra-pedular" structure, is very similar for both wet
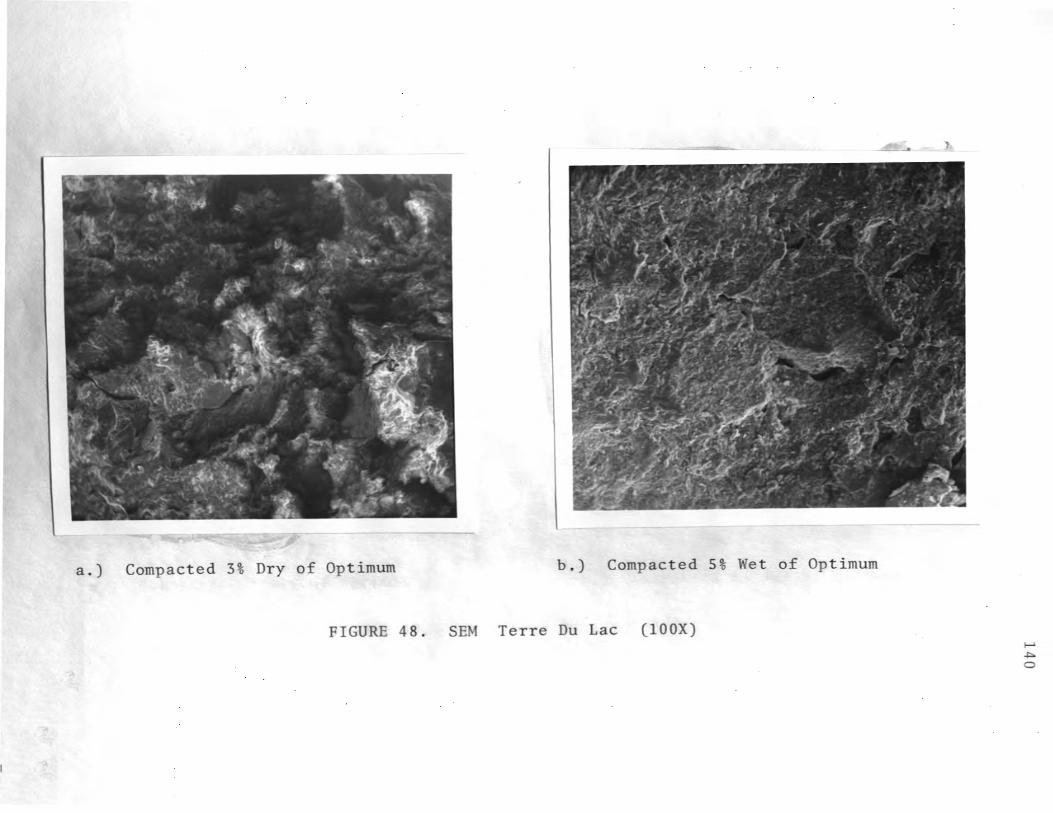

'-- · · ---..a._ -
t;,.,
a.) Compacted 3% Dry of Optimum b.) Compacted 5% Wet of Optimum
FIGURE 49. SEM Terre Du Lac (300X)
T
I-' ~ I-'

a.) Compacted 3% Dry of Optimum b.) Compacted 5% Wet of Optimum
FIGURE SO. SEM Terre Du Lac (3000X)
""
,__. -+>o N

and dry samples, apparently independent of compaction
moisture content.
143
The theory of the compactive process which emerges from
this study is considerably different from that postulated
by Lambe (1958). There is little indication in the micro
graphs of single particle activity being prominant in the
compaction process. This is particularly true for samples
compacted dry of optimum. On the wet side of optimum where
samples appeared uniform under relatively low magnification,
clay particles seem to form a cement between macropeds.
The following theory, similar to that postulated by
Barden and Sides (1970), of laboratory compaction density
is primarily a function of the degree of fit between
macropeds of clay. Dry peds at low moisture content are
resistant to deformation and a relatively loose compacted
structure is obtained. With the addition of moisture, two
factors are thought to influence the compacted density.
First, upon adsorption of moisture, the macropeds tend to
break down forming a better gradation of particles which
can result in a more dense arrangement without major ped
deformation. Also, as Barden and Sides postulate, with
additional moisture the macropeds become "softer" and can
be forced by outside forces into a more compact arrangement.
At the optimum moisture content, the effects of ped
breakdown and deformation are maximized. Macrospaces are
minimized.

144
Wet of optimum the influence of individual particles
and the smaller peds are predominant. With increased
moisture and further deterioration, more particle-to
particle reaction may occur. As water layers are adsorbed
by particles and small peds, they are pushed apart and
density decreases. A decrease in cation concentration may
play an important role as the water film expands. Even wet
of optimum, a large portion of the peds remain relatively
unaffected by the increased moisture and their internal
structure is essentially unaltered.
The micrographs of the natural air-dried soil has
indicated a natural essentially parallel particle orienta
tion. When this structure is affected by moisture, no
major reorientation of particles may be required, as from
flocculated to parallel structure; just a separation of
parallel plates.
Assuming the natural ped structure is the result of
dessication, the forces responsible for the particle
orientation were very large. Once the ped structure has
been destroyed by moisture, the effort expended in a
compaction test in an attempt to force the particles back
into a dense state is considerably less than were the
dessication forces. The water film surrounding the
particles and peds resists the compactive effort.
The natural low density of the peds (Scrivner, 1960)
which is not destroyed by the compaction process is one

145
factor responsible for the low compacted densities of the
Ozark clayey residual soils. As would be anticipated, the
soils tested with higher non-clay contents (primarily
quartz, S.G. - 2.66) have higher compacted densities. Soils
with high cation-exchange capacities, particularly those
high in the sodium ion, appear to adsorb moisture more
readily with an accompanying breakdown in ped structure.
The greater the degree of particle reorientation, the lower
the compacted dry density and the higher the optimum moisture
content.
Figure 51 demonstrates the results of the Standard
Proctor tests on the soils dispersed with sodium metahexa-
phosphate. The dispersed soils demonstrate a higher maximum
dry density and lower optimum moisture which agrees with
Lambe's (1962) discussion of the effects of aggregants and
dispersants.
It is postulated that the sodium treatment acts to
breakdown the peds more than the normal addition of water
reducing the macrospaces and allowing a more dense particle
arrangement at a lower optimum moisture content. As more
water is added, particularly past the optimum, the particles
adsorb water layers reducing the particle-to-particle
attraction and the dry density.

....... 4-1 0 s:l.
'-J
~ .j,J
...... !I)
90
85
!:1 80 Q) Q
~ ~ Q
~ ......
i 75
70
20
0~ / ~ / ""
25 30 35
Moisture Content (%)
40
Floyd - natural
Floyd - dispersed
Terre Du Lac - natural
Terre Du Lac - dispersed
Sayers - natural
Sayers - dispersed
45
FIGURE 51. The Effect of Dispersion of the Standard Proctor Compaction
of Clayey Residual Soils
50
I-' .f::o 0\

VII. CONCLUSIONS
A. GENERAL
This study of residual soils used in earth dam
construction in the Ozark Province of Missouri centered
147
investigation in four general areas. First was a determina-
tion of the clay morphology of the soils and the extent of
any changes in this morphology from one site to another.
Second was a study of the soil gradation, Atterberg Limits
and cation-exchange capacity. This was followed by a study
of the correlation between these soil properties and the
compaction maximum dry density and optimum moisture content.
Finally, the effect of the pedular nature of the clay soils
on the Standard Proctor compaction characteristics was
investigated.
B. CLAY MORPHOLOGY
Regardless of differences in the parent material or the
geographical location of the dam sites within the portion of
the Ozark Province investigated, the morphology of the
clayey residual soils is similar. The relative location of
the samples within the vertical soil profile appears to
determine to a great extent the clay content in percent.
It is shown that the climatic conditions which existed
in the Ozarks during the Tertiary Period were probably
f laterl·zation process which conducive to the development o a
has resulted in the formation of halloysite-rich soils in
other areas under similar conditions. The numerous tests

148
which have been performed to determine the mineralogy of
the clays have shown that the residuals do not contain
halloysite in any significant amounts. It is suggested that
the continuous, extensive leaching process associated with
halloysite formation was never completely developed within
the Ozark area. Instead of halloysite, clays with a
morphology more closely resembling kaolinite were formed.
The major clay morphology is expressed in poorly
developed elongate platy kaolinite crystallinity. Other
kaolin morphologies even less well developed, including
possibly some alumino-silicate gels, are indicated by some
of the tests. A minor amount of illite, chlorite, and
possibly some montmorillonite is also present.
The soils are characterized by the presence of an
aggregated structure which separates the soils into units
called peds. This ped structure is probably the result of
soil collapse as the bedrock is chemically leached and of
dessication of the soil mass. These peds are thought to
affect the results of all tests performed on the soils to
determine their engineering properties.
C. SOIL CLASSIFICATION AND CATION-EXCHANGE CAPACITY
When the Atterberg Limits test results are plotted on
the plasticity chart, the clayey residuals and the alluvial
colluvial soils are classified as CL and CH. The liquid
·d 1 ·1 as high as 105 with limits of the clayey res1 ua so1 s were
a corresponding plasticity index of 69. The stone-free

149
residuals contain up to 95% clay.
as
The cation~exchange capacity of the residual soils was
high as 45 meq/100 gr. for those soils with greater than
90% clay. This is very high for kaolinitic soils. The fine
clay particle size and poor crystallinity have been shown
to act to increase the cation~exchange capacity of kaolinitic
soils. These high values may also reflect the presence of
some illite and/or montmorillonite.
The value of the liquid limit of samples never allowed
to air~dry in considerably (30~40%) higher than that of
samples which were tested after air~drying. It is thought
that the process of air-drying enforces and strengthens the
natural ped structure to a point that it fails to break down
completely when wetted for the liquid limit test. The
result is that only moderate particle-to-particle (ped-to
ped) attraction develops and less water is required to
facilitate shear failure in the liquid limit device.
The liquid limit of the sodium dispersed samples was
found to be less than the natural air-dried liquid limit for
several of the soils. This agrees with results presented by
White (1958) in his discussion of the effects of the
exchangeable cation on the liquid and plastic limit of clay
minerals. An explanation fitted to the pedular nature of
the soils is that the samples treated with a sodium dispersant
reacts in one of two ways or in a combination of the two:
(1) the dispersant completely breaks down the ped structure
allowing the sample to behave as described by White, and/or

150
(2) the ped structure is partially retained but the sodium
attracts to the peds a film of water which acts to separate
the clay peds and reduce ped~to~ped attraction. In either
case, the liquid limit value is lowered,
D. CORRELATIONS WITH COMPACTION RESULTS
Several factors were studied to determine their
correlation with the Standard Proctor laboratory compaction
parameters of the clayey residual Ozark soils: (1) soil
gradation, (2) Atterberg Limits, and (3) cation-exchange
capacity. The percent clay had the best correlation tested
with both optimum moisture content (r = 0.95) and the
maximum dry density (r = -0.97). The plastic limit also
correlated well with both factors, particularly the optimum
moisture content; the liquid limit exhibited only fair
correlation. The cation-exchange capacity also had only
fair correlation with the compaction characteristics. This
might be anticipated since the cation-exchange effect is more
pronounced in a more fluid environment than that of the
normal compaction test.
There appeared to be no significant relationship between
the percent fines and the optimum moisture content and the
maximum dry density. The relationship between the optimum
moisture content and the maximum dry density is good
(r = 0.90).
E. THEORY OF RESIDUAL SOIL COMPACTION
The Standard Proctor compaction tests yielded low values

151
of the maximum dry density with corresponding high values of
the optimum moisture content for the clayey residual soils.
The electron microscopy investigation has shown that the
pedular structure of the clayey residual soils is not
destroyed during laboratory compaction. This is thought to
be the key factor controlling the low density of the
compacted samples.
The low-power micrographs illustrate that dry of
optimum most of the clay remains bound in macropeds with a
large volume of macrospaces between them. As more water 1s
added and optimum is approached, the moisture breaks down
some of the larger peds to form smaller peds and other peds
are probably completely destroyed. A better ped-particle
gradation and perhaps a softening of some peds with
increased moisture allows the soil to be forced into a more
dense arrangement with a minimum of macrospaces.
Wet of optimum, even more peds are reduced in size
and/or destroyed with clay particles and small peds
develop water layers which force them apart, reducing
the compacted density. These particles appear to form a
cementing bond between the remaining peds, which still
comprise the majority of the compacted sample.
High magnification micrographs show that the micro
structure of the clay peds is not destroyed during the
compaction process. Indeed, it does not appear to be changed
significantly from that of the natural soil peds.

152
F. APPLICATION OF TEST RESULTS
1. Correlations. Several correlations have been
presented which may be useful in estimating the optimum
moisture content and maximum dry density from more commonly
available data. The clay content and plastic limit were
noted to be closely correlated to the optimum moisture
content and maximum dry density. Curves relating these
factors have been plotted and presented as Figures 52 and
53. Similar curves are presented, Figures 54 and 55,
relating the plasticity chart values, liquid limit and
plasticity index, to the optimum moisture content and maximum
dry density. At best these curves yield approximate values,
show trends. Better estimates can be obtained using the
equations presented along with the illustrations which show
the correlations.
2 . ::.D..:::a=m~d.:;_:_e..:::s_i~g"n=---c.:...:..o_n_s_t_r_u_c_t_i_o_n_. The m a j or pro b 1 em
observed in the earth dams investigated was seepage through
and around the dams. The seepage is often noted high up on
the downstream slope of dams, even on those dams with moderate
slopes. The seepages are often associated with surface slips
on the steeper dam slopes. The additional driving force
exerted by the saturated areas overcomes the resisting forces.
It is probable that the resisting forces are reduced signifi
cantly as the nature of the ped structure of the embankment
clays is altered upon saturation. A large portion of the peds
are believed to swell and deteriorate, destroying much of the
intergranular frictional resistance which is thought to provide

........ ~ '--"
+J 'r'l s •n ~
t) ·r-1 +J 1:1)
til ...-! ll-o
75
80 •77\ a~' \ •74 \ 401-
~~~ \ \ ~
"-s~ \ \ 75 v\, f5 ~
e83 \. 79
/ 3l ~4,.
\ ~s'\-\ ~~
• 81 ~ \ • 85 "'-~ \ ~\,~ \ \0 .\ • 88 80
30
82 \ \ \ \ \95 \ \ • 84 85 25L
\ \. 89
\ • 94 e92 \ e108 \
\90 \ 201 I I
30 40 50 60 70 80 90 100 Clay Content (%)
FIGURE 52. Graphical Relationship of the Maximum Dry Density to the
Plastic Limit and the Clay Content of the Clayey Residual Soils
....... U1 w

40
35 ,-... ~ '-"
.1-J •r-1 13
•r-1 ....:l 30 (.)
'1"'1 .1-J Cll t1l
.-1 p..
25
• 18
40
~~
~~~ va~<'\-
/
.s~~ '-.:
6\o
~~~ ~~~
I 30
\ s<'\;,
~~-<..;
~Ay# \ 25
\)~ e31 ~~ \
\ \
' • 26 •25
" • 27 •24 ' .........
25
50 60 70 80
Clay Content (%)
I 35
\ \ \
38 •
42 •
40
I \
\ "40
34 ·" • 37
•33
' ,30
" • 36
" ........... 35
90 100
FIGURE 53. Graphical Relationship of the Optimum Moisture Content to the
Plastic Limit and the Clay Content of the Clayey Residual Soils
1-' V1 +;>.

"'"' ~ '-"
~ QJ
"' s:: H
:>. .j.J
-M 0
-M .j.J {/J
!11 .-I p..
80
60
40
120
20 r
\ \
•113 113.
~~~
100
I
"" ~(j\.
-v-¢s'\-~ "V'Q;-4,.
90
9Z. / .az ba • • 1 /as 94.
108•
l \-100
\ \
\....S~"V
84,
•"'-o-v'~ --#~""
fO 1 79•
• 81
70
0 I \ V I I I I
100
0 20 40 60 80 100 Liquid Limit {%)
FIGURE 54. Graphical Relationship of the Maximum Dry Density to the
Plasticity Index and the Liquid Limit of all Soils
._. tn tn
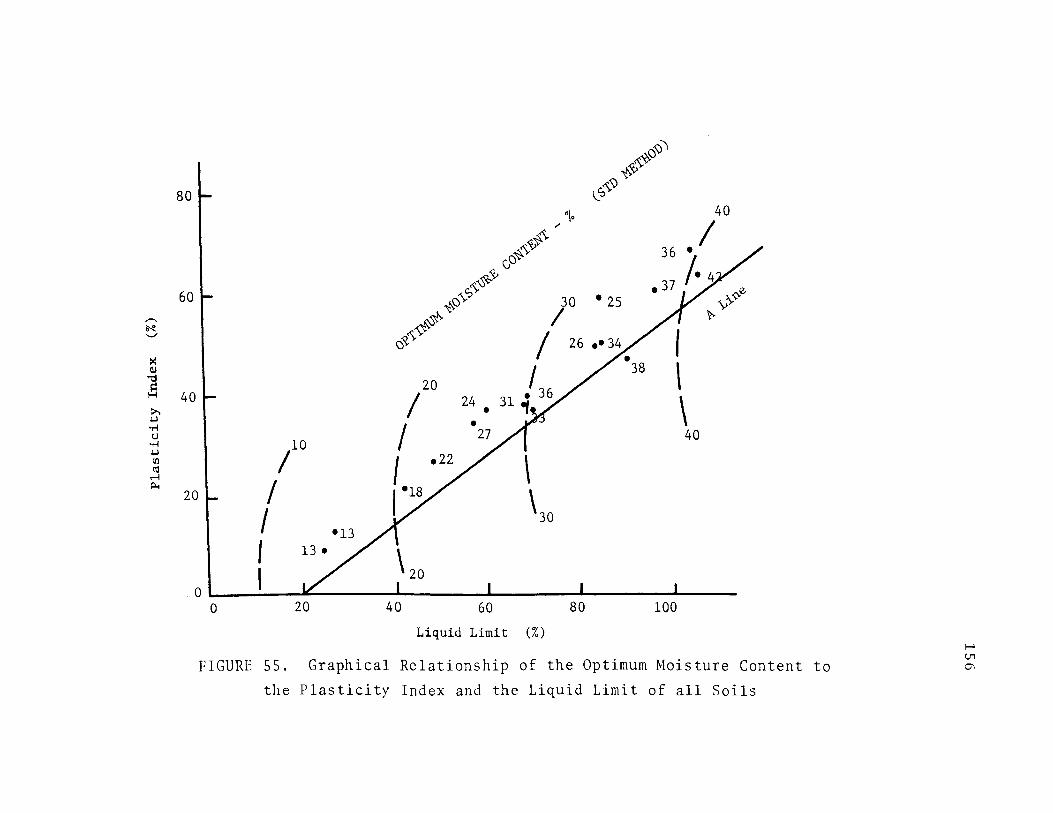
,..-.,. N '-'
>< G)
"' .e :>. .j.J ..... t)
..... .j.J en ~
....... p.,
C)))l
~<'\,~
80 ~ ls<'\-"
"\o 40 /
36. I ~~<'\, d:;)~~
~ ·:P . 60 1-s<'\-~
~()'\. 30 • 25 '\>~~
I # I ~
()~<'\,~ I I
20 40 I 24 •
I • 27 /1 40 10
I I I 20 ,.18
I I 13.
0 I I 0 20 40 60 80 100
Liquid Limit (%)
FIGURE 55. Graphical Relationship of the Optimum Moisture Content to
the Plasticity Index and the Liquid Limit of all Soils
1-' V1 0\

157
the mechanism of slope stability (Terzaghi, (1958).
Where these clayey soils are utilized in dam construc
tion, compaction on the wet side of optimum would signifi
cantly reduce the susceptibility of the embankment to
seepage. The macrospaces which exist in the samples
compacted dry of optimum offer ideal channels for water flow.
Samples compacted wet of optimum contain less macrospaces
and should be more resistant to water flow. Post-construc
tion loss of shear strength due to ped deterioration upon
saturation would also be reduced. The possibility of piping
would also be reduced.
It is also recommended that the dam embankments be
designed based on the results of Modified Proctor compaction
results rather than Standard Proctor. This would result in
higher densities with higher shear strength and less
macrospaces with a corresponding decrease in seepage.
G. RECOMMENDATIONS FOR FURTHER STUDY
The discussion presented above relating dam design and
construction to the nature of compacted soils assumes that
the soils compacted in dam embankments behave as those
compacted in the laboratory. It is believed that the theory
of compaction as outlined previously does apply to embankment
soils, but that the degree of soil structure evident in the
laboratory soils is not developed in the field.
The major recommendation based on this study is that a
darn constructed of the residual clay soils be thoroughly

158
investigated. This investigation should be centered around
the gathering and testing of undisturbed samples from the
dam itself. This investigation would be facilitated by
selection of a dam constructed of relatively stone-free clay.
Where ped structure is exhibited by the in place soil, even
slight sample disturbance could alter the apparent density.
Both a low-power and a scanning electron microscopic
investigation of the sample taken from the embankment would
aid in determining the validity of the ped or packet theory
of clay soils compacted in the field.

VIII. APPENDIX A
Dam Reports
159

DAM: Fa RESERVOIR SIZE: 23--Acres !BEDROCK FORMATION: ___ --t Roubidoux
Sec. 4 T.35 N. R.7 W.
LOCATION: Dent County EMBANKMENT: HEIGHT 3 3 ft · LENGTH 530 ft. lsoiL SERIES: Hanceville
Loam
TYPICAL DAM SECTION SOIL CLASSIFICATION:
+ ' zo
j
LL 25 PL 16 PI 9
GRADATION: % FINER
#Ul 100 #40 94 #60 78 #100 64
#200 61 10t.L 3 8
2J1. 19 tp_ 16
COMPACTION CHARACTERISTICS ASTM D 1557-,.66
MAX. DENJ21 lb/cu foPT. MOIST. --=.1~3.JL.% __
!PREDOMINANT CLAY MINERALS:
Kaolinite
COMMENTS: CEC-7.6 pH-5.6 Gs-2.68
water level 20 ft. below crest
water not passing through dam_
drop inlet W/ 3 ft. ¢ concrete pipe cutoff trench
I
I-' 0\ 0

DAM: Horns ey RESERVOIR SIZE: 40 + Acres
Sec. 6 T.37 N. R.Z E.
EMBANKMENT: HEIGHT 50 ft · LENGTH 875 ft.
LOCATION: Washington County
BEDROCK FORMATION: ___ -t Eminence
SOIL SERIES: Clarksville Stony Loam
TYPICAL DAM SECTION SOIL CLASSIFICATION:
LL 9 0 PL 4 3 PI 4 7 I
GRADATION: % FINER
#Ul 99 #200 9 7 #40 99 #60 98 #100 9 8
10/,L 95 2J.L 9 3 1~ 91
COMPACTION CHARACTERISTICS ASTM D 1557 " 66
MAX. DEN. 77 lb/cu foPT. MOIST. 38 %
PREDOMINANT CLAY MINERALS:
Kaolinite
COMMENTS: CEC- 42.1 pH- 4. 8 7 ft. freeboard
Gs-2.84
steep slopes w/ minor slides near toe--tilted fence line along toe of downstream slope
cutoff trench I-' 0'\ I-'

DAM: Blackwell RESERVOIR SIZE: l ~ Acres jBEDROCK FORMATION: ___ --f Gasconade
LOCATION: Dent County .
Sec. 26 T.35 N. R.4 W.
EMBANKMENT: HEIGHT 2 2 ft. LENGTH "530 ft. !soiL SERIES: Clarksville
Stony Loam
TYPICAL DAM SECTION SOIL CLASSIFICATION:
l
LL 60 PL 23 PI 3 7
GRADATION: % FINER
#l.Q. 99 #200 85 #40 95 #60 93 #100 89
10t,t. 77 2JL 64 1/L 56
COMPACTION CHARACTERISTICS ASTM D 1557-66
MAX. DEN. 92 lb/cu ftoPT. MOIST. 24 %
'PREDOMINANT CLAY MINERALS: ,------~ I K 1· . ao 1n1te
COMMENTS: CEC-24.1 pH- 7 .5 G -2.8 0 s 6 ft. freeboard concrete spillway drop inlet w/ 24 in. CMP previous embankment f ailure ( ? )
I
!---" 0\ N

DAM: Masters #2 RESERVOIR SIZE: 24 Acres BEDROCK FORMATION: Gasconade - Eminence
LOCATION: Dent County EMBANKMENT: HEIGHT 36 ft.
LE_NGTH 700 ft . SOIL SERIES: Clarksville Sec. 16 T. 35 N. R. 5 W. Stonx: Loam
TYPICAL DAM SECTION SOIL CLASSIFICATION:
LL 103 PL 34 PI 69
GRADATION: % FINER
#1.0 100 #200 99
#40 100 10tL 99
#60 99 2JL 95
#tOO 99 1J.L 94
SE.c /vftJ:srsli!S #I COMPACTION CHARACTERISTICS
ASTM D 1557-66
MAX. DEN. 81 lbLcu ftoPT. MOIST. 36 %
PREDOMINANT CLAY MINERALS:
COMMENTS: CEC-35.8 pH-7.5 Gs-2.84
see Masters #1
I I
1--' 0\ tN

DAM: Sunnen RESERVOIR SIZE: 40+ Acres
LOCATION: Washington County EMBANKMENT: HEIGHT 50 ft .
Sec. 4 T.37 N. R.l W~ LENGTH 1300 ft.
BEDROCK FORMATION: ___ -' Colluvial on Gasconade
SOIL SERIES: Clarksville S tony Loam
TYPICAL DAM SECTION SOIL CLASSIFICATION:
WAS H&O
LL 4 2 PL 21 PI 21 I
GRADATION: % FINER
#Ul 100 #200 87 #40 97 #60 92 #100 88
10J.L 57 2JJ- 38 1JL 3 7
COMPACTION CHARACTERISTICS ASTM D 1557-66
MAX. DEN.l08 lb/cu fbPT. MOIST. ~1..;;.8...::.% __
PREDOMINANT CLAY MINERALS: Kaolinite
COMMENTS:CEC-11.5 pH-4.9 G -2.72 s
13 ft. freeboard 150 ft. paved spillway drop inlet w/ two 4 ft. ¢ concrete
pipes tilted slope indicators
1--' 0\ +>-

DAM: Masters-~# 1
LOCATION: Dent County
Sec. 16 T.35 N. R.S w:
RESERVOIR SIZE: 24 Acres BEDROCK FORMATION: ___ -! Gasconade - Eminence
EMBANKMENT: HEIGHT 36 ft. LENGTH 700 ft • !soiL SERIES: Clarksville
Stony Loam
TYPICAL DAM SECTION SOIL CLASSIFICATION:
LL 8 4 . PL 2 5 PI 5 9 I
GRADATION: % FINER
#Ul 100 #200 96 #40 100 1011. 83
2JL 76 #60 99 #100 98 1/.L 71
COMPACTION CHARACTERISTICS .
ASTM D 1557-66
MAX. DEN. 84 lb/cu ftoPT. MOIST. --.::2:.;;;:;5....::% __
"PREDOMINANT CLAY MINERALS:
Kaolinite
COMMENTS: CEC- 21. 9 pH-5.4
5 ft. freeboard
36 in. CMP w/ hooded inlet cutoff trench spring below toe of dam
G -2.83 s
I-' 0\ V1

DAM: Sunrise South RESERVOIR SIZE: .i:::> ACres JBEDROCK FORMATION: ___ _, Potosi
Sec. 36 T.39 N. R.4 E.
LOCATION: Jefferson County EMBANKMENT: HEIGHT 35 ft · LENGTH 550 ft. lsoiL SERIES: Clarksville
Grvl. Loam
TYPICAL DAM SECTION SOIL CLASSIFICATION:
-413'~ ~
t
(rJ
LL 6 8 PL 3 0 PI 3 8 I
GRADATION: Ofo FINER
#Ul 99 #200 89 #40 93 #60 91 #100 90
10J,L 80 2JL 7 2 1J.L 70
COMPACTION CHARACTERISTICS ASTM D 155 7 -66
MAX. DEN. 88 lb/cu ftoPT. MOIST. __;;.3..;;;1~% __
PREDOMINANT CLAY MINERALS:
Kaolinite
COMMENTS:CEC-24 . 6 pH-6 .5 G -2.82 s 6 ft . freeboard
60 ft. wide unpaved spillway
seepage--marshy at toe of dam ....... 0\ 0\

DAM: Sunrise Central
LOCATION: J efferson County
Sec. 36 T .39 N. R.4 E:
BEDROCK FORMATION: ___ _, Potosi
RESERVOIR SIZE: 2 S Acres
EMBANKMENT: HEIGHT 35 ft · LENGTH 525 ft. lsoiL SERIES: Clarksv ille
Grvl. Loam
TYPICAL DAM SECTION SOIL CLASSIFICATION:
E~tooi!D
LL 7 0 PL 3 3 PI 3 7 I
GRADATION: % FINER
#l.Q 9 9 #200 92 #40 95 #60 93 #100 93
10J,L 8 7 2P- 83 1J..L. 82
COMPACTION CHARACTERISTICS ASTM D 1557-66
MAX. DEN. 85 l b / c u fbPT. MOIST. 33 %
PREDOMINANT CLAY MINERALS: Kaolinite
COMMENTS: CEC- 30.6
5 ft . freeboard
pH-4.9 G -2 . 82 s
90 ft. wide paved spillway seepage through east abutment eroded toe lake 20 ft. from toe of dam
....... 0\ -.....)

DAM: Ft. Westside RESERVOIR SIZE: !BEDROCK FORMATION:------4 Roubidoux (?)
LOCATION: Crawford County
Sec. 2 T.39 N. R.4 W~
EMBANKMENT: HEIGHT 23 ft · LENGTH 9 00 ft · lsoiL SERIES: Lebanon
Silt Loam
TYPICAL DAM SECTION SOIL CLASSIFICATION:
LL 4 8 . PL 21 PI 2 7 I
GRADATION: % FINER
#1.0 100 #40 99 #60 94 #100 89
#200 83 10J,L 56 2JL 38 1J.L 37
COMPACTION CHARACTERISTICS ASTM D 15 57 , .66
MAX. DEN}-00 lb/cu ftoPT. MOIST. 22 %
PREDOMINANT CLAY MINERALS:
Kaolinite
COMMENTS: CEC-19.1 pH-4.6 G -2. 7 2 s 3 ft. freeboard earth spillways steep slopes--but no apparent
seepage
cutoff trench
1--' 0'\ 00

RESERVOJR SIZE: 15 Acres jBEDROCK FORMATION: ___ ---t Roubidoux
DAM: Rice
LOCATION: Crawford County
Sec. 17 T.39 N. R.3 W. EMBANKMENT: HEIGHT 4 2 ft.
LENGTH 960 ft. !soiL SERIES: Lebanon Silt Loam
TYPICAL DAM SECTION SOIL CLASSIFICATION:
_, 1s'\-_ LL 2 7 PL 15 PI 1 2 1
GRADATION: % FINER
#Ul 100 #40 88 #60 71 #tOO 60
#200 58 10J,L 35
2JJ.. 21 1J.L 18
COMPACTION CHARACTERISTICS ASTM D 1557-66
MAX. DEN.121 lb/cu ftoPT. MOIST. l 3 %
.PREDOMINANT CLAY MINERALS:
Kaolinite
COMMENTS: CEC- 8. 7
3 ft. freeboard
pH-5.2 G -2.72 s
seepage below toe into marsh varment dens in backslope at water
line no cutoff trench ?
...... 0\ 1.0

DAM: Say ers RESERVOIR SIZE: 43 Acres BEDROCK FORMATION: ___ -! Potosi
Sec. 2 8 T .38 N. R.l E.
LOCATION: Washing ton County EMBANKMENT: HEIGHT 60 ft · LENGTH 900 ft · !soiL SERIES: Clark s v ille
Stony Loam
TYPICAL DAM SECTION SOIL CLASSIFICATION:
LL 1 0 5 PL 41 PI 6 4 1
GRADATION: % FINER
#Ul 10 0 #40 99 #60 99
#200 9 8 10t,t. 9 6 2t,i. 9 3
#100 9 8 1J.L 90
COMPACTION CHARACTERISTICS ASTM D 155 7-6.6
MAX. DEN. 7 4 l b / cu f t OPT. MOIST. __;,4.;;;.2..;;.% __
PREDOMINANT CLAY MINERALS:
Kao lini,te
COMMENTS: CEC-44 . 9 pH-7 . 5 G -2 . 84 s 3 f t. f r eeboar d s l ides and seepage through steep
crest section 40ft . wide - spillway- eroded cutoff trench (?)
...... -....]
0

DAM: Litt-le Prar1e
LOCATION: Phelps County
Sec. 21 T.38 N. R.7 W.
RESERVOIR SIZE: l.UU Acres jBEDROCK FORMATION: ___ --t Jefferson City
EMBANKMENT: HEIGHT 40 ft · LENGTH 1300 ft · lsoiL SERIES: Lebanon
Silt Loam
TYPICAL DAM SECTION SOIL CLASSIFICATION:
LL 57 PL 23 PI 34
GRADATION: % FINER
#Ul 99 #40 98
#200 9 5 10/.L 80
#60 98 #100 9 7
2JL 58 1/L 44
COMPACTION CHARACTERISTICS ASTM D 1557-66
MAX. DEN. 94 lb/cu ftoPT. MOIST. 27%
PREDOMINANT CLAY MINERALS: Kaolinite
COMMENTS: CEC-13.7 pH-7.8 G -2.72 s 8 ft. freeboard
granular toe drain
drop inlet
cutoff trench
I
..... --..J .....

DAM: - -~ - RESERVOIR SIZE: 6 0 Acres fBEDROCK FORMATION: ___ --t Gasconade
Sec. 20 T.35 N. R.S W. EMBANKMENT: HEIGHT 9 .~~ ~~ · I E Clarksville St. LENGTH · SOIL SERI S;_:._ ______ _
LOCATION: Dent County
TYPICAL DAM SECTION SOIL CLASSIFICATION:
LL 85 PL 35 PI 50 I
GRADATION: % FINER
#1.0 9 9 #40 98 #60 98 #100 9 8
#200 98 10tL 9 7 2JL 87 1JJ- 83
COMPACTION CHARACTERISTICS ASTM D 1557-66
MAX. DEN. 8 3 lb/cu ftoPT. MOIST. ~3....:.4....::;% __
PREDOMINANT CLAY MINERALS:
. Kaolinite
COMMENTS: Gs-2.80
6 ft. freeboard unlined spillway--eroded· very wet to~--marsh several zones of seepage through
dam and abutments
f-' -....]
N

RESERVOIR SIZE: j_ 1 ACres !BEDROCK FORMATION: ___ -! Gasconade
DAM: Elsey
LOCATION: Washington County
Sec. 30 T.37 N. R.2 E. EMBANKMENT: HEIGHT 18 f t .
LENGTH 770 ft. -- lsoiL SERIES: Clarksville Stony Loam
TYPICAL DAM SECTION SOIL CLASSIFICATION:
LL 8 4 PL 2 5 PI 5 9 1
GRADATION: % FINER
#Ul 9 9 #200 94 #40 98 10tL 86 #60 96 #100 9 5
2JL 71 1J..L. 69
COMPACTION CHARACTERISTICS ASTM D 1557-66
MAX. DEN.89 lb /cu ft .OPT. MOIST. 26 . 5%
PREDOMINANT CLAY MINERALS: Kaolinite
COMMENTS: CEC- 26. 9
4 ft. freeboard
cutoff trench
pH-7.7 G -2.79 s
two 50 ft. wide shallow spillways 1-' -.....! VI

DAM: I~II~ D:u I.a!; RESERVOIR SIZE:
LOCATION: St. Francois County EMBANKMENT: HEIGHT LENGTH
TYPICAL DAM SECTION
BEDROCK FORMATION: Potosi
SOIL SERIES:Clarksville Grvl. Loam
SOIL CLASSIFICATION:
LL 96 PL 35 PI 61
GRADATION: ~ FINER
#Ul 100 #200 98
#40 100 10tL 94
#60 99 2P. 92
#100 98 tJj. 90
COMPACTION CHARACTERISTICS
MAX. DEN. 79 lb/cu ft OPT. MOIST. 37%
PREDOMINANT CLAY MINERALS:
Kaolinite
COMMENTS: CEC- 2 7 • 9 pH-7.1 Gs-2.82 10 ft.± freeboard rock spillway massive rock downstream bench marshy valley floor
-~
...... "'-1 ~

DAM: Timberl1ne RESERVOIR SIZE: ~~ Acr~~ BEDROCK FORMATION: Potosi
LOCATION: St. Francois County EMBANKMENT: HEIGHT 75 ft. LENGTH · 67S±ft. SOIL SERIES: Clarksville
Grvl. Loam
TYPICAL DAM SECTION SOIL CLASSIFICATION:
LL 69 PL 30 PI 39
GRADATION: % FINER
#Ul 99 #200 85 #40 95 10tL 80 #60 91 2JL 79 #100 88 1J.L. 78
COMPACTION CHARACTERISTICS
MAX. DEN. 82 lbLcu fbPT. MOIST. 36%
PREDOMINANT CLAY MINERALS: Kaolinite
COMMENTS: CEC- 2 7. 8 pH-5.1 Gs-2.83 4 ft.± freeboard rock spillway eroded seepage through dam at several
locations bench added to stabilize slope
---------- ---- --------- --- ------------ -- ---- ----- ----
f-' -....J V1
176
IX. BIBLIOGRAPHY
AYLMORE, L.A. G. and QUIRK, J. P. (1962). The Structural Status of Clay Systems, Clay and Clay Minerals Vol. 9, Pergamon Press, London, p. 104-130. '
BARDEN, L. and SIDES, G. R. (1970). Engineering Behavior and Structure of Compacted Clays, ASCE Vol. 96 No . SM4 , p. 1171-12 0 0 . ' '
BATES, T. F. (1952). Interrelationships of Structure and Genesis in the Kaolinite Group. Symposium on Problems of Clay and Laterite Genesis AIME New York, p. 144-153. ' '
BATES, T. F. (1959). Morphology and Crystal Chemistry of 1:1 Layer Lattice Silicates, Amer. Min., Vol. 44, p. 78-114.
BATES, T. F. and COMER, J. J. (1955). Electron "Microscopy of Clay Surfaces, Clays and Clay Minerals, Natl. Acad. Sci. - Natl. Res. Council Publ. 395, p. 1-25.
BATES, T. F. and COMER, J. J. (1959). Further Observations on the Morphology of Chrysotile and Halloysite, Clay and Clay Minerals, Pergamon Press, London, p. 237-248.
BAVER, L. D. (1930). Relation of the Amount and Nature of Exchangeable Cations to the Structure of a Colloidal Clay, Soil Sci., Vol. 29, p. 291-309.
BAVER, L. D. (1956). Soil Physics. John Wiley & Sons, Inc., New York, 4~.
BERKELHAMER, L. H. (1944). An Apparatus for Differential Thermal Analysis, USBM R.I. 3762, 17 p.
BORST, R.
BRADLEY,
L. and KELLER, W. D. (1969). Scanning Electron Micrographs of API Clay Minerals and Other Selected Samples, Proceedings, Int. Clay Con£. Vol. 1, Isreal Universities Press, Jerusalem, p. 871-901.
w. F. (1964). X-Ray Diffraction Analysis ~f Soil Clays and Structures of Clay Minerals, (1n) . Soil ClC* Miner~logy, University of North Carol1na Press, apel H1ll, p. 113-124.

177
BRADLEY, W. F. and GRIM, R. E. (1951). High Temperature Therm~l Effects of Clay and Related Materials, Am. M1n., Vol. 36, p. 182-201.
BRAGG, W. H. (1949). The Crystalline State. G. Bell and Sons, Ltd., London, 352 p.
BRAMAO, L., CADY, J. G., HENBRICKS, S. B., and SWERDLOW, M. (1952). Criteria For The Characterization of Kaolinite, Halloysite, and a Related Mineral in Clays and Soils, Soil Sci., Vol. 74, p. 273-287.
BRETZ, J. H. (1965). Geomorphic History of the Ozarks of Missouri. Mo. Geol. Sur., Seconu series, Vol-.-61, 137 p.
BRINDLEY,
BRINDLEY,
BRINDLEY,
G. W. (1951). The Kaolin Minerals, (in) X-Ray Identification and Crystal Structure of Clay Minerals, Cpt. IT; p. 3 2-7 5, M1neralogTcar-B"o ciety of Great Britian Monograph.
G. W. and COMER, J. J. (1956). The Structure and Morphology of a Kaolin Clay From Les Eyzies, France, Clays and Clay Minerals, Natl. Acad. Sci. - Natl. Res. Council Publ. 456, p. 61-66.
G. W. and GILLERY, F. H. (1954). Mixed-Layer Kaolin-Chlorite Structure, Clays and Clay Minerals, Natl. Acad. Sci. - Natl. Res. Council Publ. 327, p. 349-353.
BRINDLEY, G. W. and ROBINSON, K. (1947). Fireclay, Trans. Brit. Ceram. Soc., Vol. 46, p. 49-52.
CARROLL,
CARTHEW,
CHAPMAN,
DAVIDSON,
D. and HATHAWAY, J. C. (1953). Clay Mi~erals in a Limestone Soil Profile, Clay & Clay M1nerals, Natl. Acad. Sci. - Natl. Res. Council Publ. 327, p. 171-182.
A. R. (1955). The Quantitative Estimate o~ Kaolinite by Differential Thermal Analys1s, Am. Min., Vol. 40, p. 107-117.
H. D. (1965), Cation-Ex~hange C~pacity,. (in) Methods of Soil Ana1ys1s, ~mer1c~n Soc1ety of Agronomy-,-I~ Mad1son, W1scons1n, p. 891-904.
D T and SHEELER, J. B. (1952). Cation-E~chan¥e C · · · ty of Loess and Its Relation to Eng1neer1ng
apacl bl N 142 p 10-28 Properties, ASTM Sp. Pu · o. ' · ·
178
DAVIS, D. W., ROCHOW, T. G., ROWE, F. G., FULLER, M. L., KERR, P. F. and HAMILTON, P. K. (1950). Electron Micrographs of Reference Clay Minerals API Project 49, Pre. Rpt. No. 6, Columbia Unive;sity, 17 p.
DUVAL, C. (1963). Inorfanic Thermogravimetric Analysis. Elsevier Pub ishing Company, New York, 684 p.
EADES, J. L. (1970). Personal communication.
GRAHAM, J. W. (1969). The Effect of Structure on the Consolidation of Compacted Unsaturated Clay Soils, Unpublished Thesis, University of Missouri - Rolla.
GRIM, R. E. (1947). Differential Thermal Curves of Prepared Mixtures of Clay Minerals, Am. Min., Vol. 32, p. 493-501.
GRIM, R. E. (1952). Ion Exchange in Relation to Some Properties of Soil-Water Systems, ASTM Sp. Tech. Publ. No. 142, p. 3-10.
GRIM, R. E. (1953). Clay Mineralogy. McGraw-Hill Book Company, Inc., New YOrK, 384 p.
GRIM, R. E. (1958). Organization of Water on Clay Mineral Surface and Its Implications For The Properties of Clay-Water Systems, H.R.B. Sp. Rpt. No. 40, p. 17-23.
GRIM, R. E. and BRAY, R. H. (1936). The Mineral Constitution of Various Ceramic Clays, Jour. Am. Cer. Soc., Vol. 19, p. 307-315.
GRIM, R. E. and ROWLAND, R. A. (1942). Difhferentdial Thermal Analysis of Clay Minerals and Ot er Hy rous Materials, Am. Min., Vol. 27, p. 746-760, 801-818.
GRIMSHAW, R. W., HEATON, E., and ROBERTS, A. L. (1945). Constitution of Refractory ~lays, Part II ThermalAnalysis Methods, Trans. Br1t. Ceram. Soc., Vol. 44, p. 76-92.
HARMON, G d FRAULINI F. (1940). Properties of Kaolinite
C. as .aa~unction of' its Particle Size, Jour. Am. Cer. Soc., Vol. 23, p. 252-258.

179
HARRIS, M. T. (1969). A Study of the Correlation Potential of t~e Optimum Moisture Content, Maximum Dry Dens1ty,_and_Consol~dated Drained Shear Strength of Plast1c F1ne-Gra1ned Soils with Index Properties Unpublished Masters Thesis, University of Missouri ' - Rolla.
HAUSER, E. A. (1952). Genesis of Clay Minerals. Symposium on Problems of Clay and Laterite Genesis AIME
' ' New York, p. 100-106.
HAUTH, W. E. and DAVIDSON, D. T. (1950). Studies of the Clay Fraction in Engineering Soils: Part II. Particle Size Distribution and Cation-Exchange Capacity, H.R.B. Proc., Vol. 30, p. 449-464.
HOLTZ, W. G. and LOWITZ, C. A. (1957). Compaction Characteristics of Gravelly Soils, ASTM Sp. Tech. Rpt. No. 232, p. 67-86.
JENNY, H. (1941). Factors of Soil Formation. McGraw-Hill Book Co., New YorK,~ p.
KELLER, W. D. (1968). Principles of Chemical Weathering. Lucas Brothers Publishers, Columbia, M1ssour1, 111 p.
KELLER, W. D. (1968). Flint Clay and a Flint-Clay Facies, Clays and Clay Minerals, Vol. 16, Pergamon Press, London, p. 113-128.
KELLER, W. D. (1970). Personal communication.
KELLER,
KELLEY,
KERR, P.
KOENIG,
W. D., HANSON, R. F., HU~NG, l~. H. an~ CERVANTES, A. (1970). Active Alterat1on of Volcan1c Ro~k to Endellite and Its Precursor at a Hot Spr1ng in Michoacan, Mexico, Manuscript Submitted to Clays and Clay Minerals.
w. P. and JENNY, H. (1936). The Relationship of Crystal Structure to Base Exc~ange_and Its Bearing on Base Exchange in Soils, So1l Sc1., Vol. 41, p. 367-382.
p KULP J L and HAMILTON, P. K. (1949). niffere~ti~l Thermal Analy~is of Reference Cl~~ Mineral Specimens, API ProJeCt 49, Pre. Rpt. · 3, Columbia University, 48 p.
J. W. editor (l961). The Stratigraphic Succession 40 in Missouri. Mo. Geol. Sur., Second Ser1es, Vol. r16 p.

180
LADO, C. C.,_LAM~E, T. W., and MOH, Z. C. (1960). Recent So~l-L1me Research at M.I.T., Paper Presented at the 39th Annual Meeting of the Highway Research Board.
LAMBE, T. W. (1953). The Structure of Inorganic Soil Proceedings, ASCE, Vol. 79 Separate No. 3i5 49 p. ' '
LAMBE, T. W. ~1960). Compacted Clay (a symposium), Transactlons, ASCE, Vol. 126, p. 681-756.
LAMBE, T. W. (1962). Soil Stabilization. (in) Foundation Engineering, Edited by G. A. Leonards, McGrawHlll Book Co., New York, p. 351-437.
LAMBE, T. W. and MARTIN, R. T. (1960). Composition and Engineering Properties of Soils V, H.R.B. Proc., Vol. 36, p. 693-702.
LAWS, W. D. and PAGE, J. B. (1946). Changes Produced in Kaolinite by Dry Grinding, Soil Sci., Vol. 62, p. 319-336.
MACKENZIE, R. C. (1957). The Differential Thermal Investigation oFIClay. Mineralogical Society of Great Britian MOnographs, The Central Press, Aberdeen, 456 p.
MICHAELS, A. S. (1959). Physico-Chemical Properties of Soils. Discussion, ASCE, Vol. 85, No. SM2, p. 91-102.
MIELENZ,
MILLER,
R. C., SCHIELTZ, N.C., and KING, M. E. (1954): Thermogravimetric Analysis_of Clay and Clay-L1ke Minerals Clays and Clay M1nerals, Natl. Acad. Sci. - N~tl. Res. Council Publ. 327, p. 285-314.
B. J. (1965). A Characteri~ation_of Four Limestone Derived Soils From The M1ssour1 Oza~ks, . Unpublished Thesis, University of M1ssour1 -Columbia.
MILLER, W. D. and KELLER, W. D. (1963). Differe~t~tion Between Endellite-Halloysite and Kaol1n1te By Treatment with Potassium Acetate and Ethylene Glycol, Clays and Clay Minerals, Vol. 12, Pergamon Press, London, p. 244-253.
J. K. (1956). The Fabrick of Natura~ Clays and MITCHELL, Its Relation to Engineering Propertles, H.R.B.
Proc., Vol. 35, p. 693.

181
MURRAY, H. H. and_LYONS, S. C. (1956), Degree of Crystal Perfectlon of ~aolinite, Clays and Clay Minerals, Natl. Acad. Scl. ~ Natl. Res. Council Publ. 456 p. 31-40. '
NUTTING, P. G. (1943). Some Stand Thermal Dehydration Curves of Minerals, U.S.G.S. Prof. Paper 197E p. 197-216.
PEECH, M. (1965). Hydrogen-Ion Activity (in) Methods of Soil Anal~sis, American Society of Agronomy--Inc., Madlson, Wisconsin, pl 914-926. '
PRINCE, A. B. (1965). Adsorption Spectrophotometry, (in) Methods of Soil Analysis, American Society of Agronomy, Inc., Madison, Wisconsin, p. 866-878.
QUINN, J. H. (1956). Origin and Age of Ozark Plateau Surfaces in Northwest Arkansas, GSA Bull., Vol. 67, p. 1726 (abstract).
RICH, C. I. (1965). Elemental Analysis by Flame Photometry, (in) Methods of Soil Analysis, American Society of Agronomy, Inc~adison, Wisconsin p. 849-865.
RING, G. W., SALLBERG, J. R., and COLLINS, W. H. (1962). Correlation of Compaction and Classification Test Data of Soils. Public Roads, Vol. 32, No. 4, pp. 7 7- 8 7 .
ROSS, C. S. and KERR, P. F. (1931). The Kaolin Minerals, U.S.G.S. Prof. Paper 165E, p. 151-175.
ROSS, C. S. and KERR, P. F. (1934). Halloysite and Allophane, U.S.G.S. Prof. Paper 185G, p. 135-148.
SAUNDERS, H. L. and GIEDROYC, V. (1950). Differential Thermal Analysis in Controlled Atmosphere, Trans, Brit. Ceram. Soc., Vol. 49, p. 365-374.
SCHMIDT, N. 0. (1965). A Study of The_Isolat~on o~ Organic Matter as a Variable Affect1ng Eng1neer~ng Properties of Soi~s,_Doctor's Dissertat1on. University of Ill1no1s.
SCOTT, w. w. (1948) Standard Methods of Chemkcaiz~4alysis. D. Van Nostrand Co., Inc., New Yor , P·
SCRIVNER, C. L. (1960). Morphology, Mineralogy, and . Chemistry of the Lebanon Silt_Loam,_Unpubllsh~d Dissertation, University of M1ssour1 - Columbla.

182
SEED, H. B. and CHAN, C. K. (1959). Structure and Strength Characteristics of Compacted Clay ASCE Vol 85 No . SM 5 , p . 8 7 - 1 0 9 • ' ' . '
SIMONSON, R. W. (1949). Genesis and Classification of Red-Yellow Podzolic Soils, Proc. Soil Sci. Soc. Am., Vol. 14, p. 316-319.
SLOAN, R. L. and KELL, T. F. (1966). The Fabric of M~chanically Compacted Kaolin, Clays and Clay M1nerals, Vol. 14, Pergamon Press, London, p. 289-296.
SPEIL, S. (1944). Application of Thermal Analysis To Clays and Aluminous Materials, USBM R.I. No. 3764, 36 p.
SUDO, T. and TAKAHASHI, H. (1956). Shapes of Halloysite Particles in Japanese Clays, Clay and Clay Minerals, Natl. Acad. Sci. - Natl. Res. Council Publ. 327, p. 158-171.
TERZAGHI, K. (1958). Design and Performance of Sasumua Dam. Proc. Institution of Civil Engineers, London, Vol. 9, p. 369-394.
THORNBURY, W. D. (1965). Regional Geomorphology of the United States. John Wiley & Sons, Inc., 6og-p.
TROLLOPE, D. H. and CHAN, C. K. (1960). Soil Structure and the Step-Strain Phenomenon, Transactions, ASCE, Vol. 126, p. 1650-1698.
U.S. DEPARTMENT OF AGRICULTURE (1960). Soil ClassificationA Comprehensive System (7th Approx1mat1on). Washington, U.S. Govt. Pr1nting Office.
VEES, E. and WINTERKORN, H. F. (1967). Engineering Properties of Several Pure Clays as Functions_o~ Mineral Type, Exchange Ions, and Phase Compos1t1on, Highway Research Record No. 209, p. 55-65.
VOLOSTNYKH, G. T. (1965) Temperature of Mai~ Endothermic Effect of Kaolinite. Zap. Uses. M1n. Obshch., (Mem All Union Min. Soc.), Vol. 94, No. 4, p. 407-419- 95 reported in Min. Absts., Vol. 17, p. 555 (1966).
WADA, K. (1961). Lattice Expansion of Kaolin Minerals by Treatment with Potassium Acetate, Am. Min., Vol. 46, p. 78-91.

183
WHITE, W. A. (1958). Water Sorption Properties of Homoionic Clay Minerals~ Illinois Geological Survey, R.I. 208, 44 p.
WINTERKORN, H. F. (1940). Physico-Chemical Testing of Soils-Application of the Results in Practice, H.R.B. Proc., Vol. 20~ p. 798-806.
WINTERKORN, H. F. and MOORMAN, R. B. B. (1941). A Study of Changes in Physical Properties of Putnam Soil Induced by Ionic Substitution, H.R.B. Proc., Vol. 21, p. 415-434.
ZEIGLER, E. J. (194 8) . Effect of Mate rial Retained on the Number 4 Sieve on the Compaction Test of Soils, H.R.B. Proc., Vol. 128, p. 409-414.

184
X. VITA
Arthur David Alcott was born on 28 April, 1941 in
Asheville, North Carolina. He received his primary and
secondary education in Sumter, South Carolina. After high
school graduation, he attended Colorado School of Mines,
Golden, Colorado where he received a Geological Engineering
Degree in June, 1964.
He worked as a highway engineer for the Colorado
Department of Highways until January, 1966, and as a soils
and foundations engineer for Sverdrup & Parcel and
Assoc., Inc., St. Louis~ Missouri until August, 1968. He
has attended the University of Missouri - Rolla since that
time and was a graduate assistant during the 1969-1970
school year.
The author is a registered "Engineering-in-Training"
with the Colorado Board of Professional Registration. He
is married to the former Molly Ann Orr of Lancaster,
Pennsylvania and has two daughters, Laura Ann and
Jennifer Ashley.