Embed Size (px)
Citation preview
Applied Clay Science 44 (2009) 43–58
Contents lists available at ScienceDirect
Applied Clay Science
j ourna l homepage: www.e lsev ie r.com/ locate /c lay
Clay membrane testing using a flexible-wall cell under closed-systemboundary conditions
Jong-Beom Kang a,1, Charles D. Shackelford b,⁎a Engineering Analytics, Inc., 1600 Specht Point Road, Suite 209, Fort Collins, Colorado 80525, USAb Department of Civil and Environmental Engineering, 1372 Campus Delivery, Colorado State University, Fort Collins, Colorado 80523-1372, USA
⁎ Corresponding author. Tel.: +1 970 491 5051; fax: +E-mail addresses: [email protected] (J.-B. Kan
(C.D. Shackelford).1 Formerly, Department of Civil and Environmenta
University. Tel.: +1 970 488 3111; fax: +1 970 488 3112
0169-1317/$ – see front matter © 2009 Elsevier B.V. Aldoi:10.1016/j.clay.2009.01.006
a b s t r a c t
a r t i c l e i n f oArticle history:
Membrane behavior represe Received 29 July 2008Received in revised form 1 January 2009Accepted 10 January 2009Available online 21 January 2009Keywords:Chemico-osmosisClay membranesFlexible-wall cellGeosynthetic clay linerMembrane efficiencySemipermeable membranes
nts the ability of porous media to restrict the migration of solutes, leading to theexistence of chemico-osmosis, or the flow of liquid in response to a chemical concentration gradient.Membrane behavior is an important consideration with respect to clay soils with small pores and interactiveelectric diffuse double layers associated with individual particles, such as bentonite. The results of recentstudies indicate the existence of membrane behavior in bentonite-based hydraulic barriers used in wastecontainment applications. Thus, measurement of the existence and magnitude of membrane behavior in suchclay soils is becoming increasingly important. In this regard, the development and evaluation of a flexible-wallcell used to measure the membrane behavior of clay soils under closed-system boundary conditions isdescribed. The advantages of aflexible-wall cell include complete control over the state of stress existingwithinthe test specimen and the ability to back-pressure saturate and consolidate the specimen prior to membranetesting. Use of the developed flexible-wall cell is illustrated via tests conducted to measure the membranebehavior of a geosynthetic clay liner (GCL), amanufactured hydraulic barrier containing sodium bentonite. Theresults indicate that themembrane efficiencies of duplicate specimens of the GCLmeasured using the flexible-wall cell are both reproducible and similar to, but somewhat lower than, those previously reported for the sameGCL using a rigid-wall cell under the same closed-system boundary conditions.
© 2009 Elsevier B.V. All rights reserved.
1. Introduction
Membrane behavior in soils refers to the restricted migration ofsolutes through the soil resulting in the buildup of solute concentra-tion at the influent side of the soil such that a concentration differenceacross the soil is developed. The existence of the concentrationdifference resulting frommembrane behavior leads to a concentrationgradient that drives two processes, viz., flow of the solvent (e.g.,water) via chemico-osmosis in a direction from low solute concentra-tion (high water activity) to high solute concentration (low wateractivity), and solute diffusion in a direction from high solute concen-tration to low solute concentration. In the case where all the solutesare inhibited from migration corresponding to perfect or ideal mem-brane behavior, all solute diffusion is prevented, but the chemico-osmotic flow of the solvent in response to the concentration gradientcan still occur. For this reason, soils that exhibit membrane behaviorare often referred to as semipermeablemembranes, because such soilsare permeable to the solvent regardless of the degree of solute
1 970 491 7727.g), [email protected]
l Engineering, Colorado State.
l rights reserved.
restriction. However, because the pores in soils are distributed over arange of sizes, most naturally occurring soil membranes are non-idealor imperfect. As a result, both chemico-osmosis and diffusion occursimultaneously in most soil membranes, although the diffusion pro-cess becomes increasingly more restricted as the level or degree ofsolute restriction increases (Malusis and Shackelford, 2002a).
Restriction of solutes from migration occurs when the pores of thesoil are small relative to the size of the migrating solutes. Because thesizes of the pores required to restrict solute migration are necessarilysmall, membrane behavior typically is observed in soils that aredominated with clay-sized particles, such that soils exhibiting mem-brane behavior are often referred to as clay membranes. In addition toparticle size, the mineralogy of the soil also can play an important rolein determining the existence and extent of membrane behavior. Inparticular, membrane behavior tends to be more prevalent in soilswhose behavior is dominated by the existence of high swelling, activeclay minerals, such as the sodium smectites (e.g., sodium montmor-illonite) (Kemper and Rollins,1966; Fritz andMarine,1983; Fritz,1986;Olsen et al., 1990; Shackelford et al., 2003).
Interest in clay membrane behavior historically has been focusedprimarily in the soil and geological sciences. Studies in soil sciencehave focused on themigration of nutrients to plant roots (e.g., Kemper,1960, 1961; Kemper and Evans, 1963; Kemper and Quirk, 1972),whereas studies in the geological sciences have focused on the ability
44 J.-B. Kang, C.D. Shackelford / Applied Clay Science 44 (2009) 43–58
of natural clay formations, such as aquitards and aquicludes, to exhibitmembrane behavior (MacKay, 1946; Olsen, 1972; Hanshaw, 1972;Greenberg, et al., 1973; Marine, 1974; Marine and Fritz, 1981; Fritz,1986; Neuzil, 1986, 2000; Cey et al., 2001; Soler, 2001; Hart andWhitworth, 2005). The results of relatively recent research also haveindicated that membrane behavior can be substantial in bentonite-based barriers used for hydraulic containment applications (Malusis,2001; Shackelford et al., 2003;Malusis et al., 2001a, 2003;Malusis andShackelford, 2002a,b; Yeo, 2003; Yeo et al., 2005; Derrington et al.,2006; Henning et al., 2006; Evans et al., 2008).
As a result of the above considerations, interest has increasedrecently in the ability to measure membrane behavior in clays, ingeneral, and clays used in engineered barriers for hydraulic contain-ment applications, in particular. Accordingly, the purpose of this paperis to present the development and evaluation of a flexible-wall cell in aclosed (no-flow) system that can be used to measure the membranebehavior of clays.
2. Background
2.1. Boundary conditions
When measuring the membrane behavior of clays in thelaboratory, two considerations are paramount, viz. the boundaryconditions to be imposed during testing, and the type of cell to be usedfor the test specimen. In terms of boundary conditions, measurementof membrane behavior can be conducted using either open or closedsystems. For open systems, two approaches have commonly beenemployed. The first approach, which has been far more common,involves forcing a salt solution through the clay under an appliedhydraulic pressure difference (hydraulic gradient) and determininghow much of the salt has been filtered out of solution (referred to asfiltrate) by the clay due to membrane behavior (e.g., McKelvey et al.,1957; McKelvey and Milne, 1962; Kemper, 1960; Kharaka and Berry,1973; Hanshaw and Coplen, 1973; Kharaka and Smalley, 1976; Fritzand Marine, 1983; Whitworth and Fritz, 1994; Ishiguro et al., 1995;Hart and Whitworth, 2005; Derrington et al., 2006). This type of testoften is referred to as a filtration, hyperfiltration, or ultrafiltration test.
The second, less common open-system approach involves deter-mining the membrane efficiency from the measured amount ofchemico-osmotic flow (Kemper, 1961; Kemper and Evans, 1963;Kemper and Rollins, 1966; Kemper and Quirk, 1972; Keijzer et al.,1997, 1999; Keijzer and Loch, 2001). This approach probably has beenless common because of the greater difficulty in accurately measuringthe small quantities of flow that typically result. This difficulty hasbeen overcome to some extent via the use of flow-pump (syringe)systems that depend on measurement of potential differences usingtransducers during forced passage of small liquid fluxes throughspecimens via mechanical drive mechanisms (e.g., Olsen, 1969, 1972).
In contrast, for membrane testing involving a closed system, liquidflow through the test specimen is prevented from occurring (Elricket al., 1976; Malusis et al., 2001b; Malusis and Shackelford, 2002a,b;Shackelford and Lee, 2003; Yeo et al., 2005; Henning et al., 2006). As aresult of preventing solution flow, a chemico-osmotic pressuredifference develops across the specimen to counteract the tendencyfor chemico-osmotic flow, and themembrane efficiency is determinedbased on themeasuredmagnitude of the pressure buildup and the saltconcentrations at the boundaries. In this regard, differences in testresults can occur depending on howwell the salt concentrations at theboundaries are maintained constant during the test (e.g., Malusiset al., 2001b; Shackelford and Lee, 2003).
2.2. Types of cells
The types of cells that have been used for clay membrane testingcan be classified broadly into two categories, viz., rigid-wall (fixed-
wall) cells and flexible-wall or triaxial cells. The primary differencebetween the two types of cells is that the volume of the test specimenis controlled during testing in rigid-wall cells, whereas the state ofstress on the specimen is controlled in flexible-wall (triaxial) cells. Theadvantages and disadvantages of each type of cell in terms ofhydraulic conductivity testing were identified by Daniel et al. (1985).
For rigid-wall cells used as permeameters, Daniel et al. (1985)identified the major advantages as lower cost, simplicity, greateradaptability to testing compacted soils, compatibility with a widerange of chemicals used as permeant liquids, and the lack of need toapply high confining pressures. The major disadvantages of rigid-wallcells were identified by Daniel et al. (1985) as incomplete control overimposed stress conditions, inability to measure deformations in mostfixed-wall cells, difficulty in trimming soil samples into the containingring, and the potential for side-wall leakage.
For flexible-wall cells used as permeameters, Daniel et al. (1985)identified the advantages as minimization of side-wall leakage, con-trol over vertical and horizontal stresses, measurement of vertical andhorizontal deformations, ability to back-pressure saturate soil speci-mens prior to testing, and adaptability to testing undisturbed soilsamples recovered from field borings. Disadvantages of flexible-wallcells included higher cost, compatibility problems between theflexible confining membrane and some chemical solutions used aspermeant liquids, and the need to apply significant confining pres-sures when testing soil specimens under high hydraulic gradients.
Although both rigid-wall and flexible-wall cells have been usedextensively for hydraulic conductivity testing (e.g., Daniel, 1994), onlya few studies have employed the use of flexible-wall cells formembrane testing of clays (e.g., Keijzer et al., 1997, 1999; Keijzer andLoch, 2001; Heister et al., 2004, 2005; Rahman et al., 2005). In themajority of these studies (e.g., Keijzer et al., 1997, 1999; Keijzer andLoch, 2001; and Heister et al., 2004, 2005), open-system boundaryconditions were imposed using the same hydraulic control apparatus,whereas in the study by Rahman et al. (2005), the system used tocontrol the boundary conditions is not adequately described. To theauthors' knowledge, no study has reported the use of a flexible-wallcell in conjunction with closed-system boundary conditions. Such anapparatus offers the advantages of a flexible-wall cell, principally theability to control the state of stress in the soil specimen, with theadvantage of precise and accurate measurement of chemico-osmoticpressure buildup offered by a closed system (e.g., Malusis et al.,2001b). Thus, the objective of this studywas to develop and evaluate aflexible-wall testing apparatus consisting of a flexible-wall cell and ahydraulic control system that imposes closed-system boundaryconditions for measurement of the membrane behavior of clay soils.The evaluationwas based primarily on the results of duplicate tests tomeasure the membrane behavior of a geosynthetic clay liner (GCL), amanufactured hydraulic barrier containing sodium bentonite.
3. Descriptions of testing apparatus and procedures
3.1. Testing apparatus
The flexible-wall cell developed in this study and the associatedhydraulic control system are shown schematically in Fig. 1, andphotographs of the flexible-wall cell and the complete testingapparatus are shown in Fig. 2. The hydraulic control system isessentially the same as that described in detail by Malusis et al.(2001b) except for three primary differences. First, the syringe/actuator flow pump and associated hydraulic system for control of theboundary conditions is connected to a flexible-wall cell as opposed tothe rigid-wall cell used by Malusis et al. (2001b). Second, two in-linepressure transducers (Model PX181-100G5V, OMEGA, Stamford,Connecticut), designated as T1 and T2 in Fig. 1, are installed on eitherside of the differential pressure transducer (Model DP15, ValidyneEngineering Sales Corp., Northridge, California), designated as T3 in
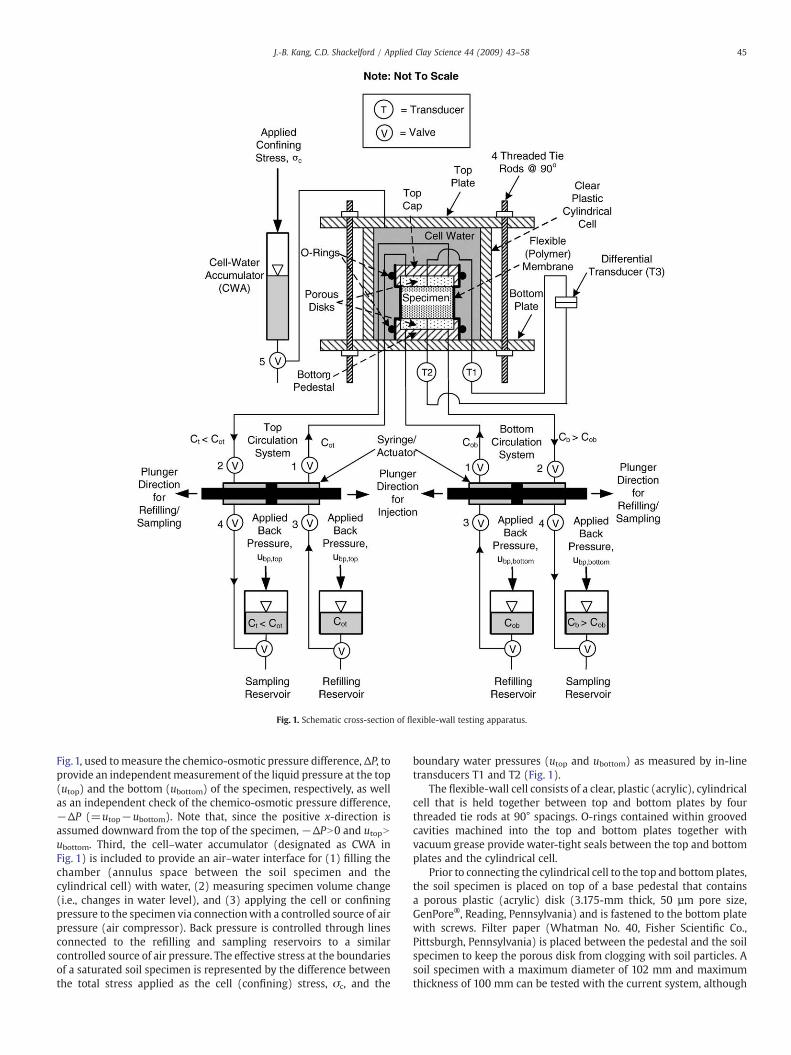
Fig. 1. Schematic cross-section of flexible-wall testing apparatus.
45J.-B. Kang, C.D. Shackelford / Applied Clay Science 44 (2009) 43–58
Fig.1, used tomeasure the chemico-osmotic pressure difference,ΔP, toprovide an independentmeasurement of the liquid pressure at the top(utop) and the bottom (ubottom) of the specimen, respectively, as wellas an independent check of the chemico-osmotic pressure difference,−ΔP (=utop−ubottom). Note that, since the positive x-direction isassumed downward from the top of the specimen, −ΔPN0 and utopNubottom. Third, the cell–water accumulator (designated as CWA inFig. 1) is included to provide an air–water interface for (1) filling thechamber (annulus space between the soil specimen and thecylindrical cell) with water, (2) measuring specimen volume change(i.e., changes in water level), and (3) applying the cell or confiningpressure to the specimen via connectionwith a controlled source of airpressure (air compressor). Back pressure is controlled through linesconnected to the refilling and sampling reservoirs to a similarcontrolled source of air pressure. The effective stress at the boundariesof a saturated soil specimen is represented by the difference betweenthe total stress applied as the cell (confining) stress, σc, and the
boundary water pressures (utop and ubottom) as measured by in-linetransducers T1 and T2 (Fig. 1).
The flexible-wall cell consists of a clear, plastic (acrylic), cylindricalcell that is held together between top and bottom plates by fourthreaded tie rods at 90° spacings. O-rings contained within groovedcavities machined into the top and bottom plates together withvacuum grease provide water-tight seals between the top and bottomplates and the cylindrical cell.
Prior to connecting the cylindrical cell to the top and bottomplates,the soil specimen is placed on top of a base pedestal that containsa porous plastic (acrylic) disk (3.175-mm thick, 50 µm pore size,GenPore®, Reading, Pennsylvania) and is fastened to the bottom platewith screws. Filter paper (Whatman No. 40, Fisher Scientific Co.,Pittsburgh, Pennsylvania) is placed between the pedestal and the soilspecimen to keep the porous disk from clogging with soil particles. Asoil specimen with a maximum diameter of 102 mm and maximumthickness of 100 mm can be tested with the current system, although
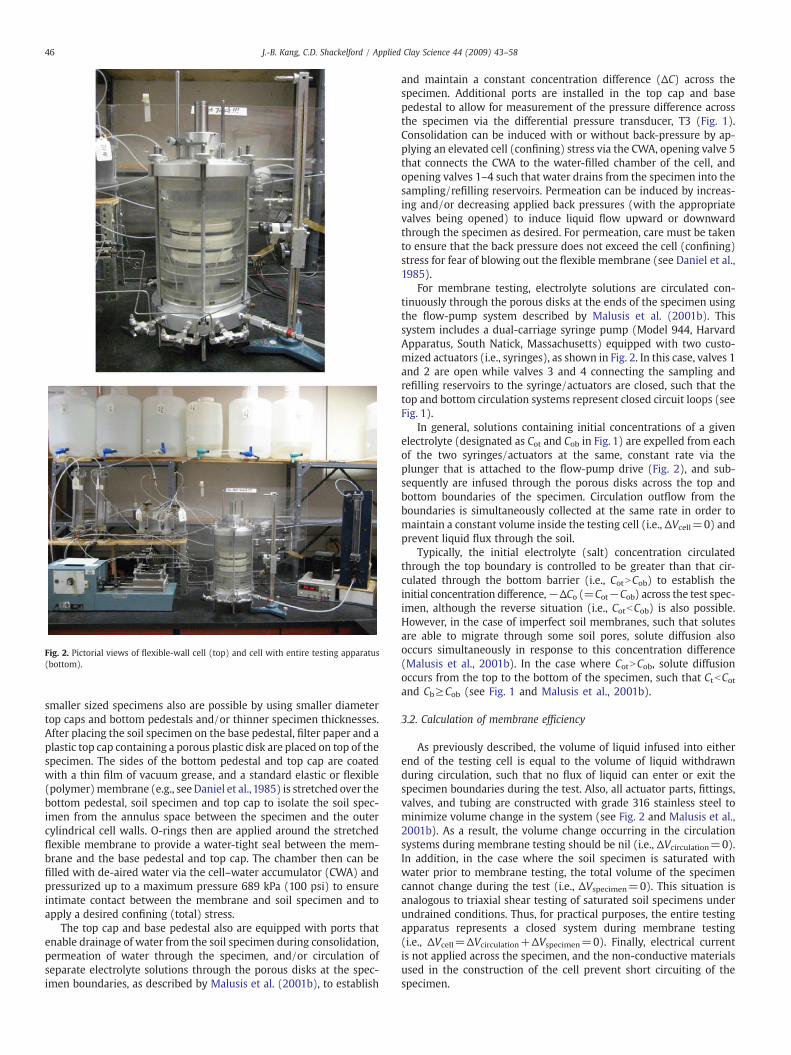
Fig. 2. Pictorial views of flexible-wall cell (top) and cell with entire testing apparatus(bottom).
46 J.-B. Kang, C.D. Shackelford / Applied Clay Science 44 (2009) 43–58
smaller sized specimens also are possible by using smaller diametertop caps and bottom pedestals and/or thinner specimen thicknesses.After placing the soil specimen on the base pedestal, filter paper and aplastic top cap containing a porous plastic disk are placed on top of thespecimen. The sides of the bottom pedestal and top cap are coatedwith a thin film of vacuum grease, and a standard elastic or flexible(polymer)membrane (e.g., see Daniel et al.,1985) is stretched over thebottom pedestal, soil specimen and top cap to isolate the soil spec-imen from the annulus space between the specimen and the outercylindrical cell walls. O-rings then are applied around the stretchedflexible membrane to provide a water-tight seal between the mem-brane and the base pedestal and top cap. The chamber then can befilled with de-aired water via the cell–water accumulator (CWA) andpressurized up to a maximum pressure 689 kPa (100 psi) to ensureintimate contact between the membrane and soil specimen and toapply a desired confining (total) stress.
The top cap and base pedestal also are equipped with ports thatenable drainage of water from the soil specimen during consolidation,permeation of water through the specimen, and/or circulation ofseparate electrolyte solutions through the porous disks at the spec-imen boundaries, as described by Malusis et al. (2001b), to establish
and maintain a constant concentration difference (ΔC) across thespecimen. Additional ports are installed in the top cap and basepedestal to allow for measurement of the pressure difference acrossthe specimen via the differential pressure transducer, T3 (Fig. 1).Consolidation can be induced with or without back-pressure by ap-plying an elevated cell (confining) stress via the CWA, opening valve 5that connects the CWA to the water-filled chamber of the cell, andopening valves 1–4 such that water drains from the specimen into thesampling/refilling reservoirs. Permeation can be induced by increas-ing and/or decreasing applied back pressures (with the appropriatevalves being opened) to induce liquid flow upward or downwardthrough the specimen as desired. For permeation, care must be takento ensure that the back pressure does not exceed the cell (confining)stress for fear of blowing out the flexible membrane (see Daniel et al.,1985).
For membrane testing, electrolyte solutions are circulated con-tinuously through the porous disks at the ends of the specimen usingthe flow-pump system described by Malusis et al. (2001b). Thissystem includes a dual-carriage syringe pump (Model 944, HarvardApparatus, South Natick, Massachusetts) equipped with two custo-mized actuators (i.e., syringes), as shown in Fig. 2. In this case, valves 1and 2 are open while valves 3 and 4 connecting the sampling andrefilling reservoirs to the syringe/actuators are closed, such that thetop and bottom circulation systems represent closed circuit loops (seeFig. 1).
In general, solutions containing initial concentrations of a givenelectrolyte (designated as Cot and Cob in Fig. 1) are expelled from eachof the two syringes/actuators at the same, constant rate via theplunger that is attached to the flow-pump drive (Fig. 2), and sub-sequently are infused through the porous disks across the top andbottom boundaries of the specimen. Circulation outflow from theboundaries is simultaneously collected at the same rate in order tomaintain a constant volume inside the testing cell (i.e., ΔVcell=0) andprevent liquid flux through the soil.
Typically, the initial electrolyte (salt) concentration circulatedthrough the top boundary is controlled to be greater than that cir-culated through the bottom barrier (i.e., CotNCob) to establish theinitial concentration difference,−ΔCo (=Cot−Cob) across the test spec-imen, although the reverse situation (i.e., CotbCob) is also possible.However, in the case of imperfect soil membranes, such that solutesare able to migrate through some soil pores, solute diffusion alsooccurs simultaneously in response to this concentration difference(Malusis et al., 2001b). In the case where CotNCob, solute diffusionoccurs from the top to the bottom of the specimen, such that CtbCotand Cb≥Cob (see Fig. 1 and Malusis et al., 2001b).
3.2. Calculation of membrane efficiency
As previously described, the volume of liquid infused into eitherend of the testing cell is equal to the volume of liquid withdrawnduring circulation, such that no flux of liquid can enter or exit thespecimen boundaries during the test. Also, all actuator parts, fittings,valves, and tubing are constructed with grade 316 stainless steel tominimize volume change in the system (see Fig. 2 and Malusis et al.,2001b). As a result, the volume change occurring in the circulationsystems during membrane testing should be nil (i.e., ΔVcirculation=0).In addition, in the case where the soil specimen is saturated withwater prior to membrane testing, the total volume of the specimencannot change during the test (i.e., ΔVspecimen=0). This situation isanalogous to triaxial shear testing of saturated soil specimens underundrained conditions. Thus, for practical purposes, the entire testingapparatus represents a closed system during membrane testing(i.e., ΔVcell=ΔVcirculation+ΔVspecimen=0). Finally, electrical currentis not applied across the specimen, and the non-conductive materialsused in the construction of the cell prevent short circuiting of thespecimen.
47J.-B. Kang, C.D. Shackelford / Applied Clay Science 44 (2009) 43–58
Under these conditions, the membrane efficiency, ω, is defined asfollows (Groenevelt and Elrick, 1976; Malusis et al., 2001b):
ω =ΔPΔπ
jΔV=0
ð1Þ
where ΔP (b0)is the measured chemico-osmotic pressure differenceinduced across the specimen as a result of prohibiting chemico-osmotic flux of solution, and Δπ (b0) is the theoretical chemico-osmotic pressure difference across an “ideal” semipermeable mem-brane (i.e., ω=1) subjected to an applied difference in solute(electrolyte) concentration (e.g., Olsen et al., 1990). In essence, ω asdefined by Eq. (1) represents the ratio of the actual to maximumchemico-osmotic pressure differences that occur across a membranein a closed system in response to an applied concentration difference(i.e., as ΔP→Δπ, ω→1). Thus, ω is calculated based on the measuredpressure difference, ΔP, resulting from the difference in solute con-centrations established across the specimen, and knowledge of theboundary electrolyte (salt) concentrations.
As previously noted, ΔP is measured directly using a differentialpressure transducer (T3 in Fig. 1), and also calculated independentlyas the difference between the pressuresmeasured independently by thetwo in-line pressure transducers (T1 and T2 in Fig. 1). The theoreticalchemico-osmotic pressure difference, Δπ, in Eq. (1) for a single-saltsystem can be calculated based on the salt concentrations at thespecimen boundaries in accordance with the van't Hoff expression(Katchalsky and Curran, 1965), or
Δπ = mRTΔC = mRT C2 − C1ð Þ ð2Þ
where ν is the number of ions per molecule of the salt, R is theuniversal gas constant [8.314 J mol−1 K−1], T is the absolute tem-perature (K), C is the salt concentration (M), and subscripts 1 and 2represent the individual compartments on either side of the soilspecimen. For example, for 1:1 electrolyte solutions (e.g., NaCl, KCl),ν=2 in Eq. (2), whereas for 2:1 electrolyte solutions (e.g., CaCl2),ν=3 in Eq. (2). The van't Hoff expression is based on the limitingassumption that the electrolyte solutions are ideal and dilute and,therefore, provides only approximate values of the maximumchemico-osmotic pressure difference. However, Fritz (1986) notesthat the error associated with the van't Hoff expression is low (b5%)for 1:1 electrolytes (e.g., NaCl, KCl) and concentrations ≤1.0 M.
The initial difference in chemico-osmotic pressure, Δπo, can becomputed in accordance with Eq. (2) based on the initial salt concen-trations, Cot and Cob, and assuming the positive x-direction downwardfrom the top of the specimen as follows:
Δπo = mRT Cob − Cotð Þ ð3Þ
The value Δπo based on Eq. (3) represents the maximum possiblevalue of Δπ that can be maintained across the specimen during thetest. Calculation of chemico-osmotic efficiency based on Δπo is ap-propriate for “perfectly flushing” boundary conditions in which thecirculation rate is sufficiently rapid relative to the diffusive ratethrough the specimen, such that changes in boundary salt concentra-tions due to diffusion are negligible. However, when the circulationrate is not sufficiently rapid, changes in the boundary concentrationsdue to diffusion may result in a time-dependent reduction in Δπ(Malusis et al., 2001b).
This potential effect of diffusion may be taken into account bybasing the determination of ω on the average boundary salt con-centrations of a solute species, Ct,ave and Cb,ave, defined as follows(Malusis et al., 2001b):
Ct;ave =Cot + Ct
2; Cb;ave =
Cob + Cb
2ð4Þ
Based on these average concentrations, an average chemico-osmotic pressure difference, Δπave can be written as follows:
Δπave = mRT Cb;ave − Ct;ave
� �ð5Þ
Since Ct,avebCot and Cb,ave≥Cob,Δπave given by Eq. (5) will be less thanΔπo given by Eq. (3). Thus, for the same measured chemico-osmoticpressure difference, ΔP, values of ω based on Δπave, or ωave, will begreater than those based on Δπo, or ωo, in accordance with Eq. (1)(Malusis et al., 2001b; Malusis and Shackelford, 2002b). In the limit asω→1, solutes cannot enter or exit the specimen, such that Ct,ave→Cot,Cb,ave→Cob, and ωave→ωo.
4. Evaluation of testing apparatus
4.1. Materials
The flexible-wall cell was evaluated by performing duplicatemembrane tests on specimens of the same geosynthetic clay liner(GCL) as tested by Malusis and Shackelford (2002a,b) using a rigid-wall cell and the same closed-system boundary conditions. The resultsreported by Malusis and Shackelford (2002a,b) indicated that the GCLbehaved as a semipermeable membrane with membrane efficienciesranging from 8 to 69% (i.e., 0.08≤ω≤0.69) for KCl concentrationsdifferences ranging from 3.9 to 47 mM. The liquids used in the currentevaluation also were the same as those used by Malusis and Shackel-ford (2002a,b) to facilitate comparison of the results between the twostudies. These liquids included de-ionized water (DIW) and solutionsof DIWand potassium chloride (KCl) (certified A.C.S.; Fisher Scientific,Fair Lawn, New Jersey) dissolved in DIW at measured concentrationsof 3.9, 6.0, 8.7, 20, and 47 mM.
The GCL ranges from about 5 to 10 mm in thickness in the air-dried(as-shipped) condition, and consists of sodium bentonite sandwichedbetween non-woven (non-patterned) and a woven (patterned) geo-textiles and held together by needle punching with polymer fibers.The geotextiles provide no hydraulic resistance, but rather serve tocontain the sodium bentonite which is the principal hydraulic re-sistance component of the GCL. The physical and chemical propertiesas well as the mineralogical composition of the bentonite portion ofthe GCL were reported by Malusis and Shackelford (2002b). In termsof mineralogy, the bentonite component of the GCL contained 71%montmorillonite, 7% mixed layer illite/smectite, 15% quartz, and 7%other minerals. The liquid limit (LL) and plastic limit (PL) measured inaccordance with ASTM D 4318 were reported as 478% and 39%,respectively, and the bentonite classified as a high plasticity clay (CH)based on the Unified Soil Classification System (ASTM D 2487). Themeasured cation exchange capacity, or CEC, was reported as 47.7meq/100 g (=47.7 cmolc/kg), and ~53% of the exchange complex wasreported as being comprised of exchangeable sodium (i.e., sodiumbentonite). Further details regarding the physical and chemical prop-erties of the GCL bentonite are provided by Malusis and Shackelford(2002b).
4.2. Specimen assembly and preparation
For the GCL specimens evaluated in this study, the specimen as-sembly and disassembly consisted of three stages: (1) a flushing stage,(2) a consolidation stage, and (3) a membrane stage. The primarypurpose of the flushing stage was to leach soluble salts from the poresof the GCL bentonite to enhance the potential for membrane behavior,since the membrane behavior of clays is known to increase withdecreasing salt concentration (Olsen et al., 1990; Malusis andShackelford, 2002a,b; Shackelford and Lee, 2003; Shackelford et al.,2003; Yeo et al., 2005). Secondary purposes included saturating thetest specimens and measuring the initial hydraulic conductivity, k.The purpose of the consolidation stage was to consolidate the
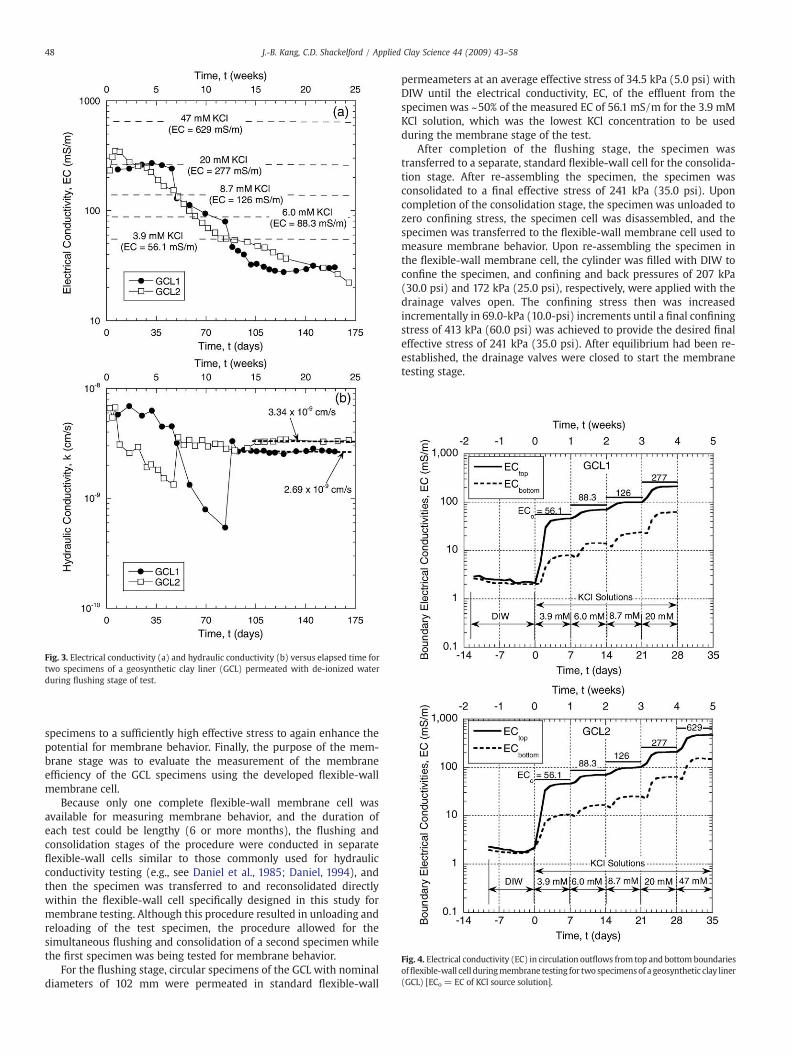
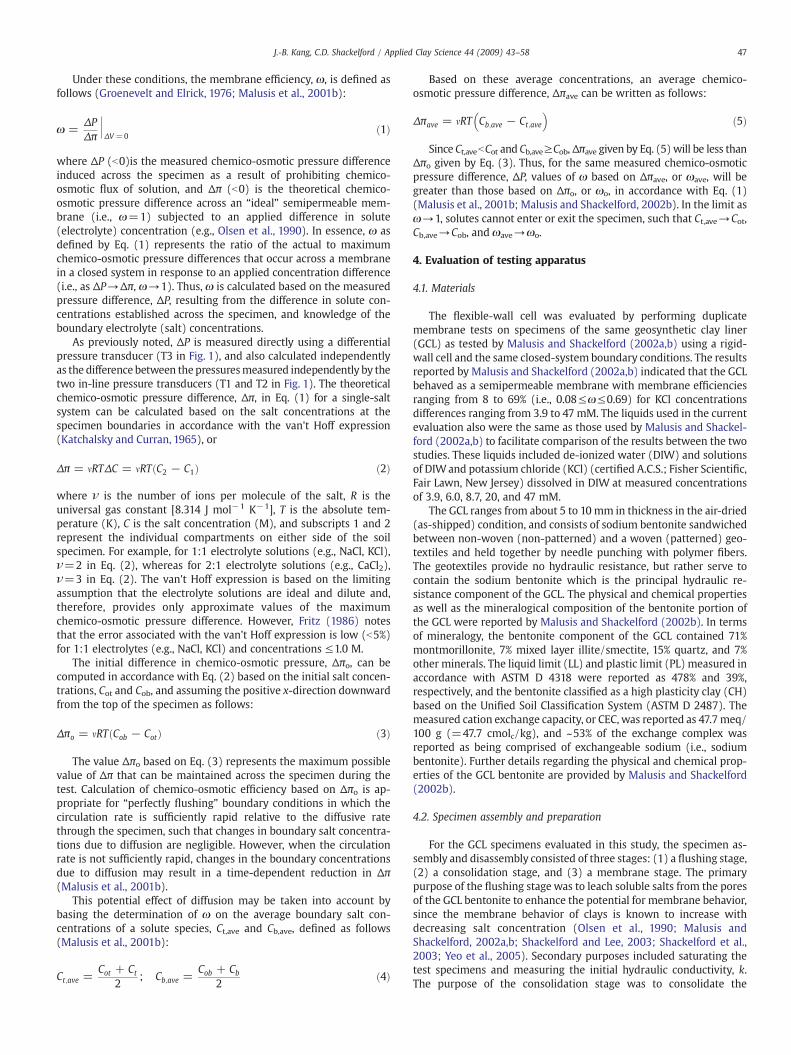
Fig. 3. Electrical conductivity (a) and hydraulic conductivity (b) versus elapsed time fortwo specimens of a geosynthetic clay liner (GCL) permeated with de-ionized waterduring flushing stage of test.
Fig. 4. Electrical conductivity (EC) in circulation outflows from top and bottom boundariesofflexible-wall cell duringmembrane testing for two specimensof a geosynthetic clay liner(GCL) [ECo = EC of KCl source solution].
48 J.-B. Kang, C.D. Shackelford / Applied Clay Science 44 (2009) 43–58
specimens to a sufficiently high effective stress to again enhance thepotential for membrane behavior. Finally, the purpose of the mem-brane stage was to evaluate the measurement of the membraneefficiency of the GCL specimens using the developed flexible-wallmembrane cell.
Because only one complete flexible-wall membrane cell wasavailable for measuring membrane behavior, and the duration ofeach test could be lengthy (6 or more months), the flushing andconsolidation stages of the procedure were conducted in separateflexible-wall cells similar to those commonly used for hydraulicconductivity testing (e.g., see Daniel et al., 1985; Daniel, 1994), andthen the specimen was transferred to and reconsolidated directlywithin the flexible-wall cell specifically designed in this study formembrane testing. Although this procedure resulted in unloading andreloading of the test specimen, the procedure allowed for thesimultaneous flushing and consolidation of a second specimen whilethe first specimen was being tested for membrane behavior.
For the flushing stage, circular specimens of the GCL with nominaldiameters of 102 mm were permeated in standard flexible-wall
permeameters at an average effective stress of 34.5 kPa (5.0 psi) withDIW until the electrical conductivity, EC, of the effluent from thespecimen was ~50% of the measured EC of 56.1 mS/m for the 3.9 mMKCl solution, which was the lowest KCl concentration to be usedduring the membrane stage of the test.
After completion of the flushing stage, the specimen wastransferred to a separate, standard flexible-wall cell for the consolida-tion stage. After re-assembling the specimen, the specimen wasconsolidated to a final effective stress of 241 kPa (35.0 psi). Uponcompletion of the consolidation stage, the specimen was unloaded tozero confining stress, the specimen cell was disassembled, and thespecimen was transferred to the flexible-wall membrane cell used tomeasure membrane behavior. Upon re-assembling the specimen inthe flexible-wall membrane cell, the cylinder was filled with DIW toconfine the specimen, and confining and back pressures of 207 kPa(30.0 psi) and 172 kPa (25.0 psi), respectively, were applied with thedrainage valves open. The confining stress then was increasedincrementally in 69.0-kPa (10.0-psi) increments until a final confiningstress of 413 kPa (60.0 psi) was achieved to provide the desired finaleffective stress of 241 kPa (35.0 psi). After equilibrium had been re-established, the drainage valves were closed to start the membranetesting stage.
49J.-B. Kang, C.D. Shackelford / Applied Clay Science 44 (2009) 43–58
4.3. Membrane testing procedures
Prior to subjecting the confined test specimen to a soluteconcentration difference, DIW was circulated through the top capand bottom pedestal of the specimen at a flow rate of 4.2×10⁻¹⁰ m3/sto establish a steady baseline differential pressure. This displacementratewas the same as that used byMalusis et al. (2001b) formembranetesting using the same closed-system apparatus connected to a rigid-wall cell, and resulted in the need to refill the syringes/actuators withsource solutions once every 24 h. Following the establishment of abaseline pressure difference across the specimen, source solutionswith different initial concentrations of the same salt, Cot and Cob, weresimultaneously injected from the syringes/actuators into the porousdisks bounding the specimen through valves 1 and 2 (see Fig. 1), withthe condition that valves 3 and 4 were closed, in order to establish aconcentration difference, −ΔC (=Cot−CobN0), across the specimen.Buildup of a pressure difference in response to −ΔC was recorded viaa personal computer (not shown) equipped with a data acquisition
Fig. 5. Boundary pressures and effective stresses in specime
system (Labview software and Omega Model 100A DAQ Board), asdescribed by Malusis et al. (2001b). The electrolyte solutions fromeach of the two syringes/actuators were expelled after completedisplacement of the syringe/actuator, which is a function of thedisplacement rate of the plunger for the syringe/actuator and thevolume of the liquid in the syringe/actuator (Malusis et al., 2001b).
After complete displacement of the syringe in the actuator, thespecimen was isolated by closing valves 1 and 2, valves 3 and 4 wereopened, and the direction of the syringe was reversed to allowsampling and refilling via the sampling and refilling reservoirs (seeFig. 1). The rate of displacement for sampling and refilling wassignificantly faster than that used during injection, such that refillingand sampling required only a fraction of the time (usually ≤2 min)required for displacement during circulation (i.e., ~24 h). The elec-trical conductivity (EC) of individual samples recovered from thesampling reservoirs was measured as an indication of the boundaryconditions (e.g., see Shackelford and Lee, 2003), and to provide anestimate via calibration of the salt (KCl) concentrations in the
n GCL1 during membrane testing in flexible-wall cell.
50 J.-B. Kang, C.D. Shackelford / Applied Clay Science 44 (2009) 43–58
circulation outflows from the top (Ct) and bottom (Cb) of the specimen(see Fig. 1). The variation in the cell volume also was monitoredthrough the cell–water accumulator (CWA in Fig. 1). Upon completionof sampling and refilling, valves 3 and 4 are closed, valves 1 and 2wereopened, and the syringe was displaced at the injection rate (i.e.,4.2×10−10 m3/s) to repeat another daily cycle for measurement of themembrane efficiency.
4.4. Testing program
Duplicate multiple-stage membrane tests were conducted in thisstudy to evaluate the flexible-wall cell. Multiple-stage tests are testswhere a single specimen is subjected to progressively greater sourceconcentration differences,−ΔC (=Cot−Cob), in separate but sequentialstages, such that one membrane efficiency is measured per stage,thereby providing for a direct determination of the effect of concen-tration on the membrane efficiency of the specimen (Malusis andShackelford, 2002b). In both tests, DIW was circulated across thebottom of the specimen, such that−ΔCwas the same as Cot (i.e., Cob=
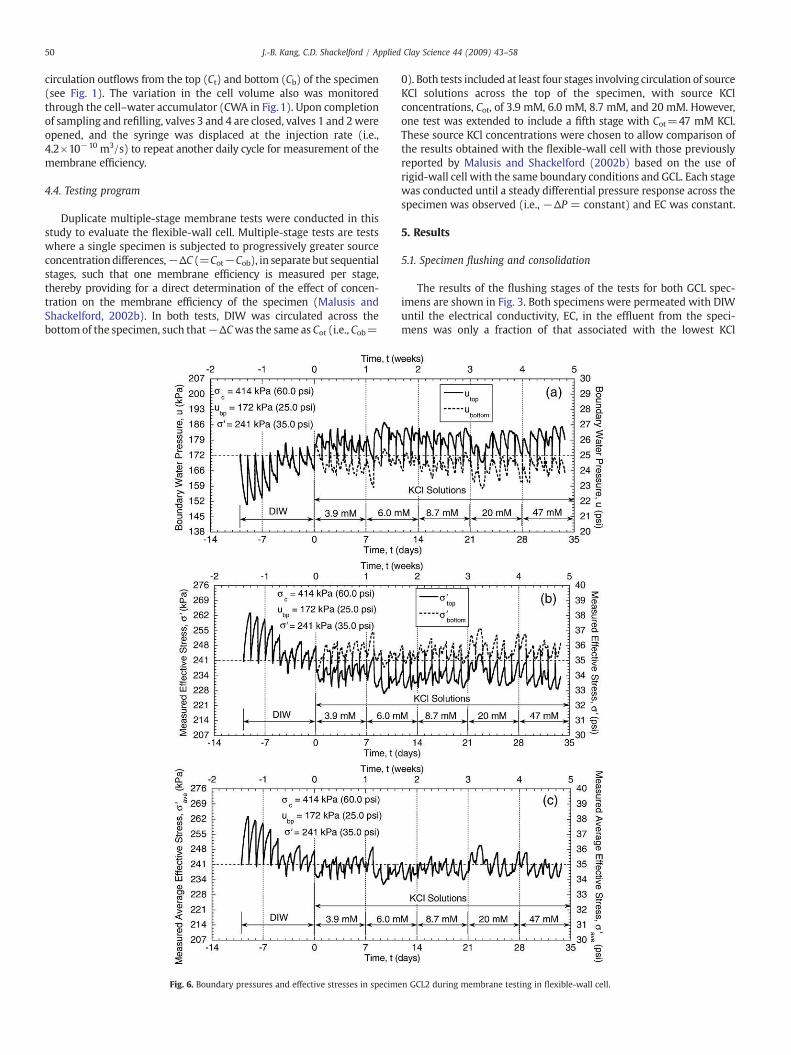
Fig. 6. Boundary pressures and effective stresses in specim
0). Both tests included at least four stages involving circulation of sourceKCl solutions across the top of the specimen, with source KClconcentrations, Cot, of 3.9 mM, 6.0 mM, 8.7 mM, and 20 mM. However,one test was extended to include a fifth stage with Cot=47 mM KCl.These source KCl concentrations were chosen to allow comparison ofthe results obtained with the flexible-wall cell with those previouslyreported by Malusis and Shackelford (2002b) based on the use ofrigid-wall cell with the same boundary conditions and GCL. Each stagewas conducted until a steady differential pressure response across thespecimen was observed (i.e., −ΔP = constant) and EC was constant.
5. Results
5.1. Specimen flushing and consolidation
The results of the flushing stages of the tests for both GCL spec-imens are shown in Fig. 3. Both specimens were permeated with DIWuntil the electrical conductivity, EC, in the effluent from the speci-mens was only a fraction of that associated with the lowest KCl
en GCL2 during membrane testing in flexible-wall cell.
51J.-B. Kang, C.D. Shackelford / Applied Clay Science 44 (2009) 43–58
concentration of 3.9 mM of the source solutions used in themembrane stage of the test. As previously mentioned, this flushingstage was employed primarily to enhance the probability thatmembrane behavior would be observed in the test specimens (e.g.,seeMalusis et al., 2001b; Malusis and Shackelford, 2002b; Shackelfordand Lee, 2003). In the case of specimen GCL1, the specimen wasflushed for 161 d resulting in an effluent EC of 30.5 mS/m, or 54.4% ofthe EC of 56.1 mS/m associated with a 3.9 mMKCl solution. In the caseof specimen GCL2, the specimen was flushed for 171 d resulting in aneffluent EC of 22.2 mS/m, or 39.6% of the EC of 56.1 mS/m associatedwith a 3.9 mM KCl solution.
The hydraulic conductivity, k, of the two GCL specimens also wasmeasured during the flushing stage. As shown in Fig. 3, despitesomewhat initial erratic behavior in the measured k values, permea-tionwith DIWat a 34.5 kPa (5.0 psi) average effective stress eventuallyresulted in measured steady-state k values for specimens GCL1 andGCL2 of 2.69×10⁻⁹ cm/s and 3.34×10⁻⁹ cm/s, respectively. Both ofthese k values are representative of those typically measured for GCLspermeated with DIW in flexible-wall permeameters and similareffective stresses (see Daniel et al., 1997).
5.1.1. Electrical conductivitiesAfter reconsolidating the specimens in the flexible-wall membrane
cell to an effective stress, σ′, of 241 kPa (35.0 psi), the drainage lines(valves 3 and 4 in Fig. 1) were shut, and deionized water (DIW) wascirculated through both the top and bottom porous disks to mark thebeginning of the membrane testing stage. Following establishment ofthe baseline pressure differences resulting from circulating DIWthrough both the top and bottom of the specimen, the DIW circulatedthrough the top boundary of each specimen was replaced withelectrolyte solutions containing increasingly higher concentrations ofKCl, while maintaining circulation of DIW through the bottomboundary, to establish the concentration difference for measurement
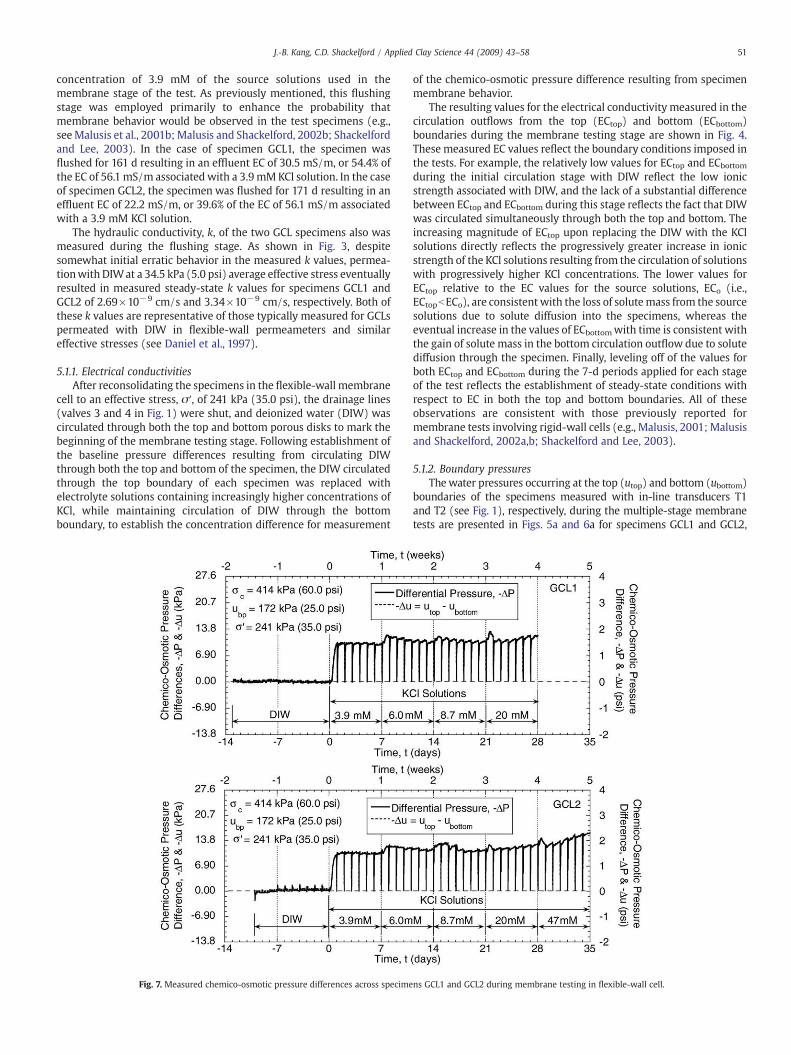
Fig. 7. Measured chemico-osmotic pressure differences across specime
of the chemico-osmotic pressure difference resulting from specimenmembrane behavior.
The resulting values for the electrical conductivity measured in thecirculation outflows from the top (ECtop) and bottom (ECbottom)boundaries during the membrane testing stage are shown in Fig. 4.These measured EC values reflect the boundary conditions imposed inthe tests. For example, the relatively low values for ECtop and ECbottomduring the initial circulation stage with DIW reflect the low ionicstrength associated with DIW, and the lack of a substantial differencebetween ECtop and ECbottom during this stage reflects the fact that DIWwas circulated simultaneously through both the top and bottom. Theincreasing magnitude of ECtop upon replacing the DIW with the KClsolutions directly reflects the progressively greater increase in ionicstrength of the KCl solutions resulting from the circulation of solutionswith progressively higher KCl concentrations. The lower values forECtop relative to the EC values for the source solutions, ECo (i.e.,ECtopbECo), are consistent with the loss of solutemass from the sourcesolutions due to solute diffusion into the specimens, whereas theeventual increase in the values of ECbottomwith time is consistent withthe gain of solute mass in the bottom circulation outflow due to solutediffusion through the specimen. Finally, leveling off of the values forboth ECtop and ECbottom during the 7-d periods applied for each stageof the test reflects the establishment of steady-state conditions withrespect to EC in both the top and bottom boundaries. All of theseobservations are consistent with those previously reported formembrane tests involving rigid-wall cells (e.g., Malusis, 2001; Malusisand Shackelford, 2002a,b; Shackelford and Lee, 2003).
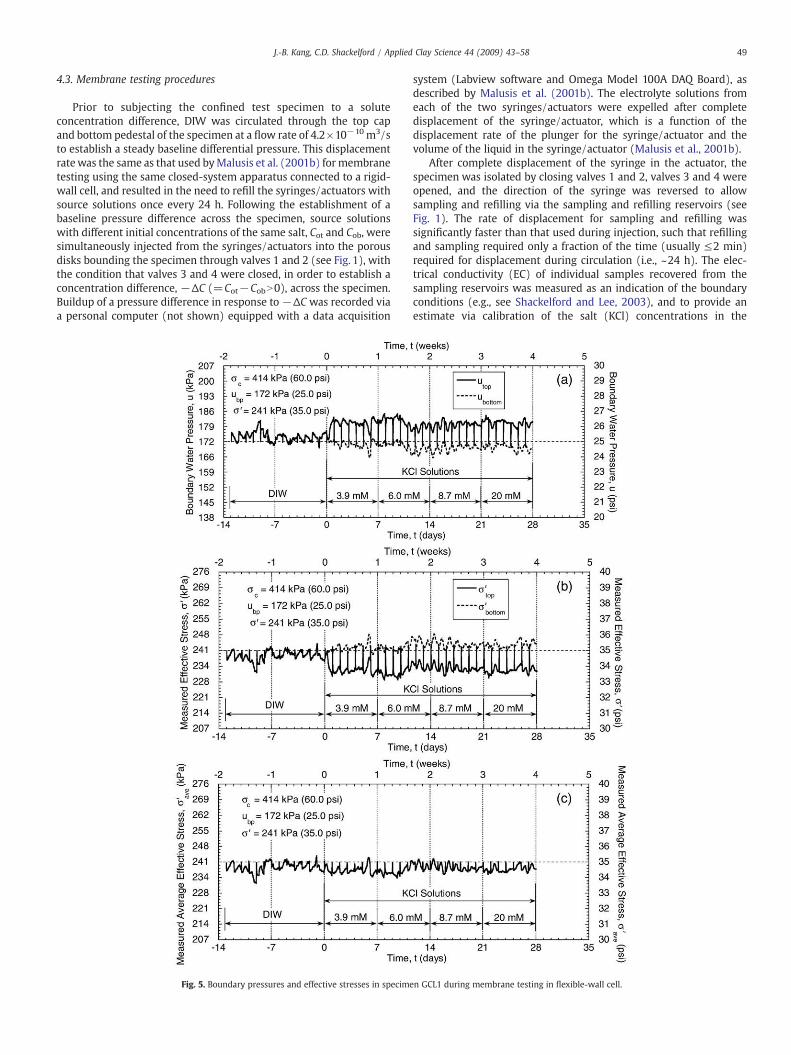
5.1.2. Boundary pressuresThewater pressures occurring at the top (utop) and bottom (ubottom)
boundaries of the specimens measured with in-line transducers T1and T2 (see Fig. 1), respectively, during the multiple-stage membranetests are presented in Figs. 5a and 6a for specimens GCL1 and GCL2,
ns GCL1 and GCL2 during membrane testing in flexible-wall cell.
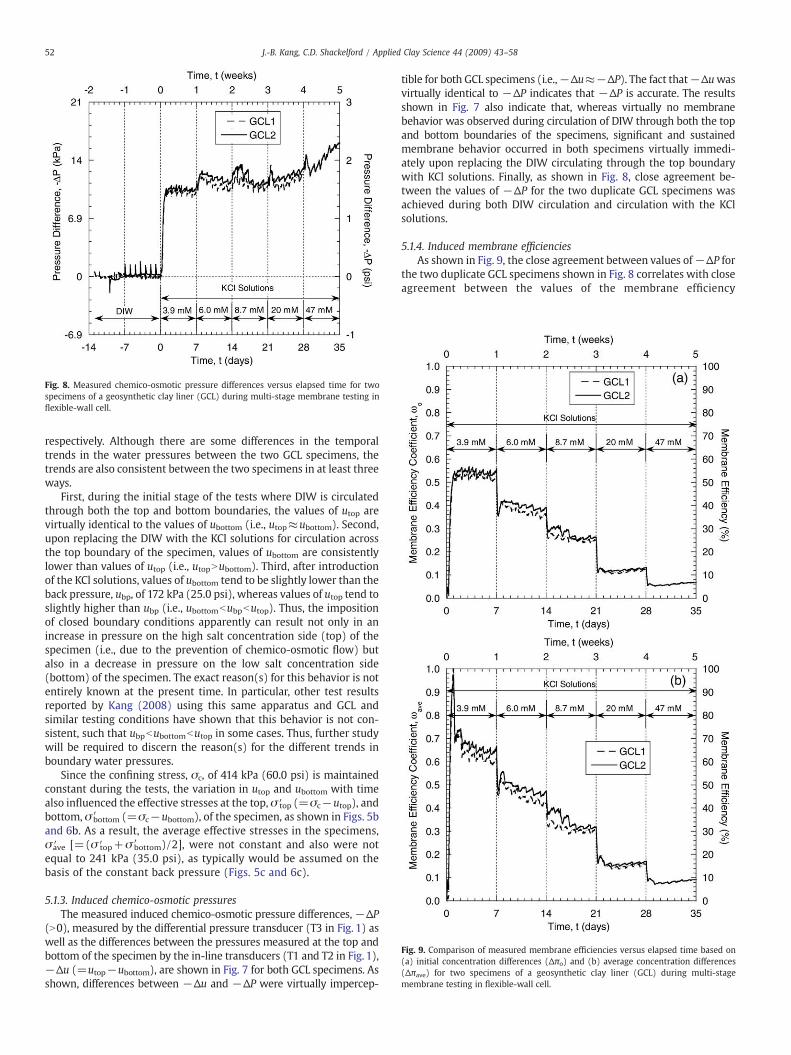
Fig. 9. Comparison of measured membrane efficiencies versus elapsed time based on(a) initial concentration differences (Δπo) and (b) average concentration differences(Δπave) for two specimens of a geosynthetic clay liner (GCL) during multi-stagemembrane testing in flexible-wall cell.
Fig. 8. Measured chemico-osmotic pressure differences versus elapsed time for twospecimens of a geosynthetic clay liner (GCL) during multi-stage membrane testing inflexible-wall cell.
52 J.-B. Kang, C.D. Shackelford / Applied Clay Science 44 (2009) 43–58
respectively. Although there are some differences in the temporaltrends in the water pressures between the two GCL specimens, thetrends are also consistent between the two specimens in at least threeways.
First, during the initial stage of the tests where DIW is circulatedthrough both the top and bottom boundaries, the values of utop arevirtually identical to the values of ubottom (i.e., utop≈ubottom). Second,upon replacing the DIW with the KCl solutions for circulation acrossthe top boundary of the specimen, values of ubottom are consistentlylower than values of utop (i.e., utopNubottom). Third, after introductionof the KCl solutions, values of ubottom tend to be slightly lower than theback pressure, ubp, of 172 kPa (25.0 psi), whereas values of utop tend toslightly higher than ubp (i.e., ubottombubpbutop). Thus, the impositionof closed boundary conditions apparently can result not only in anincrease in pressure on the high salt concentration side (top) of thespecimen (i.e., due to the prevention of chemico-osmotic flow) butalso in a decrease in pressure on the low salt concentration side(bottom) of the specimen. The exact reason(s) for this behavior is notentirely known at the present time. In particular, other test resultsreported by Kang (2008) using this same apparatus and GCL andsimilar testing conditions have shown that this behavior is not con-sistent, such that ubpbubottombutop in some cases. Thus, further studywill be required to discern the reason(s) for the different trends inboundary water pressures.
Since the confining stress, σc, of 414 kPa (60.0 psi) is maintainedconstant during the tests, the variation in utop and ubottom with timealso influenced the effective stresses at the top, σ ′top (=σc−utop), andbottom, σ ′bottom (=σc−ubottom), of the specimen, as shown in Figs. 5band 6b. As a result, the average effective stresses in the specimens,σ ′ave [=(σ ′top+σ ′bottom)/2], were not constant and also were notequal to 241 kPa (35.0 psi), as typically would be assumed on thebasis of the constant back pressure (Figs. 5c and 6c).
5.1.3. Induced chemico-osmotic pressuresThe measured induced chemico-osmotic pressure differences, −ΔP
(N0), measured by the differential pressure transducer (T3 in Fig. 1) aswell as the differences between the pressures measured at the top andbottom of the specimen by the in-line transducers (T1 and T2 in Fig. 1),−Δu (=utop−ubottom), are shown in Fig. 7 for both GCL specimens. Asshown, differences between −Δu and −ΔP were virtually impercep-
tible for both GCL specimens (i.e.,−Δu≈−ΔP). The fact that−Δuwasvirtually identical to −ΔP indicates that −ΔP is accurate. The resultsshown in Fig. 7 also indicate that, whereas virtually no membranebehavior was observed during circulation of DIW through both the topand bottom boundaries of the specimens, significant and sustainedmembrane behavior occurred in both specimens virtually immedi-ately upon replacing the DIW circulating through the top boundarywith KCl solutions. Finally, as shown in Fig. 8, close agreement be-tween the values of −ΔP for the two duplicate GCL specimens wasachieved during both DIW circulation and circulation with the KClsolutions.
5.1.4. Induced membrane efficienciesAs shown in Fig. 9, the close agreement between values of−ΔP for
the two duplicate GCL specimens shown in Fig. 8 correlates with closeagreement between the values of the membrane efficiency
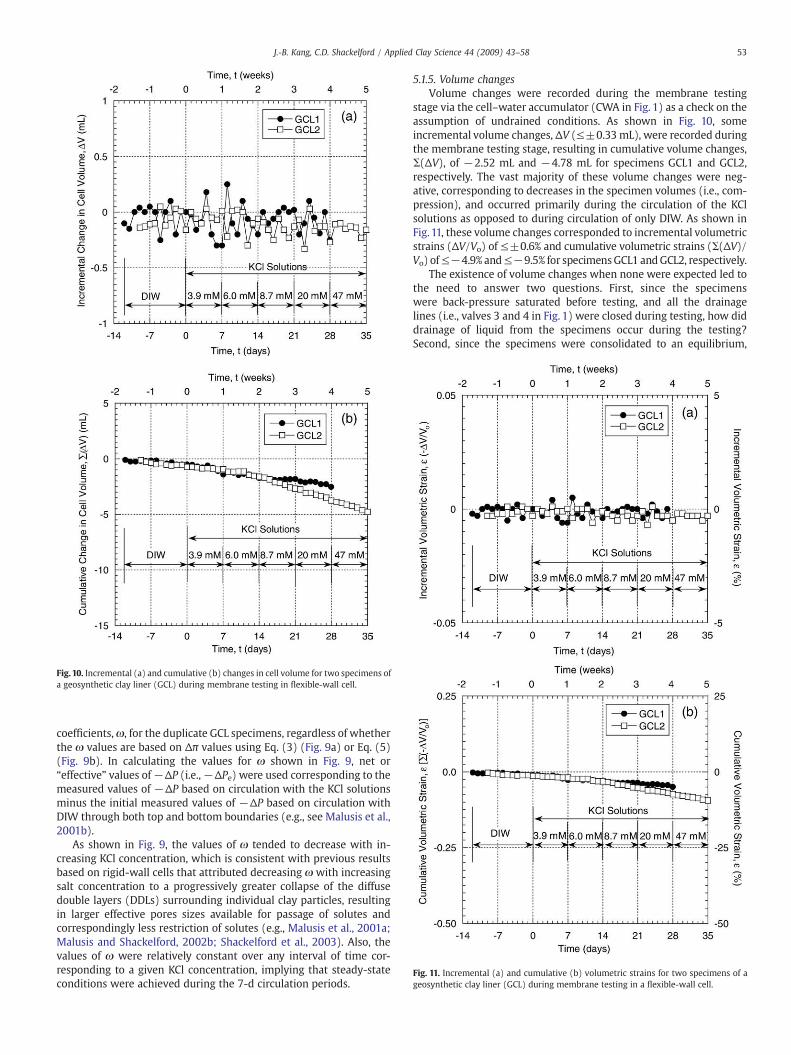
Fig. 11. Incremental (a) and cumulative (b) volumetric strains for two specimens of ageosynthetic clay liner (GCL) during membrane testing in a flexible-wall cell.
Fig. 10. Incremental (a) and cumulative (b) changes in cell volume for two specimens ofa geosynthetic clay liner (GCL) during membrane testing in flexible-wall cell.
53J.-B. Kang, C.D. Shackelford / Applied Clay Science 44 (2009) 43–58
coefficients,ω, for the duplicate GCL specimens, regardless of whetherthe ω values are based on Δπ values using Eq. (3) (Fig. 9a) or Eq. (5)(Fig. 9b). In calculating the values for ω shown in Fig. 9, net or“effective” values of−ΔP (i.e.,−ΔPe) were used corresponding to themeasured values of −ΔP based on circulation with the KCl solutionsminus the initial measured values of −ΔP based on circulation withDIW through both top and bottom boundaries (e.g., see Malusis et al.,2001b).
As shown in Fig. 9, the values of ω tended to decrease with in-creasing KCl concentration, which is consistent with previous resultsbased on rigid-wall cells that attributed decreasing ω with increasingsalt concentration to a progressively greater collapse of the diffusedouble layers (DDLs) surrounding individual clay particles, resultingin larger effective pores sizes available for passage of solutes andcorrespondingly less restriction of solutes (e.g., Malusis et al., 2001a;Malusis and Shackelford, 2002b; Shackelford et al., 2003). Also, thevalues of ω were relatively constant over any interval of time cor-responding to a given KCl concentration, implying that steady-stateconditions were achieved during the 7-d circulation periods.
5.1.5. Volume changesVolume changes were recorded during the membrane testing
stage via the cell–water accumulator (CWA in Fig. 1) as a check on theassumption of undrained conditions. As shown in Fig. 10, someincremental volume changes, ΔV (≤±0.33mL), were recorded duringthe membrane testing stage, resulting in cumulative volume changes,Σ(ΔV), of −2.52 mL and −4.78 mL for specimens GCL1 and GCL2,respectively. The vast majority of these volume changes were neg-ative, corresponding to decreases in the specimen volumes (i.e., com-pression), and occurred primarily during the circulation of the KClsolutions as opposed to during circulation of only DIW. As shown inFig. 11, these volume changes corresponded to incremental volumetricstrains (ΔV/Vo) of ≤±0.6% and cumulative volumetric strains (Σ(ΔV)/Vo) of≤−4.9% and≤−9.5% for specimensGCL1 andGCL2, respectively.
The existence of volume changes when none were expected led tothe need to answer two questions. First, since the specimenswere back-pressure saturated before testing, and all the drainagelines (i.e., valves 3 and 4 in Fig. 1) were closed during testing, how diddrainage of liquid from the specimens occur during the testing?Second, since the specimens were consolidated to an equilibrium,
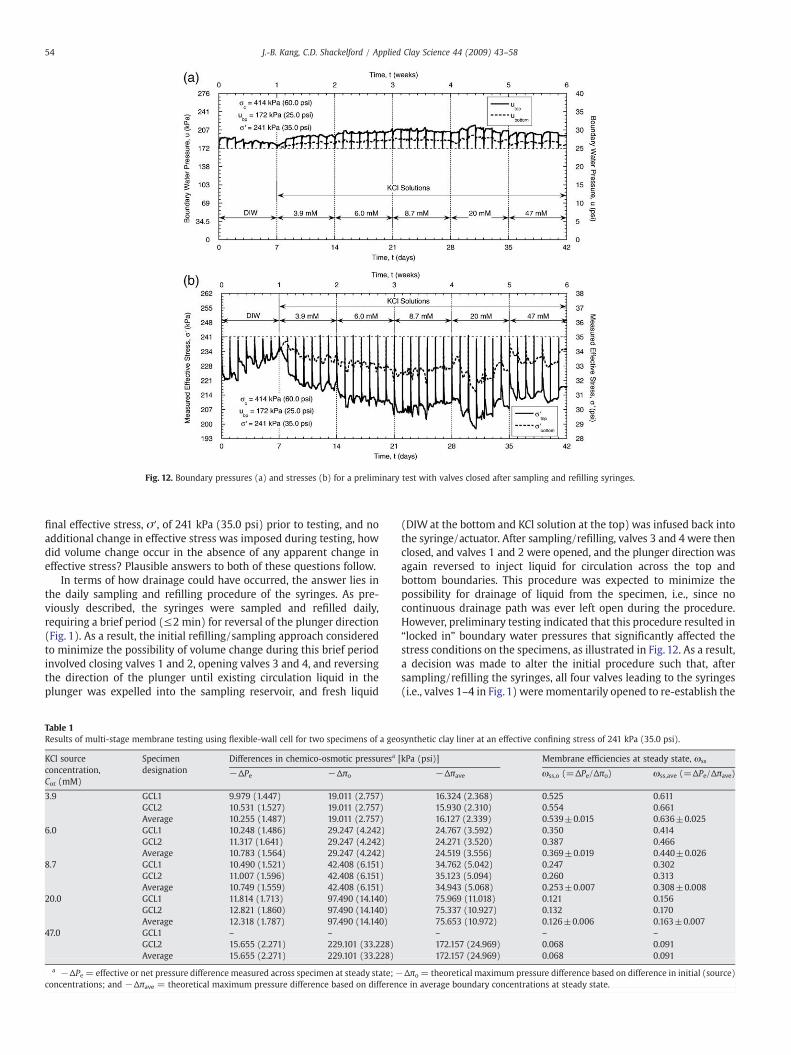
Fig. 12. Boundary pressures (a) and stresses (b) for a preliminary test with valves closed after sampling and refilling syringes.
54 J.-B. Kang, C.D. Shackelford / Applied Clay Science 44 (2009) 43–58
final effective stress, σ′, of 241 kPa (35.0 psi) prior to testing, and noadditional change in effective stress was imposed during testing, howdid volume change occur in the absence of any apparent change ineffective stress? Plausible answers to both of these questions follow.
In terms of how drainage could have occurred, the answer lies inthe daily sampling and refilling procedure of the syringes. As pre-viously described, the syringes were sampled and refilled daily,requiring a brief period (≤2 min) for reversal of the plunger direction(Fig. 1). As a result, the initial refilling/sampling approach consideredto minimize the possibility of volume change during this brief periodinvolved closing valves 1 and 2, opening valves 3 and 4, and reversingthe direction of the plunger until existing circulation liquid in theplunger was expelled into the sampling reservoir, and fresh liquid
Table 1Results of multi-stage membrane testing using flexible-wall cell for two specimens of a geo
KCl sourceconcentration,Cot (mM)
Specimendesignation
Differences in chemico-osmotic pressuresa
−ΔPe −Δπo
3.9 GCL1 9.979 (1.447) 19.011 (2.757)GCL2 10.531 (1.527) 19.011 (2.757)Average 10.255 (1.487) 19.011 (2.757)
6.0 GCL1 10.248 (1.486) 29.247 (4.242)GCL2 11.317 (1.641) 29.247 (4.242)Average 10.783 (1.564) 29.247 (4.242)
8.7 GCL1 10.490 (1.521) 42.408 (6.151)GCL2 11.007 (1.596) 42.408 (6.151)Average 10.749 (1.559) 42.408 (6.151)
20.0 GCL1 11.814 (1.713) 97.490 (14.140)GCL2 12.821 (1.860) 97.490 (14.140)Average 12.318 (1.787) 97.490 (14.140)
47.0 GCL1 – –
GCL2 15.655 (2.271) 229.101 (33.228)Average 15.655 (2.271) 229.101 (33.228)
a −ΔPe = effective or net pressure difference measured across specimen at steady state;−concentrations; and −Δπave = theoretical maximum pressure difference based on differen
(DIW at the bottom and KCl solution at the top) was infused back intothe syringe/actuator. After sampling/refilling, valves 3 and 4 were thenclosed, and valves 1 and 2 were opened, and the plunger direction wasagain reversed to inject liquid for circulation across the top andbottom boundaries. This procedure was expected to minimize thepossibility for drainage of liquid from the specimen, i.e., since nocontinuous drainage path was ever left open during the procedure.However, preliminary testing indicated that this procedure resulted in“locked in” boundary water pressures that significantly affected thestress conditions on the specimens, as illustrated in Fig. 12. As a result,a decision was made to alter the initial procedure such that, aftersampling/refilling the syringes, all four valves leading to the syringes(i.e., valves 1–4 in Fig. 1) were momentarily opened to re-establish the
synthetic clay liner at an effective confining stress of 241 kPa (35.0 psi).
[kPa (psi)] Membrane efficiencies at steady state, ωss
−Δπave ωss,o (=ΔPe/Δπo) ωss,ave (=ΔPe/Δπave)
16.324 (2.368) 0.525 0.61115.930 (2.310) 0.554 0.66116.127 (2.339) 0.539±0.015 0.636±0.02524.767 (3.592) 0.350 0.41424.271 (3.520) 0.387 0.46624.519 (3.556) 0.369±0.019 0.440±0.02634.762 (5.042) 0.247 0.30235.123 (5.094) 0.260 0.31334.943 (5.068) 0.253±0.007 0.308±0.00875.969 (11.018) 0.121 0.15675.337 (10.927) 0.132 0.17075.653 (10.972) 0.126±0.006 0.163±0.007– – –
172.157 (24.969) 0.068 0.091172.157 (24.969) 0.068 0.091
Δπo = theoretical maximum pressure difference based on difference in initial (source)ce in average boundary concentrations at steady state.
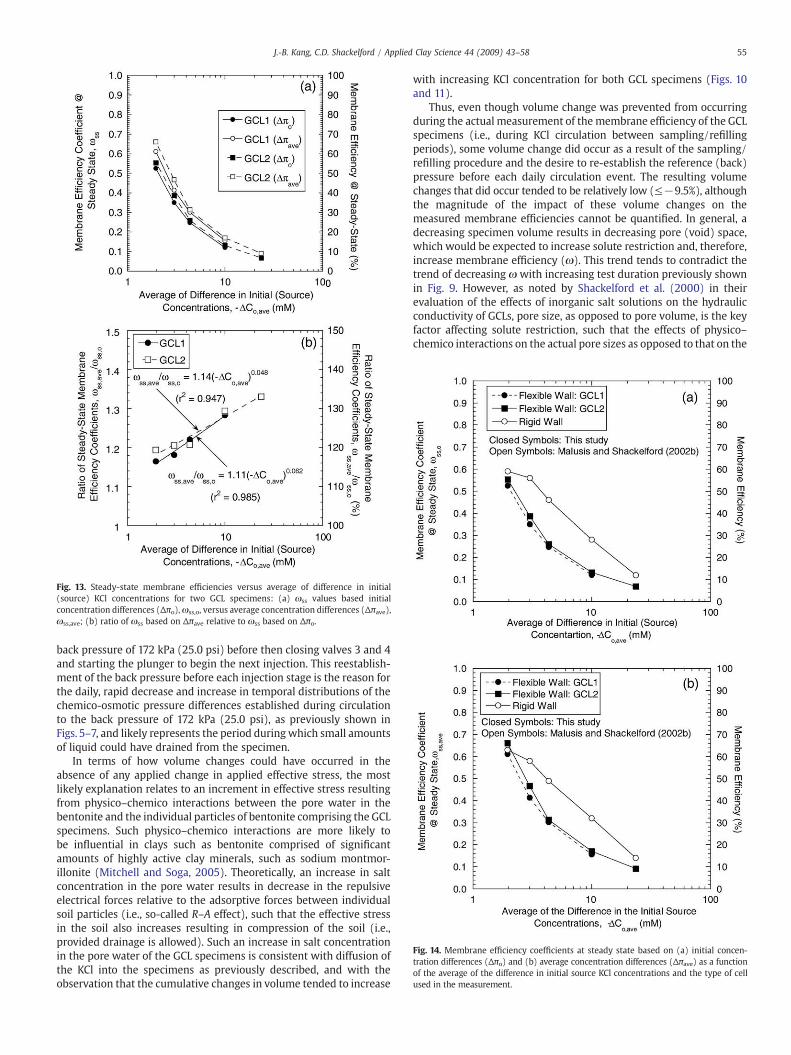
Fig. 13. Steady-state membrane efficiencies versus average of difference in initial(source) KCl concentrations for two GCL specimens: (a) ωss values based initialconcentration differences (Δπo),ωss,o, versus average concentration differences (Δπave),ωss,ave; (b) ratio of ωss based on Δπave relative to ωss based on Δπo.
Fig. 14. Membrane efficiency coefficients at steady state based on (a) initial concen-tration differences (Δπo) and (b) average concentration differences (Δπave) as a functionof the average of the difference in initial source KCl concentrations and the type of cellused in the measurement.
55J.-B. Kang, C.D. Shackelford / Applied Clay Science 44 (2009) 43–58
back pressure of 172 kPa (25.0 psi) before then closing valves 3 and 4and starting the plunger to begin the next injection. This reestablish-ment of the back pressure before each injection stage is the reason forthe daily, rapid decrease and increase in temporal distributions of thechemico-osmotic pressure differences established during circulationto the back pressure of 172 kPa (25.0 psi), as previously shown inFigs. 5–7, and likely represents the period during which small amountsof liquid could have drained from the specimen.
In terms of how volume changes could have occurred in theabsence of any applied change in applied effective stress, the mostlikely explanation relates to an increment in effective stress resultingfrom physico–chemico interactions between the pore water in thebentonite and the individual particles of bentonite comprising the GCLspecimens. Such physico–chemico interactions are more likely tobe influential in clays such as bentonite comprised of significantamounts of highly active clay minerals, such as sodium montmor-illonite (Mitchell and Soga, 2005). Theoretically, an increase in saltconcentration in the pore water results in decrease in the repulsiveelectrical forces relative to the adsorptive forces between individualsoil particles (i.e., so-called R–A effect), such that the effective stressin the soil also increases resulting in compression of the soil (i.e.,provided drainage is allowed). Such an increase in salt concentrationin the pore water of the GCL specimens is consistent with diffusion ofthe KCl into the specimens as previously described, and with theobservation that the cumulative changes in volume tended to increase
with increasing KCl concentration for both GCL specimens (Figs. 10and 11).
Thus, even though volume change was prevented from occurringduring the actual measurement of the membrane efficiency of the GCLspecimens (i.e., during KCl circulation between sampling/refillingperiods), some volume change did occur as a result of the sampling/refilling procedure and the desire to re-establish the reference (back)pressure before each daily circulation event. The resulting volumechanges that did occur tended to be relatively low (≤−9.5%), althoughthe magnitude of the impact of these volume changes on themeasured membrane efficiencies cannot be quantified. In general, adecreasing specimen volume results in decreasing pore (void) space,which would be expected to increase solute restriction and, therefore,increase membrane efficiency (ω). This trend tends to contradict thetrend of decreasing ω with increasing test duration previously shownin Fig. 9. However, as noted by Shackelford et al. (2000) in theirevaluation of the effects of inorganic salt solutions on the hydraulicconductivity of GCLs, pore size, as opposed to pore volume, is the keyfactor affecting solute restriction, such that the effects of physico–chemico interactions on the actual pore sizes as opposed to that on the
56 J.-B. Kang, C.D. Shackelford / Applied Clay Science 44 (2009) 43–58
overall specimen void (pore) volume likely dominated the membraneefficiencies of the GCL specimens.
6. Discussion
The final, or steady-state, values of ω for each KCl concentration,ωss, alongwith the values of−ΔPe,−Δπo, and−Δπave used to calculateωss, are summarized in Table 1. The resulting values of ωss are plottedas a function of the average difference in the initial KCl concentrations,or −ΔCo,ave [=−ΔCo/2=(Cot−Cob)/2=Cot/2], in Fig. 13a.
As expected, values of ωss based on −Δπo, or ωss,o, are moreconservative (lower) than values of ωss based on−Δπave, orωss,ave, i.e.,since−ΔπoN−Δπave. In fact, as shown in Fig. 13b, values ofωss,ave/ωss,o
increased virtually semi-log linearlywith−ΔCo,ave. For example,ωss,ave/ωss,o increased from 1.16 to 1.28 as−ΔCo,ave increased from 1.95 mM to10 mM, respectively, for specimen GCL1, whereasωss,ave/ωss,o increasedfrom 1.19 to 1.33 as −ΔCo,ave increased from 1.95 mM to 23.5 mM,respectively, for specimen GCL2.
Values of ωss measured in this study using the flexible-wall cellunder closed-system boundary conditions are compared in Fig. 14with values of ωss previously reported by Malusis and Shackelford
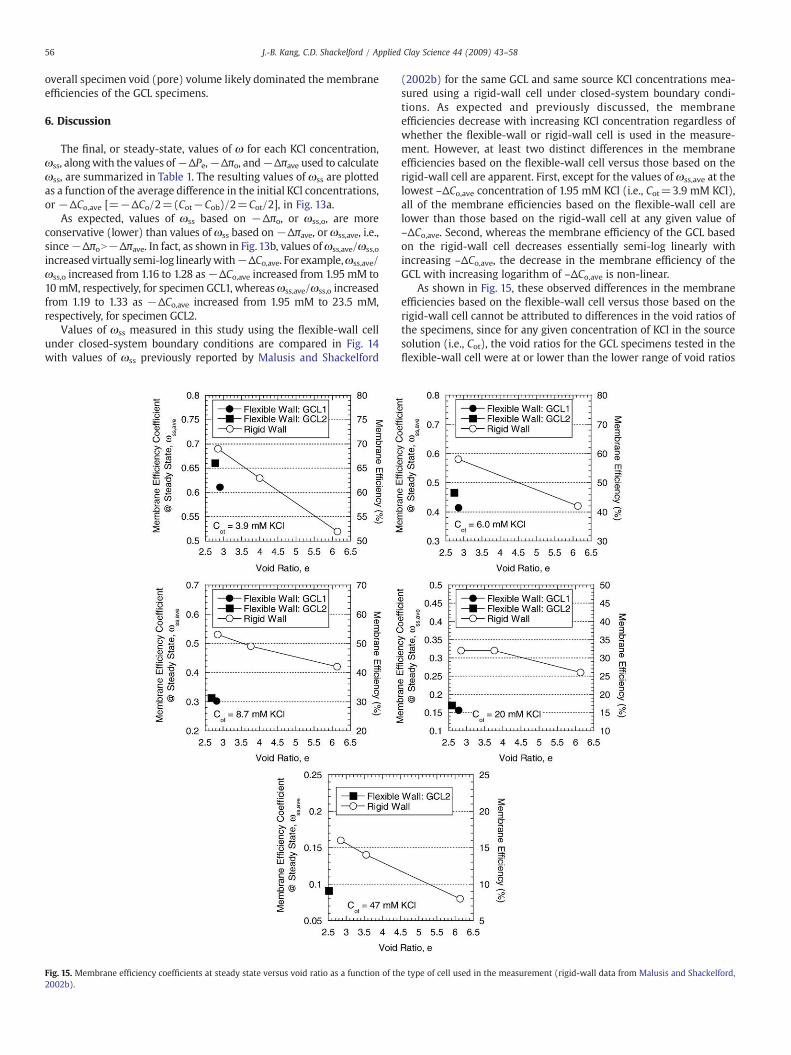
Fig. 15. Membrane efficiency coefficients at steady state versus void ratio as a function of th2002b).
(2002b) for the same GCL and same source KCl concentrations mea-sured using a rigid-wall cell under closed-system boundary condi-tions. As expected and previously discussed, the membraneefficiencies decrease with increasing KCl concentration regardless ofwhether the flexible-wall or rigid-wall cell is used in the measure-ment. However, at least two distinct differences in the membraneefficiencies based on the flexible-wall cell versus those based on therigid-wall cell are apparent. First, except for the values of ωss,ave at thelowest –ΔCo,ave concentration of 1.95 mM KCl (i.e., Cot=3.9 mM KCl),all of the membrane efficiencies based on the flexible-wall cell arelower than those based on the rigid-wall cell at any given value of–ΔCo,ave. Second, whereas the membrane efficiency of the GCL basedon the rigid-wall cell decreases essentially semi-log linearly withincreasing –ΔCo,ave, the decrease in the membrane efficiency of theGCL with increasing logarithm of –ΔCo,ave is non-linear.
As shown in Fig. 15, these observed differences in the membraneefficiencies based on the flexible-wall cell versus those based on therigid-wall cell cannot be attributed to differences in the void ratios ofthe specimens, since for any given concentration of KCl in the sourcesolution (i.e., Cot), the void ratios for the GCL specimens tested in theflexible-wall cell were at or lower than the lower range of void ratios
e type of cell used in the measurement (rigid-wall data from Malusis and Shackelford,
57J.-B. Kang, C.D. Shackelford / Applied Clay Science 44 (2009) 43–58
for the sameGCL tested in the rigid-wall cell. Other possible reasons forthe difference between the membrane efficiencies of the GCLmeasured in this study using the flexible-wall cell relative to thosemeasured previouslyusing rigid-wall cell include the differences in thestress conditions induced in the specimens in the two types of cells, aswell as the differences in the specimen preparation procedures. Withrespect to specimenpreparation procedures, the GCL specimens testedusing the rigid-wall cell were flushed, compressed, and tested formembrane behavior entirely within the same rigid-wall cell, whereasthe GCL specimens tested in this studywere flushed, consolidated, andtested for membrane behavior in three different flexible-wall cells. Inany event, further evaluation will be required before more conclusivestatements can be made on the causes for the noted differences in themembrane efficiencies measured in the two different types of cells.Nonetheless, the membrane efficiencies of duplicate specimens of aGCL measured with the flexible-wall cell under closed-systemconditions evaluated in this study were both reproducible and similarto, albeit somewhat less than, those measured previously with a rigid-wall cell for the same GCL and boundary conditions.
7. Summary and conclusions
The development of a flexible-wall testing apparatus consisting of aflexible-wall cell and a hydraulic control system that imposes closed-system boundary conditions for measurement of the membranebehavior of clay soils was described. The advantages of a flexible-wallcell include complete control over the state of stress existing within thetest specimen and the ability to back-pressure saturate and consolidatethe specimen prior to membrane testing. Use of the developed flexible-wall cell was illustrated via tests conducted to measure the membranebehavior of a geosynthetic clay liner (GCL). The GCL specimens wereconsolidated to a final effective stress, σ′, of 241 kPa (35.0 psi) prior tothe start of membrane testing. Membrane testing consisted of multi-stage tests, whereby de-ionized water (DIW) was first circulated acrossboth the bottom and the top of the specimens to establish a baselinepressure difference,−ΔP (N0), of the specimen, followedbycirculation ofsource KCl solutions across the top of the specimen (while maintainingDIW circulation across the bottom of the specimen) with sequentiallyhigher source concentrations, Cot, of KCl to establish the salt concentra-tion differences,−ΔC (=Cot), required to evaluate the potential formembrane behavior.
The results indicated that the GCL behaved as a semipermeablemembrane, with measured membrane efficiencies at steady state,ωss,based on the difference in initial (source) concentrations, ωss,o,ranging from 0.068 (one specimen) at Cot of 47 mM KCl to 0.539±0.015 (two specimens) at Cot of 3.9 mM KCl, and ωss values based onthe average of the difference in boundary concentrations, ωss,ave,ranging from 0.091 (one specimen) at Cot of 47 mM KCl to 0.636±0.025 (two specimens) at Cot of 3.9 mM KCl. Also, bothωss,o andωss,ave
decreased with increasing Cot, which is consistent with previousfindings based on the use of a rigid-wall cell and attributable toprogressively greater collapse of the electrostatic diffuse double layerssurrounding individual clay particles with increasing salt concentra-tion in the pore water. Finally, ωss,ave was always greater than ωss,o,with values for the ratio of ωss,ave to ωss,o, or ωss,ave/ωss,o, increasingwith increasing average difference in the initial KCl concentrations, or−ΔCo,ave [=Cot/2]. For example, ωss,ave/ωss,o for specimen GCL1in-creased from 1.16 to 1.28 as −ΔCo,ave increased from 1.95 mM to10 mM, respectively, whereas ωss,ave/ωss,o for specimen GCL2 in-creased from 1.19 to 1.33 as −ΔCo,ave increased from 1.95 mM to23.5 mM, respectively.
Although the membrane efficiencies of the GCL specimens weremeasured under closed (no-flow) conditions, some volume changeswere recorded during the tests. These volume changes resulted incumulative volumetric strains of ≤−4.9% and ≤−9.5% for specimensGCL1 and GCL2, respectively, and were attributed to drainage that
occurred during the brief (≤2 min), daily sampling and refillingprocedures for the syringes as opposed to during the circulationperiods for measurement of membrane behavior, which lasted ~24 h.
Values of ωss measured in this study using the flexible-wall cellunder closed-systemboundary conditionswere comparedwith valuesof ωss for the same GCL previously measured using a rigid-wall cellunder the same closed-system boundary conditions. As expected, themembrane efficiencies decrease with increasing KCl concentrationregardless of whether the flexible-wall or rigid-wall cell was usedin the measurement. Except for the values of ωss,ave at the lowest−ΔCo,ave concentration of 1.95 mM KCl (i.e., Cot=3.9 mM KCl), all of themembrane efficiencies based on the flexible-wall cell were lower thanthose based on the rigid-wall cell at any given value of −ΔCo,ave. Also,whereas the membrane efficiency of the GCL based on the rigid-wallcell decreased essentially semi-log linearly with increasing –ΔCo,ave,the decrease in the membrane efficiency of the GCL with increasinglogarithm of –ΔCo,ave was non linear in the case of the flexible-wallcell. These differences in measured membrane efficiencies based onthe flexible-wall cell versus the rigid wall cell can be attributed, inpart, to the difference in the stress conditions induced in thespecimens in the two types of cells, as well as the difference inspecimen preparation procedures. Despite these differences, themembrane efficiencies measured with the flexible-wall cell evaluatedin this study were both reproducible and similar to, albeit somewhatless than, those measured previously with a rigid-wall cell.
Acknowledgments
Financial support for this study was provided by the U. S. NationalScience Foundation (NSF), Arlington, VA, under grants CMS-0099430entitled, “Membrane Behavior of Clay Soil Barrier Materials” and CMS-0624104 entitled, “Enhanced Clay Membrane Barriers for SustainableWaste Containment.” The opinions expressed in this paper are solelythose of the writers and are not necessarily consistent with the po-licies or opinions of the NSF. The authors also express appreciation toDr. Jae-Myung Lee of the California Department of Transportation forhis assistance in the early stages of the development of the flexible-wall testing apparatus.
References
Cey, B.D., Barbour, S.L., Hendry, M.J., 2001. Osmotic flow through a Cretaceous clay insouthern Saskatchewan, Canada. Canadian Geotechnical Journal, 38 (5), 1025–1033.
Daniel, D.E., 1994. State-of-the-art: laboratory hydraulic conductivity test for saturatedsoils. Hydraulic conductivity and waste contaminant transport in soil. In: Daniel,D.E., Trautwein, S.J. (Eds.), ASTM STP 1142. ASTM, West Conshohoken, PA, pp. 30–78.
Daniel, D.E., Anderson, D.C., Boynton, S.S., 1985. Fixed-wall versus flexible-wallpermeameters. In: Johnson, A.I., Frobel, R.K., Cavalli, N.J., Pettersson, C.B. (Eds.),Hydraulic Barriers in Soil and Rock. ASTM STP 874. ASTM, West Conshohoken, PA,pp. 107–126.
Daniel, D.E., Bowders, J.J., Gilbert, R.B., 1997. Laboratory hydraulic conductivity testing ofGCLs in flexible-wall permeameters. Testing and acceptance criteria for geosyn-thetic clay liners. In: Well, L. (Ed.), ASTM STP 1308. ASTM, West Conshohocken, PA,pp. 208–226.
Derrington, D., Hart, M., Whitworth, T.M., 2006. Low head sodium phosphate andnitrate hyperfiltration through thin kaolinite and smectite layers—application toengineered systems. Applied Clay Science 33 (1), 52–58.
Elrick, D.E., Smiles, D.E., Baumgartner, N., Groenevelt, P.H.,1976. Coupling phenomena insaturated homo-ionic montmorillonite: I. Experimental. Soil Science Society ofAmerica Journal 40 (4), 490–491.
Evans, J.C., Shackelford, C.D., Yeo, S.-S., Henning, J., 2008. Membrane behavior of soil–bentonite slurry-trench cutoff walls. Soil and Sediment Contamination 17 (4),316–322.
Fritz, S.J., 1986. Ideality of clay membranes in osmotic process: a review. Clays and ClayMinerals 34 (2), 214–223.
Fritz, S.J., Marine, I.W., 1983. Experimental support for a predictive osmotic model ofclay membranes. Geochimica et Cosmochimica Acta 47 (8), 1515–1522.
Greenberg, J.A., Mitchell, J.K., Witherspoon, P.A., 1973. Coupled salt and water flows in agroundwater basin. Journal of Geophysical Research 78 (27), 6341–6353.
Groenevelt, P.H., Elrick, D.E., 1976. Coupling phenomena in saturated homo-ionicmontmorillonite: II.Theoretical. Soil ScienceSocietyofAmerica Journal40(6), 820–823.
Hanshaw, B.B., 1972. Natural-membrane phenomena and subsurface waste emplace-ment. The American Association of Petroleum Geologists 18 (6), 308–317.
58 J.-B. Kang, C.D. Shackelford / Applied Clay Science 44 (2009) 43–58
Hanshaw, B.B., Coplen, T.B., 1973. Ultrafiltration by a compacted clay membrane—II.Sodium ion exclusion at various ionic strengths. Geochimica et Cosmochimica Acta37 (10), 2311–2327.
Hart, M., Whitworth, T.M., 2005. Hyperfiltration of potassium nitrate through claymembranes under relatively low-head conditions. Geochimica et CosmochimicaActa 69 (2), 4817–4823.
Heister, K., Keijzer, Th.J.S., Loch, J.P.G., 2004. Stability of clay membranes in chemicalosmosis. Soil Science Society of America Journal 169 (9), 632–639.
Heister, K., Kleingeld, P.J., Keijzer, Th.J.S., Loch, J.P.G., 2005. A new laboratory set-up formeasurements of electrical, hydraulic, and osmotic fluxes in clays. EngineeringGeology 77 (3–4), 295–303.
Henning, J.T., Evans, J.C., Shackelford, C.D., 2006. Membrane behavior of two backfillsfrom field-constructed soil–bentonite cutoff walls. Journal of Geotechnical andGeoenvironmental Engineering 132 (10), 1243–1249.
Ishiguro, M., Matsuura, T., Detellier, C., 1995. Reverse osmosis separation for amontmorillonite membrane. Journal of Membrane Science 107 (1), 87–92.
Kang, J.B. 2008. Membrane Behavior of Clay Liner Materials. PhD Dissertation, ColoradoState University, Fort Collins, Colorado, USA.
Katchalsky, A., Curran, P.F., 1965. Nonequilibrium Thermodynamics in Biophysics.Harvard University Press, Cambridge, Massachusetts. 248 pp.
Keijzer, Th.J.S., Kleingeld, P.J., Loch, J.P.G. 1997. Chemical osmosis in compacted clayeymaterial and the prediction of water transport. Geoenvironmental Engineering,Contaminated Ground: Fate of Pollutants and Remediation, Yong, R.N., andThomas,H.R. (Eds.),UniversityofWales, Cardiff, U. K., Sept. 6–12, ThomasTelford Publ.,London, 199–204.
Keijzer, Th.J.S., Kleingeld, P.J., Loch, J.P.G., 1999. Chemical osmosis in compacted clayeymaterial and the prediction of water transport. Engineering Geology 53 (2),151–159.
Keijzer, Th.J.S., Loch, J.P.G., 2001. Chemical osmosis in compacted dredging sludge. SoilScience Society of America Journal 65 (4), 1046–1055.
Kemper, W.D., 1960. Water and ion movement in thin films as influenced by theelectrostatic charge and diffuse layer of cations associated with clay mineralsurfaces. Soil Science Society of America Proceedings 24 (1), 10–16.
Kemper, W.D., 1961. Movement of water as effected by free energy and pressuregradients: II. Experimental analysis of porous systems in which free energy andpressure gradients act in opposite directions. Soil Science Society of AmericaProceedings 25 (4), 260–265.
Kemper, W.D., Evans, N.A., 1963. Movement of water as effected by free energy andpressure gradients: III. Restriction of solutes by membranes. Soil Science Society ofAmerica Proceedings 27 (5), 485–490.
Kemper, W.D., Quirk, J.P., 1972. Ion mobilities and electric charge of external claysurfaces inferred from potential differences and osmotic flow. Soil Science Societyof America Proceedings 36 (3), 426–433.
Kemper, W.D., Rollins, J.B., 1966. Osmotic efficiency coefficients across compacted clays.Soil Science Society of America Proceedings 30 (5), 529–534.
Kharaka, Y.K., Berry, F.A.F., 1973. Simultaneous flow of water and solutes throughgeological membranes—I. Experimental investigation. Geochimica et Cosmochi-mica Acta 37 (12), 2577–2603.
Kharaka, Y.K., Smalley, W.C., 1976. Flow of water and solutes through compacted clays.The American Association of Petroleum Geologists Bulletin 60 (6), 973–980.
MacKay, R.A. 1946. The control of impounding structures on ore deposition. EconomicGeology and the Bulletin of the Society of Economic Geologists, The EconomicGeology Publ. Co., New Haven, CT, Vol. 41, 13–46.
Malusis, M.A. 2001. Membrane Behavior and Coupled Solute Transport through aGeosynthetic Clay Liner. PhD Dissertation, Colorado State University, Fort Collins,Colorado, USA.
Malusis, M.A., Shackelford, C.D., 2002a. Coupling effects during steady-state solutediffusion through a semipermeable clay membrane. Environmental Science andTechnology 36 (6), 1312–1319.
Malusis, M.A., Shackelford, C.D., 2002b. Chemico-osmotic efficiency of a geosyntheticclay liner. Journal of Geotechnical and Geoenvironmental Engineering 128 (2),97–106.
Malusis, M.A., Shackelford, C.D., Olsen, H.W., 2001a. Flow and transport through claymembrane barriers. In: Young, R.N., Thomas, H.R. (Eds.), GeoenvironmentalEngineering: Geoenvironmental Impact Management. Thomas Telford Ltd., London,pp. 334–341.
Malusis, M.A., Shackelford, C.D., Olsen, H.W., 2001b. A laboratory apparatus to measurechemico-osmotic efficiency coefficients for clay soils. Geotechnical Testing Journal24 (3), 229–242.
Malusis, M.A., Shackelford, C.D., Olsen, H.W., 2003. Flow and transport through claymembrane barriers. Engineering Geology 70 (3), 235–248.
Marine, I.W., 1974. Geohydrology of a buried Triassic basin at Savannah River plant,South Carolina. The American Association of Petroleum Geologists Bulletin 58 (9),1825–1837.
Marine, I.W., Fritz, S.J., 1981. Osmotic model to explain anomalous hydraulic heads.Water Resources Research 17 (1), 73–82.
McKelvey, J.G., Milne, I.H., 1962. The flow of salt solutions through compacted clay.Proceedings, Ninth National Conference on Clays and Clay Minerals, Lafayette,Indiana, Oct. 5–8, 1960. Pergamon Press, New York, pp. 248–259.
McKelvey, J.G., Spiegler, K.S., Wyllie, M.R.J., 1957. Salt filtering by ion-exchange grainsand membranes. The Journal of Physical Chemistry 61 (2), 174–178.
Mitchell, J.K., Soga, K., 2005. Fundamentals of Soil Behavior, 3rd Ed. John Wiley andSons, Inc., Hoboken, New Jersey.
Neuzil, C.E., 1986. Groundwater flow in low-permeability environments. WaterResources Research 22 (8), 1163–1195.
Neuzil, C.E., 2000. Osmotic generation of ‘anomalous’ fluid pressures in geologicalenvironments. Nature 403 (6766), 182–184.
Olsen, H.W., 1969. Simultaneous fluxes of liquid and charge in saturated kaolinite. SoilScience Society of America Proceedings 33 (3), 338–344.
Olsen, H.W., 1972. Liquid movement through kaolinite under hydraulic, electric, andosmotic gradients. The American Association of Petroleum Geologists Bulletin56 (10), 2022–2028.
Olsen, H.W., Yearsley, E.N., Nelson, K.R., 1990. Chemico-osmosis versus diffusion-osmosis. Transportation Research Record No. 1288. Transportation Research Board,Washington D.C., pp. 15–22.
Rahman, M.M., Chen, S., Rahman, S.S., 2005. Experimental investigation of shalemembrane behavior under tri-axial condition. Petroleum Science and Technology23 (9–10), 1265–1282.
Shackelford, C.D., Benson, C.H., Katsumi, T., Edil, T.B., Lin, L., 2000. Evaluating thehydraulic conductivity of GCLs permeated with non-standard liquids. Geotextilesand Geomembranes 18 (2–4), 133–161.
Shackelford, C.D., Lee, J.-M., 2003. The destructive role of diffusion on clay membranebehavior. Clays and Clay Minerals 51 (2), 186–196.
Shackelford, C.D., Malusis, M.A., Olsen, H.W., 2003. Clay membrane behavior forgeoenvironmental containment. In: Culligan, P.J., Einstein, H.H., Whittle, A.J. (Eds.),Soil and Rock America Conference 2003, vol. 1. Verlag Glückauf GMBH, Essen,Germany, pp. 767–774.
Soler, J.M., 2001. The effect of coupled transport phenomena in the Opalinus Clay andimplications for radionuclide transport. Journal of Contaminant Hydrology 53 (1),63–84.
Whitworth, T.M., Fritz, S.J., 1994. Electrolyte-induced solute permeability effects incompacted smectite membranes. Applied Geochemistry 9 (5), 533–546.
Yeo, S.-S. 2003. Hydraulic Conductivity, Consolidation, and Membrane Behavior ofModel Backfill–SlurryMixtures for Vertical CutoffWalls. M. S. Thesis, Colorado StateUniversity, Fort Collins, Colorado, USA.
Yeo, S.-S., Shackelford, C.D., Evans, J.C., 2005. Membrane behavior of model soil–bentonite backfills. Journal of Geotechnical and Geoenvironmental Engineering131 (4), 418–429.