Embed Size (px)
Citation preview
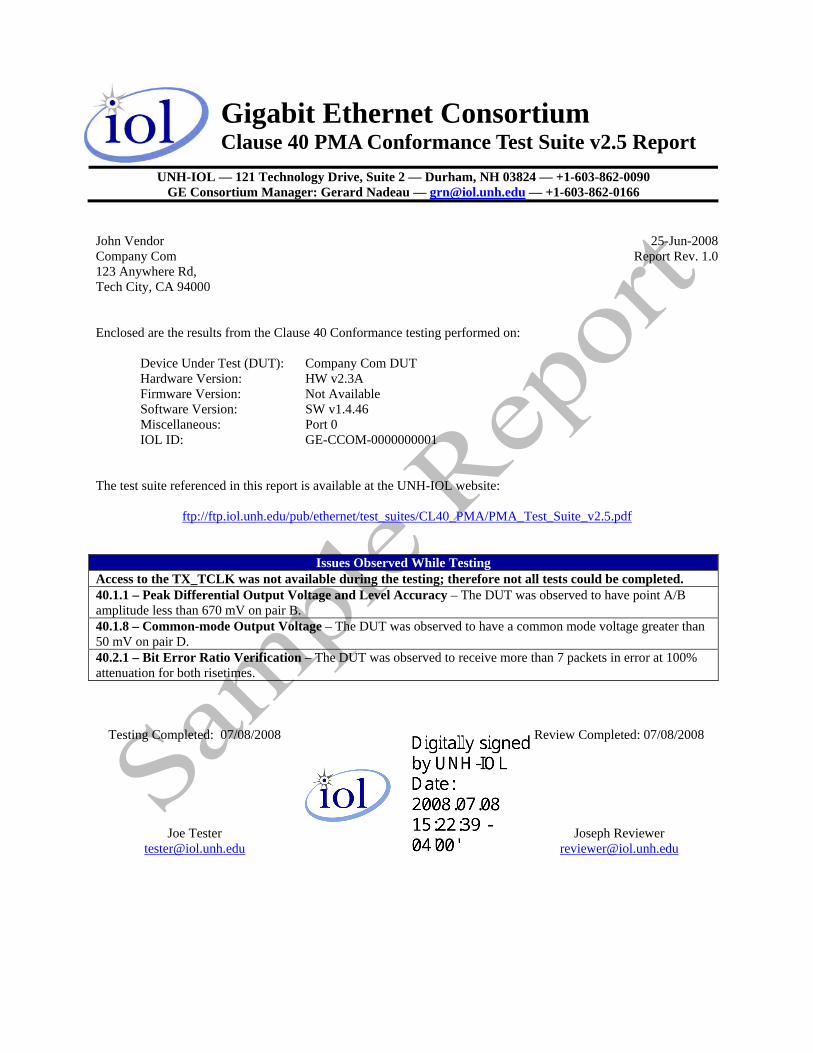
Gigabit Ethernet Consortium Clause 40 PMA Conformance Test Suite v2.5 Report
UNH-IOL — 121 Technology Drive, Suite 2 — Durham, NH 03824 — +1-603-862-0090 GE Consortium Manager: Gerard Nadeau — [email protected] — +1-603-862-0166
John Vendor 25-Jun-2008 Company Com Report Rev. 1.0 123 Anywhere Rd, Tech City, CA 94000
Enclosed are the results from the Clause 40 Conformance testing performed on:
Device Under Test (DUT): Company Com DUT Hardware Version: HW v2.3A Firmware Version: Not Available Software Version: SW v1.4.46 Miscellaneous: Port 0 IOL ID: GE-CCOM-0000000001
The test suite referenced in this report is available at the UNH-IOL website:
ftp://ftp.iol.unh.edu/pub/ethernet/test_suites/CL40_PMA/PMA_Test_Suite_v2.5.pdf
Issues Observed While Testing Access to the TX_TCLK was not available during the testing; therefore not all tests could be completed. 40.1.1 – Peak Differential Output Voltage and Level Accuracy – The DUT was observed to have point A/B amplitude less than 670 mV on pair B. 40.1.8 – Common-mode Output Voltage – The DUT was observed to have a common mode voltage greater than 50 mV on pair D. 40.2.1 – Bit Error Ratio Verification – The DUT was observed to receive more than 7 packets in error at 100% attenuation for both risetimes.
Testing Completed: 07/08/2008 Review Completed: 07/08/2008
Joe Tester Joseph Reviewer [email protected] [email protected]

Physical Medium Attachment Test Suite v2.5 Report DUT: Company Com DUT
Digital Signature Information This document was created using an Adobe digital signature. A digital signature helps to ensure the authenticity of the document, but only in this digital format. For information on how to verify this document’s integrity proceed to the following site:
http://www.iol.unh.edu/certifyDoc If the document status still indicates “Validity of author NOT confirmed”, then please contact the UNH-IOL to confirm the document’s authenticity. To further validate the certificate integrity, Adobe 6.0 should report the following fingerprint information:
MD5 Fingerprint: E0CC 6585 6D0C 9BE6 0F10 2A52 D92E BDE6 SHA-1 Fingerprint: 8BBA 64F2 AFC5 54E9 A875 AF4E C623 DCE9 EC9C EB74
Table 1 – Hardware Information
1000BASE-T PHY Manufacturer PhyMaker Model Phy2000 Version Not Available Magnetics Manufacturer MagMaker Model MAG2000 Version Not Available Test System Hardware Real-time DSO TEKTRONIX,CSA7404,Q13,CF:91.1CT FV:2.5.3 Vector Network Analyzer “HEWLETT-PACKARD,8712B,US34400165,B.03.02” Arbitrary Waveform Genearator SONY/TEK,AWG2041,0,CF:91.1CT FV:1.27 Test System Software UNH-IOL PMA Test System v3.3
Test Setup All tests in this report were performed using the test setup specified in the 1000BASE-T PMA Test Suite in the Test Setup section of each test.
UNH-IOL GE Consortium 2 Clause 40 PMA Test Report Rev. 1.0

Physical Medium Attachment Test Suite v2.5 Report DUT: Company Com DUT
GROUP 1 – PMA Electrical Specifications Table 2 – Test Requirements
Test Title Min Max Units 40.1.1 – Peak Differential Output Voltage and Level Accuracy A Magnitude of point A 670 820 mV B Magnitude of point B 670 820 mV C Difference between the magnitudes of points A and B 0 1 % D Difference between the magnitude of point C and 0.5 times
the average of the magnitudes of points A and B 0 2 %
E Difference between the magnitude of point D and 0.5 times the average of the magnitudes of points A and B
0 2 %
40.1.2 – Maximum Output Droop A Ratio of the voltage at point G to the voltage at point F 73.1 100 % B Ratio of the voltage at point J to the voltage at point H 73.1 100 % 40.1.3 – Differential Output Templates A-D The waveforms around points A, B, C, and D, after
normalization, shall lie within time domain template 1.
E-F The waveforms around points F and H, after normalization, shall lie within time domain template 2.
40.1.4 – MDI Return Loss A The return loss of the MDI shall be at least 16 dB from 1 to
40 MHz and at least 10–20 log10(f /80 MHz ) dB from 40 to 100 MHz for all differential signals incident upon the MDI from an 85 or 115 Ω source.
40.1.5 – Transmitter Timing Jitter A The Test Mode 2 Jtxout value is informative B The Test Mode 3 Jtxout value is informative C The peak-to-peak jitter on the MASTER TX_TCLK
relative to an unjittered reference 0 1.4 ns
D The peak-to-peak jitter on the MASTER TX_TCLK when passed through a 5kHz high-pass filter
0 0.3 – (Max Test Mode 2 Jtxout)
ns
E The peak-to-peak jitter on the SLAVE TX_TCLK relative to a Link Partner’s MASTER TX_TCLK
0 1.4 ns
F The peak-to-peak jitter on the SLAVE TX_TCLK relative to a Link Partner’s MASTER TX_TCLK, when passed through a 32kHz high-pass-filter plus Max Test Mode 3 Jtxout
0 0.4 + (Link Partner 5k HPF
jitter) – (Max Test Mode 3 Jtxout)
ns
G The peak-to-peak jitter on the Link Partner’s MASTER TX_TCLK, when passed through a 5kHz high-pass-filter
0 0.3 ns
40.1.6 – Transmitter Distortion A The maximum peak transmitter distortion within 60% UI 0 10 mV B The percent of UI under 10mV distortion limit 60 100 % 40.1.7 – Transmit Clock Frequency A Frequency minus 125 MHz -12.5 +12.5 kHz 40.1.8 – Common-mode Output Voltage A Peak-to-peak Common-mode Output Voltage 0 50 mV
UNH-IOL GE Consortium 3 Clause 40 PMA Test Report Rev. 1.0

Physical Medium Attachment Test Suite v2.5 Report DUT: Company Com DUT
Table 3 – Summary of results
Test Parameter Min Max BI_DA BI_DB BI_DC BI_DD Units Figure 40.1.1 – Peak Differential Output Voltage and Level Accuracy
A Point A amplitude 670 820 710 662 707 706 mV B Point B amplitude 670 820 709 662 710 705 mV C Point A/B symmetry 0 1 0.141 0.000 0.424 0.142 % D Point C symmetry 0 2 1.127 0.578 0.565 0.567 % E Point D symmetry 0 2 0.845 0.578 1.130 0.567 %
40.1.2 – Maximum Output Droop A Droop from F to G 73.1 100 95.50 95.19 95.14 95.18 % B Droop from H to J 73.1 100 96.04 95.58 95.77 95.66 %
40.1.3 – Differential Output Templates A Point A waveform Pass Pass Pass Pass 1B Point B waveform Pass Pass Pass Pass 2C Point C waveform Pass Pass Pass Pass 3D Point D waveform Pass Pass Pass Pass 4E Point F waveform Pass Pass Pass Pass 5F Point H waveform Pass Pass Pass Pass 6
40.1.4 – MDI Return Loss A Return Loss margin 0 Inf 2.727 2.553 1.066 3.160 dB 7
40.1.5 – Transmitter Timing Jitter A Jtxout, Test Mode 2 Informative 0.163 0.145 0.160 0.174 ns 8B Jtxout, Test Mode 3 Informative 0.155 0.145 0.164 0.169 ns 9C Master unfilt. pk-pk 0 1.4 0.139 ns 10
D Master filt. pk-pk 0 0.3 - Jtxout
0.119 ns
Master filt. plus Jtxout 0 0.3 0.293 ns E Slave unfilt. pk-pk 0 1.4 0.409 ns 11, 12
F Slave filt. pk-pk 0 0.4 +
(part G) - Jtxout
0.123 ns
Slave filt. plus Jtxout 0 0.4 + (part G) 0.292 ns
G LP Master filt. pk-pk 0 0.3 0.294 ns
40.1.6 – Transmitter Distortion A Max Peak Distortion 0 10 6.7 9.0 8.5 7.4 mV 14, 15, 16B % of UI under 10mV 60 100 100.0 100.0 85.0 100.0 %
40.1.7 – Transmit Clock Frequency A Clock deviation -12.5 +12.5 0.414 kHz
40.1.8 – Common-mode Output Voltage A Common-mode p-p 0 50 43.257 45.266 44.692 52.862 mV
UNH-IOL GE Consortium 4 Clause 40 PMA Test Report Rev. 1.0

Physical Medium Attachment Test Suite v2.5 Report DUT: Company Com DUT
GROUP 2 – PMA Receive Tests Table 4 – Test Requirements and Summary of Results
Test # Parameter 40.2.1 – Bit Error Ratio Verification Requirements The receiver shall maintain a bit error rate better than 10-10 over test channels
representing 10% to 100% (10% increments) of the worst-case cable attenuation. This implies that no more than 7 out of 2,500,000 1518 byte packets may be received in error
Results Attenuation Level Errors, Low Rise Time Errors, High Rise Time
10% 0 0 20% 0 0 30% 0 0 40% 0 0 50% 0 0 60% 0 0 70% 0 0 80% 0 0 90% 0 0
100% 14 19
UNH-IOL GE Consortium 5 Clause 40 PMA Test Report Rev. 1.0

Physical Medium Attachment Test Suite v2.5 Report DUT: Company Com DUT
UNH-IOL GE Consortium 6 Clause 40 PMA Test Report Rev. 1.0
Annex A – Supplemental figures
Figure 1: Waveform around point A
0 10 20 30−0.5
0
0.5
1
1.5
Time (ns)
BI_
DA
0 10 20 30−0.5
0
0.5
1
1.5
Time (ns)B
I_D
B
0 10 20 30−0.5
0
0.5
1
1.5
Time (ns)
BI_
DC
0 10 20 30−0.5
0
0.5
1
1.5
Time (ns)
BI_
DD
Figure 1: Waveform around point A

Physical Medium Attachment Test Suite v2.5 Report DUT: Company Com DUT
UNH-IOL GE Consortium 7 Clause 40 PMA Test Report Rev. 1.0
Figure 2: Waveform around point B
0 10 20 30−0.5
0
0.5
1
1.5
Time (ns)
BI_
DA
0 10 20 30−0.5
0
0.5
1
1.5
Time (ns)B
I_D
B
0 10 20 30−0.5
0
0.5
1
1.5
Time (ns)
BI_
DC
0 10 20 30−0.5
0
0.5
1
1.5
Time (ns)
BI_
DD
Figure 2: Waveform around point B

Physical Medium Attachment Test Suite v2.5 Report DUT: Company Com DUT
UNH-IOL GE Consortium 8 Clause 40 PMA Test Report Rev. 1.0
Figure 3: Waveform around point C
0 10 20 30−0.5
0
0.5
1
1.5
Time (ns)
BI_
DA
0 10 20 30−0.5
0
0.5
1
1.5
Time (ns)B
I_D
B
0 10 20 30−0.5
0
0.5
1
1.5
Time (ns)
BI_
DC
0 10 20 30−0.5
0
0.5
1
1.5
Time (ns)
BI_
DD
Figure 3: Waveform around point C

Physical Medium Attachment Test Suite v2.5 Report DUT: Company Com DUT
UNH-IOL GE Consortium 9 Clause 40 PMA Test Report Rev. 1.0
Figure 4: Waveform around point D
0 10 20 30−0.5
0
0.5
1
1.5
Time (ns)
BI_
DA
0 10 20 30−0.5
0
0.5
1
1.5
Time (ns)B
I_D
B
0 10 20 30−0.5
0
0.5
1
1.5
Time (ns)
BI_
DC
0 10 20 30−0.5
0
0.5
1
1.5
Time (ns)
BI_
DD
Figure 4: Waveform around point D

Physical Medium Attachment Test Suite v2.5 Report DUT: Company Com DUT
UNH-IOL GE Consortium 10 Clause 40 PMA Test Report Rev. 1.0
Figure 5: Waveform around point F
0 10 20 30 40 50−0.5
0
0.5
1
1.5
Time (ns)
BI_
DA
0 10 20 30 40 50−0.5
0
0.5
1
1.5
Time (ns)B
I_D
B
0 10 20 30 40 50−0.5
0
0.5
1
1.5
Time (ns)
BI_
DC
0 10 20 30 40 50−0.5
0
0.5
1
1.5
Time (ns)
BI_
DD
Figure 5: Waveform around point F

Physical Medium Attachment Test Suite v2.5 Report DUT: Company Com DUT
UNH-IOL GE Consortium 11 Clause 40 PMA Test Report Rev. 1.0
Figure 6: Waveform around point H
0 10 20 30 40 50−0.5
0
0.5
1
1.5
Time (ns)
BI_
DA
0 10 20 30 40 50−0.5
0
0.5
1
1.5
Time (ns)B
I_D
B
0 10 20 30 40 50−0.5
0
0.5
1
1.5
Time (ns)
BI_
DC
0 10 20 30 40 50−0.5
0
0.5
1
1.5
Time (ns)
BI_
DD
Figure 6: Waveform around point H

Physical Medium Attachment Test Suite v2.5 Report DUT: Company Com DUT
UNH-IOL GE Consortium 12 Clause 40 PMA Test Report Rev. 1.0
Figure 7: Return Loss vs. frequency
0 20 40 60 80 1000
10
20
30
40
50
60
Frequency (MHz)
BI_
DA
0 20 40 60 80 1000
10
20
30
40
50
60
Frequency (MHz)B
I_D
B
0 20 40 60 80 1000
10
20
30
40
50
60
Frequency (MHz)
BI_
DC
0 20 40 60 80 1000
10
20
30
40
50
60
70
80
Frequency (MHz)
BI_
DD
Limit Z
S = 85Ω
ZS = 100Ω
ZS = 115Ω
Figure 7: Return loss vs. frequency

Physical Medium Attachment Test Suite v2.5 Report DUT: Company Com DUT
UNH-IOL GE Consortium 13 Clause 40 PMA Test Report Rev. 1.0
Figure 8: Test Mode 2 Jtxout
1.462 1.464 1.466 1.468 1.47 1.472 1.474
x 10−8
0
200
400
600
800
1000
1200
Ref Edge: rise
BI_
DA
PKPK 1.631e−010, Mean 1.469e−008
−2.732 −2.73 −2.728 −2.726 −2.724 −2.722
x 10−8
0
200
400
600
800
1000
Ref Edge: riseB
I_D
B
PKPK 1.449e−010, Mean −2.727e−008
−5.25 −5.2 −5.15
x 10−9
0
200
400
600
800
1000
1200
1400
Ref Edge: rise
BI_
DC
PKPK 1.596e−010, Mean −5.189e−009
−3.12 −3.115 −3.11
x 10−8
0
200
400
600
800
1000
1200
Ref Edge: rise
BI_
DD
PKPK 1.736e−010, Mean −3.115e−008
Figure 8: JTXM Histogram

Physical Medium Attachment Test Suite v2.5 Report DUT: Company Com DUT
UNH-IOL GE Consortium 14 Clause 40 PMA Test Report Rev. 1.0
Figure 9: Test Mode 3 Jtxout
1.462 1.464 1.466 1.468 1.47 1.472 1.474
x 10−8
0
200
400
600
800
1000
1200
Ref Edge: rise
BI_
DA
PKPK 1.552e−010, Mean 1.469e−008
4.68 4.7 4.72 4.74 4.76 4.78
x 10−9
0
200
400
600
800
1000
Ref Edge: riseB
I_D
B
PKPK 1.446e−010, Mean 4.728e−009
−5.25 −5.2 −5.15
x 10−9
0
200
400
600
800
1000
1200
1400
Ref Edge: rise
BI_
DC
PKPK 1.641e−010, Mean −5.191e−009
−3.122 −3.12−3.118−3.116−3.114−3.112 −3.11
x 10−8
0
200
400
600
800
1000
1200
Ref Edge: rise
BI_
DD
PKPK 1.690e−010, Mean −3.115e−008
Figure 9: JTXS Histogram

Physical Medium Attachment Test Suite v2.5 Report DUT: Company Com DUT
UNH-IOL GE Consortium 15 Clause 40 PMA Test Report Rev. 1.0
Figure 10: Jitter Histogram, Master Timing Mode
−6 −4 −2 0 2 4 6
x 10−11
0
500
1000
1500
2000
Unfiltered Master TX_TCLK ref: extracted clock
Ref
. Edg
e: r
ise
PKPK 1.391e−010Mean −4.562e−015
−5 −4 −3 −2 −1 0 1 2 3 4 5
x 10−11
0
20
40
60
80
100
120
Filtered Master TX_TCLK ref: extracted clock
Ref
. Edg
e: r
ise
PKPK 1.194e−010Mean −2.957e−016
Figure 10: Jitter Histogram, Master Timing Mode

Physical Medium Attachment Test Suite v2.5 Report DUT: Company Com DUT
UNH-IOL GE Consortium 16 Clause 40 PMA Test Report Rev. 1.0
Figure 11: Jitter Histogram, Slave Timing Mode
−2.904 −2.9035 −2.903 −2.9025 −2.902 −2.9015
x 10−7
0
500
1000
1500
2000
Unfiltered Slave TX_TCLK ref: Unfiltered Master TX_TCLK
Ref
. Edg
e: r
ise
PKPK 4.092e−010Mean −2.903e−007
−6 −4 −2 0 2 4
x 10−11
0
5
10
15
20
25
30
Filtered Slave TX_TCLK ref: extracted clock
Ref
. Edg
e: r
ise
PKPK 1.232e−010Mean −9.530e−017
Figure 11: Jitter Histogram, Slave Timing Mode

Physical Medium Attachment Test Suite v2.5 Report DUT: Company Com DUT
UNH-IOL GE Consortium 17 Clause 40 PMA Test Report Rev. 1.0
Figure 12: Jitter Histogram, Slave Timing Mode
−1.5 −1 −0.5 0 0.5 1 1.5
x 10−10
0
500
1000
1500
2000
Unfiltered Master TX_TCLK ref: extracted clock
Ref
. Edg
e: r
ise
PKPK 3.416e−010Mean −4.568e−015
−1 −0.5 0 0.5 1 1.5
x 10−10
0
20
40
60
80
100
120
Filtered Master TX_TCLK ref: extracted clock
Ref
. Edg
e: r
ise
PKPK 2.942e−010Mean 6.792e−016
Figure 12: Jitter Histogram, Slave Timing Mode

Physical Medium Attachment Test Suite v2.5 Report DUT: Company Com DUT
UNH-IOL GE Consortium 18 Clause 40 PMA Test Report Rev. 1.0
Figure 13: PAM-5 Eye Diagram
Time (ps)
Diff
eren
tial V
olta
ge (
V)
0 2000 4000 6000 8000 10000
−1
−0.8
−0.6
−0.4
−0.2
0
0.2
0.4
0.6
0.8
1
Figure 13: 1000−T Eye Diagram

Physical Medium Attachment Test Suite v2.5 Report DUT: Company Com DUT
UNH-IOL GE Consortium 19 Clause 40 PMA Test Report Rev. 1.0
Figure 14: Peak Distortion vs. Phase Offset
0 0.2 0.4 0.6 0.8 13.5
4
4.5
5
5.5
6
6.5
7
7.5
Phase offset (UI)
BI_
DA
(m
V)
Max 6.71 at 0.82 UI, Min 4.44 at 0.52 UI
0 0.2 0.4 0.6 0.8 15
6
7
8
9
10
Phase offset (UI)B
I_D
B (
mV
)
Max 9.02 at 0.03 UI, Min 5.99 at 0.75 UI
0 0.2 0.4 0.6 0.8 1
5.5
6
6.5
7
7.5
8
8.5
9
9.5
Phase offset (UI)
BI_
DC
(m
V)
Max 8.52 at 0.35 UI, Min 6.35 at 0.97 UI
0 0.2 0.4 0.6 0.8 14
4.5
5
5.5
6
6.5
7
7.5
8
Phase offset (UI)
BI_
DD
(m
V)
Max 7.36 at 0.35 UI, Min 4.98 at 0.23 UI
Figure 14: Peak Distortion vs. Phase Offset

Physical Medium Attachment Test Suite v2.5 Report DUT: Company Com DUT
UNH-IOL GE Consortium 20 Clause 40 PMA Test Report Rev. 1.0
Figure 15: Distortion Waveform
500 1000 1500 2000−6
−4
−2
0
2
4
6
Unit Interval (UI)
BI_
DA
MaxPk: 6.71mV at 1813, MinPk: 4.44mV at 993
0.82 Ph. Off0.52 Ph. Off
500 1000 1500 2000
−5
0
5
10
Unit Interval (UI)B
I_D
B
MaxPk: 9.02mV at 160, MinPk: 5.99mV at 1381
0.03 Ph. Off0.75 Ph. Off
500 1000 1500 2000−8
−6
−4
−2
0
2
4
6
8
Unit Interval (UI)
BI_
DC
MaxPk: 8.52mV at 160, MinPk: 6.35mV at 1813
0.35 Ph. Off0.97 Ph. Off
500 1000 1500 2000
−6
−4
−2
0
2
4
6
8
Unit Interval (UI)
BI_
DD
MaxPk: 7.36mV at 2016, MinPk: 4.98mV at 161
0.35 Ph. Off0.23 Ph. Off
Figure 15: Distortion waveform
Physical Medium Attachment Test Suite v2.5 Report DUT: Company Com DUT
UNH-IOL GE Consortium 21 Clause 40 PMA Test Report Rev. 1.0
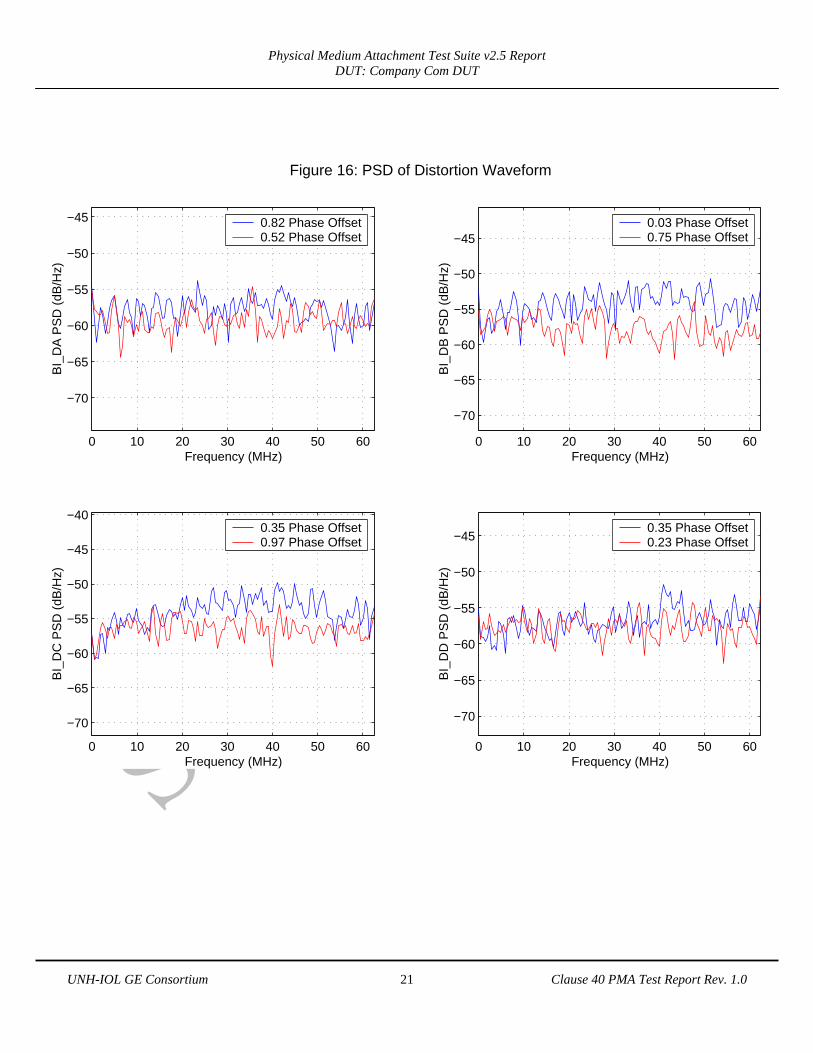
Figure 16: PSD of Distortion Waveform
0 10 20 30 40 50 60
−70
−65
−60
−55
−50
−45
Frequency (MHz)
BI_
DA
PS
D (
dB/H
z)
0.82 Phase Offset0.52 Phase Offset
0 10 20 30 40 50 60
−70
−65
−60
−55
−50
−45
Frequency (MHz)B
I_D
B P
SD
(dB
/Hz)
0.03 Phase Offset0.75 Phase Offset
0 10 20 30 40 50 60
−70
−65
−60
−55
−50
−45
−40
Frequency (MHz)
BI_
DC
PS
D (
dB/H
z)
0.35 Phase Offset0.97 Phase Offset
0 10 20 30 40 50 60
−70
−65
−60
−55
−50
−45
Frequency (MHz)
BI_
DD
PS
D (
dB/H
z)
0.35 Phase Offset0.23 Phase Offset
Figure 16: PSD of Distortion Waveform


![Fiber for DUT [Compatibility Mode]](https://img.pdfslide.us/doc/110x75/577d2fd91a28ab4e1eb2dce6/fiber-for-dut-compatibility-mode.jpg)