Embed Size (px)
Citation preview

HUMANAGEING
ANDLONGEVITY
ESOF 2006Munich, 16 July 2006
Claudio Franceschi
CIGInterdepartmental Centre
“L. Galvani”University of Bologna
ITALY

The highest national life expectancyobserved for female, 1580 - present
ASPETTATIVA
DI
VITA
Life expectancy doubled in the last two centuries(data refer to women)
Max Plank Institute for Demography, Rostock, Germany, Annual Report 2001

In the last 50 years the mortalityof people over 80 years decreased dramatically

Rectangularization and extensionof survival curves
What changed around 1950?
Maybe a change of attitude?
Vitamins?Antibiotics?Diet?Exercise?Progress of gerontology?All of the above?
Yashin et al., Exp Gerontol (2001) 37, 157-167

In some part of the world(rich, developed countries)
we have optimizedthe environment
(nutrition, hygene, medicine, housing and working
conditions)

After age 80the rate of mortality
decreasesand is no more
describedaccurately by the
Gompertz’s equation
centenarians
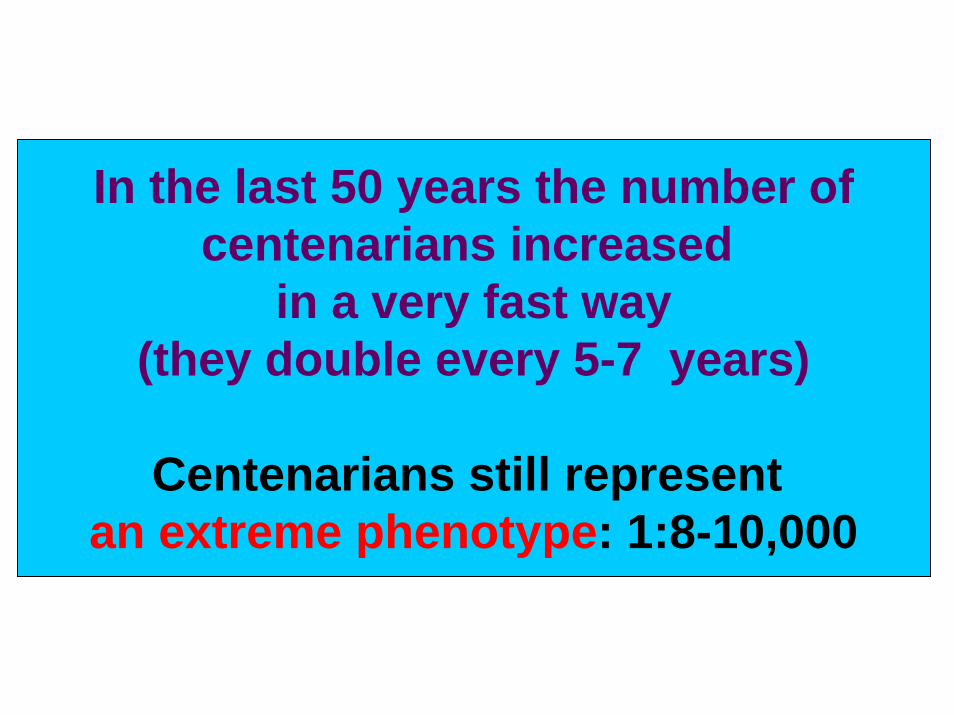
In the last 50 years the number ofcentenarians increased
in a very fast way(they double every 5-7 years)
Centenarians still representan extreme phenotype: 1:8-10,000

The oldest person in the world

Demographythe Sardinia island as a
laboratory
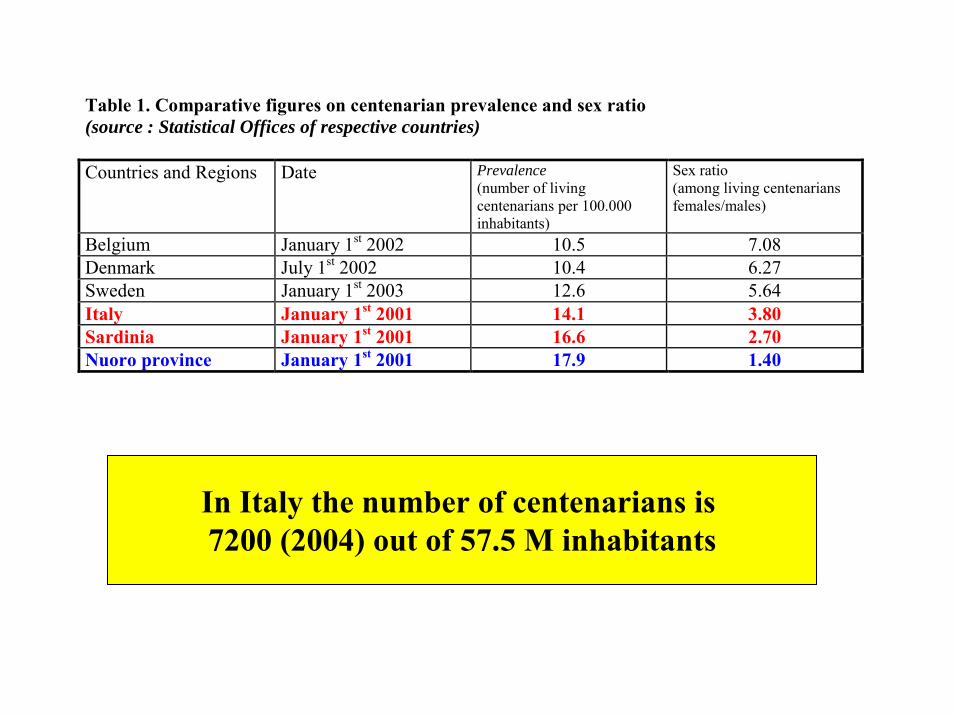
Table 1. Comparative figures on centenarian prevalence and sex ratio (source : Statistical Offices of respective countries) Countries and Regions Date Prevalence
(number of living centenarians per 100.000 inhabitants)
Sex ratio (among living centenarians females/males)
Belgium January 1st 2002 10.5 7.08 Denmark July 1st 2002 10.4 6.27 Sweden January 1st 2003 12.6 5.64 Italy January 1st 2001 14.1 3.80 Sardinia January 1st 2001 16.6 2.70 Nuoro province January 1st 2001 17.9 1.40
In Italy the number of centenarians is7200 (2004) out of 57.5 M inhabitants
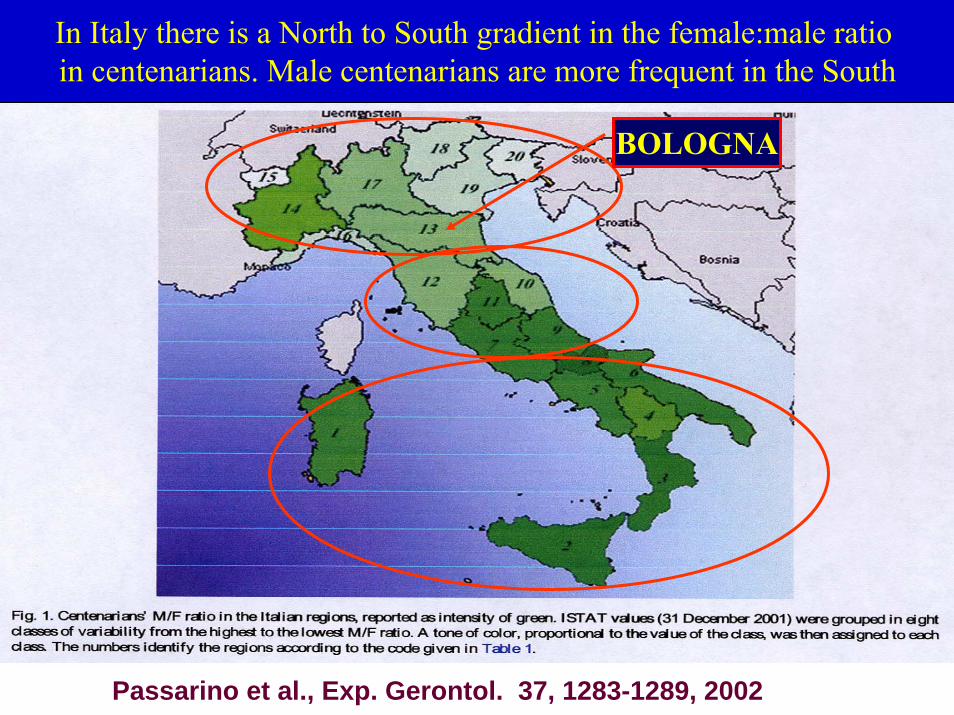
In Italy there is a North to South gradient in the female:male ratio in centenarians. Male centenarians are more frequent in the South
BOLOGNA
Passarino et al., Exp. Gerontol. 37, 1283-1289, 2002

Male centenarians are particularly frequent in Sardinia
Passarino et al., Exp. Gerontol. 37, 1283-1289, 2002

Figure 1. Mapping significant positive differences between observed number of centenarians and theoretical numbers based of average Sardinian figure with Gaussian smoothing method and 15 km distance.
Cagliari
Sassari
Iglesias
Alghero Ozieri
Oristano
Quartu
Tempio
Carloforte
BosaBonorva
Guspini
Nuoro
Sorso
Ittiri
Olbia
0km 25km 50km
Average number ofcentenarians for
1000 births
Khi-square test of areaswith significant positive
deviations to meanvalue of Sardinia
5 %1 %0.1 %
Grasland C., 2003, The Hypercarte Project
0.2
1.2
2.2
3.2
4.2
Mean value of Sardinia
Centenarians are not randomly distributed(according the their place of birth)
A geographic area highly enriched in male centenarians has been identifiedin Sardinia
The Blue Zone
Deiana et al., Exp. Gerontol., 39:1423-9, 2004

A demographic-epidemiologicalanalysis
is revealing that the remarkable ratio between women and men in Sardinia is
related to a lower mortality of men, particularly for CVD,
after age 80
Caselli et al., in preparation

Peculiar combination of genetics and lifestyle ?
Longevity = Environment + Genetics + StocasticityL=E+G+S
Antonio Todde enjoying his 112th birthday
77
Todde E
75
Todde G
73
Todde A
70
Todde G
59
Todde G
63
Todde M
75
Todde A Deiana MM
103
93
Deiana GA
79
DeianaMCA
Todde AD
78
81
Deiana A
63
Deiana F Deiana M
69
Deiana G
76
59
Todde MA
3Todde AD
98Todde A.R Todde A.
Todde L
82 77
Todde G
63
Todde ATodde A
79 1
Todde I
112
Todde Antonio Madeddu MA
86
98
Deiana FA Todde FM
88
sb
still birthTodde G
30 90
Madeddu B Todde G
70
Todde S
45
Todde A
72 101
Todde MA Todde A
72
Todde FA
60
37
Noli MRDeiana AM
46 38
Noli MESTodde AS
87
87
Lai GNoli GBDeiana GL
78 76
Murru C
Murru C Todde MA Lai G Lai M
Todde S
75
Fenude A
Todde G
~40 41
Mattu A
Todde A Lai C Mattu R
~50
57
Todde SNoli G Matzone S
Deiana M
§
§ isonymic marriage
twins
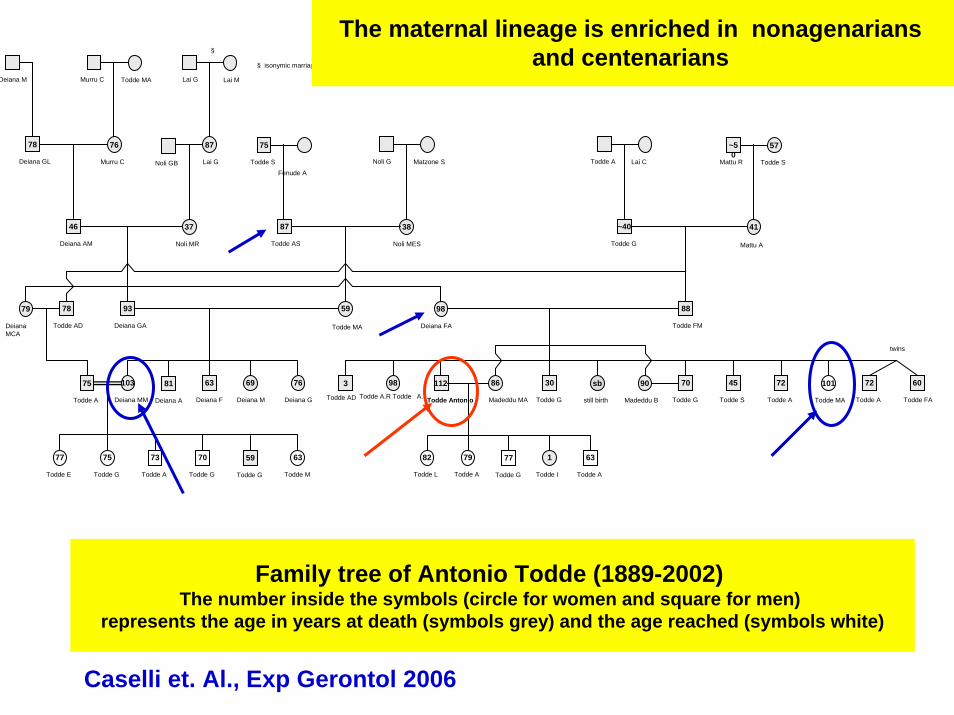
Family tree of Antonio Todde (1889-2002) The number inside the symbols (circle for women and square for men)
represents the age in years at death (symbols grey) and the age reached (symbols white)
Caselli et. Al., Exp Gerontol 2006
The maternal lineage is enriched in nonagenariansand centenarians

Genetics and Longevity
• Parents of centenarians lived longer thanpeople of the same cohort
• Siblings of centenarians have a “risk” toreach 100 several times higher than thatof people of the same cohort
• Offspring of centenarians have a lowermortality and are protected from CVD and cancer
• A strong familiar component of longevity

Genetics and LongevityThe survival advantage of centenarianoffspring is not shared by their spousesdespite the fact that they shared the sameenvironment for most of their life
Thus the strong familiar component of longevity is likely a genetic componentand long living sibs should be highlyenriched in longevity genes
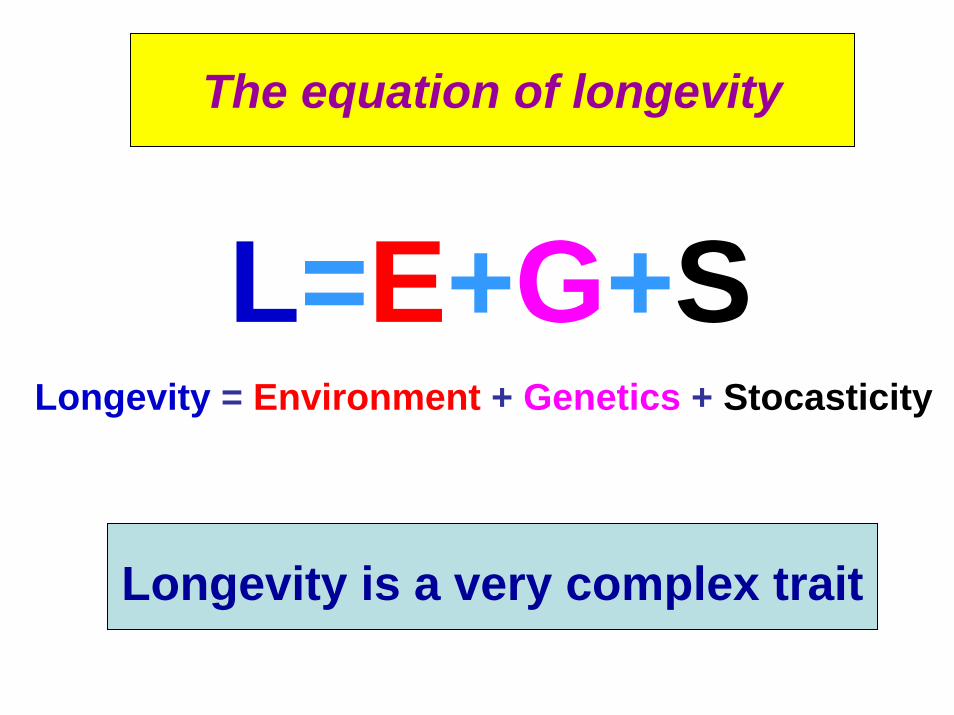
L=E+G+SLongevity = Environment + Genetics + Stocasticity
The equation of longevity
Longevity is a very complex trait
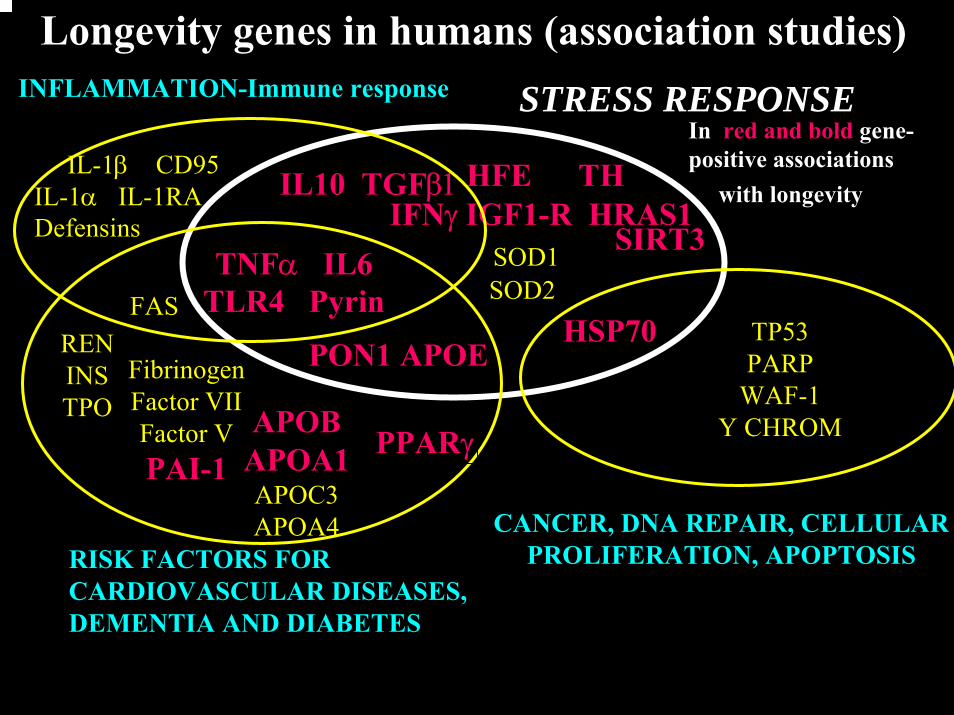
Longevity genes in humans (association studies) STRESS RESPONSE
HFE TH IFNγ IGF1-R HRAS1
FibrinogenFactor VIIFactor VPAI-1
RISK FACTORS FOR CARDIOVASCULAR DISEASES,DEMENTIA AND DIABETES
APOBAPOA1APOC3APOA4
HSP70 TP53PARP
WAF-1Y CHROM
CANCER, DNA REPAIR, CELLULAR PROLIFERATION, APOPTOSIS
TNFα IL6TLR4 Pyrin
IL-1β CD95IL-1α IL-1RADefensins
INFLAMMATION-Immune response
RENINSTPO
SOD1SOD2
IL10 TGFβ1
SIRT3with longevity
In red and bold gene-positive associations
FAS
PON1 APOE
PPARγ
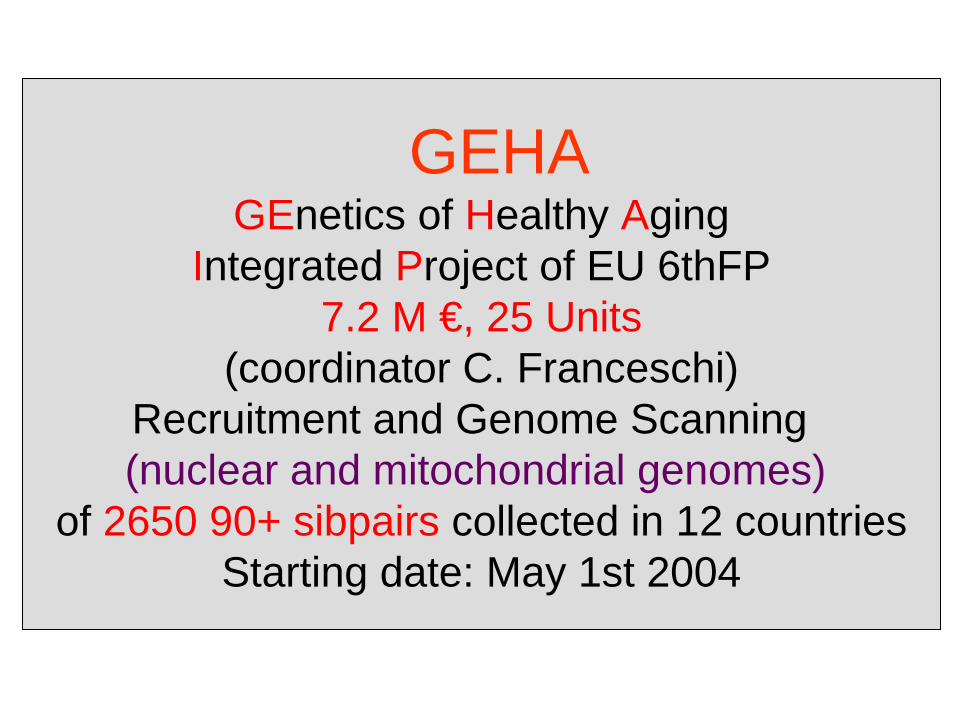
GEHAGEnetics of Healthy Aging
Integrated Project of EU 6thFP7.2 M €, 25 Units
(coordinator C. Franceschi)Recruitment and Genome Scanning(nuclear and mitochondrial genomes)
of 2650 90+ sibpairs collected in 12 countriesStarting date: May 1st 2004

It is possible to becamecentenarians
by- different strategies
- different combinations of E,G,S

The unusual genetics of longevity betweenantagonist pleiotropy and adaptive physiological
remodelling
AdaptationAdaptationRemodellingRemodelling
AntagonistAntagonistPleiotropyPleiotropy

LONGEVITY = Capability of the body
1.to cope with stressors2. to remember the experience of stressors
and thus3. to adapt and to remodel (hormesis?)
at the molecular, cellular and organismallevel (psychological, immunological)
the consequence is a remarkable change of the internal environment and “context”
- This process is quite variable from individual to individual and it is under genetic control which likely increases with age

the model of centenarians
centenarians are likelynot simply the more robust
butthose people who adapted
and remodelled
better and quicker(more hormetic ?)
remodellingselection +Centenarians represent
an extreme phenotype: 1:8-10,000

STRESSORS
MAINTENANCE SYSTEMS(Defence and Repair)
ADAPTATION
REMODELLING DISEASE
LONGEVITY DEATH

STRESSORS
MAINTENANCE SYSTEMS(Defence and Repair)
Change in body microenvironment
Changes in geneexpression
Progressive accumulation of “scars”
Changes in proteinabundance, composition
interaction

THE AGE-ASSOCIATEDREMODELLINGIS ASSOCIATED WITH A LOSS OF
COMPLEXITY
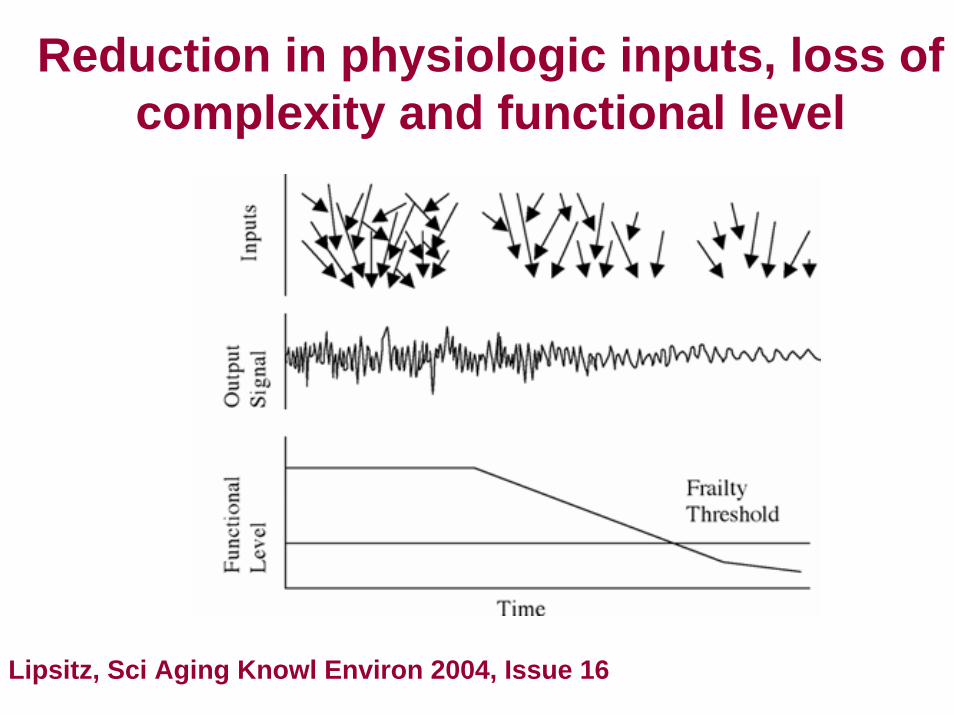
Reduction in physiologic inputs, loss of complexity and functional level
Lipsitz, Sci Aging Knowl Environ 2004, Issue 16

Loss of complexity of trabecular bone with aging
Loss of complexity of trabecular bone with aging
Iliac crest bxIliac crest bx femoral headfemoral head lumbar spinelumbar spinelumbar spine
37 year old37 year old
84 year old84 year old
Pictures from Ralph Muller

Ropp
Fopp
C
Remodelling = accumulation of Robustness (R)+
accumulation of Frailty (F)+
loss of Complexity (C)
individualvariability
(geneticallydetermined)
0 10070AGE

accumulation of Robustness (R)+
accumulation of Frailty (F)+
loss of Complexity (C)
increased role ofstocasticity
with age

Some characteristics of the centenarians

CLINICAL CHARACTERISTICS OF THE STUDY GROUPS (n=466)CLINICAL CHARACTERISTICS OF THE STUDY GROUPS (n=466)
CONTROLS n = 298
CENTENARIANSn = 168
Sex (male/female)
Plasma triglycerides (mmol/l) 1.5 ± 0.8 1.2 ± 0.4*
Plasma total cholesterol (mmol/l) 5.5 ± 1.1 4.5 ± 1.1*
Plasma HDL cholesterol (mmol/l) 1.4 ± 0.4 1.6 ± 0.4*
Plasma LDL cholesterol (mmol/l) 3.2 ± 1.1 1.6 ± 0.8*
IR (HOMA) 3.9 ± 1.7 1.5 ± 0.7*
26.1BMI (Kg/m2)
6.0
14.8
2.4± 22.3 ± 3.1*Plasma Glucose (mmolL) ± 4.1 ± 1.1*
Plasma Insulin (mU/l) ±
1.2
6.9 ± 2.8*6.4
148/150 51/117
*p<0.01 vs control group
Paolisso et al., Exp. Gerontol., 37, 149-156, 2001

Age (years)
IR (H
OM
A)
1
2
3
4
5
6
20-40 40-50 50-60 60-70 70-80 80-90 90-100 >100
p for trend < 0.01
INSULIN RESISTANCE IN THE WHOLE POPULATION (N = 466)INSULIN RESISTANCE IN THE WHOLE POPULATION (N = 466)
Paolisso et al., Exp. Gerontol., 37:149-156,2001

Peculiar energy metabolism andIGF-1/Ins signaling in
centenarians
• Is the lack of insulin resistance a pre-requisite for longevity?
• Do centenarians perform better as far asglucose metabolism and energymetabolism is concerned?

Centenarians remindcalorically-restrictedhormetically-adapted
organisms

IGF-1 plasma levels are very low in centenarians
Bonafè et al., 2003

IGF1 plasma levels are correlated withpolymorphisms of IGF1R and PIK3 kinase

Trade off between muscle strengthand cancer in aged people
- High plasma levels of IGF-1 (genetically controlled)) are beneficialin aged people, especially regarding physical performance and the maintenance of muscle strength
- The price to pay is likely an increased risk of cancer
- Low plasma levels of IGF-1 (genetically controlled) are beneficial in the last decades of life (nonagenarians and centenarians) and are associated with lower propensity to cancer growth
- The price to pay is frailty and massive reduction of musclestrength
- High levels of IL-6 are always detrimental for muscle mass and strength as well as for late survival

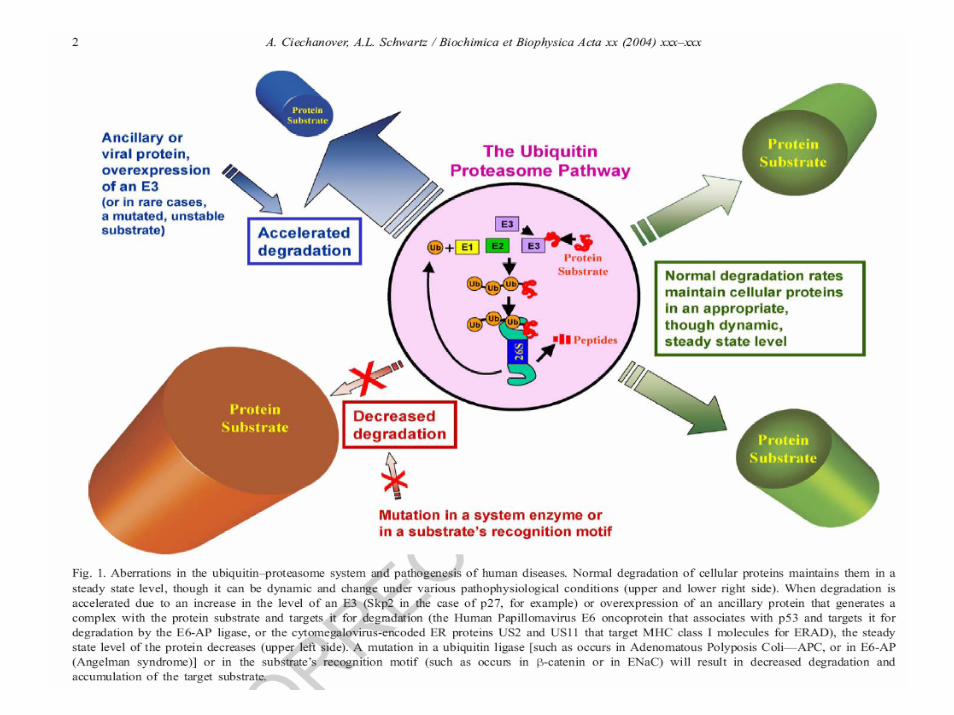
Proteasomeand
Immunoproteasome

Proteasome activity analysis in cultures of embryonic cells (MRC5; passage 21), controldonors (28 and 80 years old; passage 9) and centenarians C1, C2 and C3 (passage 9; greybars), as well as in C6 culture undergoing replicative senescence (black bars).
Chondrogianni et al. Exp Gerontol., 2000
Proteasome activity is maintained in fibroblasts fromcentenarians and decreases with in vitro passages

RNA expression level of proteasomesubunits is maintained
Chondrogianni et al. Exp Gerontol., 2000

Evolution, Ageingand
Inflammation(Inflamm-aging)

Evolutionary Medicine
1. our body has been selected for (millions of years) in order to survive until the age of reproduction
2. the average life expectancy at birth was quite short (about 40 years) until a couple of centuries ago

3. our defence and repair systems have been moulded by evolution to
cope with all sort of external (pathogens) and internal (ROS)
stressors and
to maintain fully efficient bodies for and until reproduction

4. our immune system has also been moulded by evolution and it is quite efficient in coping with acuteinfections in young people;
5. the same system is not particularly efficient in responding to chronic stimuli in old subjects;

6. both innate immunity and clonotypical(adaptive) immunity appear to be
hyper-stimulated in old peopleowing to
decades of evolutionary unpredicted antigenic stimulation, mostly due to
sub-chronic, bacterial and viral infections

we are “immunologically unfit”

The new paradigm of evolutionary medicine
the most important pathologies involvegenes and gene variants (polymorphisms) which have been selected to adapt to anenvironment characterized by :
- Famine ( today plenty of food)- Infections (today hygenized
environment, food…)- Great expenditure of calories (today
heating, low physical excercise)

Pathological conditionswith an inflammatory
pathogenesis(or an inflammatory strong component)
• 1. atherosclerosis, MI, stroke• 2. metabolic syndrome, obesity, type 2
diabetes• 3. osteoporosis and osteoarthritis• 4. neurodegeneration ( Alzheimer’s disease)• 5. cancer• 6. major depression• 7. FRAILTY

Ann. N.Y. Acad. Sci., 908, 244-254, 2000


repeated episodes of acute or chronic stressphysical or psychological
Cytokines Chronic InflammationHormones (Inflamm-ageing)
repeated episodes of acute or chronic stressantigenic
Franceschi et al., Inflamm-aging: an evolutionary perspective on Immunosenescence
Ann. N. Y. Acad. Sci. 908, 879-96, 2000

Antigenic stimulation and pro-inflammatory cytokines increase with age
De Martinis et al., 2005


innate immunity, stress response and inflammationare evolutionary interconnected
and macrophage-centered
Franceschi et al., 2000

Obese adipose tissue is charactherized by inflammation and progressive infiltration by macrophages as obesity develops

Immuno-activation, Inflammation and Obesity

The filling up of the immunological spacein old subjects
EffectorsMemory
OldVery young Young CD8+
T Cells
Naive
Chronic cytomegalovirus (CMV) infection plays a major role
in immunosenescence
The immune system of old peopleis full of megaclones specific
for CMV epitopes

Virus Viral protein Epitope Sequence HLA-restriction
Tetramers
EBV BMLF1 lytic protein
280-288 GLCTLVAML A*0201 EBV1
EBV EBNA3A Latent protein
379-387 RPPIFIRRL B*0702 EBV2
CMV pp65 495-503 NLVPMVATV A*0201 CMV1
CMV pp65 417-426 TPRVTGGGAM B*0702 CMV2
MHC- class I-restricted viral epitopes and related tetramers used to assess the number of circulating CMV-
specific CD8+ T cells
Sansoni et al., Exp.Gerontol., 39, 1233-43, 2004

Donor Age HLA %EBV1+/CD8+(n°/µL)
%CMV1+/CD8+(n°/µL)
%EBV2+/CD8+(n°/µL)
%CMV2+/CD8+(n°/µL)
001 97 A2+ <0.01 (0) 1.7 (12)
002 93 A2+ 0.58 (1.3) 13.4 (30.8)
003 91 A2+ <0.01 (0) 0.6 (1.4)
004 102 A2+ <0.01 (0) 4.9 (25)
005 99 A2+ 0.9 (2.3) 0.54 (1.4)
006 95 A2+ <0.01 (0) 1.5 (2)
012 101 A2+/B7+ <0.01 (0) <0.01 (0) 0.22 (0.9) 1.03 (4)
013 99 A2+/B7+ <0.01 (0) 0.19 (1.1) 0.06 (0.3) 2.8 (17)
014 102 A2+/B7+ <0.01 (0) <0.01 (0) 0.2 (1.8) 22.2 (208)
015 102 A2+/B7+ <0.01 (0) 0.3 (1) 0.77 (2.6) 5.9 (20.2)
016 99 A2+/B7+ <0.01 (0) <0.01 (0) 0.3 (1) 2.27 (8)
017 94 B7+ 0.12 (0.4) 5.5 (18)
018 93 B7+ 0.5 (1.7) 1.6 (5.6)
019 93 B7+ 0.2 (0.6) 1.2 (3.6)
020 104 B7+ <0.01 (0) 0.6 (5)
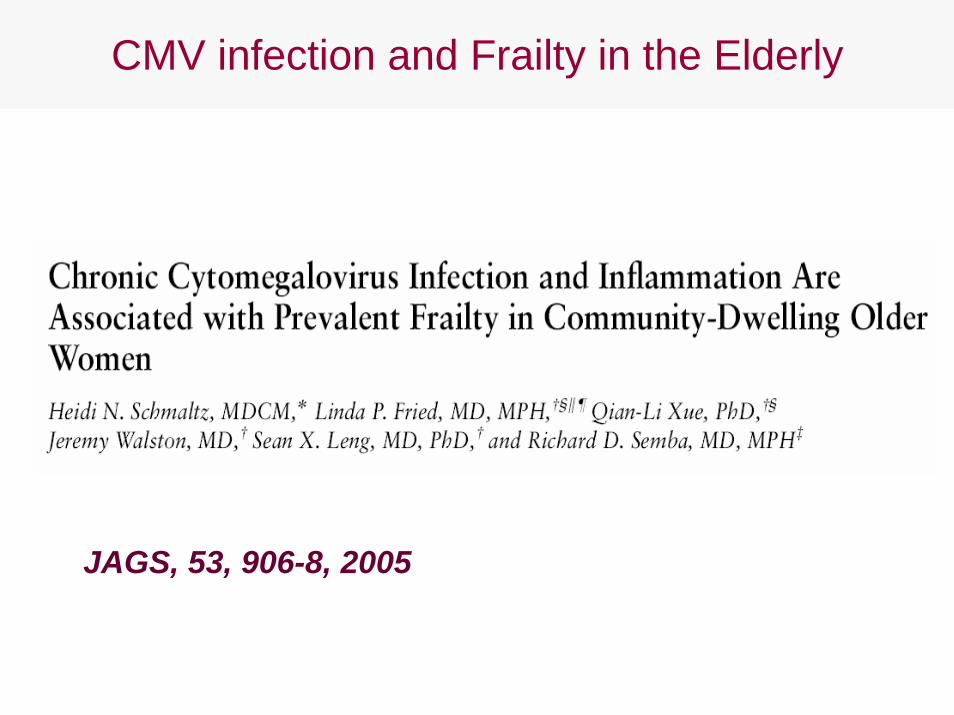
JAGS, 53, 906-8, 2005
CMV infection and Frailty in the Elderly

The combination of CMV infection + high plasma levels of IL-6
synergizeregarding frailty in the elderly
Schmaltz et al., 2005
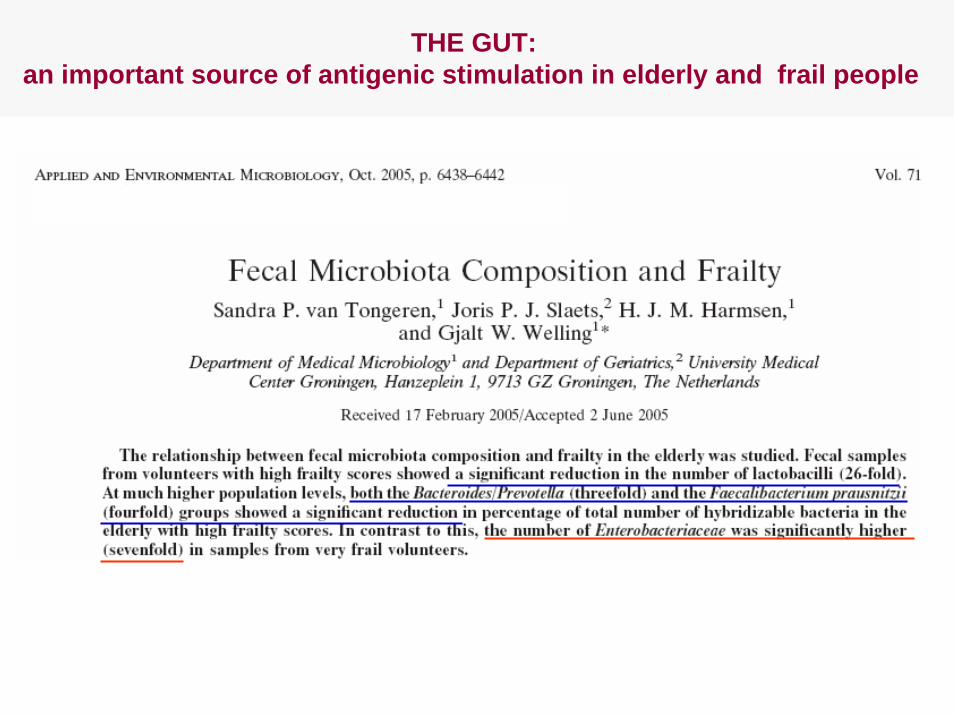
THE GUT: an important source of antigenic stimulation in elderly and frail people

Memory cellsare
stimulated and expandedby cross-reactive antigens
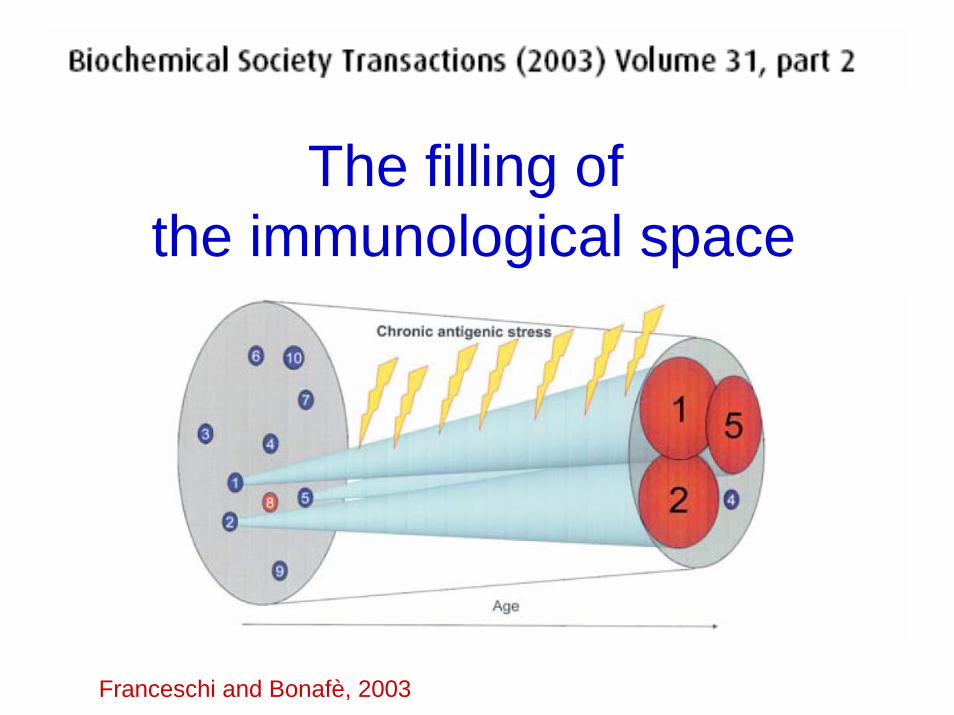
The filling of the immunological space
Franceschi and Bonafè, 2003

The absolute number of virgin (non antigen-experienced)T cells (0) CD95- CD28+) decreases linearly with age
and there is an exaustion of such cells in centenarianswhich is correlated to an increased risk of mortality
(Fagnoni et al., Blood, 2000)

Thymus from a 5 years old boy Courtesy of M. Capri

Thymus from a 54 years old manCourtesy of M. Capri

Thymus from a 74 years old manCourtesy of M. Capri

Thymic output with age
n.16 n.13 n.25
Nasi et al., Aging Cell 2006 in press

Plasma levels of IL-7 do not change with ageand are higher in female than in male centenarians

Immune status in very elderly IRP and non-IRP donors
Alterations with agenon-IRP IRP
Marker and cells
CD4:CD8 > 1 CD4:CD8 < 1
T cell proliferation→→
T cell proliferation ↓
CD28 ↑ CD28 ↓
CD57 ↓ CD57 ↑
CD45RA ↑ CD45RA ↓
CD45RO ↓ CD45RO ↑
KLR-G1 ↓ KLR-G1
Cytokines and growth factors
IL-2 ↑ IL-2 ↓
IL10 → IL-10 →
IFN-g ↑ IFN-g ↓
CMV/EBV status
CMV+/ lower frequencies
Mostly KLR-G1+
CMV+/ higher frequencies
Mostly KLR-G1+
EBV+/ lower frequencies
EBV+/ higher frequencies

The individual threshold for DDD
Franceschi and Bonafè, Biochem. Soc. Transact. (2003) vol. 31, part 2

Context and Noise

the problem of context in aging research
aged cells in aged bodies:
intrinsic (?) extrinsic (?) (cell) (environment)
which is the more important ?

repeated episodes of acute or chronicpsychological and physical stress
Cytokines Chronic InflammationHormones Inflamm-aging
repeated episodes of acute or chronicantigenic stress
drastic change ofmicroenvironment

the role of the CONTEXTin the aging process
immunological / inflammatory“noise / field” can be
pathogenic(abundance, pleiotropy and redundance of
cytokines and growth factorsboth sistemically and locally)

Stem cells(hemopoietic progenitors)

Hemopoiesis in centenarians
- the number of CD34+ hemopoietic progenitor cells(HPC) in the peripheral blood of centenarians isabout 50% of that found in young subjects
- when put in optimal culture conditions CD34+ cellsfrom centenarians are perfectly able to respond togrowth factors and form erythroid, granulocyte/macrophage and mixed megakaryocyticcolonies in a way (number, size and morphology) indistinguishable from that of young subjects
- a remodelling of the production of hemopoieticgrowth factors occurs in old people and centenarians

IL-3
GM-CSF
SCF

What changes dramatically with age isthe number of HPC and their
environmentbut not their functional capability to
differentiate
“old” satellite cells are perfectly ableto generate new muscle fibers whenexposed to a “young” environment
and viceversa that“young” satellite cells are inhibited by
the old milieu

Nature 433, 760-764, February 2005

abnormal and aberrantmitotic stimuli
in the microenvironment(inflamm-aging ?)
Narita and Lowe, Nature Med, 2005