Embed Size (px)
Citation preview
������������ ���������������������������������������������� ����!"#��$�%&��'���������
��(�)*��*+���$�,�����-.���/��� ��"�����0+���1� 2����3-����/"��"��3�4�2��������$����-�������
������������ ������������������5��2�� �*+���)���-2-���
����������������� ��)���-2-���
!�������(��6 -2-���
7 �"���(���8�� �� �����
���������� ���� ���������� ��
�� ���������������������������
���.����9���������������
��
:2*-������ ���������
:2*�;������ �������<�
�-��2�� ������ <������� � �����24. August 2010
� � �
� �
� �
�
�
�
�
�
�
�
�
�
�
�
�
Claudia Pechstein Part 1 - Facts
Blood Counts of the years 2000 to 2009 as Determined at the Doping Controls
Page
Summary 2
1 Introduction 3
2 Methods 3
3 Comparison of blood counts determined at top events, at world cup races and during training phases
4
4 Instances of increased haemoglobin concentration greater than 1 g/dl within 2 months
14
5 What happens after high reticulocyte counts above 2.4%? 17
6 What were the reticulocyte counts one to three weeks before the highest haemoglobin values?
19
7 World Championship in Hamar 2009 21
Annex 1: Blood counts of the top event season 2006 23
Annex 2: Blood counts of the top event season 2008 24
Annex 3: Official blood counts of the ISU doping control system 25

2
Summary
Claudia Pechstein has been found guilty of blood doping on the basis of increased reticulocyte counts at the ISU World Championships in Hamar in 2009.
I have evaluated the anti-doping blood tests of Claudia Pechstein organized by the International Skating Union since 2000 and come to the conclusion: The increased reticulocyte counts at the World Championships in Hamar in 2009 are not due to blood doping using an erythropoiesis stimulating agent (ESA). Arguments against doping are:
Hamar 2009 The aim of blood doping is to increase haemoglobin concentration without exceeding the limit of 16.5 g/dl (for women). There has been no increase in hemoglobin level or hematocrit in the course of the season 2008/2009 and there has been no increase in both parameters during January and February 2009.
Stimulating blood doping must start early enough to provide a sufficient rise of haemoglobin level. Since it is impossible to have a relevant rise of the haemoglobin level within six days, the suspected doping must have started prior to 30th und 31st of January - 6 and 7 days before the world championship in Hamar. At that time, Mrs. Pechstein had two doping tests which proved negative and the reticulocyte counts were in the normal range as defined by the ISU.
95 doping tests Hemoglobin levels, hematocrit calculations and reticulocyte counts were the same wherever Mrs. Pechstein’s blood was analyzed from 2000 to 2009. There were no differences to be observed in blood taken during Olympic or world championchips compared to world cup competitions or compared to tests taken during training phases.
There is no systematic increase in any hematologic parameter during the training and competitive season from September to March. There is no increase in haemoglobin during the last 40 days prior to a top event like Olympic Games. In conclusion, there is no evidence for doping aiming at manipulating blood for top events.
Rising reticulocyte counts since the year 2000 without any increase of haemoglobin
The reticulocyte count shows a rising trend during the observation period from the year 2000 to the year 2009, whereas the haemoglobin level shows an opposite trend. This phenomenon strongly argues for natural causes of the haematological phenomena.
Retics/Haemoglobin Elevated reticulocyte counts were never followed by a relevant increase of haemoglobin, e.g., greater than 1 g/dl. Prior to the highest hemoglobin levels of Mrs. Pechstein above 15 g/dl no reticulocyte above the ISU-limit of 2.4% was measured during the doping controls
MCHC Mrs. Pechstein had increased MCHC values and increased numbers of hyperchromic red cells at various occasions indicative of a red cell abnormality.

3
1 Introduction
Claudia Pechstein has been found guilty of blood doping on the basis of increased reticulocyte counts at the ISU World Championships in Hamar in 2009. This paper is a description of attempts to find evidences of blood doping within the data provided by the anti-doping authorities of the ISU using the blood counts determined since the year 2000 up to the year 2009.
Reticulocytes are young red blood cells (erythrocytes) that need four days for maturing. They generally remain at their place of origin in the bone marrow for three days. Then, they migrate into the blood, where they take another day to become mature erythrocytes. They are thus a very sensitive parameter of the erythrocyte production of the last three to seven days.
The normal range of the reticulocyte count is 0.5 to 1.8% in healthy subjects without any abnormality of the blood. However, the upper limit of normality is specified differently. The lowest specified limit is 1.4% according to the textbook by Prof. Thomas' “Laboratory and Medicine”. Other laboratories provide reference ranges up to a maximum of 2.5%. For the purpose of sport controls the limit was set by 2.4%.
2 Methods
The Excel-table of Claudia Pechstein’s blood counts provided by the ISU was used. The analysis was based on the hypothesis that any blood doper aims at obtaining best blood counts at top events like world championships and Olympic Games. European championships were not considered as top events and are included in the world cup series. In a separate analysis in which the European championships were counted as top events, the small differerences in blood counts between top events and other occasions were reduced.
Any effort was undertaken to detect evidences of blood doping. This was done by analyzing Mrs. Pechstein’s data in any reasonable way. The blood counts of all top events since the year 2000 were analyzed altogether in cumulative way. This method was used to get a chance to see small variations that might be indicative of blood doping. Small changes occurring repeatedly every year might be overlooked in case of looking at individual top events.
In addition, any single top-event season was analyzed separately to search for blood doping used just for one top event season, e.g., 2006 or 2009.

4
3 Comparison of blood counts determined at top events, at world cup races and during training phases
Overall results
Every blood doper tries to increase his/her haemoglobin concentration especially for top events like Olympic Games and world championships.
Thus the question arises whether blood counts of Mrs. Pechstein have been “better” at top events than at world cup races and during unannounced inspections during training phases. It must be noted that increases of the haemoglobin level due to training in high altitude are allowed. Higher haemoglobin levels at top events following training at high altitude would not be a proof of blood doping.
As the following figure shows, no difference in blood counts were observed whether the blood was taken at top events, at world cup races and at training controls, at least as long as overall data are analyzed.
0
10
20
30
40
50
Hb-Wert Hämatokrit Retis inPromille
WM Olympia
Weltcup EM
Training
� �������� �� ����!���"�#� ��!"��!$� �!�"���������%� & ��� �
'��#�!"%��! ����#������������%��� ���
(��#� �% ! ���"�#�% ����� )�

5
Detailed results: 2000 - 2009
Reticulocytes show an upward trend over the 10 years, particularly apparent at top events whereas a slight decrease of haemoglobin values is apparent, especially at top events.
Retikulocytes at top events, at world cups and during training phases
Normal range ISU: up to 2.4%
0.0
1.0
2.0
3.0
4.0
20.05.99 13.02.02 09.11.04 06.08.07
Ret
iku
locy
tes
%
TopWorld cupTraining
Haemoglobin concentration at top events, at world cups und during training phases
Normal range 12 to 16.5 g/dl
12.0
13.0
14.0
15.0
16.0
20.5.99 19.4.01 20.3.03 17.2.05 18.1.07 18.12.08
Hae
mog
lobi
n
TopWorld cupTraining

6
Haematocrit levels at top events, at world cups and during training phases. Normal range 36-
48%; normal range ISU: bis 46%
36
38
40
42
44
46
48
28.08.99 05.11.01 14.01.04 24.03.06 01.06.08
Hae
mat
ocr
it %
Top
World cup
Training

7
A closer look at day zero results
Comparison of day zero blood counts taken at top events (day before the start of Olympic Games and before world championships) with blood counts analyzed at all other situations
Haemoglobin Haemoglobin levels tend to decrease during endurance sports. Consequently, it might be that a doping effect will be overlooked if day-zero blood-counts and post-competition counts are lumped together. Therefore it seems appropriate to compare haemoglobin levels of day zero before the start of the world championships and Olympic Games with data obtained at world cup races and during training.
Mrs. Pechstein’s mean haemoglobin concentration was 14.8 g/dl at top events on day zero before the start of the competitions. This is 0.2 g/dl higher than the mean of the random checks during training and 0.3 g/dl higher than at world cup events and European championships.
This could be an indication for artificially raised haemoglobin level at top events. That would basically be suspicious of doping. But it would be legal if this higher level of haemoglobin concentration was due to training at high altitude.
When comparing day zero blood counts at top events and those of world cup competitions and those of training phases one would have to know whether the latter blood samples were taken under resting conditions like on “day zero” or under endurance conditions like post-competition tests. They are probably a mixtum compositum.
Consequently, it is expected that haemoglobin levels at top events do not significantly differ from those in training and at world cup events.

8
A closer look: How do the blood counts change in the months prior to top events? Mean blood counts
Mean blood counts Next point is to analyze mean blood counts in the months prior to top events like world championships and Olympic Games. In case of blood-doping by Mrs. Pechstein one would expect raising haemoglobin levels with best values in February and March. The following figure shows no raising haemoglobin levels at top events and no specific
Figure: Mean reticulocyte and hemoglobin values from 2000 to 2009 summarized monthly presented by starting in July to the World Championship/Olympic season in February and March (very few measurements in the months of July and August
.
0
0.5
1
1.5
2
2.5
3
0.0 2.0 4.0 6.0 8.0 10.0Monate
Ret
ikul
ozyt
en %
WM -Olympia
12.0
13.0
14.0
15.0
16.0
0 1 2 3 4 5 6 7 8 9 10Monate
Häm
oglo
bin
g/d
l

9
A closer look: How do the blood counts change in the months prior to top events? All blood counts
Details The next two figures show all blood counts in relation to world championships and Olympic Games. World championships and Olympic Games take place during the months of February and March. This period is indicated in gray in the figures. The time course is indicated at the x-axis and “23.6” stands for 23th of June of the 10 years that have been analyzed. The laboratory tests indicated at “15.3” and earlier have been obtained in years in which Mrs. Pechstein did not participate at world championships or after championships which took place in February.
Figure: Haemoglobin concentrations and reticulocyte counts in relation to world championships and Olympic Games from 2000 to 2009 starting in February of the preceeding year after completion of the last top event
12,0
13,0
14,0
15,0
16,0
6.12 15.3 23.6 1.10 9.1 19.4
Häm
oglo
bin
g/dl
0,0
1,0
2,0
3,0
4,0
6.12 15.3 23.6 1.10 9.1 19.4
Ret
iku
lozy
ten
%
10
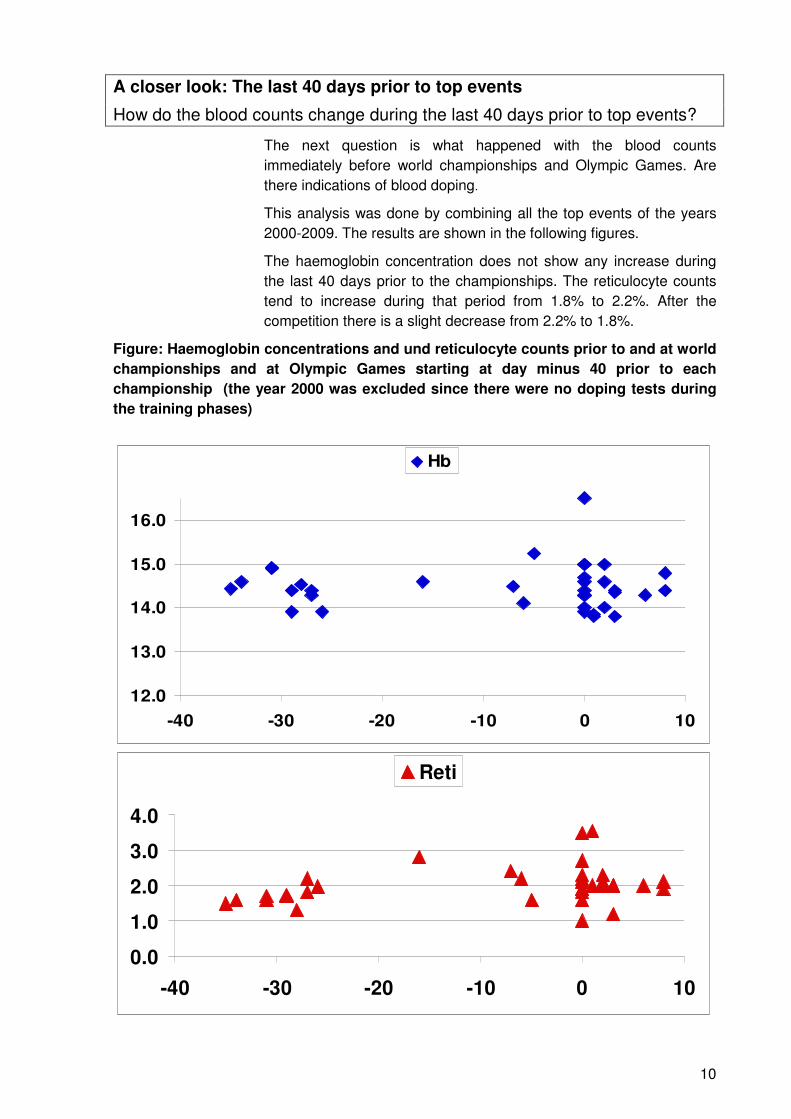
A closer look: The last 40 days prior to top events
How do the blood counts change during the last 40 days prior to top events?
The next question is what happened with the blood counts immediately before world championships and Olympic Games. Are there indications of blood doping.
This analysis was done by combining all the top events of the years 2000-2009. The results are shown in the following figures.
The haemoglobin concentration does not show any increase during the last 40 days prior to the championships. The reticulocyte counts tend to increase during that period from 1.8% to 2.2%. After the competition there is a slight decrease from 2.2% to 1.8%.
Figure: Haemoglobin concentrations and und reticulocyte counts prior to and at world championships and at Olympic Games starting at day minus 40 prior to each championship (the year 2000 was excluded since there were no doping tests during the training phases)
12.0
13.0
14.0
15.0
16.0
-40 -30 -20 -10 0 10
Hb
0.0
1.0
2.0
3.0
4.0
-40 -30 -20 -10 0 10
Reti

11
A closer look: The 40 days following top events
How do the blood counts change after top events?
Figure: Haemoglobin concentrations and und reticulocyte counts during and after world championships and at Olympic Games starting at day zero of each championship (the year 2000 was excluded since there were no doping tests during the training phases)
12.0
13.0
14.0
15.0
16.0
-4 6 16 26 36 46
Hb
0.0
1.0
2.0
3.0
4.0
-4 6 16 26 36 46
Reti

12
Official blood counts of the ISU doping control system
Top events
World cup
events Controls during training phases
Hb Hct Ret MCHC Hb Hct Ret MCHC Hb Hct Ret MCHC ics ics ics g/dl % % g/dl % % g/dl % %
Limits 16.5 46 2,4 16.5 46 2,4 16.5 46 2,4
04.02.2000 15.3 43.0 2.3 35.6 05.02.2000 15.0 41.0 1.7 36.6 06.02.2000 15.3 42.0 1.8 36.4 03.03.2000 15.1 43.0 2.2 35.1 04.03.2000 14.7 42.0 2.2 34.9 06.03.2000 14.8 42.0 2.2 35.2 01.02.2001 14.4 41.0 1.5 35.2 02.02.2001 14.6 41.0 1.6 35.6 08.03.2001 14.0 39.0 1.6 35.9 09.11.2001 14.7 44.0 2.4 33.4 10.11.2001 15.0 42.0 2.5 35.6 22.11.2001 13.9 40.0 2.3 34.8 06.02.2002 14.4 40.0 2.1 36.0 10.02.2002 14.4 40.0 2.0 36.0 19.02.2002 14.3 40.0 2.0 35.8 22.02.2002 14.4 40.0 2.1 36.0 07.03.2002 14.7 41.0 1.9 35.9 09.03.2002 14.6 40.0 2.0 36.5 10.03.2002 14.4 40.0 2.0 35.9 08.11.2002 15.5 42.0 1.6 36.9 09.11.2002 14.7 40.0 1.6 36.8 10.11.2002 14.5 40.0 1.6 36.3 22.11.2002 13.9 40.0 1.5 34.7 23.11.2002 14.6 42.0 1.7 34.7 02.01.2003 14.9 44.0 1.7 33.9 05.01.2003 14.5 43.0 1.3 33.8 02.02.2003 15.2 40.0 1.6 38.1 07.02.2003 15.0 42.0 1.8 35.7 08.02.2003 13.9 38.0 2.0 36.4 09.02.2003 14.0 40.0 2.1 35.0 06.03.2003 13.9 41.0 1.3 34.0 07.03.2003 14.1 40.0 1.9 35.3 12.03.2003 13.9 38.0 2.6 36.5 24.09.2003 14.7 40.0 2.1 36.8 05.11.2003 14.2 37.0 2.2 38.5 07.11.2003 14.9 42.0 1.6 35.5 20.11.2003 14.4 42.0 2.4 34.2 22.11.2003 14.6 42.0 2.6 34.7 06.01.2004 14.9 40.0 1.6 37.3 06.02.2004 16.5 45.0 1.0 36.7 09.02.2004 13.8 39.0 1.2 35.4 26.02.2004 14.7 43.0 2.3 34.1 29.02.2004 14.3 41.0 2.3 34.8

13
09.09.2004 14.4 40.0 1.7 36.0 20.09.2004 14.1 39.0 1.9 36.2 13.10.2004 14.1 38.0 1.7 37.1 05.11.2004 14.9 40.0 2.3 37.3 12.11.2004 14.4 41.0 1.1 35.1 26.11.2004 14.5 41.0 2.7 35.4 06.01.2005 14.6 40.0 1.5 36.5 09.01.2005 14.3 40.0 1.9 35.8 02.03.2005 15.4 43.0 1.9 35.8 06.07.2005 15.4 42.0 1.4 36.7 24.08.2005 14.3 40.0 2.5 35.8 18.11.2005 13.8 39.0 1.9 35.4 26.11.2005 14.6 39.0 2.8 37.4 08.12.2005 13.7 38.0 2.4 36.1 13.01.2006 14.4 41.0 1.7 35.1 15.01.2006 14.4 40.0 1.8 36.0 11.02.2006 14.3 39.0 2.2 36.7 23.02.2006 14.8 42.0 1.9 35.2 04.03.2006 13.7 39.0 1.0 35.1 17.03.2006 15.0 43.0 1.9 34.9 19.03.2006 15.0 43.0 2.3 34.9 09.11.2006 15.2 43.0 1.0 35.3 14.12.2006 13.9 38.0 2.1 36.6 11.01.2007 15.1 43.0 2.0 35.1 02.02.2007 15.1 39.0 1.4 38.7 04.02.2007 14.3 38.0 1.3 37.6 01.03.2007 16.1 46 2.3 35 19.07.2007 14.6 41.0 1.3 35.6 20.10.2007 14.7 40.0 1.9 36.8 15.11.2007 14.1 42.0 2.9 33.6 17.11.2007 14.4 43.0 3.8 33.5 24.11.2007 14.9 40.0 2.2 37.3 06.12.2007 14.5 42.0 1.3 34.5 07.12.2007 14.7 42.0 1.3 35.0 24.01.2008 14.6 42.0 2.8 34.8 08.02.2008 13.9 39.0 2.3 35.6 21.02.2008 14.7 43.0 2.0 34.2 23.02.2008 14.5 41.0 1.6 35.4 05.03.2008 14.3 40.0 2.7 35.8 17.09.2008 14.5 40.0 2.0 36.3 21.10.2008 14.9 42.0 2.4 35.5 13.11.2008 13.9 40.0 2.1 34.8 18.12.2008 15.3 44.0 2.2 34.8 08.01.2009 13.9 39.0 1.7 35.6 10.01.2009 14.3 40.0 2.2 35.8 11.01.2009 13.9 39.0 2.0 35.6 30.01.2009 14.5 41.0 2.4 35.4 31.01.2009 14.1 39.0 2.2 36.2 06.02.2009 14.6 41.0 3.5 35.6 07.02.2009 13.8 39.0 3.5 35.4 07.02.2009 (13.7) (37.0) (3.4) 37.0 18.02.2009 14.7 39.0 1.4 37.7
Mittel 14.6 40.8 2.1 35.8 14.5 40.9 1.9 35.5 14.6 39.8 2.0 36.7

14
4 Instances of increased haemoglobin concentration greater than 1 g/dl within 2 months
Six cases Six cases of an increasing haemoglobin concentration greater than 1 g/dl have been observed from 2000 to 2009. The first three cases of these have been mentioned by the judges of the CAS.
Case 1 European Championship in Collabo: The CAS-judges quote that the haemoglobin level increased from 13,9 at Dezember14th 2006 to 15,1 at January 11th 2007 .
Haemo- Hemato- Retics globin crit g/dl % %
Normal 12-16 36-48 0,5-1,4 Advia 120 Range 37-45 For athletes Limits 16.5 46 2,4 Limits ISU
09.11.2006 15.2 43 1.0 14.12.2006 13.9 38 2.1 Training 11.01.2007 15.1 43 2.0 EC Collabo 02.02.2007 15.1 39 1.4
This is no increase of the haemoglobin concentration. Instead of, this
is a case of especially low level of haemoglobin on December 14th.
Case 2 The CAS-judges quote that the haemoglobin level increased from 14,3 at February 4th to 16,1 g/dl at March 1st 2007
02.02.2007 15.1 39 1.4 04.02.2007 14.3 38 1.3 01.03.2007 16.1 46 2.3 19.07.2007 14.6 41 1.3
In contrats to the judges’ statement, this is an increase from 15,1 g/dl
to 16,1 g/dl, as can be depicted from the table just above. The lower haemoglobin level of February 4th results from physiological haemodilution after endurance sports. I think blood doping is rather unlikely in this situation since this was no doping test at a world championship. Why should Mrs. Pechstein use ESAs like erythropoietin prior to the last world cup race of the season.
15
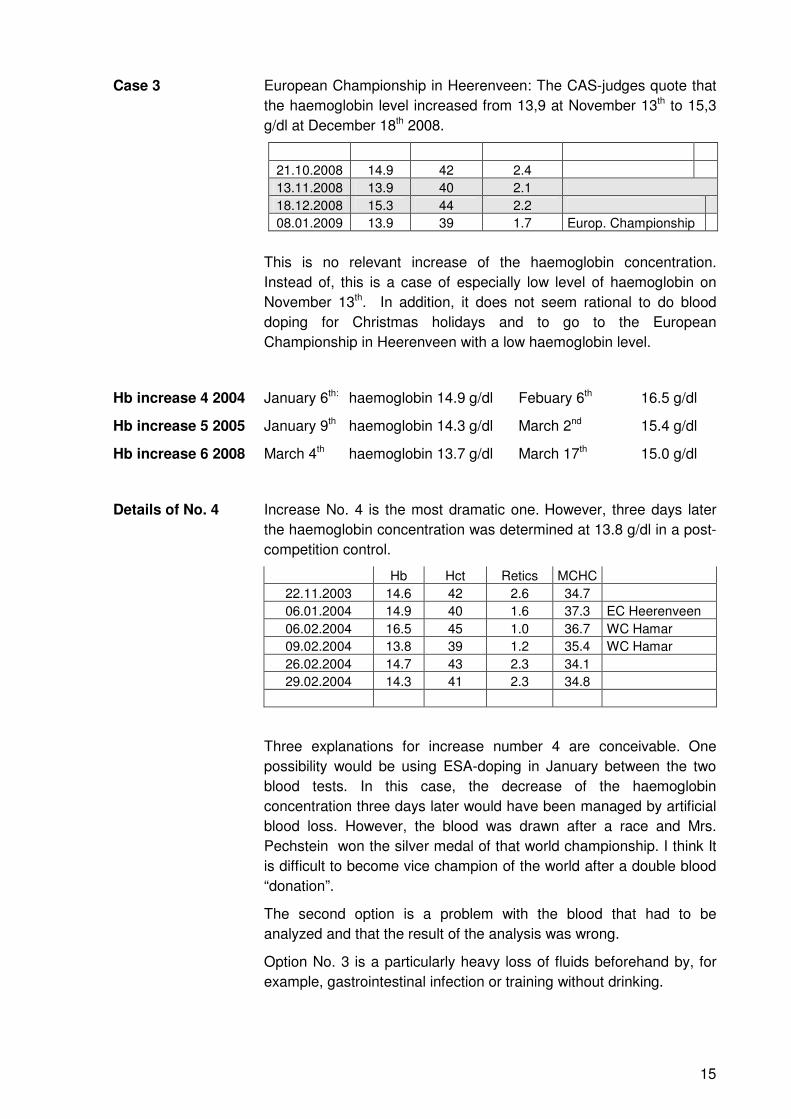
Case 3 European Championship in Heerenveen: The CAS-judges quote that the haemoglobin level increased from 13,9 at November 13th to 15,3 g/dl at December 18th 2008.
21.10.2008 14.9 42 2.4 13.11.2008 13.9 40 2.1 18.12.2008 15.3 44 2.2 08.01.2009 13.9 39 1.7 Europ. Championship
This is no relevant increase of the haemoglobin concentration.
Instead of, this is a case of especially low level of haemoglobin on November 13th. In addition, it does not seem rational to do blood doping for Christmas holidays and to go to the European Championship in Heerenveen with a low haemoglobin level.
Hb increase 4 2004 January 6th: haemoglobin 14.9 g/dl Febuary 6th 16.5 g/dl
Hb increase 5 2005 January 9th haemoglobin 14.3 g/dl March 2nd 15.4 g/dl
Hb increase 6 2008 March 4th haemoglobin 13.7 g/dl March 17th 15.0 g/dl
Details of No. 4 Increase No. 4 is the most dramatic one. However, three days later the haemoglobin concentration was determined at 13.8 g/dl in a post-competition control.
Hb Hct Retics MCHC 22.11.2003 14.6 42 2.6 34.7 06.01.2004 14.9 40 1.6 37.3 EC Heerenveen 06.02.2004 16.5 45 1.0 36.7 WC Hamar 09.02.2004 13.8 39 1.2 35.4 WC Hamar 26.02.2004 14.7 43 2.3 34.1 29.02.2004 14.3 41 2.3 34.8
Three explanations for increase number 4 are conceivable. One possibility would be using ESA-doping in January between the two blood tests. In this case, the decrease of the haemoglobin concentration three days later would have been managed by artificial blood loss. However, the blood was drawn after a race and Mrs. Pechstein won the silver medal of that world championship. I think It is difficult to become vice champion of the world after a double blood “donation”.
The second option is a problem with the blood that had to be analyzed and that the result of the analysis was wrong.
Option No. 3 is a particularly heavy loss of fluids beforehand by, for example, gastrointestinal infection or training without drinking.

16
Details of No. 5 Case No. 5 is a borderline one. However, the increase was observed at a world championship and is particularly suspect because of this. Unfortunately, the next control was done only after three months.
Details of No. 6 The "starting value" of case No.6 was particularly low, a week before he had a haemoglobin value of 14.8 g/dl, which is nearly identical to the incriminated higher concentration of 15,0 g/dl.
Conclusion Two suspicious looking haemoglobin increases have been observed in the observation period from 2000 to 2009: the increases number 4 and 5.

17
5 What happens after high reticulocyte counts above 2.4%?
If ESA-Epo-doping was the reason for the elevated reticulocytes above the ISU limits, the hemoglobin should increase about 1 g/dl or more. That was never the case. In fact, the mean hemoglobin within the next four weeks after suspicious reticulocytes is lower (14.3 g/dl) than in all other occurrences (14.6 g/dl). The same applies for hematocrit.
If the hemoglobin tends to be lower within one month after high reticulocyte values, this it doesn’t apply to the doping theory. On the contrary, this situation looks more like subclinical hemolytic constellation, which usually isn’t noticed.
Hemoglobin values at the time of high reticulocytes and during the next 2-4 weeks. No hemoglobin determinations
evailable after episodes 2, 3, 5, and 9
12
13
14
15
16
0 1 2 3 4 5 6 7 8 9 10 11Number of episode
Hem
oglo
bin
g/d
l
Hb at high retics Hb 2-4 weeks thereafter

18
Table: Episodes of high reticulocyte counts above the limit of 2.4% as defined by the ISU
Episode
Reticulocytes
% Haemoglobin
g/dl No. 1 10.11.2001 2.5 15.0
22.11.2001 13.9
No. 2 12.03.2003 2.6 13.9 No counts
No. 3 22.11.2003 2.6 14.6 No counts
No. 4 26.11.2004 2.7 14.5 06.01.2005 14.6
No. 5 24.08.2005 2.5 14.3 No counts
No. 6 26.11.2005 2.8 14.6 08.12.2005 13.7
No. 7 17.11.2007 3.8 14.4 24.11.2007 14.9 06.12.2007 14.5 07.12.2007 14.7
No. 8 24.01.2008 2.8 14.6 08.02.2008 13.9
No. 9 05.03.2008 2.7 14.3 No counts
No. 10 06.02.2009 3.5 14.6 18.02.2009 14.7

19
6 What about the reticulocyte counts one to three weeks before the highest haemoglobin values?
The next question was: What were the reticulocyte counts one to three weeks before the highest haemoglobin values?
If the highest haemoglobin values of the Athlete were a sign of ESA-epo doping, high reticulocytes before this time might show this. This, of course, is not mandatory. A low-dosed constant therapy with epo wouldn’t necessairily lead to high reticulocytes (see also Prof. Dr. Jelkmann).
Before high hemoglobin values the reticulocytes were always between 1.3 and 2.3%, the mean value is 1.8%. This is below the mean value in other situations (2.0%).
Reticulocyte counts 1 - 3 weeks prior to 12 episodes of relatively high hemoglobin levels above 15 g/dl -
no reticulocyte counts available prior to episodes 1 ,3, 6, 7, and 8
0
1
2
3
4
0 2 4 6 8 10 12
Episode nr
Ret
icul
ocyt
es %

20
Table: Episodes with haemoglobin concentrations above 15 g/dl (ISU-limit 16.5 gdl). Reticulocyte counts are are lower prior to high haemoglobin concentrations over 15 g/dl.
Episode
Reticulocytes
% Haemoglobin
g/dl No prior blood test available
No. 1 04.02.2000 15.3 05.02.2000 1.7 06.02.2000 1.8
No. 2 03.03.2000 15.1 No prior blood test available
No. 3 08.11.2002 15.5 05.01.2003 1.3
No. 4 02.02.2003 15.2 06.01.2004 1.6
No. 5 06.02.2004 16.5 No prior blood test available
No. 6 02.03.2005 15.4 No prior blood test available
No. 7 06.07.2005 15.4 No prior blood test available
No. 8 09.11.2006 15.2 14.12.2006 2.1
No. 9 11.01.2007 15.1 11.01.2007 2
No. 10 02.02.2007 15.1 04.02.2007 1.3
No. 11 01.03.2007 16.1 13.11.2008 2.1
No. 12 18.12.2008 15.3

21
7 World Championship in Hamar 2009
Prior to Hamar Mrs. Pechstein had five doping controls including determination of the blood counts in January 2009, the month prior to the World Championship of Hamar. The first three controls were performed at the European Championships in Heerenveen during the second week of January. Further checks were done at a world cup event on January 30th and 31st.
Hamar The first doping test at the Hamar championship was done on February 6th and showed a very high reticulocyte count of 3.5%. This count was confirmed at the following day immediately after a 3000m race.
After Hamar A few days later, on February 18th, another blood test was done showing a reticulocyte count of 1.37% without a rise of haemoglobin concentration.
The following table and the corresponding figure show that there was no increase of haemoglobin concentration and of haematocrit during January 2009. In addition, they show no haematology profile of ESA doping aiming at “good” blood counts for the Hamar championship. “Optimizing” blood volume and haemoglobin concentration for Hamar would have required high reticulocytes one (and two) weeks prior to that event.
Normal ranges according to the text book “Labor und Medizin” of Prof. Dr. Lothar Thomas 7. Auflage 2008
Haemo- Haemato- Reticulo- globin crit cytes g/dl % %
Normal 12-16 36-48 0,5-1,4 range 37-45 Normal for athletes Limits 16.5 46 2,4 Limits of the ISU
08.01.2009 13.9 39 1.7 Europ. Championship 10.01.2009 14.3 40 2.2 Europ. Championship 11.01.2009 13.9 39 2.0 Europ. Championship 30.01.2009 14.5 41 2.4 31.01.2009 14.1 39 2.2 06.02.2009 14.6 41 3.5 World Championship 07.02.2009 13.8 39 3.5 World Championship 07.02.2009 13.7 37 3.4 World Championship 18.02.2009 14.7 39 1.4

22
Blood counts December 2008 bis Februar 2009Haemoglobin (g/dl), Haematocrit (%), Retics (per 1.000 erys)
0
10
20
30
40
50
8.12.08 28.12.08 17.1.09 6.2.09 26.2.09
HbHctReti
Prof. Dr. med. Winfried Gassmann
.
23
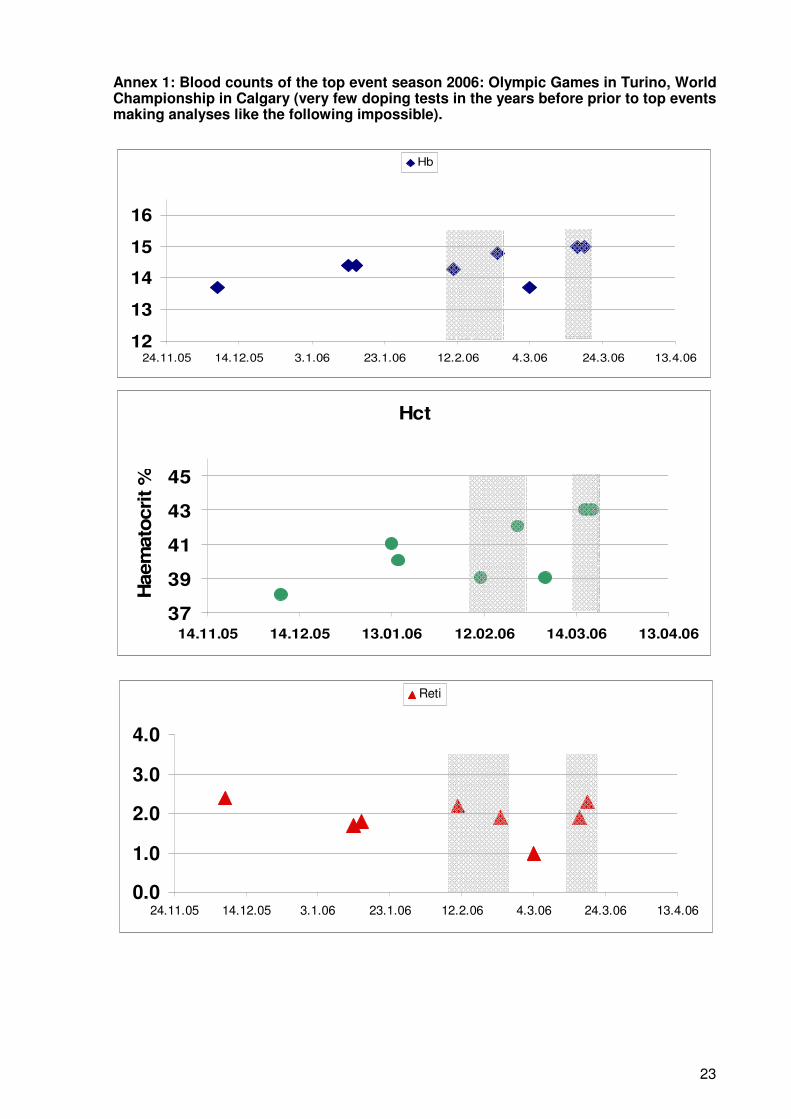
Annex 1: Blood counts of the top event season 2006: Olympic Games in Turino, World Championship in Calgary (very few doping tests in the years before prior to top events making analyses like the following impossible).
Hct
37
39
41
43
45
14.11.05 14.12.05 13.01.06 12.02.06 14.03.06 13.04.06
Hae
mat
ocri
t %
12
13
14
15
16
24.11.05 14.12.05 3.1.06 23.1.06 12.2.06 4.3.06 24.3.06 13.4.06
Hb
0.0
1.0
2.0
3.0
4.0
24.11.05 14.12.05 3.1.06 23.1.06 12.2.06 4.3.06 24.3.06 13.4.06
Reti

24
Annex 2: Blood counts of the top event season 2008: World Championships in Berlin and Nagano (no participation in a top event in 2007)
Hb
12,0
14,0
16,0
14.11.07 4.12.07 24.12.07 13.1.08 2.2.08 22.2.08 13.3.08
Hb
Hkt
384042444648
14.11.07 4.12.07 24.12.07 13.1.08 2.2.08 22.2.08 13.3.08
Hkt
Reti
0,0
1,0
2,0
3,0
4,0
14.11.07 4.12.07 24.12.07 13.1.08 2.2.08 22.2.08 13.3.08
Reti

25
Annex 3
Official blood counts of the ISU doping control system
Hb Hct Retics MCHC Medals g/dl % %
Normal 12-16 36-48 32-36 Text book of Lothar Thomas “Labor und Medizin
range 37-45 Normal range ofrathletes 0,6-2,2 Pentra 120 0,6-1,8 Gen-S 0,4-1,6 SE 9500 0,6-2,4 CD 4000 0,5-1,4 Advia 120
Limits of ISU 16.5 46 2,4
04.02.2000 15.4 43 2.3/2.5 36.1 WC Milwaukee (Combined) 05.02.2000 15.0 41 1.7 36.6 WC Milwaukee (Combined) 06.02.2000 15.3 42 1.8 36.4 WC Milwaukee (Combined)
} 1x Gold
03.03.2000 15.1 43 2.2 35.1 WC Nagano (Einzel) 04.03.2000 14.7 42 2.2 34.9 WC Nagano (Einzel) 06.03.2000 14.8 42 2.2 35.2 WC Nagano (Einzel)
} 2x Gold, 1x Silver
01.02.2001 14.4 41 1.5 35.2 * 02.02.2001 14.6 41 1.6 35.6
08.03.2001 14.0 39 1.6 35.9 WC Salt Lake City (Einzel) 1x Silver, 1x Bronce
09.11.2001 14.7 44 2.4 33.4 10.11.2001 15.0 42 2.5 35.6 22.11.2001 13.9 40 2.3 34.8 06.02.2002 14.4 40 2.1 36.0 Olympic Games Salt Lake City 10.02.2002 14.4 40 2.0 36.0 Olympic Games Salt Lake City 19.02.2002 14.3 40 2.0 35.8 Olympic Games Salt Lake City 22.02.2002 14.4 40 2.1 36.0 Olympic Games Salt Lake City
} 2x Gold
07.03.2002 14.7 41 1.9 35.9 09.03.2002 14.6 40 2.0 36.5 10.03.2002 14.4 40 2.0 35.9 08.11.2002 15.5 42 1.6 36.9 09.11.2002 14.7 40 1.6 36.8 10.11.2002 14.5 40 1.6 36.3 22.11.2002 13.9 40 1.5 34.7 23.11.2002 14.6 42 1.7 34.7 02.01.2003 14.9 44 1.7 33.9 EC Heerenveen (Combined) 05.01.2003 14.5 43 1.3 33.8 EC Heerenveen (Combined) } 1x Silver
02.02.2003 15.2 40 1.6 38.1 Training 07.02.2003 15.0 42 1.8 35.7 WC Göteburg (Combined) 08.02.2003 13.9 38 2.0 36.4 WC Göteburg (Combined) 09.02.2003 14.0 40 2.1 35.0 WC Göteburg (Combined)
} 1x Silver
06.03.2003 13.9 41 1.3 34.0 07.03.2003 14.1 40 1.9 35.3 12.03.2003 13.9 38 2.6 36.5 Training

26
24.09.2003 14.7 40 2.1 36.8 Training 05.11.2003 14.2 37 2.2 38.5 Training 07.11.2003 14.9 42 1.6 35.5 20.11.2003 14.4 42 2.4 34.2 22.11.2003 14.6 42 2.6 34.7 06.01.2004 14.9 40 1.6 37.3 EC Heerenveen (Combined) 1x Silver 06.02.2004 16.5 45 1.0 36.7 WC Hamar (Combined) 09.02.2004 13.8 39 1.2 35.4 WC Hamar (Combined) } 1x Silver
26.02.2004 14.7 43 2.3 34.1 29.02.2004 14.3 41 2.3 34.8 09.09.2004 14.4 40 1.7 36.0 Training 20.09.2004 14.1 39 1.9 36.2 Training 13.10.2004 14.1 38 1.7 37.1 Training 05.11.2004 14.9 40 2.3 37.3 Training 12.11.2004 14.4 41 1.1 35.1 26.11.2004 14.5 41 2.7 35.4 06.01.2005 14.6 40 1.5 36.5 EC Heerenveen (Combined) 09.01.2005 14.3 40 1.9 35.8 EC Heerenveen (Combined) } 1x Bronce
02.03.2005 15.4 43 1.9 35.8 WC Inzell (Einzel) 2x Silver 06.07.2005 15.4 42 1.4 36.7 Training 24.08.2005 14.3 40 2.5 35.8 Training 18.11.2005 13.8 39 1.9 35.4 26.11.2005 14.6 39 2.8 37.4 Training 08.12.2005 13.7 38 2.4 36.1 13.01.2006 14.4 41 1.7 35.1 EC Hamar (Combined) 15.01.2006 14.4 40 1.8 36.0 EC Hamar (Combined) } 1x Gold
11.02.2006 14.3 39 2.2 36.7 Olympic Games Turin 23.02.2006 14.8 42 1.9 35.2 Olympic Games Turin } 1x Gold,
1x Silver 04.03.2006 13.7 39 1.0 35.1 17.03.2006 15.0 43 1.9 34.9 WC Calgary (Combined) 19.03.2006 15.0 43 2.3 34.9 WC Calgary (Combined) } 1x Silver
09.11.2006 15.2 43 1.0 35.3 14.12.2006 13.9 38 2.1 36.6 Training 11.01.2007 15.1 43 2.0 35.1 EC Collabo (Combined) --- 02.02.2007 15.1 39 1.4 38.7 04.02.2007 14.3 38 1.3 37.6 01.03.2007 16.1 46 2.3 35.0 19.07.2007 14.6 41 1.3 35.6 Training 20.10.2007 14.7 40 1.9 36.8 Training 15.11.2007 14.1 42 2.9 33.6 17.11.2007 14.4 43 3.8 33.5 24.11.2007 14.9 40 2.2 37.3 Training 06.12.2007 14.5 42 1.3 34.5 07.12.2007 14.7 42 1.3 35.0 24.01.2008 14.6 42 2.8 34.8 08.02.2008 13.9 39 2.3 35.6 WC Berlin (Combined) --- 21.02.2008 14.7 43 2.0 34.2 23.02.2008 14.5 41 1.6 35.4 05.03.2008 14.3 40 2.7 35.8 WC Nagano (Einzel) 17.09.2008 14.5 40 2.0 36.3 Training 21.10.2008 14.9 42 2.4 35.5 Training 13.11.2008 13.9 40 2.1 34.8 18.12.2008 15.3 44 2.2 34.8 Training

27
08.01.2009 13.9 39 1.7 35.6 EC Heerenveen (Combined) 10.01.2009 14.3 40 2.2 35.8 EC Heerenveen (Combined) 11.01.2009 13.9 39 2.0 35.6 EC Heerenveen (Combined)
} 1x Gold
30.01.2009 14.5 41 2.4 35.4 31.01.2009 14.1 39 2.2 36.2 06.02.2009 14.6 41 3.5 35.6 WC Hamar (Combined) 07.02.2009 13.8 39 3.5 35.4 WC Hamar (Combined) 07.02.2009 13.7 37 3.4 37.0 WC Hamar (Combined)
}
18.02.2009 14.7 39 1.4 37.7 Training
Mittelwerte 14.5 40.7 2.0 35.8 * no text: Results obtained at world cup events