Embed Size (px)
Citation preview


Classification of Significant Water Resources in the Upper Middle and Lower Vaal WMAs Inception Report
Final Inception Report V20 March 2011
ii
Classification of Significant Water Resources (River, Wetlands,
Groundwater and Lakes) in the Upper, Middle and Lower Vaal
Water Management Areas (WMA) 8,9,10
Inception Report
March 2011
(FINAL)
Copyright reserved
No part of this publication may be reproduced in any manner
without full acknowledgement of the source
REFERENCE
This report is to be referred to in bibliographies as:
Department of Water Affairs, South Africa, March 2011. Classification of Significant
Water Resources (River, Wetlands, Groundwater and Lakes) in the Upper, Middle
and Lower Vaal Water Management Areas (WMA) 8, 9, 10: Inception Report
Prepared by:
WRP Consulting Engineers (Pty) Ltd in association with DMM Development Consultants
CC, Rivers for Africa eFlows Consulting (Pty) Ltd, Conningarth Economists, Koekemoer
Aquatic Services and Zitholele Consulting (Pty) Ltd.
Report No. RDM/WMA8,9,10/00/CON/CLA/0111
INCEPTION REPORT:
Report number: RDM/WMA8,9,10/00/CON/CLA/0111


Classification of Significant Water Resources in the Upper Middle and Lower Vaal WMAs Inception Report
Final Inception Report V20 March 2011
iv
MANAGEMENT AND STEERING COMMITTEES
Project Management Committee
Shane Naidoo Department of Water Affairs Director: Water Resource Classification Tovhowani Nyamande Department of Water Affairs Project Manager Lawrence Mulangaphuma Department of Water Affairs Project Co-ordinator
Project Team
Pieter van Rooyen WRP Consulting Engineers (Study Leader) Susan Swart WRP Consulting Engineers Andre Joubert Zitholele Consulting Delana Louw Rivers for Africa eFlow William Mullins Conningarth Economists Darius Mnguni DMM Development Consultants Shael Koekemoer Koekemoer Aquatic Services
Members of Project Steering Committee (Refer to Appendix G for list of members)

Classification of Significant Water Resources in the Upper Middle and Lower Vaal WMAs Inception Report
Final Inception Report V20 March 2011
v
Classification of Significant Water Resources (River, Wetlands,
Groundwater and Lakes) in the Upper, Middle and Lower Vaal
Water Management Areas (WMA) 8,9,10
Inception Report
TABLE OF CONTENTS
1 INTRODUCTION ....................................................................................................... 1
1.1 OVERVIEW ................................................................................................................ 1
1.2 PURPOSE OF THE STUDY ....................................................................................... 1
1.3 PURPOSE AND LAYOUT OF THE REPORT ............................................................ 2
1.4 STUDY AREA ............................................................................................................ 2
2 BACKGROUND ........................................................................................................ 5
2.1 OVERVIEW ................................................................................................................ 5
2.2 PREVIOUS AND PARALLEL STUDIES .................................................................... 5
3 INFORMATION REVIEW AND DATA REQUIREMENTS ........................................ 7
4 STUDY PARAMETERS .......................................................................................... 11
4.1 METHODOLOGY FOR EXTRAPOLATING EWRS FOR ADDITIONAL SITES ...... 11
4.2 INTEGRATED UNITS OF ANALYSIS ..................................................................... 12
4.2.1 Approach in identification of IUAs .......................................................................................... 12
4.2.2 Upper Vaal IUAs .................................................................................................................... 12
4.2.3 Middle Vaal IUAs .................................................................................................................... 14
4.2.4 Lower Vaal IUAs .................................................................................................................... 14

Classification of Significant Water Resources in the Upper Middle and Lower Vaal WMAs Inception Report
Final Inception Report V20 March 2011
vi
4.3 SELECTION OF EXTRAPOLATION NODES (SITES) ......................................
4.4 DEFINITION OF SCENARIOS ................................................................................. 15
5 STUDY PROCEDURE ............................................................................................ 15
5.1 OVERVIEW .............................................................................................................. 15
5.2 CROSS REFERENCE WITH THE PROPOSAL ...................................................... 17
6 SCOPE OF WORK ................................................................................................. 17
6.1 TASK 1: PROJECT INCEPTION ............................................................................. 17
6.2 TASK 2: WATER RESOURCE INFORMATION AND DATA GATHERING ............ 18
6.3 TASK 3: DETERMINATION OF THE MANAGEMENT CLASS .............................. 18
6.3.1 Task 3a (Step 1): Delineate units of analysis and describe the status quo ........................... 19
6.3.2 Task 3b (Step 2): Link value and condition ............................................................................ 22
6.3.3 Task 3c (Step 3): Quantify Ecological Water Requirements (EWRs) and changes in non-
water quality Ecosystem Goods, Services and Attributes (EGSAs) ...................................... 25
6.3.4 Task 3d (Step 4): Set Ecological Sustainability Base Configuration (ESBC) scenario and
establish starter configurations .............................................................................................. 26
6.3.5 Task 3e: Evaluate scenarios within the Integrated Water Resource Management (IWRM)
process ................................................................................................................................... 28
6.3.6 Task 3f: Evaluate scenarios with stakeholders ...................................................................... 30
6.3.7 Task 3g: Gazette class configuration ..................................................................................... 30
6.4 TASK 4: COMMUNICATION AND LIAISON ........................................................... 31
6.4.1 Stakeholder identification and database ................................................................................ 32
6.4.2 Announce the project ............................................................................................................. 33
6.4.3 Issues and Responses Report ............................................................................................... 33
6.4.4 Evaluation of scenarios with stakeholders – Step 6 of WRCS process ................................. 33
6.5 TASK 5: CAPACITY BUILDING .............................................................................. 36
6.6 TASK 6: STUDY MANAGEMENT AND CO-ORDINATION .................................... 38
7 STUDY PROGRAMME ........................................................................................... 38
8 STUDY COSTS ....................................................................................................... 39

Classification of Significant Water Resources in the Upper Middle and Lower Vaal WMAs Inception Report
Final Inception Report V20 March 2011
vii
8.1 PROFESSIONAL FEES ........................................................................................... 39
8.2 DISBURSEMENTS ................................................................................................... 40
8.3 COMPARISON OF COSTS ...................................................................................... 41
8.4 SUMMARY OF COSTS ............................................................................................ 42
8.5 CASH FLOW PROJECTION .................................................................................... 42
9 STUDY RISKS, UNCERTAINTIES AND QUALIFICATION ................................... 43
10 REFERENCES ........................................................................................................ 45
LIST OF APPENDICES
Appendix A: Study Program
Appendix B: Organogram
Appendix C: Summary of Human Resources Breakdown
Appendix D: Catchment Maps of the Integrated Units of Analysis
Appendix E: Description of Integrated Vaal River System
Appendix F: Inception Report Comments and Response Summary
Appendix G: Members of Project Steering Committee

Classification of Significant Water Resources in the Upper Middle and Lower Vaal WMAs Inception Report
Final Inception Report V20 March 2011
viii
ABBREVIATIONS
Acronym Meaning
AOA Annual Operating Analysis
BBM Building Block Methodology
CMA Catchment Management Agency
CMS Catchment Management Strategy CV Coefficient of Variability Dir: NWRP Directorate: National Water Resource Planning Dir: WRPS Directorate: Water Resource Planning Systems Dir: RDM Directorate: Resource Directed Measures DRM Desktop Reserve Model DSC Dead Storage Capacity DWA Department of Water Affairs EC Ecological Category EGSA Ecosystem Goods, Services and Attributes EIS Ecological Importance and Sensitivity ER Ecological Reserve ESBC Ecological Sustainability Base Configuration EWR Ecological Water Requirements FSL Full Supply Level GFSC Gross Full Supply Capacity GGP Gross Geographic Product HFSR Habitat Flow Stressor Response HFY Historic Firm Yield ISP Internal Strategic Perspective IUA Integrated Unit of Analysis IVRS Integrated Vaal River System IWRM Integrated Water Resource Management LIM Limnophilic Fish Species LHDA Lesotho Highlands Development Authority LHWP Lesotho Highlands Water Project LSR Large Semi‐rheophilic Fish Species MAE Mean Annual Evaporation MAP Mean Annual Precipitation MAR Mean Annual Runoff MOL Minimum Operating Level MVI Marginal Vegetation Macroinvertebrate NFSC Net Full Supply Capacity NWA National Water Act
NWRS National Water Resources Strategy
PES Present Ecological State REC Recommended Ecological Category RU Resource Unit SD Standard Deviation TDS Total Dissolved Solids VRESAP Vaal River Eastern Sub‐system Augmentation Project VRESS Vaal River Eastern Sub‐system VRSAU Vaal River System Analysis Update WDM Water Demand Management WC Water Conservation
WMA Water Management Area

Classification of Significant Water Resources in the Upper Middle and Lower Vaal WMAs Inception Report
Final Inception Report V20 March 2011
ix
Acronym Meaning
WRC Water Research Commission WRCS Water Resource Classification System WRPM Water Resource Planning Model WRSAS Water Resource Situation Assessment Study WRSM2000 Water Resources Simulation Model 2000 WRYM Water Resource Yield Model WUA Water User Association

Classification of Significant Water Resources in the Upper Middle and Lower Vaal WMAs Inception Report
Final Inception Report V20 March 2011
1
Classification of Significant Water Resources (River, Wetlands,
Groundwater and Lakes) in the Upper, Middle and Lower Vaal
Water Management Areas (WMA) 8, 9, 10
Inception Report
1 INTRODUCTION
1.1 OVERVIEW
This Inception Report describes the proposed work to be undertaken by the appointed Professional Service
Provider (PSP) for undertaking the Classification of Significant Water Resources (River, Wetlands, Groundwater
and Lakes) in the Upper, Middle and Lower Vaal Water Management Areas (WMA) 8,9,10 Study. The study
was commissioned by the Chief Directorate: Resource Directed Measures of the Department of Water Affairs
(DWA) and the PSP team consists of WRP Consulting Engineers (Pty) Ltd in association with DMM
Development Consultants CC, Rivers for Africa eFlows Consulting (Pty) Ltd, Conningarth Economists,
Koekemoer Aquatic Services and Zitholele Consulting (Pty) Ltd.
The work description in the report is based on the identification that the data received for the Middle and Lower
Vaal WMA on 18 March 2011 covers the data needs for the application of the proposed methods. During the
execution of the activities and tasks of the study the data and information will be evaluated for consistency and
any irresolvable anomalies and deficiencies will be brought under the attention of the Client for clarification by
the data and information originators.
1.2 PURPOSE OF THE STUDY
It is the Consultant’s understanding that the main objective of the study is to determine the Management Class
of the significant water resources in the three Vaal WMAs over a period of 24 months, which includes the
following main components:
Inception phase;
Water resource information and data sourcing;
Implementation of the seven step Water Resource Classification System (WRCS);
Communication and liaison;
Capacity building; and
Project management to ensure effective execution of the work and quality deliverables.

Classification of Significant Water Resources in the Upper Middle and Lower Vaal WMAs Inception Report
Final Inception Report V20 March 2011
2
It is proposed that the description of the study area will include a synopsis of the current socio-economic
situation in the project area. As the project area includes the most important economic region of the country
data will be collected and analysed in terms of the three Water Management Areas as well as the tributaries and
main stem areas in the project area. Specific attention will be given to water use in the Water Management
Areas.
1.3 PURPOSE AND LAYOUT OF THE REPORT
The purpose of the Inception Report is to define the extend of work and associated costs based on the
proposed methodology and availability of information, data as well as initial evaluations for that was carried out
after the submission of the Proposal. Section 2 of the Inception Report presents a brief background and lists
previous and other current parallel studies that will be considered in this assignment. Section 3 provides the
information and data requirements followed by Section 4 defining important study parameters including the
Integrated Units of Analysis (IUA). Section 5 and 6 describe the extent of work, with the study programme
presented in Section 7. The proposed budget with all the related information is described in Section 8 and
finally, risks and uncertainties are presented in Section 9 while the references are listed in Section 10.
1.4 STUDY AREA
The study area comprises of the water resource of the Vaal River System which includes the catchments of the
Upper, Middle and the Lower Vaal Water Management Areas (see yellow shaded area in Figure 1.1). Other
sub-systems that also form part of the Integrated Vaal River System (IVRS) or are linked to the Vaal River
System are indicated on Figure 1.1. These linked sub-systems will form part of the water resource system
analysis (either directly or indirectly) to ensure the Management Class is determined in an integrated manner.
A concise description of the water resource infrastructure of the IVRS, the hydrological database available for
the study area and water requirements of user groups were compiled as part of “Water Resource Modelling”
report of the Comprehensive Reserve Determination Study (DWA, 2010a) and are repeated in Appendix E for
easy reference purposes.
The Vaal River is one of the most highly utilised rivers in the country and this has resulted in a moderate to
severe degradation of ecological state in most sections of the main river and tributaries. Isolated important
areas do occur however centered around, for example, reserves, wetlands and less disturbed areas. The Vaal
River is one of South Africa's largest rivers, and due to the scarceness of such river types in SA, this makes it
important in its own right, irrespective of its state. Protection of these resources in some acceptable form, even
as a heavily utilised river, is important. It must also be noted that Barbus kimberleyensis, the largemouth yellow
fish, occurs in the Vaal River. This fish is Red Data listed (IUCN 2010) and is also a very popular flyfishing
target. Furthermore, the Vaal River forms a centre part of one of South Africa's few World Heritage sites, the
Vredefort Dome (UNESCO 2005). Pollution of the Vaal River and unstructured development might affect the
status of the World Heritage site which could result in severe socio-economic problems (job losses amongst
others).
Water quality problems, decreased flows (lower Vaal River) and increased flows (higher than natural especially
in the dry season resulting in an aseasonal flow regime) are the major problems threatening the health of the
Vaal System. South Africa, as a signatory of the Convention of Biodiversity (CBD, 1992) is obliged to determine

Classification of Significant Water Resources in the Upper Middle and Lower Vaal WMAs Inception Report
Final Inception Report V20 March 2011
3
strategies to maintain and protect its biodiversity.
Water quality status in the Upper Vaal catchment is impacted on by discharges from gold mines, seepages from
tailings dams, discharges from industry directly to the river, urban runoff and discharges from the large number
of sewage treatment plants located in the urban areas. The return flows from sewage treatment plants have
resulted in the flows in many of the river systems exceeding the natural flows. Coal mining is located in the
Waterval and Grootdraai Dam catchments in the upper reaches of the Vaal River, along the banks of the Vaal
Barrage below Vaal Dam (ORASECOM, 2007; cited in Scherman, 2010).
Although the Middle Vaal is less urbanized, discharges from mining operations and sewage treatment facilities
still predominate. The predominant land use in the Lower Vaal is agriculture, with extensive irrigation schemes
located on the Vaal River and along the Harts River (ORASECOM, 2007; cited in Scherman 2010). The
following points summarize water quality status of the Vaal River (Scherman, 2010):
The usage of water in the Vaal River is impacted by high levels of salinity and related macro-ions, which
has major implications for domestic, industrial and agricultural water use.
Eutrophication due to high nutrient levels is a key issue in the Vaal River, resulting in algal blooms and
growth of water hyacinth. The algae resulting from eutrophication has led to odour and colour problems
in the intake water to water treatment plants which are not geared for dealing with eutrophic waters.
Microbiological pollution is an emerging concern.
While sections of the upper part of the Vaal catchment have water of a good quality, the areas of
concern include the Vaal Barrage and Lower Vaal River downstream of Harts River confluence.
Elevated TDS concentrations are a concern for users downstream of the Vaal Barrage.
Discharges from coal and gold mining, industrial discharges and decant from mines post closure, cause
water quality problems in the Vaal system.
Along the main stem of the Vaal organics has been raised as an issue by the water boards, with
monitoring programmes identifying increases in Dissolved Organic Carbon (DOC) in raw intake water to
the water treatment plants.
Classification of Significant Water Resources in the Upper Middle and Lower Vaal WMAs Inception Report
Final Inception Report V20 March 2011
4
Figure 1.1: Location Map of the Vaal River System and linked sub-systems
Existing Transfer Schemes
Proposed Transfer Schemes Mokolo Catchment
Crocodile CatchmentVaal Catchment

Classification of Significant Water Resources in the Upper Middle and Lower Vaal WMAs Inception Report
Final Inception Report V20 March 2011
5
2 BACKGROUND
2.1 OVERVIEW
The promulgation of the Regulations for the Establishment of the Water Resource Classification System
(WRCS) in the Government Gazette dated 17 September 2010 paved the way for the DWA to undertake a step
wise process of classifying the water resources of South Africa. This study is one of three commissioned during
2010 by the DWA and these studies are the first to implement the WRCS in the country to give effect to Section
12 of the National Water Act (Act 36 of 1998).
The seven step procedure for determining the water resource class and the associated guideline documentation
were reviewed by the respective specialists who then formulated the specific methodologies applicable to the
Vaal River System as described in this Inception Report. A key consideration in defining the activities, tasks
and cost estimates was to rely on the availability of specific information and data from several past studies of
which the most important source is the recently completed Comprehensive Reserve Determination Study.
The scale at which the analysis will be undertaken was selected in line with the resolution of the available data
(the existing water resource simulation model’s resolution was a key factor) as well as the main water resource
features in the Vaal River System. This informed the identification of the Integrated Units of Analysis (IUA) and
will be used to determine the associated additional Ecological Water Requirement nodes (sites).
The approach adopted is that new Ecological Water Requirement (EWR) nodes will be analysed by applying the
extrapolation method that has already been implemented in the Upper Vaal WMA and in other catchments in
the country. Details of this method can be found in (Hughes et.al, 2006) and (Louw et.al. 2006).
2.2 PREVIOUS AND PARALLEL STUDIES
The Vaal River System has been the subject of various studies in the past of which the recently completed
Comprehensive Reserve Determination Study (study consisting of various separate appointments covering the
surface water, groundwater, water resource system analysis as well as water quality aspects) is the most
important source of information and data repository for this assignment.
Other previous and current studies that will be taken into consideration in the classification of the resources are
listed below:
Recently completed studies:
Vaal River System: Large Bulk Water Supply Reconciliation Strategy - several reports including
(DWAF, 2008a).
Integrated Water Quality Management Plan Study (DWAF, 2008b).
Comprehensive Reserve Determination Study of the Integrated Vaal River System – several reports
including (DWA, 2010a).

Classification of Significant Water Resources in the Upper Middle and Lower Vaal WMAs Inception Report
Final Inception Report V20 March 2011
6
Crocodile (West) River Reconciliation Strategy Version 1 (DWAF 2008c).
Study commissioned by DWAF in the year 2005 to undertake a Situation Assessment for the Schoonspruit
System and including a Reserve determination component.
Waterval Reserve Determination Study (DWAF, 2005).
Current parallel studies or processes:
Maintenance of the Vaal River System Reconciliation Strategy Study managed by the Directorate: National
Water Resource Planning of DWA.
Vaal River Annual Operating Analysis Study managed by the Directorate: Water Resources Planning
Systems of DWA.
Maintenance of the Crocodile West River System Reconciliation Strategy Study managed by the
Directorate: National Water Resource Planning of DWA.
Study to address and eradicate unlawful water use in the three Vaal Water Management Areas. Referenced
in the minutes of the Vaal River System Strategy Steering Committee meeting held on 21 October 2010.
Investigation of Bottlenecks on the Usutu GWS and Usutu Vaal Phase II GWS – several draft reports
including (DWA 2010b).
Inter Ministerial Committee (IMC) (supported by a team of specialists) to address the acid mine drainage
(AMD) issue.
Orange-Senqu River Commission (ORASECOM) study with the title “Support to Phase 2 of the
ORASECOM Basin-wide Integrated Water Resources Management Plan” funded by GTZ. This study is
extending the hydrological database and updating the water resources models accordingly.

Classification of Significant Water Resources in the Upper Middle and Lower Vaal WMAs Inception Report
Final Inception Report V20 March 2011
7
3 INFORMATION REVIEW AND DATA REQUIREMENTS
Table 3.1 lists the information and data required for the execution of the work according to the methods
presented in Section 6.
An assessment of the data and information received on 18 March 2011 for the Middle and Lower Vaal indicated
that all the data and information elements that are necessary for the execution of the work are available. During
the execution of the activities and tasks an evaluation of the consistency of the data will be carried out as a
mater of course and any irresolvable anomalies and deficiencies will be brought under the attention of the Client
for clarification by the originators.
It was also identified that the same data elements listed in Table 3.1 would be required from other reserve
determination studies that were carried out in the three Vaal WMAs (these were not part of recent Vaal River
studies). These studies were conducted on the Schoonspruit, Waterval and Renoster river catchments.
Request for this data was made internally in DWA as well as to the authors of those studies and an evaluation
will be carried during the execution of the work once the data is received.
Data sources to be used for the assessment of the significant groundwater resources will be from existing detail
hydrological studies, water use data from WARMS or the current Validation and Verification studies, appropriate
groundwater characteristics data from the GRA2 and other countrywide databases, geological maps, Google
Earth images and any detail studies carried out in the areas.
The information needs for the annual balance calculations (groundwater assessment) in the catchment area of
the Molopo River (Lower Vaal WMA) will be based on the GRA2 database, the Vegter maps of harvest potential
and exploitable potential.
The study team has been responsible for the Comprehensive Reserve Determination study of the Upper Vaal
WMA and also undertook the water resource analysis of the entire Vaal River System. All the relevant
information and data from these studies is therefore available and assessable.

Classification of Significant Water Resources in the Upper Middle and Lower Vaal WMAs Inception Report
Final Inception Report V20 March 2011
8
Table 3.1: Summary of information and data requirements
Data element and Description Importance /
requirement rating Comments
Reports
Desktop EcoClassification report Essential Provides the hotspots on a catchment bases which considers a combination of ecological, socio-cultural and water resource use importance.
Basic Human Needs report Required
Resource Units delineation Essential Delineates the key rivers (identified through Desktop EcoClassification) into river stretches for which an EWR generated for an EWR site will be relevant.
Wetland Classification report Essential Provides on a catchment scale the Present Ecological State (PES) and Ecological Importance and Sensitivity (EIS) for each quaternary catchment for wetlands.
EcoClassification at level 4 for the EWR sites Essential Provides the detailed PES & EIS as well as scenarios at each EWR site. Supported by all the Excel models.
Ecological Water Requirements Scenario report Essential Report on the EWR results for various Ecological Categories (different levels of ecological health) at each EWR site. Supported by a range of models which is also required.
Ecological and G&S consequences Essential Provides the ecological and G&S consequences for a range of operational scenarios. Models also required
Socio-Economic consequences Required Socio-economic consequences for each operational scenario
Main report Required
Water quality report
Essential
Report on all the water quality data collected during the study, present state assessments, water quality consequences under operational scenarios and hot spot areas.

Classification of Significant Water Resources in the Upper Middle and Lower Vaal WMAs Inception Report
Final Inception Report V20 March 2011
9
Data element and Description Importance /
requirement rating Comments
Desktop EcoClassification
Photos and Range of photographs, each with an individual name which can be linked to the above Excel file for explanations
Required This supports the evaluation and review of the areas identified as hotspots indexed
description
Database with the Desktop Ecoclassification models and all results.
The models and the results must be cross referenced to the descriptions in the report.
Essential Database with the Desktop EcoClassification models included and provides the ratings for each quaternary catchment.
Resource Units
Photographs at each EWR
Photos indexed and dated that were taken during each site visit.
Essential This supports the review and use of EWR results - especially as these sites will not be visited. The associated flow in the river at each
sites also need to be provided.
Benchmarks Photographs and description of locality of benchmarks
Required
Ecological Classification
FRAI
Model for each site and for each Ecological Category that were assessed in terms of flow. The models for the AECs or Recommended Ecological Class should have the metrics that changed from the Present Ecological State highlighted. All supporting data and analyses for the PAI (water quality assessment) should be included.
Essential
Provides the ratings for each scenario. Without these models, additional scenarios cannot be evaluated as part of the Vaal Classification system
MIRAI Essential
VEGRAI4 Essential
GAI4 Essential
PAI Essential
Ecological Status
Essential
EIS Essential
IHI Essential
Fish raw data Raw data in standard fish forms required (included also habitat ratings)
Essential
Invertebrate raw data
SASS sheets required Essential

Classification of Significant Water Resources in the Upper Middle and Lower Vaal WMAs Inception Report
Final Inception Report V20 March 2011
10
Data element and Description Importance /
requirement rating Comments
Ecological Water Requirements
Hydraulics Raw data Required
FFHA Fish model to determine flows Essential This model forms the crux of the low flow determination and it will be required or any further analysis.
HFSR - MIRAI tables
Spreadsheet invertebrate people use Essential Same as above.
Flood files
Need a description of the high flow (flood requirements) for each flood at each site in terms of peak (range), duration, daily average etc.
Essential This potentially is included in the report and if so, it will not be required as a separate excel file.
Operational Scenarios
FRAISC Need FRAI, MIRAI, VEGRAI, GAI, PAI, water qualtiy and EcoStatus models run for every scenario and appropriately named.
Essential Required and will be used for running scenarios as part of the classification system.
FFHA Need the model as run for every scenario. Essential -
Acronyms:
FRAI: Fish Response Assessment Index.
MIRAI: Macroinvertebrate Response Assessment Index.
VEGRAI4: Riparian Vegetation Response Assessment Index, Level 4.
GAI4: Geomorphology Driver Assessment Index.
PAI: Physico-chemical Driver Assessment Index.
IHI: Index of Habitat Integrity.
FFHA: Fish Flow Habitat Assessment (model).
HFSR: Habitat Flow Stressor response (method).
FRAISC: FRAI used for scenarios.

Classification of Significant Water Resources in the Upper Middle and Lower Vaal WMAs Inception Report
Final Inception Report V20 March 2011
11
4 STUDY PARAMETERS
4.1 METHODOLOGY FOR EXTRAPOLATING EWRS FOR ADDITIONAL SITES
The proposed extrapolation method can best be summarised by the following direct extract from the
Comprehensive Reserve Determination Study of the Integrated Vaal River System: Upper Vaal Water
Management Area: Technical Component: Estimation Report. Report number: RDM/WMA8C000/01/CON/0510.
“Extrapolation consists of determining which sites are sufficiently similar to the comprehensive
EWR sites in terms of biophysical similarity as well indicator guilds used for setting EWRs; and
deriving the EWRs for these sites using the comprehensive EWR results at the EWR sites.
Estimation consists of a process to estimate the EWRs at each hydronode for the Recommended
Ecological Category (REC) (using the information generated as part of the Desktop
EcoClassification (Kleynhans & Louw, 2007). This estimation will entail the prediction of indicator
species at various hydronodes, and the determination of the EWRs at these hydronodes using a
higher confidence method than the Desktop Ecological Reserve Model.
The decision-making process to determine whether to estimate or extrapolate is summarised in
the flow diagram below (Figure 4.1).
Figure 4.1: Flow diagram showing when it is appropriate to extrapolate or when estimation is
required.”
Further details on the method are described in Section 6.3.3 as well as other references listed in that section.
EXTRAPOLATION OR ESTIMATION?
Is the hydronode location in the immediate vicinity of, and in the same river than EWR sites?
Yes
Use output of yield model to determine requirement at
hydronode (based on demand at EWR site).
Extrapolate
How?
No
Is the site similar (biophysical) to the EWR site and does it have
the same indicator guilds?
Yes
Use EWR determined flow proportions and adjust Desktop
Reserve Model to determine EWR.
Extrapolate
How?
No
Use the Desktop Adjustment Model (DAM). When revised
Desktop Reserve model is available – use that.
Estimate
How?

Classification of Significant Water Resources in the Upper Middle and Lower Vaal WMAs Inception Report
Final Inception Report V20 March 2011
12
4.2 INTEGRATED UNITS OF ANALYSIS
4.2.1 Approach in identification of IUAs
The identification and selection of the Integrated Units of Analysis (IUAs) were based on the following
considerations:
The resolution of the hydrological analysis and available water resource network configurations currently
being modelled.
Location of significant water resource infrastructure.
Distinctive functions of the catchments in context of the larger system.
Available budget for refinement of the existing network and undertaking scenario analysis of each IUA.
In an ideal situation it would have been preferred to have a properly calibrated higher resolution network water
resource model available for use in the classification process. Such models have been developed for other
systems in the country as part of Water Availability Assessment Studies where the focus was to develop
installed modelling systems to support the licensing of water use. Such detailed work requires significant
human resources and were not included in the proposal of this study.
It has been recognised that the characteristics of individual small tributaries can significantly differ from the
larger rivers and may warrant a different class. The constraint is however that if the same intensity of
investigation has to be applied for all tributaries (that is to satisfy scientific sound practice) much more time and
money would be required to undertake the classification of the water resources. It is therefore proposed that a
practical qualitative evaluation method be applied which will only consider the ecological aspects as well as
likely implications on goods and services in a qualitative manner. The identification of the tributary catchment
will form part of the evaluation of Task 3a.
The identified and proposed Integrated Units of Analysis for the three Vaal Water Management Areas are
shown in Figures D-1, D-2 and D-3 respectively in Appendix D and discussed in the subsequent sections.
4.2.2 Upper Vaal IUAs
Figure D-1 presents the twelve identified Integrated Units of Analysis (IUA) of which three areas (consisting of
quaternaries C22J, C22H, C23B, C22G and C23A) are defined as Secondary IUAs. The remaining nine IUAs
form the sub-catchments according to which analysis will be carried out. The three secondary IUAs, as well as
the tributary rivers within each main IUA, will be evaluated in a qualitative manner only.
The significant resources of the eight IUAs are:
Upper Vaal- Vaal River Upstream of Grootdraai Dam.
Klip River (Free State).

Classification of Significant Water Resources in the Upper Middle and Lower Vaal WMAs Inception Report
Final Inception Report V20 March 2011
13
Wilge River.
Liebenbergvlei River.
Waterval River.
Vaal River reach upstream of Vaal Dam and Downstream of Grootdraai Dam.
Blesbok, Suikerbosrand and Klip (Gauteng Province) rivers.
The dolomite aquifers supporting the abstractions by Rand Water will be evaluated through simulation
analysis,
Mooi River and Loopspruit River.
Figure 4.2 presents the different types of EWR sites or nodes that were analysed as part of the Upper Vaal
Reserve Determination Study and shows that there is sufficient coverage of extrapolation EWR nodes already
available in the Upper Vaal.
Figure 4.2: Map of the Upper Vaal WMA with different EWR sites or nodes analysed in the Reserve
Determination Study (Copied from DWA, 2010c)

Classification of Significant Water Resources in the Upper Middle and Lower Vaal WMAs Inception Report
Final Inception Report V20 March 2011
14
4.2.3 Middle Vaal IUAs
Figure D-2 presents a map of the Middle Vaal WMA and there are eleven proposed IUAs of which four are
secondary IUAs.
The significant resources of the seven IUAs are:
Schoonspruit River as well as the dolomite aquifer feeding the Schoonspruit Eye. (Simulation analysis will
be carried out on the dolomites.)
Renoster River.
Vals River.
Sand River.
Vet River.
Lower Vet River.
Vaal River Upstream of Bloemhof Dam.
4.2.4 Lower Vaal IUAs
Figure D-3 presents a map of the Lower Vaal WMA and there are five proposed IUAs. The area covered by the
light blue colour (Molopo River Catchment) was not part of the Vaal River Comprehensive Reserve
Determination Study. These rivers are ephemeral and therefore cannot be evaluated with ease by following the
standard reserve determination methods. Some work is currently been carried out in this area through the
ORASECOM study (see Section 2.2) regarding ecological water requirements. Since this is “work in progress”
it was not possible to evaluate the implication of this on the classification study – this will be carried out at a later
stage during the course of the project.
The significant resources of the five IUAs are:
Upper Harts River including the dolomite aquifer in the Lichtenburg area. (Simulation analysis will be carried
out on the dolomites.)
Middle Harts River.
Dry Harts River (Tributary).
Lower Harts River.
Molopo River, various groundwater resources to be asses on an annual balance basis only. (No simulation
models have been configured for these areas).

Classification of Significant Water Resources in the Upper Middle and Lower Vaal WMAs Inception Report
Final Inception Report V20 March 2011
15
Vaal River Downstream of Bloemhof Dam.
4.3 SELECTION OF EXTRAPOLATION NODES (SITES)
As indicated in Figure 4.2 the coverage of EWR nodes or sites in the Upper Vaal WMA is extensive and limited
additional work is anticipated with respect to new sites or nodes. The same extrapolation work that was carried
out in the Upper Vaal WMA did not form part of the scope of services in the Middle and Lower Vaal WMA
studies. It is therefore proposed that between three and four extrapolation EWR nodes will be assessed as part
of the classification study.
The identification of extrapolation nodes is an integral part of the information evaluation that will take place
during the execution of the activities and tasks for Step 1. The final selection of nodes will be produced by the
end of April 2011.
4.4 DEFINITION OF SCENARIOS
A major potential risk for not completing the study within the 24 month period and exceeding the Proposal
budget is if the number of scenarios to be analysed exceeds what was defined in the Proposal (repeated in
Section 6.3.5).
Although it was anticipated at the proposal stage that the definition of the scenarios for analysis might be
possible already during the Inception Phase, it is now realised that the definitions will form part of Step 4 and will
be carried out in September 2011. .
5 STUDY PROCEDURE
5.1 OVERVIEW
The proposed study has been structured and broken down into various tasks and sub-tasks as listed in
Table 5.1.
Table 5.1: Proposed Study tasks and deliverables
Task No. Task description Deliverables
1 Project inception Inception Report
Integrated Units of Analysis description and map
Meeting minutes and decision record
2 Water resource information and data
gathering
Information summary and gap analysis
Inventory and recommendation on models, including
water quality models
3 Determination of the Management Class
3a Step 1: Delineate units of analysis and
describe the status quo
Units of Analysis and status quo Report
Socio-economic analysis framework

Classification of Significant Water Resources in the Upper Middle and Lower Vaal WMAs Inception Report
Final Inception Report V20 March 2011
16
Task No. Task description Deliverables
Water resource infrastructure description
Ecological state and hydronode assessment
3b Step 2: Link value and condition Analysis scoring system
3c Step 3: Quantify Ecological Water
Requirements (EWRs) and changes in
non--water quality Ecosystem Goods,
Services and Attributes (EGSAs)
Ecological Water Requirements report
Rule curves, summary tables, modified time series
for all nodes and ecological categories
Socio-economic method summary
3d Step 4: Set Ecological Sustainability
Base Configuration (ESBC) scenario
and establish starter configurations
Definition of scenarios
Description of ESBC scenario
3e Step 5: Evaluate scenarios within the
Integrated Water Resource
Management (IWRM) process
Preliminary and final consequences report
WRPM model configurations of the scenarios
Water resource analysis report
3f Step 6: Evaluate scenarios with
stakeholders
Presentations and preparation documents
Minutes and record of decisions
Recommended management class
3g Step 7: Gazette class configuration IWRM summary templates for each IUA
Description of RQOs
Implementation plan
4 Communication and liaison Stakeholder database and schedule of meetings
Meeting documentation (all)
Record of stakeholder questions and responses.
5 Capacity Building Detailed programme
Progress reports during study execution
Closeout report (achievements)
6 Study management and co-ordination Project management committee meeting minutes
Maintain record of decisions
Monthly invoicing and progress reports
Notes: Steps 1 to 7 refers to the WRCS documentation
Preliminary and final consequences report: Describes the ecological, goods and services, system
yield and socio-economic implication of each scenario.
Water Resource Analysis Report: Presents the water resource system analysis work
including the changes to the network, scenarios assumptions and most importantly the
scenarios results in terms on water availability implications which include the implications with
respect to the change in augmentation requirements for the Integrated Vaal River System.

Classification of Significant Water Resources in the Upper Middle and Lower Vaal WMAs Inception Report
Final Inception Report V20 March 2011
17
The Study will be undertaken over a period of 24 months according to the schedule (time line) and
duration of the tasks (see the Gantt Chart presented in Appendix A).
In order to present the approach in context of the WRCS, the scope of work for Task 3 “Determination of the
Management Class (seven step process)” is presented according to the steps recommended in the WRCS
documentation. The activity descriptions therefore demonstrate the application of the WRCS method as it is
applicable to the specific characteristics of the Vaal River System. The approach proposed is founded in the
knowledge and experience the team members have of both the scientific methods to be applied as well as the
water resource of the Vaal River System.
It should be noted that the Inception Report was compiled in context of the work already carried out as part of
the Comprehensive Reserve Determination of the Vaal River System and the proposed activities focus on
adding additional value without duplicating past work.
The Study Management and Co-ordination task will continue throughout the study period to monitor
performance, undertake Client liaison, track expenditure and ensure the successful execution of the study tasks.
The tasks and activities are described in Section 6 in the respective sections.
5.2 CROSS REFERENCE WITH THE PROPOSAL
The work packages described in the proposal remained similar in this Inception Report with the following minor
comments:
Definitive definitions of the stakeholder engagement events are now defined and budgeted. The additional
costs were covered by adjusting the budgets for other tasks. It will be critical to not exceed the proposed
number of events to remain within budget.
The cautious selection of the IUAs and the concept of introducing a qualitative method for dealing with the
classification of selected tributary catchments made it possible for the overall budget of the study to be the
same as the Proposal.
There remains to be uncertainties with respect to the extent of work in the event that the data and
information evaluation reveal anomalies and/or deficiencies. Should this be identified appropriate measures
of mitigation will be discussed with the Client for implementation in the study.
6 SCOPE OF WORK
6.1 TASK 1: PROJECT INCEPTION
The project inception phase involved collating available information to refine the scope of work through liaison
with the DWA manager. Information will be sourced from reports of previous studies, ongoing water resource
management processes as well as current knowledge from officials in different DWA directorates that are active
in the study area. Discussions were carried out in close cooperation with the DWA project management to
enable prioritisation of activities and obtain agreement on the work packages. The Integrated Units of Analysis

Classification of Significant Water Resources in the Upper Middle and Lower Vaal WMAs Inception Report
Final Inception Report V20 March 2011
18
(IUA) were defined and presented at the first Project Steering Committee (see Appendix D for maps).
6.2 TASK 2: WATER RESOURCE INFORMATION AND DATA GATHERING
The information and data obtained by the study team during their involvement with the Comprehensive Reserve
determination of the Vaal River System in particular, and through other studies undertaken over the past 20
years, will be supplemented through a review of reports and databases focusing the requirements of the seven
steps defined in the WRCS. Data from the Middle and Lower Vaal study area will be reviewed and the data for
all three WMAs will be consolidated and applied for further refinement to the scope of this study at a later stage.
During the Comprehensive Reserve studies the approach, assessment and analysis of the Goods and Services
of the Vaal River System was standardized and therefore the results generated during this study will form the
basis for this component.
An information gap analysis was carried out to identify missing data and appropriate recommendations on what
alternative methods to be applied for selected tributaries (qualitative assessment of ecological aspects and
goods and services) was devised..
Since the study team was instrumental in maintaining and updating the DWA water resource models of the Vaal
River System, no human resources and expenditure is required to gain an understanding of the currently
available models. The most appropriate and latest network configuration as well as hydrological database will
be selected for use in the study. A review of other models applied in the study will be carried out and evaluated
for possible application in the study. Particular attention will be given to local water quality models.
Conningarth was involved in the analysis and integration of the results for all three Comprehensive Reserve
studies. The socio-economic information is available on a Water Management Area basis and for the identified
economic zones in 2007 prices. The prices will be upgraded to 2009 prices and where changes in water use
have emerged it will be reflected to attain a more realistic picture of the socio-economic use and implications.
The analysis will include not only the quantity use but also make provision for quality, biota and riparian factors.
A wide range of information is available regarding the water quality of the Vaal River system, e.g. the Integrated
Water Quality Management Plan (IWQMP) produced for the system in 2007, and the Water Quality Report for
the Comprehensive Vaal Reserve study, due to be reviewed by SC&A in April 2011. The outcome of the
IWQMP was the setting of Resource Water Quality Objectives (RWQO) for a wide range of users, while the
Reserve study has defined the water quality EcoSpecs (or ecological specifications) for the resource.
Particular emphasis will be placed on evaluating and reviewing the water quality modelling conducted for the
system, which was undertaken primarily during the IWQMP study and focussed on salinity modelling. Gaps will
be identified, e.g. nutrient modelling.
6.3 TASK 3: DETERMINATION OF THE MANAGEMENT CLASS
This task forms the bulk of the work and is presented in accordance with the step layout of the Water Resource
Classification System.

Classification of Significant Water Resources in the Upper Middle and Lower Vaal WMAs Inception Report
Final Inception Report V20 March 2011
19
6.3.1 Task 3a (Step 1): Delineate units of analysis and describe the status quo
Step 1a: Describe present socio-economic status of the catchment
The present-day socio-economic status of the whole catchment will be described, based on the economic and
social importance models developed for the area during the Comprehensive Reserve Studies, and the current
socio-economic zones will be used.
Step 1b: Divide catchment into socio-economic zones
The zone (delineation) that was applied in the Vaal River System in the Reserve Determination study consisted
of the following components:
Vaal River main stem representing all water users receiving water from the Vaal River and supporting
systems.
Vaal River Eastern Sub-system (Grootdraai Dam and linked water resources).
Tributary river catchments including: Sand–Vet, Vals, Mooi, Schoonspruit, Renoster and Harts river
catchments.
In accordance with the concept of Integrated Units of Analysis (see Section 4.2) the zones will be in line with
IUAs. The objective of the catchment socio-economic zones is to estimate and report on the implications of
different catchment configuration scenarios on social wellbeing, economic prosperity and ecosystem health at
an appropriate spatial scale. This requires dividing society into relatively homogenous communities through
delineating socio-economic zones and describing community wellbeing within each zone.
Step 1c: Identify a network of significant resources, describe water resource infrastructure and identify
water user allocations
The Vaal River catchment’s water resource network and infrastructure information is available and has been
defined in previous studies including the Vaal Comprehensive Reserve determination assignment. The existing
databases of the water resource models contain the most up to date information on the water use in the study
area as well as data for possible future scenarios.
A consolidated description of the water resource network and infrastructure are provided in Appendix E and
further descriptions will be given in the study reports.. Additional nodes for analysis will be identified and
presented. It is envisaged that the resolution (scale) of the network will be increased from what is currently
available to accommodate the Integrated Units of Analysis as agreed in the inception task.
Step 1d: Define a network of significant resources and establish biophysical and allocation nodes
In this respect the same EWR sites that were previously selected will be used, which means that the key
biophysical nodes are available. Additional nodes to represent the catchment must be selected. As a first step
of this process, the hotspots as part of the Desktop EcoClassification process must be identified. This work is
available as part of the Reserve Study (2007 – 2010). A review must however be undertaken of the Middle and

Classification of Significant Water Resources in the Upper Middle and Lower Vaal WMAs Inception Report
Final Inception Report V20 March 2011
20
Lower Vaal and refinements made were necessary.
As part of the Estimation task of the Reserve Study, hydronodes (which are the same as biophysical nodes)
were selected in the Upper Vaal. This work must still be undertaken for the Lower and Middle Vaal. The
hydronodes will be selected considering the hotspots, hydrological data constraints and water resource
modelling constraints. The number of biophysical nodes will be limited by these constraints.
The existing water resources model for the Vaal River System is not configured and calibrated for fine resolution
modelling at quaternary or sub-quaternary scale. In other water resource systems such as the Crocodile East,
Mhlatuze, Olifants and Berg rivers high resolution models have been developed as part of the Water Availability
Assessment Studies (WAAS), which require substantive work that is outside of the scope and budget available
for this assignment. The most important aspects of the WAAS are the detailed land use definitions and the
calibration of the models (check against reality) that are necessary to produce a decision support system that
represents the real system as close as possible and has a high level of confidence.
Therefore, in order to complete the work in the allocated budget adjustments to the network model will focus on
key nodes and the ability to simulate the water balance in the selected IUA areas (see Section 4.2).
Refinements of the network resolution will be carried out by disaggregating existing hydrological and land use
data, based on catchment area ratios and readily available GIS maps and satellite images.
Note that the identification of nodes through the extrapolation / estimation process followed during recent
Reserve studies did not directly include the establishment of ecological water quality status at these nodes,
although a desktop-derived EC was used, which includes a desk-top evaluation of water quality. A water quality
cover identifying the crucial areas where water quality (salinity and nutrients) dominates will be provided. This
will include a water quality description of the three WMAs.
Step 1e: Describe communities and their wellbeing
Information from the Basic Human Needs as well as the socio-cultural importance desktop assessment
undertaken during the Reserve studies will be used as basis. This will be updated where required and analysed
in accordance with the requirements of the classification methodology. Where quantitative data is not available
a qualitative description will be provided. The objective of describing communities and their wellbeing within
each socio-economic zone is to provide the baseline against which to estimate changes in social wellbeing for
each of the catchment configuration scenarios evaluated. This requires a description of the levels of financial,
physical, human, social and natural capital available to each community, and constructing a measure or index of
social wellbeing from the data collected.
Step 1f: Describe and value the use of water
The current value of the out of stream water will be expressed in terms of the growth indicator Gross Domestic
Product (GDP) and two indicators reflecting the social impact of the water namely Employment and Low-income
Households. The impacts will be determined per user group namely irrigation agriculture, commercial livestock,
mining, light and heavy industries. It will firstly be expressed as total numbers per economic zone per product
and then converted to multipliers expressed in terms of water volume units. The values will be provided for

Classification of Significant Water Resources in the Upper Middle and Lower Vaal WMAs Inception Report
Final Inception Report V20 March 2011
21
Direct, Indirect and Induced parameters.
Step 1g: Describe and value the use of aquatic ecosystems
Information on the Goods and Services of the Vaal River is available and will be used for this purpose. It should
be noted that the objective in describing and valuing the use of aquatic ecosystems is to determine the way in
which aquatic ecosystems are currently being used in each socio-economic zone, and to estimate the value
generated by that use. This will provide the baseline against which the socio-economic and ecological
implications of different catchment configuration scenarios can be compared.
It is important to point out that while EGSAs will be identified and described in qualitative terms, a baseline value
can often only be described for some of these, as the information required is not available without investing in a
costly survey. This is particularly so for the Vaal System that is densely populated and consist of a complex
array of highly disparate social groupings but almost certainly relatively few communities or population
groupings that are dependent on EGSA for their livelihoods. As such it is therefore more practical to measure
changes in EGSA values relative to a reference point rather than computing a baseline value.
Water quality input to Reserve Goods and Services studies will be assessed and provide water quality
information as required.
Step 1h: Define Integrated Units of Analysis (IUA)
The proposed IUAs are presented in Section 4.2 based on the network of significant resources and in line with
the analysis and data from the Comprehensive Reserve Determination study. Once all required information has
been obtained and reviewed, these IUAs should be refined by key members of the study team. Considering all
of the information generated during Step 1a to Step 1i, the final IUAs will be defined and mapped. All nodes to
be used for EWR assessment and for the Ecological Sustainable Base Configuration will also be identified.
Step 1i: Develop and/or adjust the socio-economic framework and the decision analysis framework
The economic concept to be used is “Severe Economic Prejudice”; the intention is that you determine the
threshold after which further water curtailments or lower yields because of quality or other restrictions force the
individual producer or groups of producers or industry out of production. It is generally accepted that if any
curtailments are proposed, it will probably effect the irrigation sector and for this sector it becomes necessary
that decision makers have an indication of not only what the overall macro-economic impact of the decision will
be, but at what level individual irrigators are pushed to the brink where the possibility of compensation might
arise. Water quality and other environmental degradation issues will also affect the irrigation sector. However,
in the case of quality and other environmental issues could also impact on the social (human) quality of life of
the population and in some cases even affect industrial production.
The “Severe Economic Prejudice” concept and model was tested in the Mhlatuze and Crocodile (East)
catchments and will be updated for use in the three WMA’s to also make provision for quality and other
restrictions. The economic ceilings will be determined in consultation with the rest of the project team. To
determine the economic ceilings individual irrigation allocations according to the WARMS data base should be

Classification of Significant Water Resources in the Upper Middle and Lower Vaal WMAs Inception Report
Final Inception Report V20 March 2011
22
available to formulate a standard irrigation unit per economic zone to develop guidelines for decision
makers on the minimum allocation per zone. This will be necessary as the crop production basket differs
according to climatic zones along the river and minimum ceilings will therefore differ from zone to zone.
Further it is acknowledged that this framework will probably be confronted with two sets of parameters:
A configuration of aquatic ecosystem health categories among the water resources of the catchment with
their associated flow regime; and
An utilizable yield of water.
These two sets of parameters are generally inversely related, with increased aquatic ecosystem health requiring
a reduction in utilizable yield. The yield, which is described in terms of the characteristics of water supplied to
water users, influences the output of water user sectors. The catchment configuration scenarios also influence
the output of EGSAs, from which a number of values are derived. Some of these values influence sectoral
outputs and others are measured in terms of costs avoided or incurred. This need to be considered and
weighed and the decision making model adjusted accordingly.
Step 1j: Describe present-day community wellbeing within each IUA
This step is envisaged as translating all of the information generated in Steps 1a, 1b and 1e into categories
linked to the developed IUAs. In all likelihood the analysis done in steps 1a, 1b, and 1e will be at a more refined
level than that of the envisaged IUA. As such this step will consist of aggregation of refined levels of data into
the IUA.
6.3.2 Task 3b (Step 2): Link value and condition
Step 2a: Rationalise the choice of ecosystem values to be considered based on ecological and
economic data
Approached from an economic point of view, water use and the value of water is divided into two major groups,
namely the value of the used water while it is in the river and the value of the water once it has been removed
from the river and applied outside the river. The team’s approach will be presented (motivated) to the DWA
during the inception phase for comments and approval.
Given the complexity and size of the Vaal River System a rough estimate of the changes in value of EGSAs and
sectoral use of water will be given. As it is often the order of magnitude of changes in value that count, rather
than the precision of the number, a table will be constructed with the following (value) information:
Description of value;
Probable significance in the catchment;
Data requirements from the ecological component of the classification procedure;

Classification of Significant Water Resources in the Upper Middle and Lower Vaal WMAs Inception Report
Final Inception Report V20 March 2011
23
Possibility of being able to obtain relevant ecological data;
Other data required (social, agronomic etc.); and
Possibility of being able to obtain other relevant data.
Following this, the types of value which will be excluded in later steps of the classification procedure will be
noted with justification.
Step 2b: Describe the relationships that determine how economic value and social wellbeing are
influenced by ecosystem characteristics and the sectoral use of water
Especially rural communities depend on the Goods and Services supplied by the water while still in the river, but
we also accept that the quantity and quality of the water inside the river impacts on a growing sector namely
tourism and the quality of living of the urban and semi-urban population. Quality of the water is also a very
important factor now for the irrigators, especially where large quantities of produce are exported. For valuing
EGSAs that contribute to social wellbeing and economic prosperity, the following will be considered:
Flow contribution to floodplain agriculture;
Livestock production;
Tourism and recreation;
Refugia, nursery areas and export of sediment and nutrients;
Value of harvested goods; and
Domestic use of instream water.
For valuing EGSAs that result in costs avoided/incurred and contribute to social wellbeing and economic
prosperity, the following will be considered:
Flood attenuation;
Erosion control and sediment trapping;
Waste absorption;
Pests and pathogens; and
Domestic use of instream water.
For valuing intangible use and non-use values that contribute to social wellbeing, the following will be
considered:

Classification of Significant Water Resources in the Upper Middle and Lower Vaal WMAs Inception Report
Final Inception Report V20 March 2011
24
Cultural and spiritual value;
Educational and scientific value.
For valuing sectoral use of water that contributes to social wellbeing and economic prosperity, the following
could be considered:
Coal power;
Urban industry;
Non-urban industry;
Domestic use;
Mining;
Streamflow reducing activities;
Hydroelectric power.
Quality of water for different user sectors, e.g. irrigators and users dependent on run-of-river for water supply,
will be described. Information on user sectors will be sourced from the socio-economic team of the study.
The dependency for each section of the river will be estimated for user groups to develop a scoring system for
scenario evaluations.
Step 2c: Define the scoring system for scenario evaluations
The eventual choice of eco-system values will be based on a matrix that allows attaining the maximum value for
both users, inside and outside the river. It is proposed that the matrix be developed listing all the values and
then involve a group of knowledgeable people from both groups to populate the matrix. The methodology
proposed, is the Delphi approach where a number of specialists populate the first matrix with approximate
values. In the second matrix weights are allocated to the different items which are then multiplied with the first
matrix to get a third matrix with answers.
Matrix1 x Matrix2 = Matrix3Values Weights Answers
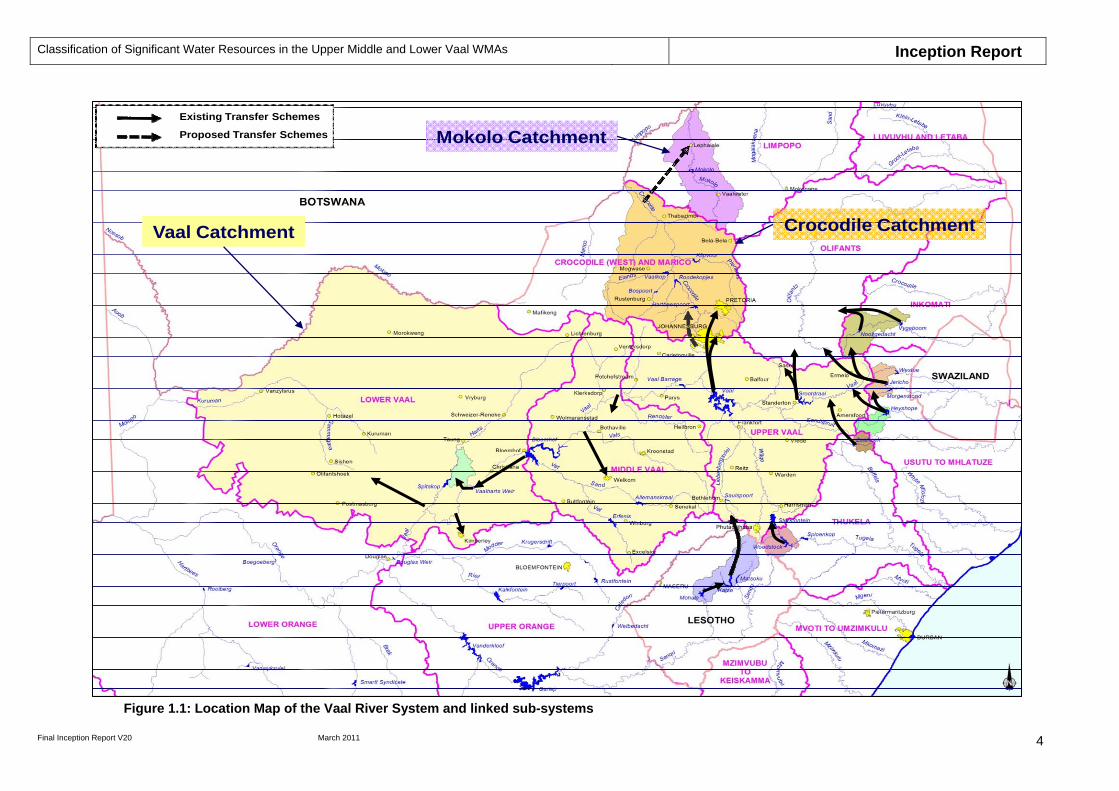
The following table presents some of the issues to be considered (they will be completed by the project team).
Classification of Significant Water Resources in the Upper Middle and Lower Vaal WMAs Inception Report
Final Inception Report V20 March 2011
25
Description Values
Job
Creation
Poverty
Alleviation
Goods and
Services
Sense of
Place
Environment
In the river benefits
Out of river benefits
In a similar table the different weights will be allocated to the different issues identified.
Therefore, in summary, the process will involve firstly agreeing on the value interaction and then secondly listing
the importance of each identified benefit which will then be converted to a score value, making it possible to
identify the best option for the specific WMA, main stem or tributary, taking into consideration in river and out of
river benefits.
The refinement of this approach will allow the task team to evaluate the different scenarios in a balanced and
fair approach, allowing for a scientific assessment that will counter unsubstantiated emotional inputs from
influential participants. The scoring system will allow for the evaluation of the implications of catchment
configuration scenarios in terms of social wellbeing, ecosystem health and economic prosperity.
The scoring systems will therefore incorporate indices that account for; social wellbeing, ecosystem health, and
economic prosperity.
6.3.3 Task 3c (Step 3): Quantify Ecological Water Requirements (EWRs) and changes in non-
water quality Ecosystem Goods, Services and Attributes (EGSAs)
This is the most important step in the process which will require the most intensive work. However, if this step is
not done comprehensively, the outcome of the study will be suspect as the Ecological Water Requirements
(EWRs) form the base of water resource classification.
Step 3a: Identify nodes to which existing Resource Directed Measures (RDM) data can be extrapolated
The current EWR sites will be utilised for this task. Current ecological data will be consolidated and reviewed.
The ecological data for the current Reserve studies were collected during 2007 – 2008 and the results are of
sufficient confidence to use as the baseline for the application of the Classification System.
One of the requirements of the Classification System (DWAF, 2007) is the assessment of the Reserve by
means of extrapolation to various nodes in the catchment. The estimation process designed for use in the
Reserve Determination Studies carried out by the D:RDM on the Upper Vaal, Mokolo, Inkomati, Crocodile and
Sabie Rivers will be used to determine whether sites can be extrapolated (Louw et.al., 2006) from EWR sites
or whether appropriate models must be used to generated the EWR results. In this step the simulated time
series of monthly flow data will be produced in tabular and graphical form at the nodes and for the categories.
This data will originate from the simulation results of the Water Resource Planning Model. The output of this
task will be the standard requirement, i.e. the .tab and .rul files for each EC at each EWR site. SPATSIM
(Spatial and Time Series Information Modelling) (Hughes and Forsythe, 2006) will be used as a framework for

Classification of Significant Water Resources in the Upper Middle and Lower Vaal WMAs Inception Report
Final Inception Report V20 March 2011
26
the hydrological information used within the process, and to capture the EWR results. It is important to note
that .rul and .tab tables cannot be provided for sites where present day hydrology is higher than natural.
Water quality information and models used and developed during the Comprehensive Reserve study will be
utilized for this input in the following way:
1. Evaluate the water quality assessment and Physico-chemical Driver Assessment Index (PAI) models produced during the Comprehensive Reserve study.
2. Provide the consequences of scenarios for water quality using the (PAI) model and other available tools.
Note that previous studies on extrapolation / estimation did not include the establishment of ecological water
quality status at extrapolation nodes although a desktop-derived EC was used, which included a desktop
evaluation of water quality. Extrapolation will be undertaken during this study where possible, but will be
dependent on the availability of supporting information such as biotic response data at extrapolation nodes, i.e.
selected nodes in the Upper Vaal catchment only.
Information will also be prepared and data linked to the water quality baseline and return flows in preparation for
Steps 4 and 5.
Step 3b: Develop rule curves, summary tables and modified time series for all nodes for all categories
Included in Step 3a.
Step 3c: Quantify the changes in relevant ecosystem components, functions and attributes for each category for each node
As part of the Desktop Ecoclassification system, an estimate will be made of the condition of the key ecosystem
components. The response to changes in flow for different Ecological Categories will be derived. It must be
noted however that as no detailed field work on these nodes will be undertaken, estimated changes in flows for
different Ecological Categories cannot be directly related to the responses of biota and the change in functions
and attributes for each of these. Broad based assumptions only can be made.
This information is available for all nodes that are comprehensive EWR sites.
6.3.4 Task 3d (Step 4): Set Ecological Sustainability Base Configuration (ESBC) scenario and
establish starter configurations
A thorough review of the guidelines for Step 4 and comparing the suggested methods with previous practice in
Comprehensive Reserve Determination Studies (such as for the Thukela River and Inkomati River systems)
lead to a more streamlined approach for this study. The text below provides an overview description of the
proposed approach and further refinements of the methods will be undertaken during the execution of the work.
One of the key reasons for selecting this method is the unavailability of confident (realistic) high resolution
modelling networks to simulate all the EWR nodes in the system. It is acknowledged that many of these steps
have been done as part of the Comprehensive Reserve study and the focus will be on the additional nodes
where hydrological information is available.

Classification of Significant Water Resources in the Upper Middle and Lower Vaal WMAs Inception Report
Final Inception Report V20 March 2011
27
Scenario evaluation at EWR sites
The scenarios will be assessed in terms of ecological consequences, i.e. the impact on the Ecological Category
of the EWR site where applicable. The rule-based models used during the EcoClassification process are used
in a predictive manner to determine the ecological consequences of the scenarios. The first requirement will be
the analysis of the scenarios in terms of impact on the physico-chemical EC using the PAI. The other rule-
based models will then be assessed for the rest of the components. The results will be used to generate the
resulting EcoStatus. The process to determine the ecological consequences is as follows:
The water quality consequences will be evaluated for each scenario and will be supplied as an EC with a
qualified explanation and motivation.
The flows will be converted to stress for each scenario at each EWR site.
The flow information will also be supplied in a format suitable for high flow evaluation to all the specialists
during a specialist meeting.
This information will be provided to the biological and geomorphological specialists as well as a template for
completion during a specialist meeting.
At the specialist meeting, the specialists complete their indices for the new flow/stress scenario to determine
the resulting EC.
All information is supplied to the EWR co-ordinator who will use the information as input to the EcoStatus
model.
Based on the information generated, the specialists rank the different scenarios using the standard traffic
diagram approach.
Scenario evaluation: Ecological Sustainable Base Configuration
This will entail a rule-based process to be developed and applied to determine the Ecological Sustainable Base
Configuration. Based on the ecological categories from the Comprehensive Reserve determination study, the
EWR results from the additional extrapolation nodes along with requirements from International Water
Agreements and Basic Human Needs, the Ecological Importance and Sensitivity Categories and other factors
will be applied to define and describe the catchment configuration scenarios. The existing ecological
consequences’ results generated during the Comprehensive Reserve Study for scenarios that reflected the
present state will be used as a baseline for this task.
Water quality information will be provided as required. Note that Step 4a (water quality feasibility) can only be
conducted at high confidence if a water quality model of the catchment is available and a structured process for
pre-screening is available. The WRCS does not yet contain such a process and a water quality model (of all
quality variables) does not exist for the catchment. The following water quality modelling undertaken for the
Reserve study will be used as far as possible for the consideration of situations where water quality has to be
evaluated for supporting the downstream portions of the catchment.
Physico-chemical Driver Assessment Index (PAI) models and output produced during the
Comprehensive Reserve study for present state and consequences of scenarios.
Water quality models used at selected sites during the Comprehensive Reserve study, i.e. WRPM TDS

Classification of Significant Water Resources in the Upper Middle and Lower Vaal WMAs Inception Report
Final Inception Report V20 March 2011
28
for salts, and QUAL2K for nutrients for determining consequences of scenarios.
6.3.5 Task 3e: Evaluate scenarios within the Integrated Water Resource Management (IWRM)
process
Step 5a: Run yield model for ESBC and Other catchment configuration scenarios and adjust if necessary
An important difference in the proposed methodology is that the Water Resource Planning Model (instead of the
Water Resources Yield Model – WRYM) will be applied. This is to account for the operational and development
planning feature of the Vaal River System (dilution, transfer require operating rule) that cannot be simulated with
the WRYM. The WRPM has been designed to simulate all aspects of the system in an integrated manner.
The study cost estimate provided in the Financial Proposal makes provision for five main scenarios
where full evaluation of all aspects will be carried out. Provision for a further five alternative
combinations of these five scenarios are also included in the cost estimates. These five alternatives will
only involve simulations and qualitative comparative analysis.
Significant groundwater resources contributing to the Vaal System exist in 3 regions underlain by dolomites:
Lichtenburg (Lower Vaal).
Schoonspuit (Middle Vaal).
The Suikerbos region (Upper Vaal).
Significant groundwater abstraction from dolomites has altered flow from springs draining dolomitic
compartments, reducing baseflow in to the Vaal System, affecting the yield of the system. To simulate the
impacts of abstraction on groundwater resources and impacts on surface water, dolomitic compartments and
their interconnection will need to be delineated. These will next be simulated using the surface-groundwater
interaction model incorporated into the WRSM2000 in order to derive baseflow scenarios from different
abstraction scenarios.
The groundwater assessment in the Molopo River catchment area will be based on annual balances using
information from GRA2, Vegter Maps of harvesting and exploitable potential. Water abstraction data will be
sourced from WARMS, current Validation and Verification study and well as detail groundwater studies if
available.
Step 5b: Assess water quality implications (fitness for use) for all users.
Fitness-for-use for all users in each IUA will be assessed using the interim RWQOs designed during the IWQMP
and the water quality EcoSpecs (or ecological specifications) defined for the resource during the Reserve study.
This step will therefore include the production of final RWQOs for the system by amalgamating objectives for all
users and the resource base, and assessing the achievability of these objectives. Information provided by
recent planning options (e.g. Acid Mine Drainage and Wastewater Treatment strategies) will be incorporated as
strategies to achieve RWQOs, where possible. Concentrations at IUA outflow nodes will therefore be tested

Classification of Significant Water Resources in the Upper Middle and Lower Vaal WMAs Inception Report
Final Inception Report V20 March 2011
29
against water quality requirements of users in the downstream IUA. Note that concentrations will only be
determined for selected variables.
It is assumed that the scenarios tested during previous studies will satisfy the modelling requirements of the current Classification study, as the cost estimate does not include additional water quality modelling. Requirements for such modelling will be flagged where necessary.
Step 5c: Report on ecological condition and aggregate impacts per IUA for each scenario.
Changes in relevant eco-system components, functions and attributes for each node assessed, will be
quantified. The report produced under step 3 will include these findings.
Step 5d: Value changes in aquatic ecosystem and water yield
The scenario based approach followed in the Comprehensive Reserve study will be followed. Assessment of
the economic impacts of the various scenarios essentially identifies the direction of change (either positive or
negative) and estimates the magnitude of the change in benefits and costs that may be experienced within the
River System. Included in the cost items will be the opportunity costs of any changes to water supply or quality.
The choice will be either having a reasonable “healthy” river at a certain economic impact (cost) or doing
nothing and eventually having to manage a much larger and detrimental economic impact (cost).
The process to be adopted will be analysis of potential economic changes based on a valuation of the status
quo, that is, the value of the Goods and Services (G&S) currently provided by the water in Vaal River
catchments, identifying the potential change that each of the key G&S may undergo in each of the scenario
clusters. And where required the current value of G&S was then multiplied by these factors for each scenario,
to provide an indication of the potential future value of the Goods and Services. The change in value was thus
measured. The following calculation, as an example, would be used:
o Future value (FV) of fishing = Change Factor x The Current Value of Fishing. o FV = 0.9 x rate. o FV = rate per annum. o This equates to a reduction or increase a specified rate annum.
The evaluation of the change in water yield will be in the form of defining the augmentation requirement for the
main stem water users, transfer requirements for the Eastern Vaal River System and reduced allocation in the
tributary catchments – see also Step 1b and 5e for related tasks.
Step 5e: Describe the macro-economic and social implications of different catchment configuration scenarios
The socio-economic analysis of Vaal River main stem (refer to Step 1b) will revolve around the cost of water
augmentation as it is reflected in the increased costs (difference among scenarios) for augmentation of the
system such as further phases on the Lesotho Highlands Water Project and/or Thukela Water Project.
With respect to the Eastern Vaal River Sub-system (Grootdraai Dam and linked water resources) the economic
cost of additional transfer from Vaal Dam to sustain supply to users will be determined.

Classification of Significant Water Resources in the Upper Middle and Lower Vaal WMAs Inception Report
Final Inception Report V20 March 2011
30
The analysis of the tributary river catchments will be based on the assumption that all users other than
irrigation will receive their full demand. The macro-economic impact if irrigation is curtailed, either by a water
curtailment or yield reductions due to quality considerations, will be estimated plus the point of “Severe
Economic Prejudice” for the specific area will be determined, which will then give the decision makers guidance
in the magnitude of the negative economic impact. Obviously the point of “Severe Economic prejudice” will differ
from producer to producer and eventually the determination of the impact must take place on an individual
basis, but a general guide will support the decision maker in respect of deciding the volume of water that can be
curtailed or the impact of quality deterioration.
Step 5f: Evaluate overall scenario implications at an IUA-level and a regional level
The integrated analysis approach followed in the Vaal River System where the overall system augmentation
requirements are determined and the cost differenced between scenarios are calculated (as presented in the
previous section) accounts for the overall scenario implications. The augmentation cost differences affect all
domestic and industrial users receiving water from the system covering a regional footprint outside of the Vaal
River catchment itself and therefore appropriately account as regional level evaluation.
Step 5g: Select a subset of scenarios for stakeholder evaluation
The outcome from Step 5 will inform the selection of scenarios for presentation to stakeholders. A key
consideration will be to cover a range of conditions in order to communicate the advantages and disadvantages
in a balanced manner. The selection will be undertaken in cooperation with the Client.
6.3.6 Task 3f: Evaluate scenarios with stakeholders
Step 6a: Stakeholders evaluate scenarios and agree on a short-list
The arrangements for the stakeholder engagement events are described in Task 4. Clear presentation of the
selected scenarios (background, scenario descriptions, summarised results of all components and conclusions)
will be prepared for the stakeholder workshops and meetings. The facilitation of the meetings will involve
guiding the participants to agree on a short list of scenarios as recommended to DWA. The study team will
ensure appropriate decision makers from DWA is present at the stakeholder meetings to ensure informed
deliberations take place that will lead to the acceptance of the recommendation of the management classes for
each Integrated Unit of Analysis.
Step 6b: DWA recommends IUA classes
The process of how the recommendations will be made by DWA has not been described in the WRCS
documentations. It is proposed that the method be discussed and agreed during the inception phase of the
study.
6.3.7 Task 3g: Gazette class configuration
Step 7a: Populate IWRM summary template and present to Minister or delegated authority

Classification of Significant Water Resources in the Upper Middle and Lower Vaal WMAs Inception Report
Final Inception Report V20 March 2011
31
The PSP will prepare the IWRM summary template in accordance with the format that will be developed in
cooperation with the Client. DWA officials will then submit the documentation through the appropriate internal
channels for the approval by the Minister of delegated authority.
Step 7b: Minister decides on IUA classes, nested category configurations, Reserve(s), allocation schedule(s) and Catchment Management Strategy (CMS)
This is an internal DWA process and depends on the approval protocols and administration procedures.
Step 7c: Recommended Resource Quality Objectives (RQOs)
At the inaugural management meeting it was confirmed that the RQOs will form part of a separate process and
information from this study will be made available where appropriate.
Step 7d: Gazette IUA classes, nested category configurations and RQOs
This is an internal DWA process and depends on the approval protocols and administration procedures.
Step 7e: Develop plan of action for implementation of recommended scenario
The study team will compile a programme that outlines the steps required and timeframe for implementation.
Specific attention will be given to monitoring requirements that need to be put in place to evaluate the outcome
of the implementation of the plan. The plan will take the activities involved in Integrated Water Resource
Management into consideration – with particular reference to the Vaal River System Reconciliation Strategy.
6.4 TASK 4: COMMUNICATION AND LIAISON
Public participation in environmental processes is not only a statutory requirement, but a process that should
lead to a joint effort by stakeholders. Stakeholders should represent all relevant interests and sectors of society,
technical specialists and the various relevant organs of state who work together to produce better decisions
than if they had acted independently, and better implementation of decisions through stakeholders “owning” the
process.
It is very important to note that the process is not measured solely by the letter of the law’s minimum
requirements. The principles used world-wide to characterise and measure a thorough and legitimate
stakeholder participation process, and which will be applied in this process, is noted in the box below.
Universal stakeholder participation principles
Consultation is inclusive. It takes place with all sectors of society and affords a broad range of stakeholders the opportunity to become involved.
Information is sufficient to allow meaningful contributions, and is accessible.
Information is presented in various ways, e.g. by way of background information documents, newsletters, media releases, letters and advertisements.
There are various opportunities for comment, at various stages in the process.
Stakeholders are supplied with information that assists them to understand their roles and responsibilities in the process.

Classification of Significant Water Resources in the Upper Middle and Lower Vaal WMAs Inception Report
Final Inception Report V20 March 2011
32
These are in line with the core values of the International Association for Public Participation (IAP2). Zitholele
Consulting and the individual personnel responsible for stakeholder engagement are members of the IAP2
affiliate in South Africa. Our team members have each successfully undertaken the certificate courses by the
International Association to be official practitioners in public participation.
The stakeholder process for this process can be summarised as follows:
6.4.1 Stakeholder identification and database
The identification of stakeholders will be an on-going process, refined throughout the process as the on-the-
ground understanding of affected stakeholders improves through interaction with various stakeholders in the
three Vaal WMAs. The identification of key stakeholders and community representatives for this project is
important and will be done in collaboration with the Department, and stakeholders in the study area.
Stakeholders’ details will be captured on Maximiser 9, an electronic database management software
programme that automatically categorises every mailing to stakeholders, thus providing an on-going record of
communications. In addition, comments and contributions received from stakeholders are recorded linking each
comment to the name of the person who made it.
Typically, our team would identify stakeholders representing the following sectors of society:
national, provincial (Mpumalanga, Gauteng, Free State, Northern Cape and the North West) and local
government (relevant local and district municipalities);
relevant residents’ associations, rates payers organisations, community based organisations,
agricultural organisations and NGOs;

Classification of Significant Water Resources in the Upper Middle and Lower Vaal WMAs Inception Report
Final Inception Report V20 March 2011
33
environmental and water bodies, forums, groups and associations;
private sector (mining, business, industries) in the vicinity;
civil society; and
regional and local media.
The draft database will be compiled during the first few weeks of the project implementation period; however a
database is dynamic and will be constantly updated as more information becomes available and as stakeholder
information change.
6.4.2 Announce the project
After the Inception Report is approved a background information document (BID) will be compiled for distribution
to all stakeholders that are listed in the database. The purpose of this document will be to announce that the
DWA is undertaking the classification process of significant water resources in the three WMAs of the Vaal
River System, the process to be followed, anticipated activities, proposed time lines as well as how stakeholders
can become involved in the project.
The same information will also be sent to the media and should be combined with a media release and
advertising campaign as well.
This document will be accompanied by an announcement letter and a comment/reply sheet to provide people
the opportunity to comment on the classification study and to register as a stakeholder or provide names of
other possible stakeholders.
The document will also explain the necessity of the project and the context of the study. Information such as
where more information can be obtained, the website for downloading of information, etc will also be shared. At
this early stage in the project, stakeholders will be requested to provide their comments and inputs. Responses
will be captured in an Issues and Responses Report.
6.4.3 Issues and Responses Report
An Issues and Responses Report will be compiled and updated throughout the two-year period of the project.
This report will list all the comments from stakeholders (to be received from comment sheets, at meetings, via
telephone calls, etc) and responses from the project team.
6.4.4 Evaluation of scenarios with stakeholders – Step 6 of WRCS process
Stakeholders have to evaluate the scenarios presented by the DWA and its study team. The following approach
and steps are anticipated
(a) Establishing a Project Steering Committee
Stakeholders representing specific sectors of society (e.g. agriculture, mines, local authorities, conservation) will
be identified and asked to serve on a Project Steering Committee (PSC) for the duration (two years) of this
project. The PSC should be a relatively small group of people (no more than 25) that will ensure strategy

Classification of Significant Water Resources in the Upper Middle and Lower Vaal WMAs Inception Report
Final Inception Report V20 March 2011
34
implementation and provide strategic advice and guidance.
The Vaal currently has an efficient structure in place that could be utilised for this project. The Vaal River
System Strategy Steering Committee (VRS SSC) oversees the implementation of the Reconciliation Strategy
and it is proposed that the Steering Committee Meetings of this study be integrated with VRS SSC. Three
meetings are allowed for in the budget of this task. Members of the VRS SSC have years of experience and
represent all sectors of society we would like to be involved in this project. The practicalities of this can be
confirmed at a later stage but the VRS SSC can, for example, meet in the morning, with the Classification
meeting being held in the afternoon.
Invitation letters and a proposed agenda will be distributed to the PSC members providing them with sufficient
information about the status of the project, the purpose of the meeting and what will be expected of them (e.g.
read through documents prior to the meeting and provide inputs and comments).
The fourth PSC meeting will be where the scenario results are presented for evaluation by the stakeholders.
A Terms of Reference will be drawn up to assist members of the PSC.
(b) Establishing Technical Task Group
A Technical Task Group (TTG) will be established should the need arise. The Task Group Meetings will be held
to discuss and formulate scenarios for analysis. These meeting will include various sectors in the study area,
such as agriculture and industry. Stakeholders will be identified (per relevant sector of society) and invited to
attend the meetings. It is anticipated that no more than two meetings of the TTG will be held. Prior to these
meetings the necessary documentation will be compiled and distributed explaining for example the various
scenarios to be investigated.
All meetings will be formally hosted with a facilitator, formal presentations of the different scenarios and
thorough minutes will be taken as a record of stakeholder comments and inputs. These comments and
responses will be fed into the Issues and Responses Report. The minutes of all meetings will be distributed for
comment.
Should the presented scenarios have changed significantly with the consideration of stakeholder comments, the
process to invite stakeholder inputs on the revised scenarios will have to be repeated to reach an acceptable
level of agreement with stakeholders (costs for a repeat workshop were not included in the budget).
Once the scenarios have been agreed upon, stakeholders have to be informed of the “short-listed” scenarios
which will be submitted for final sign-off. This will be done with a final newsletter at the end of the project.
(c) Meeting arrangements
The Zitholele Consulting team will assist with all the arrangements of these meetings. Our proposed
methodology for arranging any type of meeting is as follows:
There must be a clear purpose for a meeting and the objectives of what needs to be achieved by the
meeting is clearly defined. Stakeholders must receive notification of the meeting date and its objectives

Classification of Significant Water Resources in the Upper Middle and Lower Vaal WMAs Inception Report
Final Inception Report V20 March 2011
35
at least three weeks in advance. A formal advance registration process was allowed.
Stakeholders must receive documentation such as a draft agenda for the meeting at least five working
days before the meeting.
A dry run meeting for project team members must be conducted in advance to agree on the content of
the meeting, the comprehension levels of presentations and to strategise for discussion sessions.
(d) Continuous feedback to stakeholders
Stakeholders need to be taken by the hand from the beginning to the end of a project. It is recommended that
stakeholders be updated every six months on the status of the project. This will be done by the distribution of, a)
the announcement background information document, b) a letter to all stakeholders on the database, including
the media informing them of progress made, c) invitations to stakeholders to attend a geographic focus group
meeting and lastly towards the end of the project a newsletter with information on the classification of important
water resources in the three Vaal WMAs can be distributed.
The DWA website needs to be utilised for the publishing of all public information (announcement
documentation, minutes of meeting, etc) to enable stakeholders with access to electronic media to stay
updated.
(e) Collaborating with existing projects / structures in the Vaal WMA
Existing projects of the DWA in the Vaal WMAs such as the VRS SSC will also be used to market and promote
this project.
(f) Scheduling
The following schedule is anticipated:
October – November ‘10: Develop stakeholder database and contributions to the inception report
February ‘11: Announcement of the project (BID, comment sheet, media announcement, etc)
March’ 11: Gather comments on the project (Collate comments and issues into an Issues
and Response Report)
April and May ‘11: Establish the PSC and Technical Task Group
June ‘11: Distribute the minutes of the meetings
September-October ‘11: Distribute a letter to the stakeholder database to report on progress made
October ‘11: Meet with the PSC
November ‘11: Distribute the minutes of the meeting
January ‘12: Meet with the Technical Task Groups

Classification of Significant Water Resources in the Upper Middle and Lower Vaal WMAs Inception Report
Final Inception Report V20 March 2011
36
February ‘12: Distribute the minutes of the meetings
April ‘12: Final meeting with the PSC (Stakeholder Scenario Evaluation Workshop)
May ‘12: Distribute a letter to stakeholders to report on progress made
September ‘12: Compile and distribute final newsletter
6.5 TASK 5: CAPACITY BUILDING
The study team through the execution of the work, will facilitate knowledge sharing to capacitate PSP members
and identified DWA officials. The capacity building activities will involve demonstrations, training instructions
with practical applications of processes and the supervision of tasks. Available training material will be used
for the dedicated training sessions. The training material will be amended where necessary to accommodate
new methods and procedures. An important aspect of the capacity building will be to make sure the trainees
are informed of the overall processes involved and related to the Classification process.
Table 6.1 presented the proposed training and knowledge building activities during the execution of the study.
Table 6.1: Schedule to capacity building and training activities
Code
(Task)
Learning Area Knowledge building
activity
Level of
training
Hours Month
Integrated Water Resource Management
A
(Task 1)
IWRM (policy & legislation) Overview of Water
Resource Management.
Introduction:
Discussion and
demonstration
6 May 2011
Detail:
Demonstration
6 November
2011
Water Resource information and data sourcing
B
(Task 2)
Understanding biophysical
processes:
water quantity & quality; geomorphology hydrology ecology hydraulics
Rainfall data
preparation.
Hydrological data
preparation
(WRSM2000 modelling).
Ecological data
preparation.
Introduction:
Discussion and
demonstration
16 May 2011
Detail:
Discussion,
demonstration
and application
32 November
2011

Classification of Significant Water Resources in the Upper Middle and Lower Vaal WMAs Inception Report
Final Inception Report V20 March 2011
37
Code
(Task)
Learning Area Knowledge building
activity
Level of
training
Hours Month
Water Resource Modelling
C
(Task 3)
Water resource modelling &
decision support
Water resource
assessments (WRYM
and WRPM).
Introduction:
Discussion and
demonstration
16 May 2011
Detail:
Discussion,
demonstration
and application
44 February
2012
Implementation of the WRCS process
D
(Task 3)
Use of GIS and mapping of
IUA’s
No expert or training
material available for
training. Training to be
provided in collaboration
with Olifants Study’s
PSP.
Introduction:
Discussion and
demonstration
- April 2011
E
(Task 3)
Understanding biophysical
processes:
water quantity & quality; geomorphology hydrology ecology hydraulics
Demonstration of
ecological aspects.
Detail:
Discussion,
demonstration
and application
24 July 2011
F
(Task 3)
Resource economics Explain models and
fundamentals.
Introduction:
Discussion and
demonstration
24 March 2012
G
(Task 3)
Socio-economic issues Explain fundamentals
and relationship
between social,
economic and ecological
trade-offs.
Introduction:
Discussion and
demonstration
16 July 2012
H
(Task 4)
Stakeholder consultation Explain fundamentals of
stakeholder
engagement.
Introduction:
Discussion and
demonstration
16 July 2011

Classification of Significant Water Resources in the Upper Middle and Lower Vaal WMAs Inception Report
Final Inception Report V20 March 2011
38
Code
(Task)
Learning Area Knowledge building
activity
Level of
training
Hours Month
I
(Task 1
to 6)
Project Management Explain project
administration and
financial management.
Introduction:
Discussion and
demonstration
16 November
2011
Note that the hours listed in the table also include preparation of discussion material by the respective
specialists in cases where material is not already available.
6.6 TASK 6: STUDY MANAGEMENT AND CO-ORDINATION
Project Management: The project management function will ensure coordination of the tasks among the study
team members and maintain close liaison with the Client to fulfil the requirements of the TOR. Study
management meetings (see programme) will be the main method for interaction between the PSP and the
Client, however, ad hock liaison will take place when necessary.
Financial Management: A financial control system, comprising an interactive spreadsheet model, will be used
to monitor and control costs. Costs will be assigned to each main task. Should deviations from the allocated
costs for the key activities become evident, the Study Leader shall assess the reason/s and impact of such
deviations and institute corrective action as required. Where additional work may be required, the Study Leader
shall compile a detailed motivation and budget (both time and costs) for such additional activities for
assessment and submission to the Study Manager for consideration and approval. No additional expenses
outside the approved budget will be allowed without the prior written approval of the Client.
Study Administration: Study administration duties to be performed will include:
Compiling, certifying and submitting monthly invoices to the Client. The Client will be presented with only
one invoice monthly from the Consultant Study Team. The Study Leader will arrange payment to the other
members of the Study Team after receiving the same from the Client.
Recording of minutes of meetings with the Client and distribution thereof to the relevant parties, as required.
Records of project decisions and all contractual matters related to the Study Team and/or sub-consultants
will be maintained during the study period.
Ensuring that all project files are updated regularly and accessible to the Client if and when required.
7 STUDY PROGRAMME
A bar chart programme of the tasks is provided in Appendix A and a breakdown of project deliverables as per
financial year is given in Table A-1 of Appendix A.

Classification of Significant Water Resources in the Upper Middle and Lower Vaal WMAs Inception Report
Final Inception Report V20 March 2011
39
8 STUDY COSTS
The costs presented in this section are based on the work program and estimated person-hour schedule
provided in the previous sections. The costs are applicable to the study period, which has been programmed for
24 months.
8.1 PROFESSIONAL FEES
Estimates of the total professional fees for each team member are provided in Table C-1 of Appendix C while
Table C-2 provides a schedule of the person-hours for each team member as allocated to the various tasks.
Table C-3 provides the schedule of cost for each team member as allocated to the various tasks. It is important
to note that the costs account for an increase in the hourly rates of all staff members at the end of the first 12
months of the study period, to account for CPIX-related escalation. The adopted increase is based on an annual
rate of 10 %.
A breakdown of the proposed costs for the 6 identified tasks is provided in Table 8.1.
Table 8.1: Summary of the proposed costs per task
The breakdown of professional fees allocated to each participating company is provided in Table 8.2.
% of No. Description Excl VAT VAT Incl VAT total
1 PROJECT INCEPTION 219 600 30 744 250 344 5.7Disbursement costs Task 1 9 503 1 330 10 833 0.2Office infrastructure costs Task 1 0 0 0 0.0
2 WATER RESOURCE INFORMATION AND DATA GATHERING 278 750 39 025 317 775 7.2Disbursement costs Task 2 15 000 2 100 17 100 0.4Office infrastructure costs Task 2 0 0 0 0.0
3i DETERMINATION OF THE MANAGEMENT CLASS: Ecological 852 150 119 301 971 451 21.9Disbursement costs Task 3i 170 000 23 800 193 800 4.4Office infrastructure costs Task 3i 0 0 0 0.0
3ii DETERMINATION OF THE MANAGEMENT CLASS: Socio Economic 285 200 39 928 325 128 7.3Disbursement costs Task 3ii 10 000 1 400 11 400 0.3Office infrastructure costs Task 3ii 0 0 0 0.0
3iii DETERMINATION OF THE MANAGEMENT CLASS: Water Resources 606 100 84 854 690 954 15.6Disbursement costs Task 3iii 20 000 2 800 22 800 0.5Office infrastructure costs Task 3iii 0 0 0 0.0
3iv DETERMINATION OF THE MANAGEMENT CLASS: Integration and decision analyses 150 370 21 052 171 422 3.9Disbursement costs Task 3iv 5 000 700 5 700 0.1Office infrastructure costs Task 3iv 0 0 0 0.0
4 COMMUNICATION AND LIAISON 357 786 50 090 407 876 9.2Disbursement costs Task 4 85 000 11 900 96 900 2.2Office infrastructure costs Task 4 0 0 0 0.0
5 CAPACITY BUILDING 169 600 23 744 193 344 4.4Disbursement costs Task 5 10 000 1 400 11 400 0.3Office infrastructure costs Task 5 0 0 0 0.0
6 STUDY MANAGEMENT AND CO ORDINATION 619 664 86 753 706 417 16.0Disbursement costs Task 6 20 000 2 800 22 800 0.5Office infrastructure costs Task 6 0 0 0 0.0
Total Professional fees 3 539 220 495 491 4 034 711 91.1Disbursement costs 344 503 48 230 392 733 8.9Office infrastructure costs 0 0 0 0.0
TOTAL 3 883 723 543 721 4 427 444 100.0
Cost (R) Task

Classification of Significant Water Resources in the Upper Middle and Lower Vaal WMAs Inception Report
Final Inception Report V20 March 2011
40
Table 8.2: Breakdown of professional fees allocated to each company
Company Hours Professional fees (R) % of
Exl VAT VAT Incl VAT total
WRP 1384 1 206 180 168 865 1 375 045 34.1%
DMM 163 130 400 18 256 148 656 3.7%
Rivers For Africa 1223 873 525 122 294 995 819 24.7%
Sub-consultant 158 150 100 21 014 171 114 4.2%
Zitholele 401 239 110 33 475 272 585 6.8%
Conningarth & Huggins 650 399 550 55 937 455 487 11.3%
Koekemoer Aquatic services 933 540355 75 650 616 005 15.3%
Total 4 912 3 539 220 495 491 4 034 711 100%
8.2 DISBURSEMENTS
The disbursement costs for the Study are R 344 503 (excl. VAT) and are allowed for as lump sum amounts.
Disbursements will be charged to the Client without mark-up and economy air travel will be used in all cases.
The rates for printing and copying costs are summarised in Table 8.3.
Table 8.3: Proposed rates for printing and copying costs
No. Description Size Rate
(R, excl. VAT)
1 Printing only of original/master A4 10.00
2 Duplicating: Black & white A4 0.38
3 Duplicating: Black & white A3 0.74
4 Duplicating: Colour A4 7.20
5 Duplicating: Colour A3 10.20
6 Transparencies: Black & white A4 4.50
7 Transparencies: Colour A4 14.95
8 Plan plotting: Paper: Black & white A0 86.00
9 Plan plotting: Paper: Black & white A1 75.00
10 Plan plotting: Paper: Black & white A2 58.00
11 Plan plotting: Paper: Black & white A3 40.00

Classification of Significant Water Resources in the Upper Middle and Lower Vaal WMAs Inception Report
Final Inception Report V20 March 2011
41
No. Description Size Rate
(R, excl. VAT)
12 Plan printing: Paper: Black & white A0 86.00
13 Plan printing: Paper: Black & white A1 75.00
14 Plan printing: Paper: Black & white A2 58.00
15 Plan printing: Paper: Colour A0 320.00
16 Plan printing: Sepia A0 58.00
17 Plan printing: Sepia A1 52.00
18 Plan printing: Sepia A2 40.00
19 Spiral binding with covers (per book) A4 9.90
20 Creating of original CDs, including labels - 85.00
21 Copies of CDs, including labels - 22.00
8.3 COMPARISON OF COSTS
The overall study budget has not changed since the proposal, however some task budgets have been moved
around. Table 8.4 provides a summary of these task budget changes. The main reason for the changes was the
need to increase the budget for the Communication and Liaison Task.

Classification of Significant Water Resources in the Upper Middle and Lower Vaal WMAs Inception Report
Final Inception Report V20 March 2011
42
Table 8.4: Comparison of costs: Inception vs proposal
Task Inception budget
Proposal budget
Difference
PROJECT INCEPTION 250344 251165 -821
Disbursement costs Task 1 10833 11400 -567
WATER RESOURCE INFORMATION AND DATA GATHERING 317775 324843 -7068
Disbursement costs Task 2 17100 22800 -5700
DETERMINATION OF THE MANAGEMENT CLASS: Ecological 971451 1021320 -49869
Disbursement costs Task 3i 193800 199500 -5700
DETERMINATION OF THE MANAGEMENT CLASS: Socio Economic 325128 325128 0
Disbursement costs Task 3ii 11400 11400 0
DETERMINATION OF THE MANAGEMENT CLASS: Water Resources 690954 690954 0
Disbursement costs Task 3iii 22800 22800 0DETERMINATION OF THE MANAGEMENT CLASS: Integration and decision analyses 171422 171422 0
Disbursement costs Task 3iv 5700 5700 0
COMMUNICATION AND LIAISON 407876 350121 57755
Disbursement costs Task 4 96900 73530 23370
CAPACITY BUILDING 193344 193344 0
Disbursement costs Task 5 11400 11400 0
STUDY MANAGEMENT AND CO ORDINATION 706417 706417 0
Disbursement costs Task 6 22800 34200 -11400
Professional fees 4034711 4034714 -3
Disbursement costs 392733 392730 3
TOTAL 4427444 4427444 0
8.4 SUMMARY OF COSTS
A summary of the Study Costs is provided in Table 8.5 below.
Table 8.5: Summary of the Study Costs.
Cost item Cost (R) % of
Excl VAT VAT Incl VAT total
Professional fees 3 539 220 495 491 4 034 711 91.1% Disbursement costs 344 503 48 230 392 733 8.9%
TOTAL 3 883 723 543 721 4 427 444 100.0%
8.5 CASH FLOW PROJECTION
A summarised cash flow projection is provided in Table C-4 of Appendix C. It should be noted that five invoices
have been submitted up to March 2011 with an associated total expenditure of R 489 332 (including VAT). This
actual expenditure is not reflected in Table C-4.
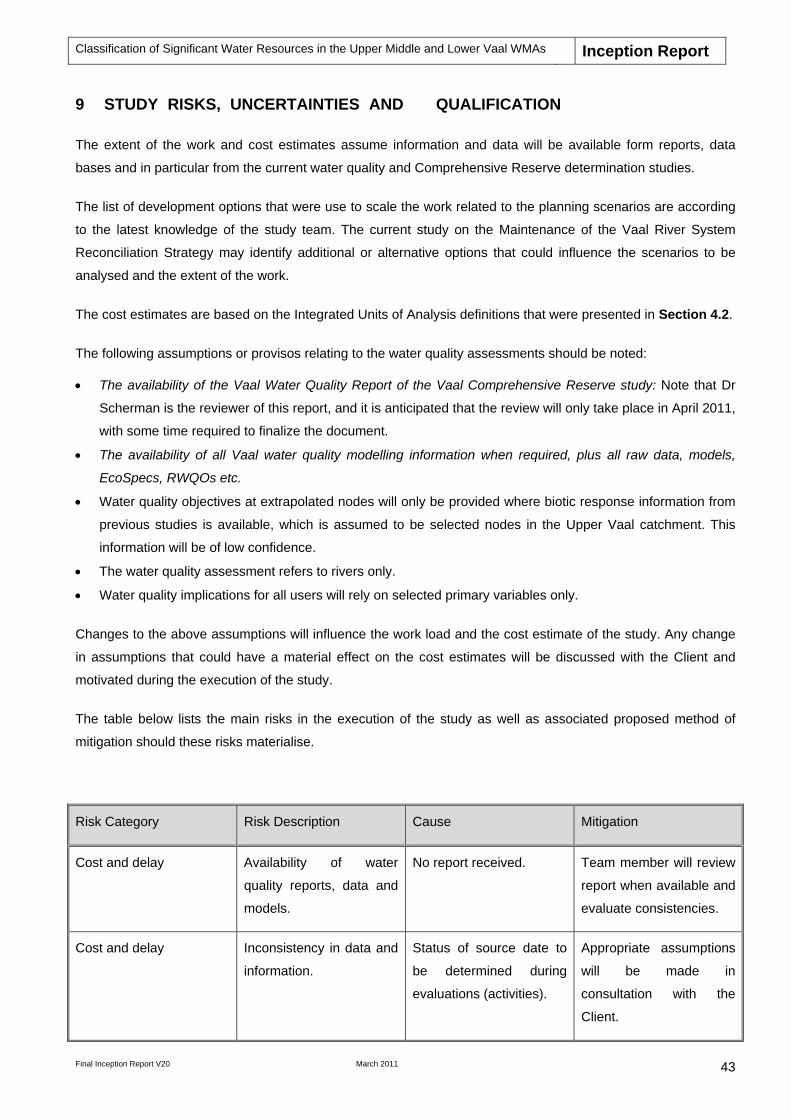
Classification of Significant Water Resources in the Upper Middle and Lower Vaal WMAs Inception Report
Final Inception Report V20 March 2011
43
9 STUDY RISKS, UNCERTAINTIES AND QUALIFICATION
The extent of the work and cost estimates assume information and data will be available form reports, data
bases and in particular from the current water quality and Comprehensive Reserve determination studies.
The list of development options that were use to scale the work related to the planning scenarios are according
to the latest knowledge of the study team. The current study on the Maintenance of the Vaal River System
Reconciliation Strategy may identify additional or alternative options that could influence the scenarios to be
analysed and the extent of the work.
The cost estimates are based on the Integrated Units of Analysis definitions that were presented in Section 4.2.
The following assumptions or provisos relating to the water quality assessments should be noted:
The availability of the Vaal Water Quality Report of the Vaal Comprehensive Reserve study: Note that Dr
Scherman is the reviewer of this report, and it is anticipated that the review will only take place in April 2011,
with some time required to finalize the document.
The availability of all Vaal water quality modelling information when required, plus all raw data, models,
EcoSpecs, RWQOs etc.
Water quality objectives at extrapolated nodes will only be provided where biotic response information from
previous studies is available, which is assumed to be selected nodes in the Upper Vaal catchment. This
information will be of low confidence.
The water quality assessment refers to rivers only.
Water quality implications for all users will rely on selected primary variables only.
Changes to the above assumptions will influence the work load and the cost estimate of the study. Any change
in assumptions that could have a material effect on the cost estimates will be discussed with the Client and
motivated during the execution of the study.
The table below lists the main risks in the execution of the study as well as associated proposed method of
mitigation should these risks materialise.
Risk Category Risk Description Cause Mitigation
Cost and delay Availability of water
quality reports, data and
models.
No report received. Team member will review
report when available and
evaluate consistencies.
Cost and delay Inconsistency in data and
information.
Status of source date to
be determined during
evaluations (activities).
Appropriate assumptions
will be made in
consultation with the
Client.

Classification of Significant Water Resources in the Upper Middle and Lower Vaal WMAs Inception Report
Final Inception Report V20 March 2011
44
Risk Category Risk Description Cause Mitigation
Costs and delay Stakeholder expectations
with respect to the
resolution of analysis.
Course resolution
hydrology and models are
available.
Negotiation and
application of qualitative
assessments.
Cost and delay Stakeholder expectations
with respect to the
methodology.
Methodology differs from
the approach presented
in the guidelines.
Negotiate or change the
work execution plan and
costs.

Classification of Significant Water Resources in the Upper Middle and Lower Vaal WMAs Inception Report
Final Inception Report V20 March 2011
45
10 REFERENCES
DWAF (2005) Department of Water Affairs, South Africa. Development of a Water Quality
Management Plan for the Waterval River Catchment: Upper Vaal Water
Management Area : Ecological Reserve Determination for the Waterval River
Catchment - Water Quantity Component. Study carried out by BKS (Pty) Ltd for
the Department of Water Affairs and Forestry, 2005.
Hughes and Forsythe
(2006)
Hughes DA and Forsythe DA (2006): A generic database and spatial interface
for the application of hydrological and water resource models. Computers
and Geosciences 32, 1389-1402.
Louw et.al. (2006) Louw, D., Kleynhans, C., Thirion, C., Todd, C., Birkhead, A. and Hughes, D.
2006: The development of a decision support system (DSS) to address the
issue of extrapolating ecological reserve (flow) information to other river
locations. Draft report, WRC research project K8-657, Pretoria, South Africa.
Other references can be provided on request.
DWAF, 2007 Department: Water Affairs and Forestry. Chief Directorate: Resource Directed
Measures. Development of the Water Resource Classification System
(WRCS) Volume 1 Overview and 7-step classification procedure. October
2006
DWAF (2008a) Department of Water Affairs, South Africa. Vaal River System: Large Bulk
Water Supply Reconciliation Strategy: Second Stage Reconciliation
Strategy. Study carried out by DMM Development Consultants, Golder
Associates Africa, SRK, WRP Consulting Engineers and Zitholele Consulting on
behalf of the Directorate: National Water Resource Planning, 2008
DWAF (2008b) Department of Water Affairs and Forestry, South Africa. Reports of the
Integrated Water Quality Management Plan. Study executed by Zitholele
Consulting, Golder Associates, DMM & WRP consultants on behalf of the
Directorate: National Water Resource Planning, 2008.
DWAF (2008c) Department of Water Affairs and Forestry, South Africa. Crocodile (West) River
Reconciliation Strategy Version 1. Study executed by BKS (Pty) Ltd. on behalf
of the Directorate: National Water Resource Planning, 2008.
DWA (2010a) Department of Water Affairs (DWA), 2010. Resource Directed Measures:
Comprehensive Reserve determination study of the Integrated Vaal River
System. Water Resource Modelling Report. Report produced by DMM
Development Consultants/Hydrosol/WRP Consulting Engineers. Report no:

Classification of Significant Water Resources in the Upper Middle and Lower Vaal WMAs Inception Report
Final Inception Report V20 March 2011
46
RDM/ C000/01/CON/0607
DWA (2010b) Department: Water Affairs, South Africa, 2010. Investigation of Bottlenecks
on the Usutu GWS and Usutu Vaal Phase II GWS: Water Requirements and
System Analysis Report Prepared by KV3 Engineers in Association with WRP
Consulting Engineers, Aurecon, DMM Development Consultants, Golder
Associates Africa and Kayamandi Development Services. (Draft Reports).
DWA (2010c) Department of Water Affairs (DWAF), 2010. Resource Directed Measures:
Comprehensive Reserve determination study of the Integrated Vaal River
System. Upper Vaal Water Management Area Technical Component:
Estimation Report. Report produced by Koekemoer Aquatic Services and
Rivers for Africa. Authored by Louw, D and Birkhead, AL. Report no:
RDM/WMA8C000/01/CON/0510.
CBD (1992) The Convention on Biological Diversity (CBD) is an international agreement adopted at the Earth Summit, in Rio de Janeiro, in 1992. It has three main objectives:
to conserve biological diversity to use its components in a sustainable way to share fairly and equitably the benefits arising from the use of genetic
resources. (http://www.biodiv.be/convention)
Scherman (2010) Scherman, P-A (2010). Orange River EFR study: Water quality. Appendix
prepared for Rivers for Africa EFR study for ORASECOM.

Final Inception Report V20 March 2011
Appendix A:
Study Program

Final Inception Report V20 March 2011
Classification of Significant Water Resources (River, Wetlands, Groundwater and Lakes) in the Upper, Middle and Lower Vaal Water Management Areas (WMA) 8,9,10
Gantt Chart
Oct Nov Dec Jan Feb Mar Apr May June July Aug Sep Oct Nov Dec Jan Feb Mar Apr May Jun Jul Aug Sep
1: Project inception 2: Water resource information and data gathering3: Determination of the Management Class (7 steps)3a: Step 1: Delineate units of analysis and describe the status quo 3b: Step 2: Link value and condition 3c: Step 3: Quantify EWRs and changes in non‐‐water quality EGSAs 3d: Step 4: Set ESBC scenario and establish starter configurations 3e: Step 5: Evaluate scenarios within the IWRM
3f: Step 6: Evaluate scenarios with stakeholders
3g: Step 7: Gazette class configuration
4: Communication and liaison5: Capacity Building
6: Study management and co‐ordination
Notes: EWR = Ecological Water Requirement EGSAs = Ecosystem Goods, Services and Attributes ESBC = Ecological Sustainability Base Configuration IWRM = Integrated Water Resource Management
( 1 ) = Water Resource Analysis Report and Preliminary MC for one IUA ( 2 ) = Ecological and Goods & Services Consequences Report
MonthsTasks and events
Draft Inception report
Water resource information& Gap analysis
Prepare templates
Stakeholder Scenario Evaluation
Announcement
Schedule of meetings
Meeting Preparations and minutes
Detailed programme Documentachievements
EWRreport (focus on additional nodes)
Definition of scenarios
Prelim. consequences (outcome)
IWRM templates
Impl. Plan
Final consequences (outcome)
Scoring system
{ SSC and TTG meetings, see Task 5 description for details }
Socio‐economic and analysis framework
Project Management Committee Meetings
Final Draft Inception report
(1) (2)

Final Inception Report V20 March 2011
Table A-1: Breakdown of Project Deliverables as per Financial Year
Quarter Month Deliverable/Milestone
Financial Year : 2011/2012
Q1 April 2011 – June 2011 Natural time series data for
secondary nodes. Units of Analysis and status quo
Report (including Socio-economic and analysis framework).
Stakeholder consultation on defining scoring system for scenario evaluation.
Q2 July 2011– September 2011 Analysis scoring system. Ecological Water Requirements
report. Stakeholder consultation on selection
of scenarios. Definition of operational scenarios to
be analysed with WRPM. Configurations of Decision Support
Tool (WRPM) representing defined operational scenarios.
Q3 October 2011– December 2011 WRPM scenario results. Assessment of preliminary Ecological
and Goods & Services consequences.
Q4 January 2012 – March 2012 Additional WRPM scenario analysis
results. Final Ecological and Goods &
Services consequences assessment. Water Resource Analysis report. Preliminary Management Class for
one IUA.
Financial Year : 2012/2013
Q1 April 2012 – June 2012 Final Stakeholder scenario
evaluation. Final Ecological, Goods & Services
and Socio-economic consequences report.
Proposed Management Classes for IUAs.
Q2 July 2012– September 2012 Final Management Classes for IUAs. IWRM templates. Documentation of capacity building
achievements.
Notes: WRPM = Water Resource Planning Model
IUA = Integrated Unit of Analysis
IWRM = Integrated Water Resource Management
Final Inception Report V20 March 2011
Appendix B:
Organogram

Final Inception Report V20 March 2011

Final Inception Report V20 March 2011
Appendix C:
Summary of Human Resources
Breakdown

Final Inception Report V20 March 2011
Table C-1: Professional fees for indicated team members
Notes: (1) “Negotiated” = Negotiated rate and “15c/100”,”16c/100” or “17.5c/100” = 15, 16.5 or 17.5 cent per hundred
rand rule.

Final Inception Report V20 March 2011
Table C-2: Hours for indicated team members per task
Person Van Rooyen PG Huggins G Swart HS Seago C Haasbroek B Hughes D Neethling C Renke R de Sousa P Mnguni DM Louw D Mullins W Mosaka D Cloete RTask 1 44 60 60 40 Task 2 12 25 21 8 83 65 Task 3i 120 37 139 Task 3ii 172 152 96 Task 3iii 45 80 340 80 40 80 Task 3iv 42 39 39 Task 4 22 92 Task 5 13 40 120 20 Task 6 192 92 48 192
Total 370 120 205 633 80 76 48 8 40 163 587 172 152 96
Person Maasdorp K Koekemoer S Sami K Louw S Lotter A Joubert A Mnqokpyi P Birkhead A Scherman P Rountree M Palmer R Kotze P Mackenzie J TotalTask 1 40 244 Task 2 60 65 339 Task 3i 110 84 234 223 150 120 60 125 80 1482 Task 3ii 420 Task 3iii 98 763 Task 3iv 40 160 Task 4 76 40 67 134 136 567 Task 5 20 213 Task 6 80 96 24 724
Total 110 300 158 370 131 134 136 223 150 120 60 190 80 4912

Final Inception Report V20 March 2011
Table C-3: Cost for indicated team members per task (R, excl. VAT)
Person Van Rooyen PG Huggins G Swart HS Seago C Haasbroek B Hughes D Neethling C Renke R de Sousa P Mnguni DM Louw D Mullins W Mosaka D Cloete RTask 1 52800 51000 45000 40000 Task 2 14400 21250 15750 3200 66400 65000 Task 3i 72000 25970 148300 Task 3ii 123200 109200 52800 Task 3iii 54000 68000 255000 56000 16000 64000 Task 3iv 55440 30030 42900 Task 4 26880 94000 Task 5 15600 34000 90000 20000 Task 6 241920 72300 17640 201600
Total 461040 72000 174250 478050 56000 56000 17640 3200 16000 130400 611800 123200 109200 52800
Person Maasdorp K Koekemoer S Sami K Louw S Lotter A Joubert A Mnqokpyi P Birkhead A Scherman P Rountree M Palmer R Kotze P Mackenzie J TotalTask 1 30800 219600 Task 2 57000 35750 278750 Task 3i 42350 45700 61350 152035 88740 60000 38280 73425 44000 852150 Task 3ii 285200 Task 3iii 93100 606100 Task 3iv 22000 150370 Task 4 38000 10000 52514 83040 53352 357786 Task 5 10000 169600 Task 6 41600 25200 19404 619664
Total 42350 157300 150100 96550 102718 83040 53352 152035 88740 60000 38280 109175 44000 3539220

Final Inception Report V20 March 2011
TABLE C-4:PROJECTED CASH FLOW Task Description Nov 2010 Dec 2010 Jan 2011 Feb 2011 Mar 2011 Apr 2011 May 2011 Jun 2011 Jul 2011 Aug 2011 Sep 2011 Oct 2011 Nov 2011 Dec 2011 Jan 2012 Feb 2012 Mar 2012 Apr 2012 May 2012 Jun 2012 Jul 2012 Aug 2012 Sep 2012 Oct 2012 Total
Month 1 Month 2 Month 3 Month 4 Month 5 Month 6 Month 7 Month 8 Month 9 Month 10 Month 11 Month 12 Month 13 Month 14 Month 15 Month 16 Month 17 Month 18 Month 19 Month 20 Month 21 Month 22 Month 23 Month 241 PROJECT INCEPTION 135 400 84 200 0 0 0 0 0 0 0 0 0 0 0 0 0 0 0 0 0 0 0 0 0 0 219 6002 WATER RESOURCE INFORMATION AND DATA GATHERING 0 0 75 750 93 250 44 250 65 500 0 0 0 0 0 0 0 0 0 0 0 0 0 0 0 0 0 0 278 750
3i DETERMINATION OF THE MANAGEMENT CLASS: Ecological 0 0 0 0 0 0 79 650 69 550 72 350 57 450 60 850 64 050 26 400 71 170 47 850 50 050 76 945 72 820 41 965 26 950 28 600 5 500 0 0 852 1503ii DETERMINATION OF THE MANAGEMENT CLASS: Socio Economic 0 0 0 0 0 0 0 0 0 58 800 56 000 56 000 92 400 22 000 0 0 0 0 0 0 0 0 0 0 285 2003iii DETERMINATION OF THE MANAGEMENT CLASS: Water Resources 0 0 0 0 0 0 57 000 73 600 0 0 177 000 187 000 0 0 111 500 0 0 0 0 0 0 0 0 0 606 1003iv DETERMINATION OF THE MANAGEMENT CLASS: Integration and decision analyses 0 0 0 0 0 0 0 0 0 0 0 0 0 0 0 0 74 800 75 570 0 0 0 0 0 0 150 370
4 COMMUNICATION AND LIAISON 0 0 71 930 8 960 37 040 44 840 12 040 8 960 26 100 8 960 45 120 8 960 12 936 9 856 46 992 0 15 092 0 0 0 0 0 0 0 357 7865 CAPACITY BUILDING 0 0 68 000 0 0 0 59 300 0 0 0 42 300 0 0 0 0 0 0 0 0 0 0 0 0 0 169 6006 STUDY MANAGEMENT AND CO ORDINATION 24 300 27 380 24 300 24 300 27 380 24 300 24 300 24 300 27 380 24 300 24 300 24 300 27 918 26 730 26 730 24 530 30 118 26 730 21 230 26 730 30 118 24 530 26 730 26 730 619 664
Total professional fees 159 700 111 580 239 980 126 510 108 670 134 640 232 290 176 410 125 830 149 510 405 570 340 310 159 654 129 756 233 072 74 580 196 955 175 120 63 195 53 680 58 718 30 030 26 730 26 730 3 539 220Disbursement costs 14 354 14 354 14 354 14 354 14 354 14 354 14 354 14 354 14 354 14 354 14 354 14 354 14 354 14 354 14 354 14 354 14 354 14 354 14 354 14 354 14 354 14 354 14 354 14 354 344 503Office infrastructure costs 0 0 0 0 0 0 0 0 0 0 0 0 0 0 0 0 0 0 0 0 0 0 0 0 0
Total cost excl. VAT 174 054 125 934 254 334 140 864 123 024 148 994 246 644 190 764 140 184 163 864 419 924 354 664 174 008 144 110 247 426 88 934 211 309 189 474 77 549 68 034 73 072 44 384 41 084 41 084 3 883 723 0
Total cost incl. VAT 198 422 143 565 289 941 160 585 140 248 169 853 281 174 217 471 159 810 186 805 478 714 404 317 198 369 164 286 282 066 101 385 240 893 216 001 88 406 77 559 83 302 50 598 46 836 46 836 4 427 444
Cumulative total cost incl. VAT 198 422 341 987 631 928 792 513 932 761 1 102 615 1 383 789 1 601 260 1 761 070 1 947 876 2 426 589 2 830 907 3 029 276 3 193 562 3 475 628 3 577 013 3 817 906 4 033 906 4 122 312 4 199 872 4 283 174 4 333 772 4 380 608 4 427 444
0
500 000
1 000 000
1 500 000
2 000 000
2 500 000
3 000 000
3 500 000
4 000 000
4 500 000
5 000 000
0
100 000
200 000
300 000
400 000
500 000
600 000
1 3 5 7 9 11 13 15 17 19 21 23
Ran
ds
(R)
Months
Cash Flow
Monthly Cumulative

Final Inception Report V20 March 2011
Appendix D:
Catchment Maps of the Integrated Units
of Analysis

Final Inception Report V20 March 2011

Final Inception Report V20 March 2011

Final Inception Report V20 March 2011

Final Inception Report V20 March 2011
Appendix E:
Description of the Integrated Vaal River
System

Final Inception Report V20 March 2011
E DESCRIPTION OF THE INTEGRATED VAAL RIVER SYSTEM (IVRS) AND HYDROLOGICAL
DATABASE
E.1 GENERAL
Owing to a number of inter-basin transfers both to and from the Vaal River catchment, the Vaal River System
is inter-linked with various other river basins. The Integrated Vaal River System (IVRS), therefore, comprises
all the individual river systems that are linked to the Vaal River (refer to Figure 1-1 on page 4 of main report)
which includes the following supporting sub-systems:
Komati Sub-system (Nooitgedacht and Vygeboom dams);
Usutu Sub-system (Westoe, Jericho and Morgenstond dams);
Heyshope Dam system;
Zaaihoek Dam system;
Upper Thukela Sub-system (Woodstock Dam and Driel Barrage); and
Senqu Sub-system (Katse and Mohale dams).
The Vaal River System is briefly described in Section E.2 and summarised information on the inter-basin
transfer schemes shown in Figure 1.1 (page 4 of main report) is as follows:
The Heyshope to Morgenstond Transfer Scheme: transferring water from Heyshope Dam in the
Assegaai River catchment to the Morgenstond Dam (Usutu Sub-system), with a maximum transfer
capacity of 1.4 m3/s.
The Heyshope to Grootdraai Transfer Scheme: transferring water from Heyshope Dam in the
Assegaai River catchment to the Upper Vaal WMA (Grootdraai Dam), with a maximum transfer
capacity of 4.28 m3/s.
The Zaaihoek to Grootdraai Transfer Scheme: transferring water from the Zaaihoek Dam in the
Slang River in the Buffalo Catchment to the Upper Vaal WMA (Grootdraai Dam), with a maximum
transfer capacity of 2.79 m3/s.
Thukela-Vaal Transfer Scheme: transferring water from Woodstock Dam and Driel Barrage in the
Upper Tugela Catchment to the Upper Vaal WMA (Sterkfontein Dam), with a maximum transfer
capacity 20 m3/s.
The Vaal–Olifants Transfer Scheme (Grootdraai): transferring water from Grootdraai Dam in the
Upper Vaal WMA to the Upper Olifants Catchment, with a maximum transfer capacity of 6.65 m3/s.
The Inkomati Transfer system: transferring water from Nooitgedacht and Vygeboom dams in the

Final Inception Report V20 March 2011
Komati West Catchment to the Upper Olifants Catchment.
The Lesotho Highlands Transfer System: transferring water from Katse and Mohale Dams in
Lesotho to the Upper Vaal WMA, with a maximum transfer capacity of 35.7 m3/s.
Vaal River Eastern Sub-system Augmentation Project (VRESAP): Transferring water from Vaal
Dam to the Sasol Secunda complex and the Eskom Power Stations in the Upper Olifants
Catchment, with a maximum transfer capacity of 5.07 m3/s.
E.2 DESCRIPTION OF THE VAAL RIVER SYSTEM
With reference to the Vaal River System it is important to distinguish between the Main Vaal System and the
smaller sub-systems in the Vaal. The Main Vaal System consists basically of four major storage dams in the
Vaal River Basin, i.e. the Grootdraai Dam, Sterkfontein Dam, Vaal Dam and Bloemhof Dam. These dams
are located on the main stem of the Vaal River with the exception of Sterkfontein Dam which is located on
the Wilge River tributary. Within the Vaal River Basin there is, however, also several smaller sub-systems
which are all operated independently from the main system. These smaller sub-systems are not used to
support the Main Vaal System and it is only the spillage from the smaller sub-systems that reaches the Main
Vaal System.
The Vaal River System comprises of the following three Water Management Areas (WMA):
Upper Vaal WMA;
Middle Vaal WMA;
Lower Vaal WMA.
E.3 HYDROLOGICAL DATABASE
The hydrological database resulting from the Vaal River System Analysis Update (VRSAU) Study (DWA,
1999) was included in the Water Resource Planning Model (WRPM) configuration in 1999. The hydrology
for sub-catchments within the Komati, Usutu, Thukela and Senqu river basins was also updated as part of
the VRSAU study. The VRSAU hydrology covers the period October 1920 to September 1995 (i.e. a period
of 75 years). It is important to note that the hydrological analyses of the VRSAU study were not necessarily
undertaken at quaternary catchment level as the focus was on the most representative modelling of relevant
sub-catchments. The strategy adopted for the Annual Operating Analysis (AOA) of the IVRS is to
continuously update and enhance the WRPM configuration and database as new information becomes
available. Updated hydrology of the Thukela and Schoonspruit River catchments were subsequently
included in the WRPM database. The updated hydrology of the Upper Waterval catchment resulting from the
most recent BKS study (BKS, 2005a) was included in the WRPM database as part of the Comprehensive
Reserve Determination Study.

Final Inception Report V20 March 2011
E.4 WATER REQUIREMENTS
The water requirement projections of water users in the IVRS are updated on an annual basis as part of the
Vaal River Annual Operating Analysis (AOA). Water requirement projections of bulk water users (Rand
Water, Midvaal Water Company and Sedibeng Water) and large industrial users (Eskom, Sasol and Mittal
Steel) are updated on a regular basis by these users themselves. The projections of other water use sectors
are updated as new information becomes available from more recent assessments.
Information on water requirements and return flows is captured within a database spreadsheet. Information is
available for so-called demand centres and is summarised within the context of sub-systems and user
groups rather than at quaternary catchment level.
The operation of the IVRS system is based on the principle that demands are restricted during severe
drought events. The objective of these restrictions is to reduce supply to less essential use to be able to
protect the assurance of supply to more essential use. The basis on which restrictions are implemented is
defined by means of the user priority classification definition.
The user priority classification definition requires that the different water users be grouped together into user
categories and these categories should be classified according to priority for water supply. The four user
categories that were considered for the IVRS are Domestic, Industrial, Strategic Industries and Irrigation.
The four user categories were each split into three different levels of assurance of supply namely a Low,
Medium and High priority level.

Final Inception Report V20 March 2011
Appendix F:
Inception Report Comments and
Response Summary

Final Inception Report V20 March 2011
Source of Comment
(Date received)
No.
Comment Response/ Reference to Inception Report
DWA: S Naidoo
(15 February 2011)
1 The report needs to be revised given the information provided from
the Comprehensive Reserve study.
Revision of relevant paragraphs was made in the report.
2 Include an Annexure for acronyms See table with acronyms on Page viii.
3 Ensure consistent use of terminology. Regulation 810 refers to the
Water Resource Classification System (WRCS) not NWRCS.
References corrected throughout the report.
4 Section 1.2 “Purpose of the study”- include capacity building. See Page 1, Section 1.2.
5 Consider enhancing the description of the study area to include the
following:
Socio-economic situation Hydrology Water resource infrastructure Water allocation data at quaternary level Aquatic ecosystem biodiversity Water quality Aquatic ecosystem condition & sensitivity Transboundary implications
See Page 2, Section 1.4 as well as Appendix E.
6 The Inception Report should ideally also summarise the IUA’s and
the information available (including information gaps) for each of
them.
Identification of the data elements indicate the required
data is available. Evaluations of consistency will be
carried out as part of the activities and tasks. Description
of the assessments and results will incorporate

Final Inception Report V20 March 2011
Source of Comment
(Date received)
No.
Comment Response/ Reference to Inception Report
presentations the data and information in each IUA.
7 Task 2 “Water Resource Information and data gathering”- The
Inception Report should contain an approach to verify baseline
information and mechanisms to address gaps.
Explanatory text was added to the task descriptions to
present the methods to deal with the limitation of data.
Consistency checks and evaluations will be undertaken
during the execution of the activities and tasks. These
checked will be against known norms and existing
knowledge of the specialists of the study area as well as
application of the methods in other studies in the country.
8 It is suggested that all significant water resources at IUA scale are
listed then prioritized for purposes of this study
Added text to list the significant resources (rivers and
groundwater assessment areas)
9 Indicate in the report where DWA guidance, as per the WRCS
guidelines, are not followed.
Principles will remain as per WRCS guidelines.
Methodology descriptions were improved in this version of
the report and may be refined as the study proceeds.
10 Due to the uncertainties and limitations that have been described in
implementing the WRCS in the Olifants, it is recommended that
Chapter 10 of the Report addressing the risks and uncertainties be
further enhanced with the addition of a table consisting of the
following elements:
Risk Category Risk Description
Table added in Chapter 9.

Final Inception Report V20 March 2011
Source of Comment
(Date received)
No.
Comment Response/ Reference to Inception Report
Cause Mitigation Action
This table will then be utilized in further DWA processes influenced
by the classification process.
11 6.1 Task 1: Project Inception, Last sentence.
Is it possible to adjust the budget at this early stage? Does it also
mean that the initial budget in the proposal has been adjusted?
The total study budget remained the same as in Proposal.
Changes were made to budgets of individual tasks. See
Page 42, Table 8.4.
12 6.2 Task 2, 4th paragraph.
Clarity must be sought to ascertain if the socio-economic
information was based on all parameters of the Water Resource
namely Quality, Biota, Riparian habitat and quantity.
See Page 18, Task 2, 4th Paragraph for confirmation.
13 Step 1d:
Seemingly the severe economic Prejudice concept and model
caters for volume allocation only. If that is the case then other
aspects of the resource will not be addressed e.g. the waste load
allocation for the discharge of treated or untreated waste into the
resource.
The Severe Economic Prejudice concept was updated to
include water quality and other restrictions. See Page 21,
Step 1i, Second Paragraph.
14 Step 5d: Opportunity cost is included. See Page 29, Step 5d, First

Final Inception Report V20 March 2011
Source of Comment
(Date received)
No.
Comment Response/ Reference to Inception Report
In the estimation of the magnitude of the change in benefits and
costs that may be experienced within the river system, does the
cost referred to here also include the opportunity costs?
Paragraph.
15 Step 5e:
I do not think the PSPs approach is in sync with the description of
this step in the WRCS guidelines. My understanding of this step is
that it outlines the macro economic benefits of different uses of the
resource e.g. if the resource is to be used heavily we must be able
to indicate the economic benefits that should be expected. This
could be direct and indirect.
The overall implication no a regional level is assessed
through the implications of scenarios on the augmentation
needs (translated into costs) of the Integrated Vaal River
System. This cost (difference in costs between scenarios)
influences water users outside of the catchment of the
Vaal River through the transfers and links. The difference
in the augmentation costs is therefore a practical measure
of the implications of each scenario relative to each other.
Text was added in steps 5e and 5f.
16 Page 1: appropriate adjustments will be made to the work
description and cost proposal after the information and data has
been thoroughly reviewed: no variation order will be entertained at
this stage, especially the cost.
Noted.
17 Page 6&7: the study team received additional reports for all WMAs.
Summary of information and data requirements need to be revised.
Revised. See Page 7.
18 Page 13: paragraph need to be revised as the information (middle Revised.

Final Inception Report V20 March 2011
Source of Comment
(Date received)
No.
Comment Response/ Reference to Inception Report
and lower) is available.
19 Page 16: the budget of the study was adjusted accordingly. When
was the budget adjusted?
The total study budget remained the same. Changes were
made to budgets of individual tasks. See Page 42,
Table 8.4.
20 Page 29: the background information is readily available. Approval of Inception Report did not influence progress.
BID was compiled and distributed.
21 Appendix B: RDM is Chief Directorate not Directorate Correction made. See Appendix B.
DWA:L Mulangaphuma
(18 February 2011)
1 Consensus was reached to deliver Preliminary MC at the end of
March 2012; can you please update Gantt bar chart and ensure
Preliminary MC is reflected as deliverable?
Included deliverable. See Appendix A: Gantt Chart.
2 Can you also ensure that milestone (Preliminary MC) is reflected in
inception report table 5.1 as deliverable/milestone?
Included deliverable: Table 5.1.
3 Briefly explain what are these deliverables? Water resource
analysis report and Preliminary and Final consequences reports.
Notes added to Table 5.1.
4 In Inception report, under scope of work heading, above mentioned
reports are not explained.
Notes added to Table 5.1.
DWA Kimberley: 1 On page 12, 4.2.4, the first sentence is suppose to read Lower Vaal Editorial correction made. See Section 4.2.4.
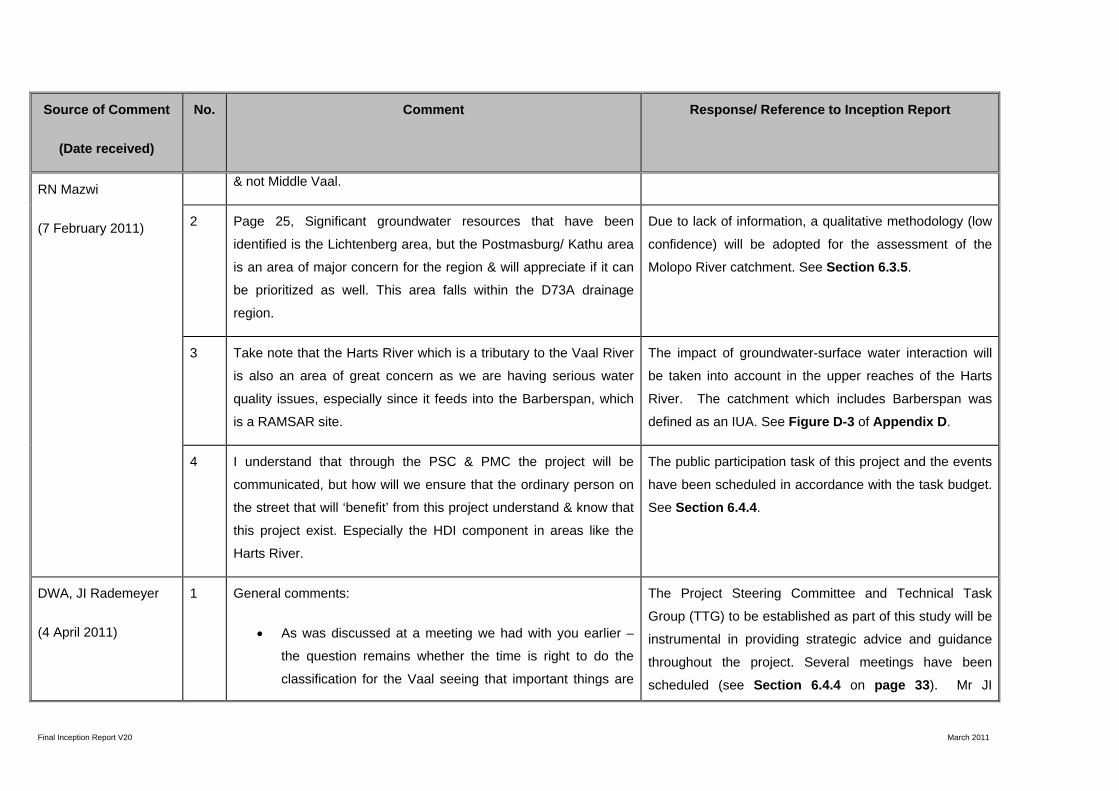
Final Inception Report V20 March 2011
Source of Comment
(Date received)
No.
Comment Response/ Reference to Inception Report
RN Mazwi
(7 February 2011)
& not Middle Vaal.
2 Page 25, Significant groundwater resources that have been
identified is the Lichtenberg area, but the Postmasburg/ Kathu area
is an area of major concern for the region & will appreciate if it can
be prioritized as well. This area falls within the D73A drainage
region.
Due to lack of information, a qualitative methodology (low
confidence) will be adopted for the assessment of the
Molopo River catchment. See Section 6.3.5.
3 Take note that the Harts River which is a tributary to the Vaal River
is also an area of great concern as we are having serious water
quality issues, especially since it feeds into the Barberspan, which
is a RAMSAR site.
The impact of groundwater-surface water interaction will
be taken into account in the upper reaches of the Harts
River. The catchment which includes Barberspan was
defined as an IUA. See Figure D-3 of Appendix D.
4 I understand that through the PSC & PMC the project will be
communicated, but how will we ensure that the ordinary person on
the street that will ‘benefit’ from this project understand & know that
this project exist. Especially the HDI component in areas like the
Harts River.
The public participation task of this project and the events
have been scheduled in accordance with the task budget.
See Section 6.4.4.
DWA, JI Rademeyer
(4 April 2011)
1 General comments:
As was discussed at a meeting we had with you earlier –
the question remains whether the time is right to do the
classification for the Vaal seeing that important things are
The Project Steering Committee and Technical Task
Group (TTG) to be established as part of this study will be
instrumental in providing strategic advice and guidance
throughout the project. Several meetings have been
scheduled (see Section 6.4.4 on page 33). Mr JI

Final Inception Report V20 March 2011
Source of Comment
(Date received)
No.
Comment Response/ Reference to Inception Report
not yet in place such as the CMA.
The consequences of implementing the Reserve have not
been work-shopped, which might have a huge influence on
the classification.
All of the above have to do with the fact that a lot of
discussion/interaction amongst the stakeholders will have to
happen, which is going to be much more than just having normal
study Steering Committee meetings, and my question is whether
this has been adequately been factored in? The consequences will
have to be thoroughly work-shopped.
Rademeyer will be invited to attend the TTG meetings to
ensure liaison with other parallel studies.
2 General comment: Tasks 3e to 3g disappeared in
Section 8: Study costs as well as Appendix C: Summary of
human Resources breakdown. I assume that the time and
costs are now added as part of other tasks.
Page 28, Section 6.3.5, second paragraph: “The study cost
estimate provided in the Financial Proposal makes
provision for five main scenarios where full evaluation of all
aspects will be carried out. Provision for a further five
alternative combinations of these five scenarios are also
included in the cost estimates. These five alternatives will
The breakdown of Task 3 “Determination of the
Management Class” into sub-tasks, as described in
Section 6.3, was based on the seven steps of the
Classification Process. The study budget for undertaking
Task 3 was, however, based on the following four main
aspects: Ecological assessments, Socio Economic
assessment, Water Resources assessments and the
Integration and Decision analyses. For clarification
purposes references to the latter were changed in
Section 8.

Final Inception Report V20 March 2011
Source of Comment
(Date received)
No.
Comment Response/ Reference to Inception Report
only involve simulations and qualitative comparative
analysis”. See my note under “General” on the fact that it is
not clear how tasks 3e to 3g were included in the budget.
3 Under References:
Vaal River Annual Operating Analysis Study managed by
the Directorate: Water Resources Planning Systems of
DWA.
Study to address and eradicate unlawful water use in the
three Vaal Water Management Areas. Referenced in the
minutes of the Vaal River System Strategy Steering
Committee meeting held on 21 October 2010.
Editorial corrections were made. See Page 6, second and
fourth bullet under heading “Current parallel studies or
processes”.
4 Page 12, Section 4.2.1, second paragraph: “In an ideal situation it
would have been preferred to have a properly calibrated higher
resolution network water resource model available for use in the
classification process. Such models have been developed for other
systems in the country as part of Water Availability Assessment
Studies where the focus was to develop installed modelling systems
to support the licensing of water use. Such detailed work requires
significant human resources and were not included in the proposal
of this study”.
The classification will be based on the most recent
information available for the study area. Furthermore, the
understanding is that the classification resulting from this
study can be revised once updated or new information
becomes available.

Final Inception Report V20 March 2011
Source of Comment
(Date received)
No.
Comment Response/ Reference to Inception Report
Question is whether we can proceed with what we have – in other
words: will the classification be compromised without all of this in
place?
5 Figure D-3 presents a map of the Middle Vaal WMA and there are
five proposed IUAs.
Editorial correction made. Page 14, Section 4.2.4:
“Middle” Vaal was changed to “Lower” Vaal.
6 Page 31, Step 7c: “At the inaugural management meeting it was
confirmed that the RQOs will form part of a separate process and
information from this study will be made available where
appropriate”.
Mr Rademeyer was a bit concerned about the somewhat one way
traffic that is sketched here. As he has indicated previously, he
thinks that the various processes have to be debated at the same
forum as they are influencing each other.
Integration of the classification study results and the
subsequent setting of the RQOs will have to be carried out
in subsequent processes.
7 Page 34, third paragraph under heading “(b) Establishing Technical
Task Group Meeting”: (costs for a repeat workshop were not
included in the budget).
Although Mr Rademeyer indicated under “General” that he is a bit
worried whether sufficient consultation/interaction/work-shopping
was going to take place, he felt a bit better having read the
The study allows for two Technical Task Group Meetings.

Final Inception Report V20 March 2011
Source of Comment
(Date received)
No.
Comment Response/ Reference to Inception Report
document up to here, but he still has his doubts.

Final Inception Report V20 March 2011
Appendix G:
Members of Project Steering Committee

Final Inception Report V20 March 2011
Last Name First Name Company Aaron Nontsikelelo Lejweleputswa District Municipality Abrahams Abe Department of Water Affairs (DWA) Ah Shene Verdoorn Carolyn Birdlife South Africa Armour Jack Free State Agriculture Atwaru Yakeen Department of Water Affairs (DWA) Augoustinos Mario Vaaldam Catchment Executive Committee Bakane-Tuoane Manana Anne Emfuleni Local Municipality Barnard Hendrik Ga-Segonyana Local Municipality Basson Noeline Sedibeng Water Batchelor Garth Department of Economic Development Environment and Tourism Bezuidenhout P J Overberg District Council Bierman Bertus Joint Water Forum and Anglo American Platinum Blair Vernon Department of Water Affairs (DWA) Boden Denis National Petroleum Refiners of S A (Pty) Ltd (NATREF) Bosch Gert Sishen Iron Ore Mine Bosman Lourie Agri Mpumalanga (Plaas Uitgezogt) Botha Hannes Mpumalanga Tourism and Parks Agency Bothes Elizabeth Department of Tourism, Environment and Conservation Brink Fanie Grain South Africa Broderick Maylene Economic Development, Environment and Tourism Burger Alwyn City of Tshwane Metropolitan Municipality Chamda Yunus Sedibeng District Municipality Chauke Lucia Eskom Chauke Sydney Emfuleni Municipality Chewe Victor City of Tshwane Metropolitan Municipality Claassens Johan TCTA Cloete Riekie Conningworth Economists Cogho Vik Optimum Coal Holdings Collins Nacelle Free State Department of Tourism, Environmental and Economi Cornelius Steven Gauteng Department of Agriculture and Rural Development Critchley John Rand Water Cronje Barry Rural Foundation de Fontaine Marc Rand Water Rietspruit Blesbokspruit Forum de Jager Steyn Greater Taung Municipality de Klerk Albert Midvaal Local Municipality De Kock Abe Farm: Mooidraai de Villiers D W Koppieskraal Irrigation Board Dhluwayo Boy Sol Plaatjie Municipality (Kimberley) Dini John South African National Biodiversity Institute Diniza Maria Gamagara Local Municipality Dippenaar Gideon Sedibeng Water Dippenaar Gideon Sedibeng Water Dlabantu Mpumelelo Working for Water Dlamini Mavela City of Johannesburg Metropolitan Municipality Dlamini Thami Msukwaligwa Local Municipality Donaldson R Manganese Mines Driver Mandy SANBI du Plessis Rickus Department of Agriculture and RuraL Development du Toit Hanke Department of Water Affairs (DWA) Du Toit Tienie Renoster River Water Users Association Eilard J Dikgatlong Local Municipality Eilerd Johannes Dikgatlong Local Municipality Els Nic City Council of Klerksdorp Erasmus Coenie Department of Tourism, Environment and Economic Affairs Erasmus Frik Durban Roodepoort Deep Limited Florence Achmat Frances Baard District Municipality Fourie A J Griqualand Exploration & Finance Co Ltd Fourie Wynand Department of Environmental Affairs (DEA) Gabriel Mary-Jean Department of Agriculture, Forestry and Fisheries (DAFF) Galane Malesela Environmental Justice Networking Forum (EJNF)

Final Inception Report V20 March 2011
Last Name First Name Company Gamede Andries Gert Sibande District Municipality Gaobusiwe Benjamin Kgalagadi District Municipality Gincane Ruben Mamusa Local Municipality Ginster Martin Sasol Gondo Joe National African Farmers Union (NAFU) Gopane Ruth Dikgatlong Local Municipality Gosani Ntsikelelo TCTA Greeff Henry Kgalagadi District Municipality Greyling Jan Matjhabeng Local Municipality Greyling S P J Schoonspruit Irrigation Scheme Grobler Willem Department of Water Affairs (DWA) Gungubele Mondli Ekurhuleni Metropolitan Municipality Hadebe Slindokuhle Ekurhuleni Metropolitan Municipality Hall Peter Sasol Infrachem (Leeu Spruit, Taaibosch Spruit Forum) Hanekom Dirk Eskom Harrison Pienaar Department of Water Affairs (DWA) Hauman Louis Kuruman Agricultural Union Hendriksz Johan East Rand Water Company (ERWAT) Itholeng Kebalepile Gauteng Department of Agriculture and Rural Development Itumeleng Clement Gamagara Local Municipality Izaaks Saul Siyanda Water and Sanitation District Jacobs Gideon Distrik Boere Unie Jooste Sebastian Department of Water Affairs (DWA) Joubert Andre Zitholele Consulting (Pty) Ltd Kadiaka Mamogala Department of Water Affairs (DWA) Keet Marius Department of Water Affairs (DWA) Kekesi Albert Bophirima District Municipality Khan Rafat Midvaal Water Company Kleynhans Neels Department of Water Affairs (DWA) Kokobela Mosimanegape House of Traditional Leaders Komape Martha Department of Water Affairs (DWA) Kruger Marina Midvaal Water Company Leeto Nokwanje Lejweleputswa District Municipality Leeuw David Sol Plaatjie Local Municipality Lekoko Simon Directorate of Traditional and Corporate Affairs Lethoko Itumeleng Ditsobotla Local Municipality Letlhogile Tshiamo Ditsobotla Local Municipality Letsoalo Mokopane Waterberg District Municipality Leuschner Andries Gold Fields South Africa Ltd Liefferink Mariette Federation for a Sustainable Environment (FSE) Liphadzi Stanley Water Research Commission Lobelo Govan Dr Ruth Segomotisi Mompati District Municipality Lodewijks Henk Anglo Coal Environmental Services Louw Delana Rivers for Africa Louw Lonnox Tosca Dolomite Water User Association Mabalane Itumeleng Chamber of Mines Maboe Paul Sasolburg Transitional Local Council Mabuda Solly Department of Water Affairs (DWA) Mafejane Ariel Johannesburg Water Magodi Omphemetse Kgalagadi District Municipality Mahonde Kay Birdlife South frica Mahusi Christopher Molopo Local Municipality Makape G G Tsantsabane Municipality Makena Gladys Magareng Local Municipality Makgalemane Itumeleng Greater Taung District Municipality Makodi Rebecca Leekwa Teemane Local Municipality Makuapane Andrew Leekwa Teemane Local Municipality Malaka Tebogo Department of Water Affairs (DWA) Malebye Patrick Dipaliseng / Balfour Local Municipality Manamela Sadimo Department of Water Affairs (DWA) Manele Sorrious Sedibeng District Municipality Mapholi Masindi Maquassi Hills Local Municipality

Final Inception Report V20 March 2011
Last Name First Name Company Maposa Delportshoop TLC Marx Karin Wildlife and Environment Society of South Africa (WESSA) Maseng Benardo Kgatelopele Local Municipality Masondo Amos City of Johannesburg Metropolitan Municipality Maswuma Zacharia Department of Water Affairs (DWA) Matseba Mogale Department of Water Affairs (DWA) Mazwi Nosie Department of Water Affairs (DWA) McCourt Liz Department of Environmental Affairs (DEA) Meintjes Louis Transvaal Agricultural Union South Africa (TAUSA) Mere Shedrick Magareng Local Municipality Midgley Ian Eskom Mlambo-Izquierdo- Poppy Kgatelopele Local Municipality Mmarete Charles Department of Water Affairs (DWA) Mmoiemang Kenneth Kgalagadi District Municipality Mngomezulu Willy Pixley Ka Seme Local Municipality Mnisi Jones Johannesburg Water (Pty) Ltd Mochware Ontlametse Kagisano Local Municipality Modisakeng Busisiwe Lesedi Local Municipality Mofokeng Mahole Sedibeng District Municipality Mofokeng Mpho Greater Taung District Municipality Mofokeng Puleng Department of Agriculture, Forestry and Fisheries Mogotlhe Paul North West Department of Agriculture, Conservation, Environment and Tourism Mohapi Ndileka Department of Water Affairs (DWA) Mokadi Andrew Vaal University of Technology Mokgosi Mantebo Moqhaka Local Municipality Mokgosi Mantebu Moqhaka Local Municipality Molema Kemonna Tribal Authority Molema Shelley Bophirima District Council Mompati Rose Naledi Local Municipality Mongake Monty Fezile Dabi District Municipality Mongolola Gift Ga-Segonyane Municipality Moraka William South African Local Government Association (SALGA) Mosai Sipho Rand Water Mothibi Dimakatso Department of Agriculture and Land Reform Motlhale Kelehile Tswelopele Local Municipality Motoko Phihadu Ratlou Local Municipality Mshudulu S A Emfuleni Local Municipality Mthimunye George Naledi Local Municipality Mtsuku Samuel Department of Tourism, Environment and Economic Affairs Mudau Stephinah Chamber of Mines South Africa Mulangaphuma Lawrence Department of Water Affairs (DWA) Muller Anton Bloemhofdam Kom Mutyorauta J J Department of Agriculture Mutyorauta Julius Department of Tourism, Environment and Conservation (DTEC) Mvula Obed Department of Land Affairs Mwaka Beason Department of Water Affairs (DWA) Mweli Zandisile Maquassi Hills Local Municipality Nagel Marius Government Communication and Information Systems (GCIS) Naidoo Shane Department of Water Affairs (DWA) Nakana Lesego Greater Taung Local Municipality Namusi Sedirilwe Molopo Local Municipality Nast Timothy Midvaal Local Municipality Naude Piet Free State Agricultural Water Committee Nengovhela Rufus Department of Water Affairs (DWA) Ngamole G Masilonyana Municipality Ngangelizwe Sebenzile Matjhabeng Local Municipality Ngcobo Mbuleleni Gert Sibande District Municipality Ngcobo Sonwabo Tswaing Local Municipality Ngema Khaya Ekurhuleni Metropolitan Municipality Ngila Zelna Siyanda District Municipality Ngomane Lulu Gauteng Water Sector Forum Ngxanga Eric Siyanda District Municipality

Final Inception Report V20 March 2011
Last Name First Name Company Nkonyane Martha Nkwane Oupa City of Tshwane Metropolitan Municipality Nosi Thabo Frances Baard District Municipality Ntili Tseliso Department of Water Affairs (DWA) Ntsepe Sello Mantsopa Local Municipality Ntsizi Thembile Wes Vaal Chamber of Commerce Ntwe Francisco Ratlou Local Municipality Nyamande Tovhowani Department of Water Affairs (DWA) Oagile Mothus Kagisano Local Municipality Oosthuizen Christo Louwna/Coetzerdam Water User Association Opperman Dirk Land Affairs Opperman Nic Agri SA Peek Bobby GroundWork - Friends of the Earth South Africa Petersen Thabo Matjhabeng Local Municipality Phukuntsi Rosy Tswelopele Local Municipality Pienaar Harrison Department of Water Affairs (DWA) Pienaar P G Vyf Hoek South Management Board Pillay Nava Metsweding District Municipality Potgieter Ampie Sasol Mining Rights Department (SMRD) Potgieter Jan Department of Agriculture, Forestry and Fisheries Potgieter Sandra Dow Plastics Pretorius Theuns Kaalfontein Boerevereniging Distriks Landbou Unie Pyke Peter Department of Water Affairs (DWA) Radebe Khulu Male Development Agency Rademeyer Seef Department of Water Affairs (DWA) Ramaema Lowrence Department of Tourism, Enviroment and Economic Affairs Ramokgopa Kgosientsho City of Tshwane Metropolitan Municipality Ramokhoase Jonas Fezile Dabi District Municipality Rampai Constance Mantsopa Local Municipality Rampine M K South African National Civic Organisation (SANCO) Boikhotsong Reinecke C J Potchefstroom Univ for CHE Reitz J J C Kalahari East Water User Association Rossouw Lourens Tokologo Local Municipality Rust Nelia Matjhabeng Local Municipality Sales Malcolm Lebalelo Water User Association Samson Paballo Moshaweng Local Municipality Sebusho Sipho Kgalagadi District Municipality Seikaneng Tefo Moshaweng Local Municipality Shabalala Sam Emfuleni Local Municipality Shone Steve Grain SA Sindane Jabulani Lekwa Local Municipality Slabbert Nadene Department of Water Affairs Smit Hennie Department of Water Affairs (DWA) Snyders Louis Department of Water Affairs (DWA) Stoch Leslie Geotech (Lower Wonderfonteinspruit Forum) Stoltz Gert Molopo Farmers Union Surendra Anesh Eskom Sutton Malcolm Anglogold Swart Susan WRP Consulting Engineers (Pty) Ltd Takalo Mmabatho City of Tshwane Metropolitan Municipality Terrè-Blanche Riana Namaqualand Water and Sanitation Support Group (NAWASAN) Thakurdin Manisha Department of Water Affairs (DWA) Theron Danie Christiana Farmers Association Theron J H Vaalharts Water Users Association Theron Piet Munisipaliteit van Delportshoop Thirion Christa Department of Water Affairs Thompson Isa Department of Water Affairs (DWA) Tlhape Manketse Tswaing Local Municipality Tshipelo Kenneth Mamusa Local Municipality Tsotetsi Mabalone Dipaliseng Local Municipality Ubisi Makumu Sedibeng Water van Aswegen Johann Department of Water Affairs (DWA)

Final Inception Report V20 March 2011
Last Name First Name Company van den Berg J W Saamstaan Agricultural Union van den Berg Ockie Department of Water Affairs (DWA) van den Bon Patrick Vadex Consulting cc van der Heever Piet Lesedi Local Municipality van der Merwe Ben Emfuleni Local Municipality van der Merwe Danie Ekurhuleni Metropolitan Municipality van der Merwe Johan Rand Water van der Walt Philip City of Tshwane Metropolitan Municipality van der Westhuizen Walther Department of Water Affairs (DWA) van Rooyen Johan Department of Water Affairs (DWA) van Rooyen Pieter WRP Consulting Engineers (Pty) Ltd van Schalkwyk V South African Rivers Association van Tonder Dean Sasol Mining van Vuuren Hennie Regina Farmers Union van Vuuren J L Frankfort TLC van Wyk Francois Rand Water van Wyk Jurgo Department of Water Affairs (DWA) van Wyk Niel Department of Water Affairs (DWA) van Zyl Andre Fezile Dabi District Municipality Van Zyl Chris TAU SA Agricultural Union van Zyl J F C Bloemhof TLC Venter Gerda Department of Water Affairs (DWA) Venter Petrus Department of Water Affairs (DWA) Vilakazi Bheki Msukwaligwa Local Municipality Viljoen Peter Vereeniging Refractories Ltd Vorster Albert Kimberley Agricultural Union Watson Marie Centre for Environmental Management Wepener Lotter River Property Owners' Association - Save the Vaal Williams Bruce Klerksdorp Irrigation Board Woodhouse Philip Goldfields (West Driefontein Gold Mine) Yawitch Joanne Department of Environmental Affairs (DEA)