Embed Size (px)
Citation preview
“main” — 2013/4/1 — 19:47 — page 179 — #1
Journal of Computational Interdisciplinary Sciences (2011) 2(3): 179-196© 2011 Pan-American Association of Computational Interdisciplinary SciencesPrinted version ISSN 1983-8409 / Online version ISSN 2177-8833http://epacis.netdoi: 10.6062/jcis.2011.02.03.0045
Classification of oral bioavailability of drugs
by machine learning approaches: a comparative study
Rajnish Kumar1,2, Anju Sharma1,2, Pritish Varadwaj1, Ausaf Ahmad2 and Ghulam Md Ashraf2
Manuscript received on March 9, 2011 / accepted on August 15, 2011
ABSTRACT
Oral Bioavailability is the rate and extent to which an active drug substance is absorbed and becomes available to the general circulation.
A computational model for the prediction of oral bioavailability is a vital initial step in the drug discovery. It is decisive for selecting
the promising compounds for the next level optimizations and recognition for the clinical trials. In the present investigation we aimed
to perform the oral bioavailability prediction by comparing three machine learning methods i.e. Support Vector Machine (SVM) based
kernel learning, Artificial Neural Network (ANN) and Bayesian classification approach. The overall prediction efficiency of SVM based
model for the test set was 96.85%, whereas according to the Bayesian classifier and ANN methods prediction efficiency was found to
be 92.19% and 94.53% respectively. Thus the present results clearly suggested that the SVM based prediction of oral bioavailability
of drugs is more efficient binary classification approach for the data under consideration.
Keywords: Artificial Neural Network, Bayesian classification, oral bioavailability, prediction, Support Vector Machine.
1 INTRODUCTION
Bioavailability is the amount of drug that reaches to the blood inan unchanged form, to carry out its pharmacological and thera-peutic effect. It confers the rate at which the drugs get absorbedand the total amount that reaches to the systemic circulation.Understanding the bioavailability of a concern drug is crucial asthe drug has to undergo a number of complicated biochemicalpathways before producing the desired therapeutic effect. Hence,high oral bioavailability is among the most important considera-tion during drug development process.
There exists a plethora of studies to predict oral bioavailabil-ity which indicates that it is incredibly rich area of research. Oralbioavailability is usually determined in the preclinical stage ofdrug development process. Therefore, there is a need of a robustand accurate computational model which can predict the oral
bioavailability of compounds without carrying out experiments.Various attempts in estimating oral bioavailability are reportedin literature belonging to different categories viz. statistical ana-lysis on known oral bioavailable drugs [12, 17], mechanisticmodels [20, 22], QSAR/QSPR models [16, 10], genetic program-ming [3, 9], Artificial Neural Networks (ANN), machine learningclassification etc [19, 13].
Classification is a process of developing a function whichdescribes and/or distinguishes data on the bases of attributes[13]. Classification is a two step process. First is the learning ortraining step. It involves development of classifier describing thepredetermined set of classes using a training set. This is alsocalled supervised learning as classifier learns from a dataset inwhich classes are defined for each data. Second step involvestesting of the classifier developed, in which a new data indepen-dent of the training set is used to determine the accuracy of clas-
Correspondence to: Anju Sharma – E-mail: [email protected] of Bioinformatics, Indian Institute of Information Technology Allahabad, Deoghat, Jhalwa, Allahabad-211012, Uttar Pradesh, India.2Amity Institute of Biotechnology (AIB), Amity University Uttar Pradesh (AUUP), Lucknow-226010, Uttar Pradesh, India.
“main” — 2013/4/1 — 19:47 — page 180 — #2
180 CLASSIFICATION OF ORAL BIOAVAILABILITY OF DRUGS BY MACHINE LEARNING APPROACHES
sifier. The function thus developed is used to predict class of datawhose class label is unknown. Data can be classified using dif-ferent approaches like ANN, Bayesian classifiers, Support VectorMachine (SVM) etc.
2 MATERIALS AND METHODS
2.1 Data collection and data pre-processing
2.1.1 Collection of drugs
The oral-bioavailability dataset used in this study was obtainedfrom seven different sources [21, 6, 25, 15, 4, 8, 11]. Each drugmolecule was represented with their chemical formulae and theirbioavailability values. Dataset for this study comprises of total511 drugs which are chemically diverse. Further the dataset of511 drug molecules are randomly split into training and test setusing 3:1 principle. Training set consists of 384 drugs whereasthe test set consists of 127 drugs.
2.1.2 Calculation of descriptor values
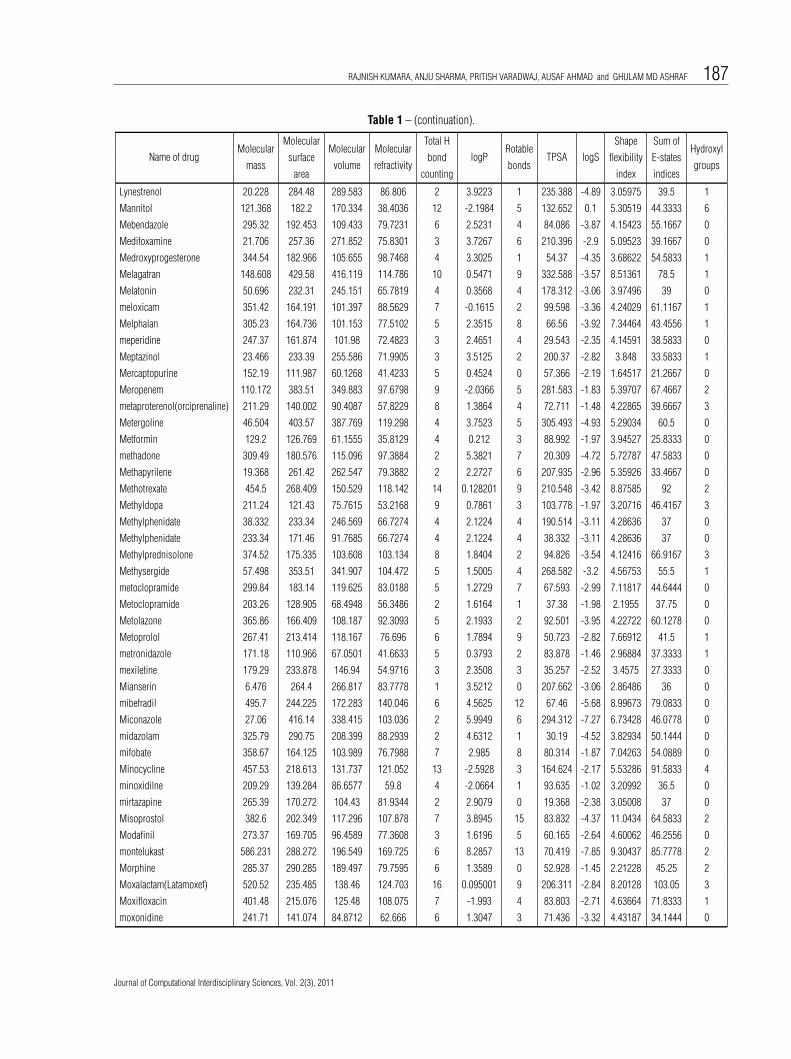
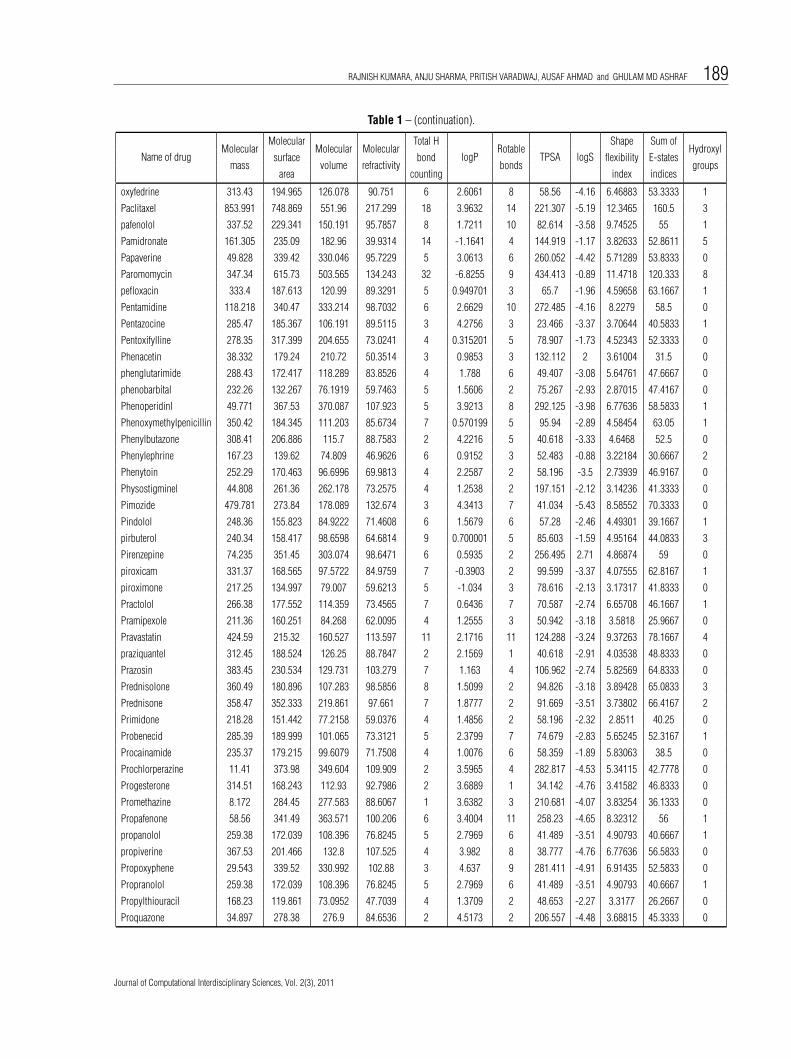
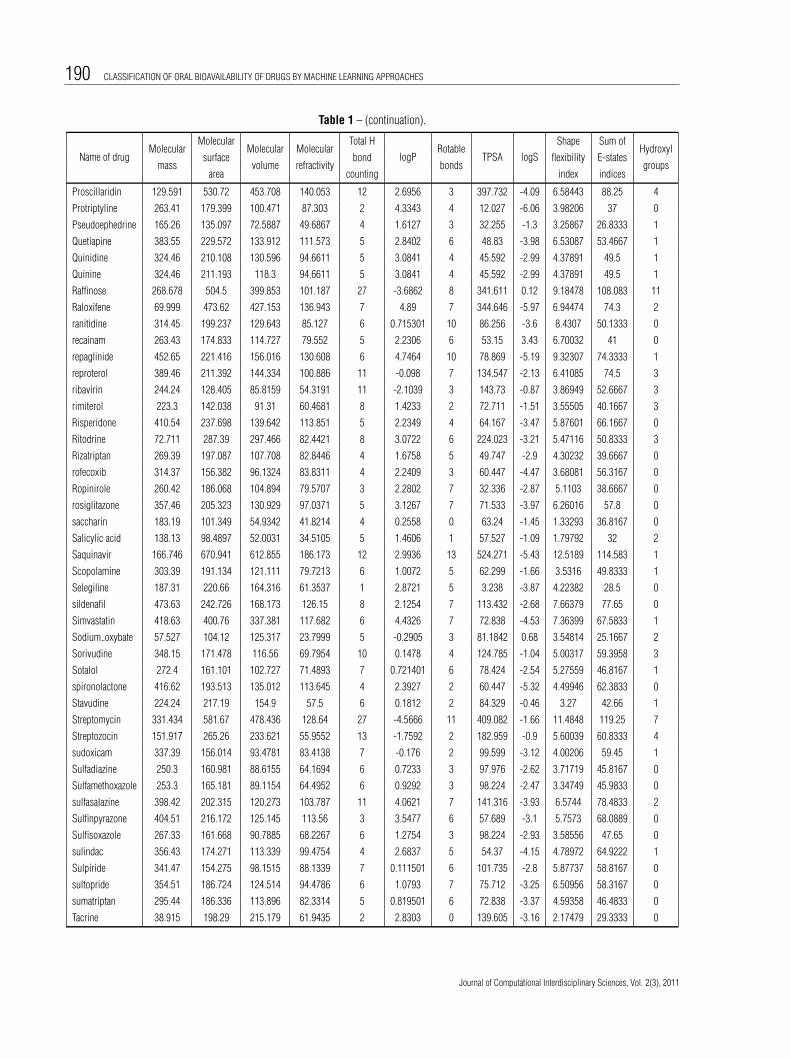
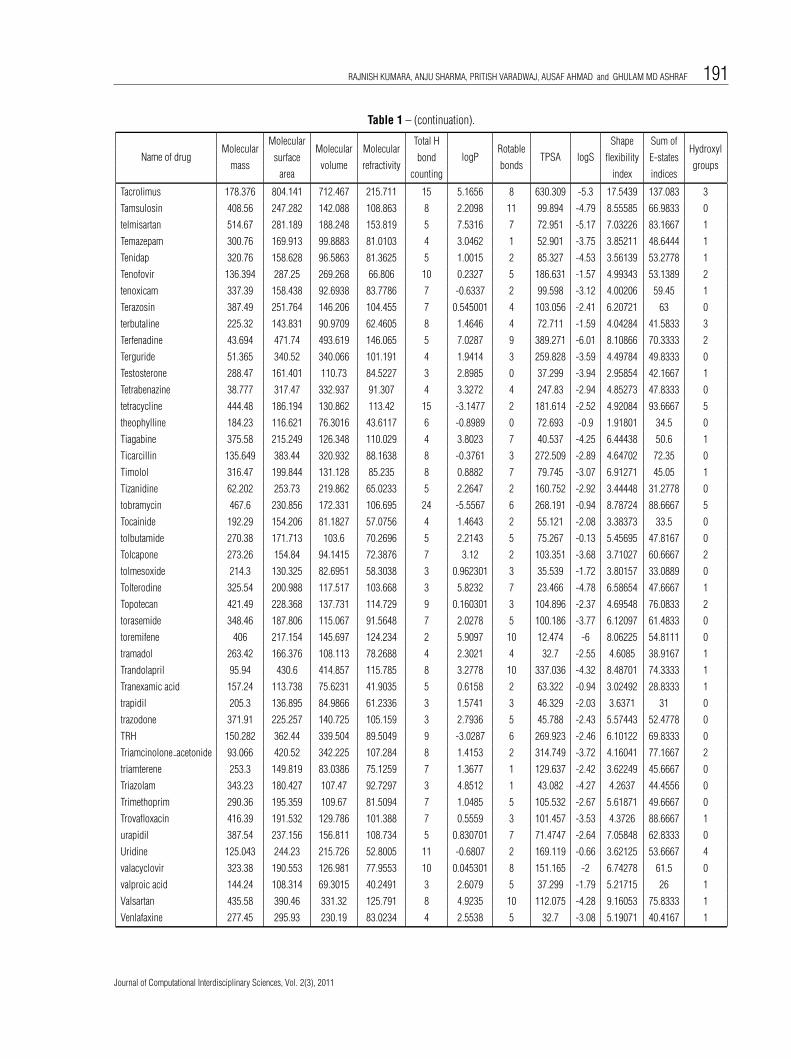
Initially total 29 descriptors (physicochemical properties) werecollected from various sources. The two softwares used for thecalculation of all descriptors were the commercial versions ofDRAGON [18] and TSAR (Supplementary: Tables 1-2).
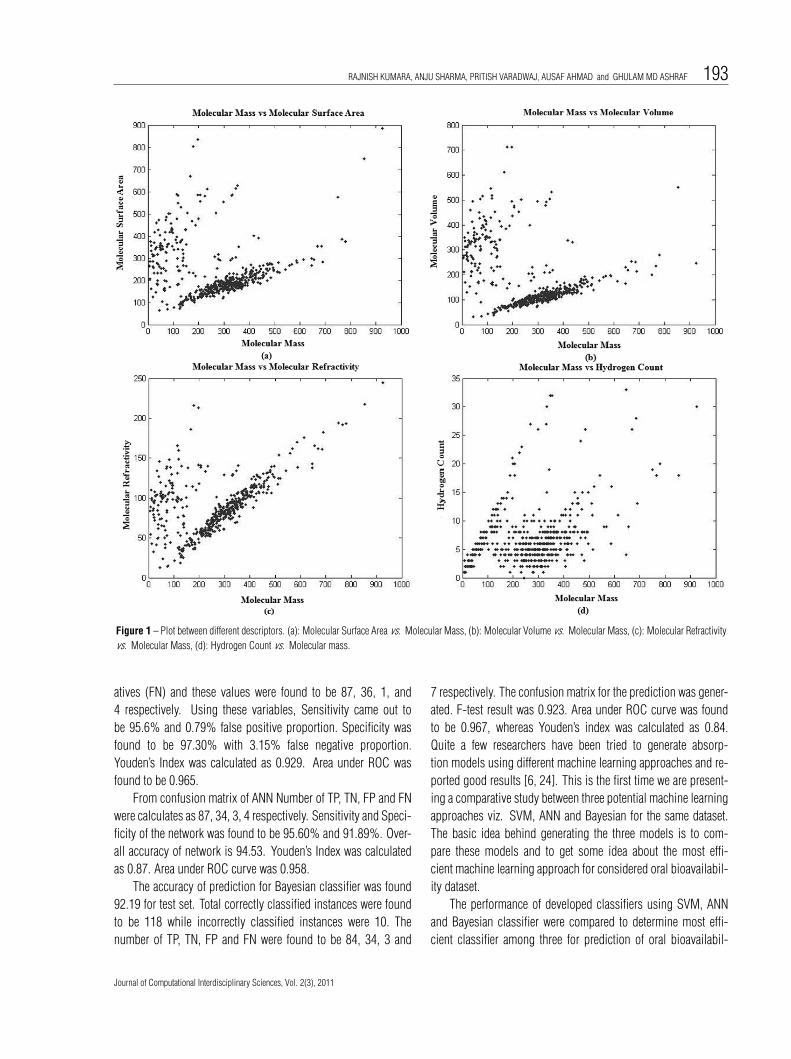
In our models we used diverse data set in order to avoid anybiasness in it. For this purpose values of descriptors were plottedagainst each other to examine the diversity among the descriptors(Fig. 1).
2.1.3 Selection of optimal descriptors
In order to minimize the dimension feature space (a possible out-come of large number of descriptors), we have selected Sequen-tial Forward Feature Selection (SFFS) algorithm. This facilitatesidentifying and removing the irrelevant and redundant informa-tion as much as possible to improve the performance of machinelearning algorithms.
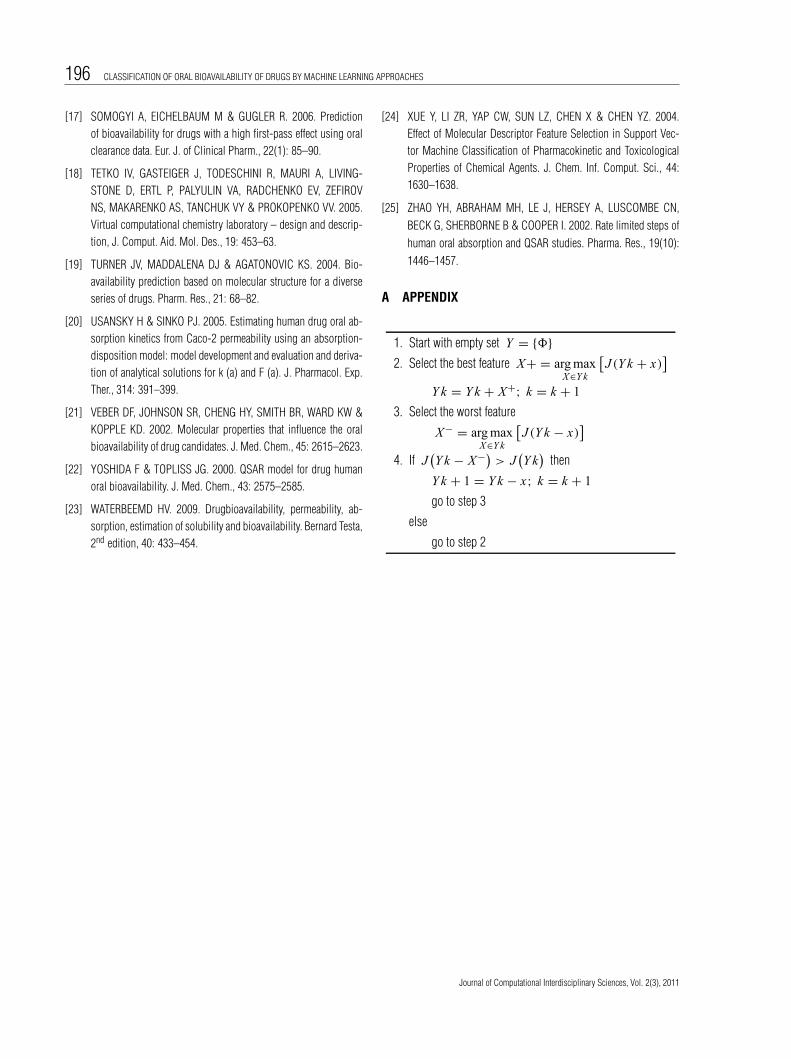
SFFS algorithm starts with an empty set of features. In firstiteration, algorithm considers all feature subsets with only onefeature. Feature subset with higher accuracy is used as basis ofnext iteration. Iteratively, algorithm tentatively adds to the basiseach feature which was not previously selected and retains thefeature subset that results in the highest estimated performance.The search terminates after the accuracy of the current subset can-not be improved by adding any other feature [1]. SFFS is statedas: Given a feature set X = {xi |i = 1 . . . N }, find a subsetY M = {xi . . . x M}, with M < N , which optimizes an objec-tive function J (Y ). SFFS algorithm can be seen in Appendix.
Thus by implementing the SFFS algorithm we identified12 descriptors as optimal features and selected for generation
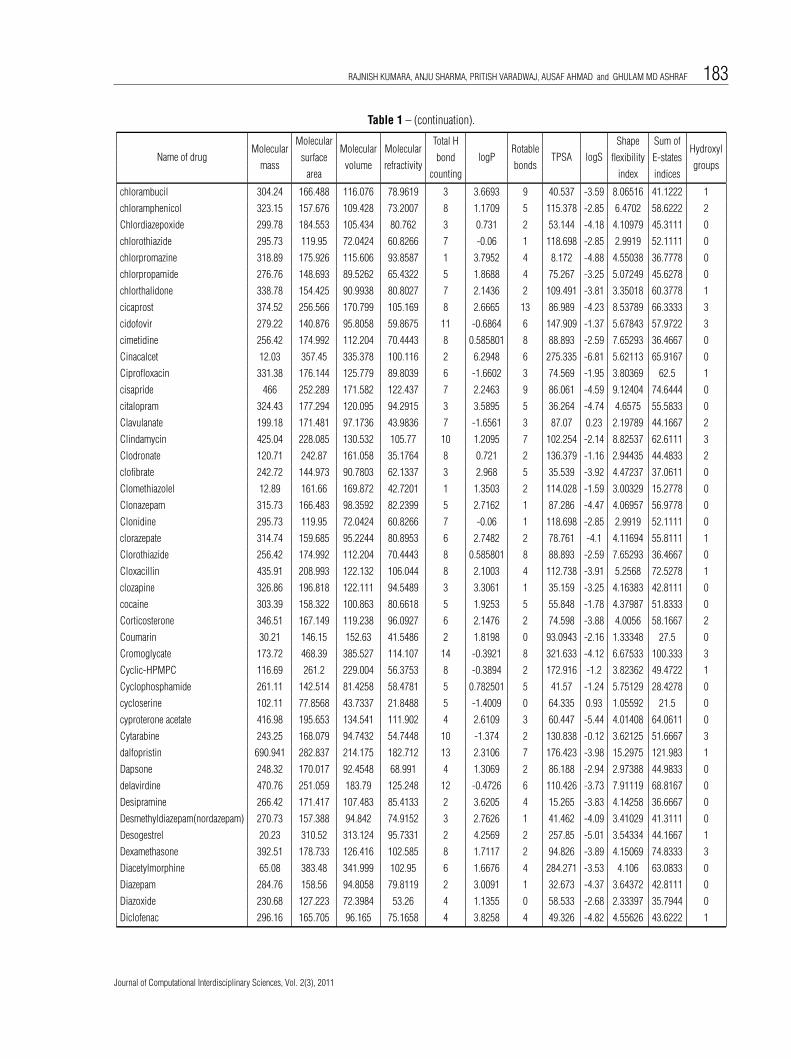
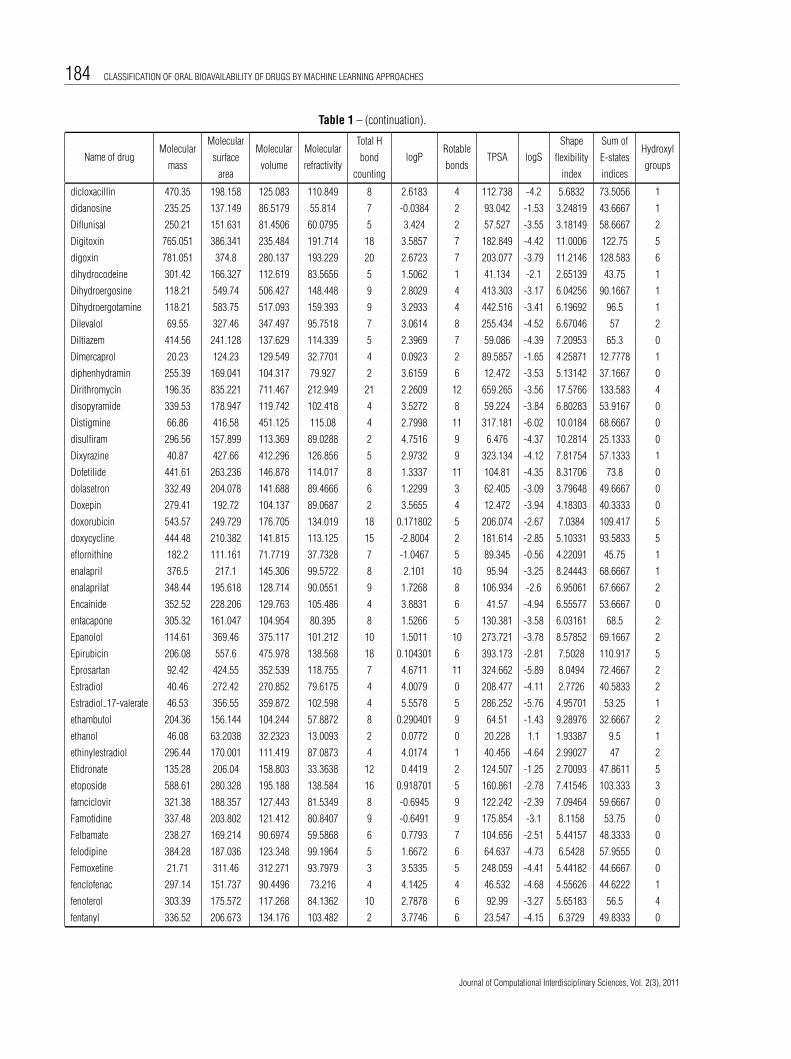
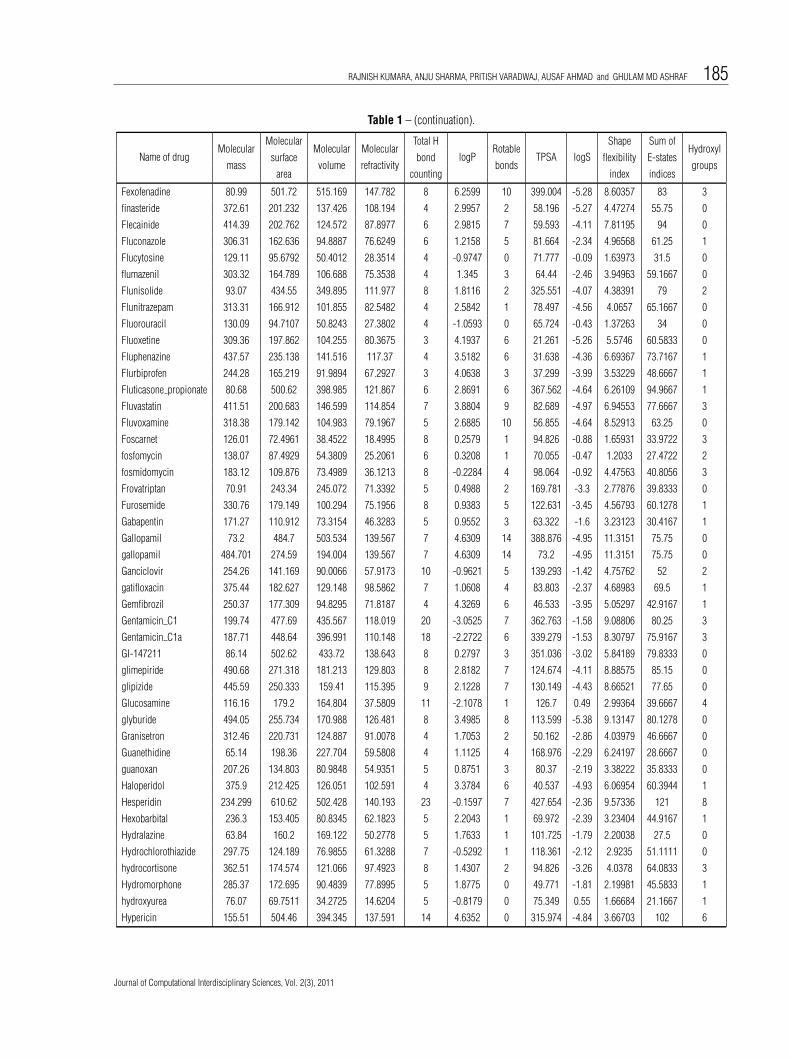
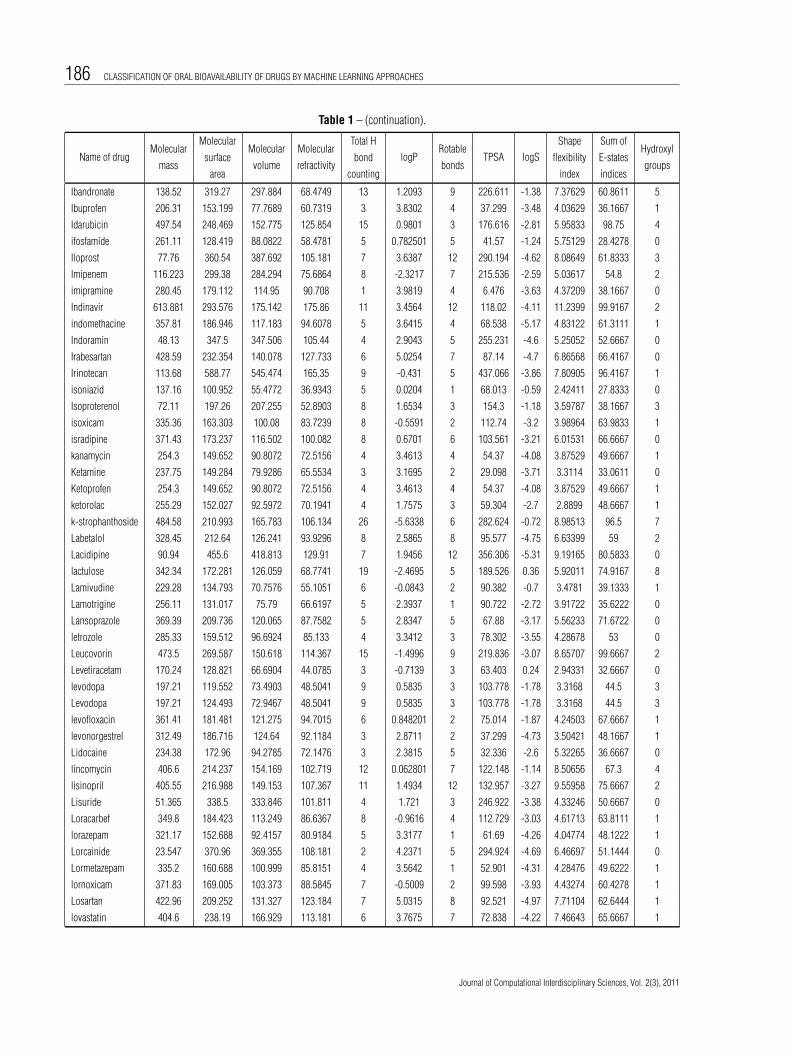
of the prediction model. These descriptors include MolecularMass (MA), Total Hydrogen Count (HC), Total Polar SurfaceArea (TPSA), Partition Coefficient (logP), Rotatable Bonds (RTB),Shape Flexibility Index (SFI), Molecular Volume, Molecular Re-fractivity [14], Molecular Surface Area (MSA), Solubility index(logS) [23], Count of Hydroxyl groups (HYG) [22] and Sum ofE- states indices (SESI) [5].
2.2 Implementation of classification approaches
In present study, the aim is to construct a classifier for a givendrug dataset which can differentiate drugs into two classes on thebasis of their physicochemical properties. Classification is per-formed in such a way that each drug in the training data corre-sponds to a particular class and is represented by a set of fea-tures. Before employing any classification approach, assignmentof class labels to whole drug data set was required. The con-structed classifier is applied on the independent drug data set inorder to predict the class label for it. We have defined two classesfor the dataset ‘low orally bioavailable (LO, less than 30 percent)’and ‘high orally bioavailable (HO, greater than or equal to 30 per-cent)’ [6]. Class labels were defined as 0 and 1 for LO and HOrespectively.
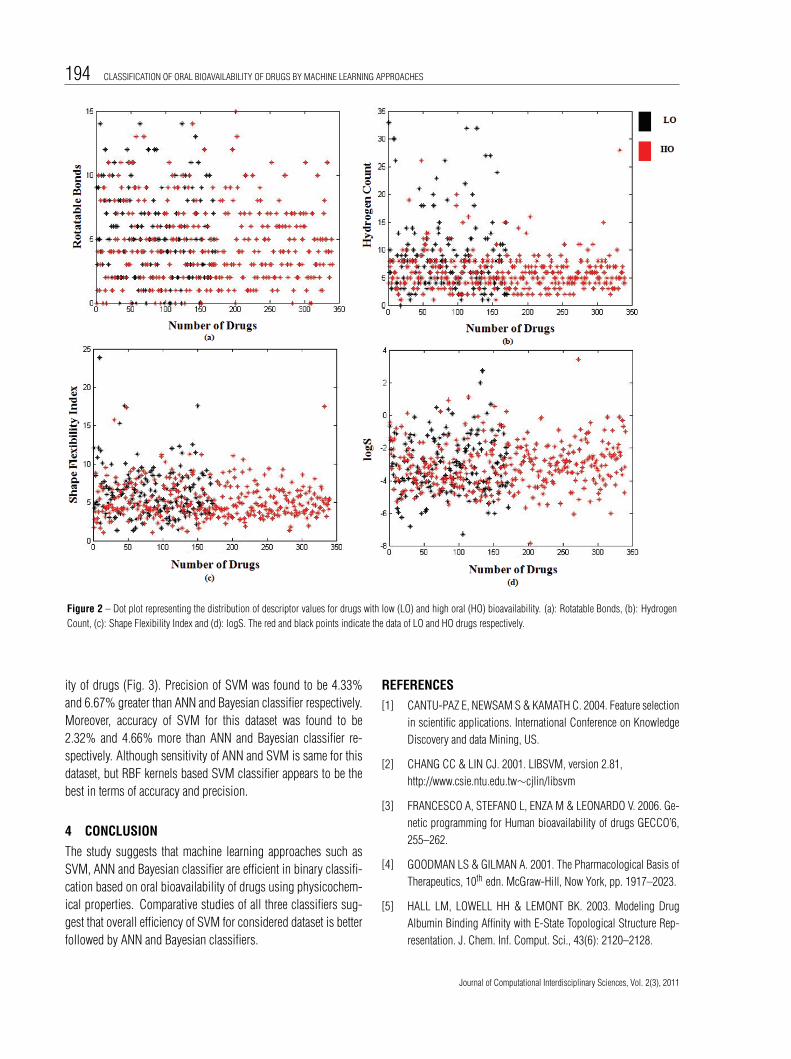
In order to select suitable classifier, it was crucial to find outwhether the data is linear or non-linear. We plotted the two de-fined classes for each of 12 descriptors. The distributions of datapoints for both the classes were found to be diverse, (Fig. 2) sonon-linear classifiers were selected. In this study Support Vec-tor Machine (SVM), Artificial Neural Network (ANN) and Bayesianclassifiers were implemented to classify the drugs into LO and HO.
2.2.1 Classification by Support Vector Machine
In the present study LibSVM package (version 2.81) [2] was usedto implement SVM. The training dataset was used as input forSVM based classification and following steps were performed:
a) Scaling of data: Descriptors values were scaled within anumeric range –1 and 1 [7].
b) Kernel Selection: In LibSVM, there are four kernels [linear,sigmoid, gaussian, radial basis function (RBF)]. Individu-ally all kernels were tried to determine best kernel in termsof accuracy. As we observed the best efficiency in RBF, soit was used for classification in the current study.
c) Determination of optimal parameters [cost factor, (C) andkernel parameter (γ )]: Grid search was used to deter-mine optimal value of C and γ , which was found to be512 and 0.0078125 respectively. Finally the classificationmodel was generated using the best parameters C and γ .
Journal of Computational Interdisciplinary Sciences, Vol. 2(3), 2011
“main” — 2013/4/1 — 19:47 — page 181 — #3
RAJNISH KUMARA, ANJU SHARMA, PRITISH VARADWAJ, AUSAF AHMAD and GHULAM MD ASHRAF 181
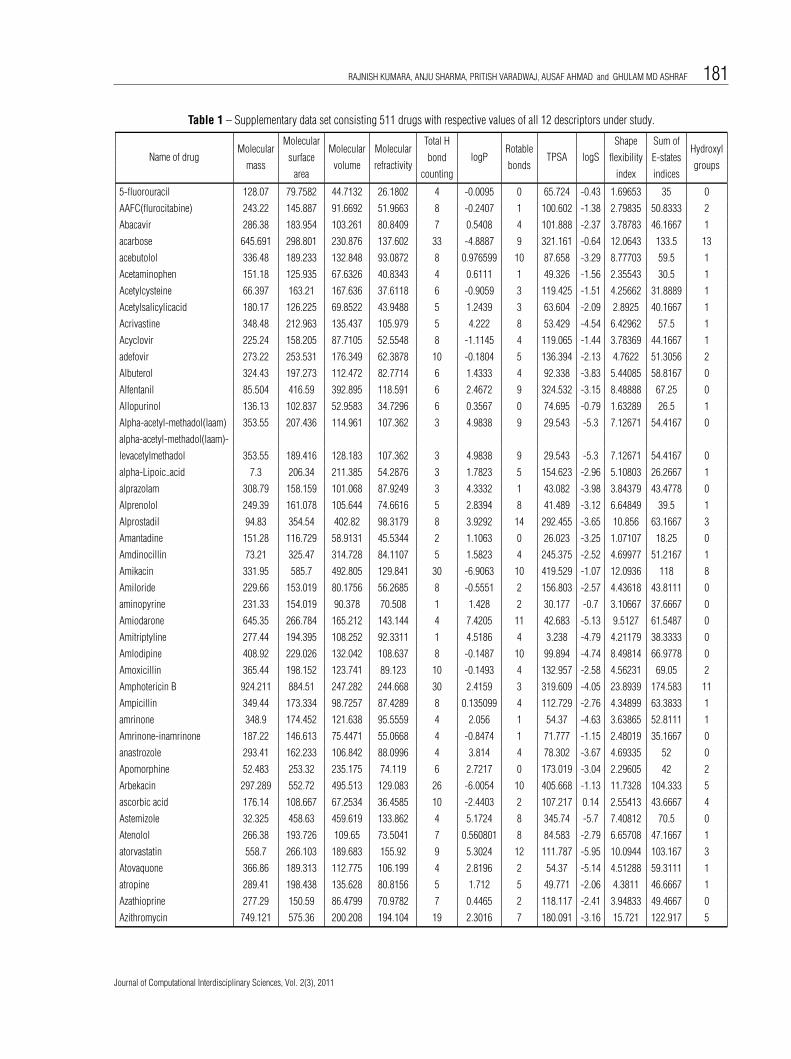
Table 1 – Supplementary data set consisting 511 drugs with respective values of all 12 descriptors under study.
Name of drugMolecular
MolecularMolecular Molecular
Total H
logPRotable
TPSA logS
Shape Sum ofHydroxyl
masssurface
volume refractivitybond
bondsflexibility E-states
groupsarea counting index indices
5-fluorouracil 128.07 79.7582 44.7132 26.1802 4 -0.0095 0 65.724 -0.43 1.69653 35 0
AAFC(flurocitabine) 243.22 145.887 91.6692 51.9663 8 -0.2407 1 100.602 -1.38 2.79835 50.8333 2
Abacavir 286.38 183.954 103.261 80.8409 7 0.5408 4 101.888 -2.37 3.78783 46.1667 1
acarbose 645.691 298.801 230.876 137.602 33 -4.8887 9 321.161 -0.64 12.0643 133.5 13
acebutolol 336.48 189.233 132.848 93.0872 8 0.976599 10 87.658 -3.29 8.77703 59.5 1
Acetaminophen 151.18 125.935 67.6326 40.8343 4 0.6111 1 49.326 -1.56 2.35543 30.5 1
Acetylcysteine 66.397 163.21 167.636 37.6118 6 -0.9059 3 119.425 -1.51 4.25662 31.8889 1
Acetylsalicylicacid 180.17 126.225 69.8522 43.9488 5 1.2439 3 63.604 -2.09 2.8925 40.1667 1
Acrivastine 348.48 212.963 135.437 105.979 5 4.222 8 53.429 -4.54 6.42962 57.5 1
Acyclovir 225.24 158.205 87.7105 52.5548 8 -1.1145 4 119.065 -1.44 3.78369 44.1667 1
adefovir 273.22 253.531 176.349 62.3878 10 -0.1804 5 136.394 -2.13 4.7622 51.3056 2
Albuterol 324.43 197.273 112.472 82.7714 6 1.4333 4 92.338 -3.83 5.44085 58.8167 0
Alfentanil 85.504 416.59 392.895 118.591 6 2.4672 9 324.532 -3.15 8.48888 67.25 0
Allopurinol 136.13 102.837 52.9583 34.7296 6 0.3567 0 74.695 -0.79 1.63289 26.5 1
Alpha-acetyl-methadol(laam) 353.55 207.436 114.961 107.362 3 4.9838 9 29.543 -5.3 7.12671 54.4167 0
alpha-acetyl-methadol(laam)-
levacetylmethadol 353.55 189.416 128.183 107.362 3 4.9838 9 29.543 -5.3 7.12671 54.4167 0
alpha-Lipoic acid 7.3 206.34 211.385 54.2876 3 1.7823 5 154.623 -2.96 5.10803 26.2667 1
alprazolam 308.79 158.159 101.068 87.9249 3 4.3332 1 43.082 -3.98 3.84379 43.4778 0
Alprenolol 249.39 161.078 105.644 74.6616 5 2.8394 8 41.489 -3.12 6.64849 39.5 1
Alprostadil 94.83 354.54 402.82 98.3179 8 3.9292 14 292.455 -3.65 10.856 63.1667 3
Amantadine 151.28 116.729 58.9131 45.5344 2 1.1063 0 26.023 -3.25 1.07107 18.25 0
Amdinocillin 73.21 325.47 314.728 84.1107 5 1.5823 4 245.375 -2.52 4.69977 51.2167 1
Amikacin 331.95 585.7 492.805 129.841 30 -6.9063 10 419.529 -1.07 12.0936 118 8
Amiloride 229.66 153.019 80.1756 56.2685 8 -0.5551 2 156.803 -2.57 4.43618 43.8111 0
aminopyrine 231.33 154.019 90.378 70.508 1 1.428 2 30.177 -0.7 3.10667 37.6667 0
Amiodarone 645.35 266.784 165.212 143.144 4 7.4205 11 42.683 -5.13 9.5127 61.5487 0
Amitriptyline 277.44 194.395 108.252 92.3311 1 4.5186 4 3.238 -4.79 4.21179 38.3333 0
Amlodipine 408.92 229.026 132.042 108.637 8 -0.1487 10 99.894 -4.74 8.49814 66.9778 0
Amoxicillin 365.44 198.152 123.741 89.123 10 -0.1493 4 132.957 -2.58 4.56231 69.05 2
Amphotericin B 924.211 884.51 247.282 244.668 30 2.4159 3 319.609 -4.05 23.8939 174.583 11
Ampicillin 349.44 173.334 98.7257 87.4289 8 0.135099 4 112.729 -2.76 4.34899 63.3833 1
amrinone 348.9 174.452 121.638 95.5559 4 2.056 1 54.37 -4.63 3.63865 52.8111 1
Amrinone-inamrinone 187.22 146.613 75.4471 55.0668 4 -0.8474 1 71.777 -1.15 2.48019 35.1667 0
anastrozole 293.41 162.233 106.842 88.0996 4 3.814 4 78.302 -3.67 4.69335 52 0
Apomorphine 52.483 253.32 235.175 74.119 6 2.7217 0 173.019 -3.04 2.29605 42 2
Arbekacin 297.289 552.72 495.513 129.083 26 -6.0054 10 405.668 -1.13 11.7328 104.333 5
ascorbic acid 176.14 108.667 67.2534 36.4585 10 -2.4403 2 107.217 0.14 2.55413 43.6667 4
Astemizole 32.325 458.63 459.619 133.862 4 5.1724 8 345.74 -5.7 7.40812 70.5 0
Atenolol 266.38 193.726 109.65 73.5041 7 0.560801 8 84.583 -2.79 6.65708 47.1667 1
atorvastatin 558.7 266.103 189.683 155.92 9 5.3024 12 111.787 -5.95 10.0944 103.167 3
Atovaquone 366.86 189.313 112.775 106.199 4 2.8196 2 54.37 -5.14 4.51288 59.3111 1
atropine 289.41 198.438 135.628 80.8156 5 1.712 5 49.771 -2.06 4.3811 46.6667 1
Azathioprine 277.29 150.59 86.4799 70.9782 7 0.4465 2 118.117 -2.41 3.94833 49.4667 0
Azithromycin 749.121 575.36 200.208 194.104 19 2.3016 7 180.091 -3.16 15.721 122.917 5
Journal of Computational Interdisciplinary Sciences, Vol. 2(3), 2011
“main” — 2013/4/1 — 19:47 — page 182 — #4
182 CLASSIFICATION OF ORAL BIOAVAILABILITY OF DRUGS BY MACHINE LEARNING APPROACHES
Table 1 – (continuation).
Name of drugMolecular
MolecularMolecular Molecular
Total H
logPRotable
TPSA logS
Shape Sum ofHydroxyl
masssurface
volume refractivitybond
bondsflexibility E-states
groupsarea counting index indices
azosemide 370.86 160.712 101.5 93.2608 8 1.2139 5 126.659 -3.59 5.5104 55.7611 0
aztreonam 435.47 191.872 127.033 108 13 -4.461 7 203.165 -4.06 6.81075 87.8667 1
Baclofen 213.68 135.225 74.4967 54.829 5 1.5 4 63.322 -2.48 4.07015 35.6444 1
Barnidipine 113.699 477.56 428.691 131.543 8 2.3799 8 355.436 -5.1 7.74161 87.5 0
benazepril 424.54 219.229 144.424 115.227 8 3.2976 10 95.94 -4.61 8.19548 76.6667 1
benzylpenicillin 334.42 183.527 111.144 84.4332 6 0.912 4 86.706 -3.07 4.13633 59.55 1
Betamethasone 392.51 188.988 110.988 102.585 8 1.7117 2 94.826 -3.89 4.15069 74.8333 3
Betaxolol 307.48 215.583 145.313 88.6378 6 2.4993 11 50.723 -4.01 7.32635 45.3333 1
Biperiden 23.47 311.51 319.018 97.0148 3 3.47 5 260.3 -4.86 4.29475 42.4167 1
bornaprine 329.53 203.282 135.469 98.2855 3 4.0985 9 29.543 -5.11 5.72484 47.25 0
Bretylium 243.19 142.67 79.8429 59.77 0 -0.903 3 0 -6.26 3.50955 22.8958 0
Bromazepam 316.17 144.167 87.9727 75.2043 4 2.1236 1 54.354 -3.9 3.76437 42.0625 0
bromocriptine 654.671 294.272 218.108 165.511 9 3.9423 5 118.207 -3.88 7.03448 95.0625 1
Bucindolol 81.07 363.5 361.705 106.912 7 3.1969 8 282.416 -4.69 6.0447 60.4167 1
Budesonide 93.07 430.59 379.029 116.202 8 2.4653 4 331.985 -3.97 4.90939 72.25 2
Bumetanide 364.45 189.136 117.647 93.5013 8 2.3317 8 118.725 -4.15 6.40214 67.8167 1
bumetanide 364.45 189.136 117.647 93.5013 8 2.3317 8 118.725 -4.15 6.40214 67.8167 1
buprenorphine 467.71 229.941 159.036 131.398 7 3.7834 5 62.162 -4.44 4.22981 66.75 2
Bupropion 239.77 142.152 89.5368 67.697 3 2.7496 4 29.098 -3.54 4.11091 34.3944 0
Buspirone 385.57 244.933 142.61 108.137 5 1.5978 6 69.64 -2.82 6.75123 59.25 0
butorphanol 327.51 181.682 123.075 95.6328 5 3.5487 2 43.694 -3.31 3.39039 46.6667 2
Caffeine 217.31 130.857 89.6923 54.7325 5 0.2974 3 57.608 -1.68 4.09572 37.2222 1
Calcitirol 416.71 257.327 146.587 126.531 6 4.5268 8 60.684 -4.8 7.36659 62.1667 3
camazepam 371.85 181.518 115.635 98.6319 4 3.3971 3 62.216 -4.31 5.58356 60.8111 0
Candesartan 440.5 239.744 139.441 125.437 9 4.9539 7 118.826 -4.77 6.75684 76.6667 1
capreomycin Ia 668.831 353.26 254.659 162.204 26 -9.636 11 378.42 -2.65 17.3594 136.5 1
captopril 217.31 130.857 89.6923 54.7325 5 0.2974 3 57.608 -1.68 4.09572 37.2222 1
Carbamazepine 236.29 141.531 75.8141 71.888 2 2.7227 0 48.028 -3.19 2.5525 41.3333 0
Carbimazole 36.17 186.25 194.429 49.5677 3 1.6421 2 125.627 -1.77 3.04622 28.6 0
carfecillin 302.26 160.489 98.4169 77.282 12 3.1766 5 139.782 -3.59 5.10618 69.3333 4
Carvedilol 406.52 270.429 153.152 115.638 8 2.9421 10 75.748 -4.96 6.86052 64.5 1
Cefacetrile 136.8 339.35 306.125 77.9676 9 -2.4602 6 235.52 -2.15 5.40026 70.3 1
Cefadroxil 363.42 193.566 114.318 90.6727 10 -0.8287 4 132.957 -2.96 4.86907 69.3 2
Cefazolin 454.54 236.705 137.34 113.659 11 -1.6174 7 156.1 -2.97 7.58985 73.2333 1
cefetamet pivoxil(globocef) 511.62 238.956 161.702 124.856 11 1.2192 11 162.53 -4.05 9.02258 88.1833 0
Cefixime 453.48 212.396 128.462 106.861 13 -0.9987 9 184.518 -3.64 7.53171 86.9333 2
Cefodizime 197.41 584.7 495.311 141.32 14 -0.1411 11 396.848 -2.79 9.98652 96.7 2
Cefoxitin 148.27 427.48 341.143 100.836 10 -0.5798 8 300.491 -3.32 6.31343 77.5167 1
ceftizoxime 383.43 176.916 110.151 91.8494 10 -0.8751 6 147.219 -3.22 5.89243 68.1 1
cefuroxime 424.42 206.164 128.6 97.1708 12 -1.6699 9 173.772 -3.17 6.92599 83.6333 1
cefuroximeaxetil 510.52 239.099 159.045 117.035 13 -1.5715 13 189.08 -3.54 9.40496 98.6333 0
Cephalexin 347.42 185.242 117.747 88.9786 8 -0.5443 4 112.729 -3.07 4.65839 63.6333 1
Cephalothin 113.01 396.46 330.949 95.7433 8 -1.3491 7 275.989 -3.88 5.90142 70.1 1
Cephradine 349.44 193.345 107.607 92.0006 8 -1.0473 4 112.729 -2.65 4.83975 62.6333 1
cetirizine 388.93 214.25 145.458 106.867 6 3.477 8 53.009 -3.77 7.37913 58.3111 1
Journal of Computational Interdisciplinary Sciences, Vol. 2(3), 2011
“main” — 2013/4/1 — 19:47 — page 183 — #5
RAJNISH KUMARA, ANJU SHARMA, PRITISH VARADWAJ, AUSAF AHMAD and GHULAM MD ASHRAF 183
Table 1 – (continuation).
Name of drugMolecular
MolecularMolecular Molecular
Total H
logPRotable
TPSA logS
Shape Sum ofHydroxyl
masssurface
volume refractivitybond
bondsflexibility E-states
groupsarea counting index indices
chlorambucil 304.24 166.488 116.076 78.9619 3 3.6693 9 40.537 -3.59 8.06516 41.1222 1
chloramphenicol 323.15 157.676 109.428 73.2007 8 1.1709 5 115.378 -2.85 6.4702 58.6222 2
Chlordiazepoxide 299.78 184.553 105.434 80.762 3 0.731 2 53.144 -4.18 4.10979 45.3111 0
chlorothiazide 295.73 119.95 72.0424 60.8266 7 -0.06 1 118.698 -2.85 2.9919 52.1111 0
chlorpromazine 318.89 175.926 115.606 93.8587 1 3.7952 4 8.172 -4.88 4.55038 36.7778 0
chlorpropamide 276.76 148.693 89.5262 65.4322 5 1.8688 4 75.267 -3.25 5.07249 45.6278 0
chlorthalidone 338.78 154.425 90.9938 80.8027 7 2.1436 2 109.491 -3.81 3.35018 60.3778 1
cicaprost 374.52 256.566 170.799 105.169 8 2.6665 13 86.989 -4.23 8.53789 66.3333 3
cidofovir 279.22 140.876 95.8058 59.8675 11 -0.6864 6 147.909 -1.37 5.67843 57.9722 3
cimetidine 256.42 174.992 112.204 70.4443 8 0.585801 8 88.893 -2.59 7.65293 36.4667 0
Cinacalcet 12.03 357.45 335.378 100.116 2 6.2948 6 275.335 -6.81 5.62113 65.9167 0
Ciprofloxacin 331.38 176.144 125.779 89.8039 6 -1.6602 3 74.569 -1.95 3.80369 62.5 1
cisapride 466 252.289 171.582 122.437 7 2.2463 9 86.061 -4.59 9.12404 74.6444 0
citalopram 324.43 177.294 120.095 94.2915 3 3.5895 5 36.264 -4.74 4.6575 55.5833 0
Clavulanate 199.18 171.481 97.1736 43.9836 7 -1.6561 3 87.07 0.23 2.19789 44.1667 2
Clindamycin 425.04 228.085 130.532 105.77 10 1.2095 7 102.254 -2.14 8.82537 62.6111 3
Clodronate 120.71 242.87 161.058 35.1764 8 0.721 2 136.379 -1.16 2.94435 44.4833 2
clofibrate 242.72 144.973 90.7803 62.1337 3 2.968 5 35.539 -3.92 4.47237 37.0611 0
Clomethiazolel 12.89 161.66 169.872 42.7201 1 1.3503 2 114.028 -1.59 3.00329 15.2778 0
Clonazepam 315.73 166.483 98.3592 82.2399 5 2.7162 1 87.286 -4.47 4.06957 56.9778 0
Clonidine 295.73 119.95 72.0424 60.8266 7 -0.06 1 118.698 -2.85 2.9919 52.1111 0
clorazepate 314.74 159.685 95.2244 80.8953 6 2.7482 2 78.761 -4.1 4.11694 55.8111 1
Clorothiazide 256.42 174.992 112.204 70.4443 8 0.585801 8 88.893 -2.59 7.65293 36.4667 0
Cloxacillin 435.91 208.993 122.132 106.044 8 2.1003 4 112.738 -3.91 5.2568 72.5278 1
clozapine 326.86 196.818 122.111 94.5489 3 3.3061 1 35.159 -3.25 4.16383 42.8111 0
cocaine 303.39 158.322 100.863 80.6618 5 1.9253 5 55.848 -1.78 4.37987 51.8333 0
Corticosterone 346.51 167.149 119.238 96.0927 6 2.1476 2 74.598 -3.88 4.0056 58.1667 2
Coumarin 30.21 146.15 152.63 41.5486 2 1.8198 0 93.0943 -2.16 1.33348 27.5 0
Cromoglycate 173.72 468.39 385.527 114.107 14 -0.3921 8 321.633 -4.12 6.67533 100.333 3
Cyclic-HPMPC 116.69 261.2 229.004 56.3753 8 -0.3894 2 172.916 -1.2 3.82362 49.4722 1
Cyclophosphamide 261.11 142.514 81.4258 58.4781 5 0.782501 5 41.57 -1.24 5.75129 28.4278 0
cycloserine 102.11 77.8568 43.7337 21.8488 5 -1.4009 0 64.335 0.93 1.05592 21.5 0
cyproterone acetate 416.98 195.653 134.541 111.902 4 2.6109 3 60.447 -5.44 4.01408 64.0611 0
Cytarabine 243.25 168.079 94.7432 54.7448 10 -1.374 2 130.838 -0.12 3.62125 51.6667 3
dalfopristin 690.941 282.837 214.175 182.712 13 2.3106 7 176.423 -3.98 15.2975 121.983 1
Dapsone 248.32 170.017 92.4548 68.991 4 1.3069 2 86.188 -2.94 2.97388 44.9833 0
delavirdine 470.76 251.059 183.79 125.248 12 -0.4726 6 110.426 -3.73 7.91119 68.8167 0
Desipramine 266.42 171.417 107.483 85.4133 2 3.6205 4 15.265 -3.83 4.14258 36.6667 0
Desmethyldiazepam(nordazepam) 270.73 157.388 94.842 74.9152 3 2.7626 1 41.462 -4.09 3.41029 41.3111 0
Desogestrel 20.23 310.52 313.124 95.7331 2 4.2569 2 257.85 -5.01 3.54334 44.1667 1
Dexamethasone 392.51 178.733 126.416 102.585 8 1.7117 2 94.826 -3.89 4.15069 74.8333 3
Diacetylmorphine 65.08 383.48 341.999 102.95 6 1.6676 4 284.271 -3.53 4.106 63.0833 0
Diazepam 284.76 158.56 94.8058 79.8119 2 3.0091 1 32.673 -4.37 3.64372 42.8111 0
Diazoxide 230.68 127.223 72.3984 53.26 4 1.1355 0 58.533 -2.68 2.33397 35.7944 0
Diclofenac 296.16 165.705 96.165 75.1658 4 3.8258 4 49.326 -4.82 4.55626 43.6222 1
Journal of Computational Interdisciplinary Sciences, Vol. 2(3), 2011
“main” — 2013/4/1 — 19:47 — page 184 — #6
184 CLASSIFICATION OF ORAL BIOAVAILABILITY OF DRUGS BY MACHINE LEARNING APPROACHES
Table 1 – (continuation).
Name of drugMolecular
MolecularMolecular Molecular
Total H
logPRotable
TPSA logS
Shape Sum ofHydroxyl
masssurface
volume refractivitybond
bondsflexibility E-states
groupsarea counting index indices
dicloxacillin 470.35 198.158 125.083 110.849 8 2.6183 4 112.738 -4.2 5.6832 73.5056 1
didanosine 235.25 137.149 86.5179 55.814 7 -0.0384 2 93.042 -1.53 3.24819 43.6667 1
Diflunisal 250.21 151.631 81.4506 60.0795 5 3.424 2 57.527 -3.55 3.18149 58.6667 2
Digitoxin 765.051 386.341 235.484 191.714 18 3.5857 7 182.849 -4.42 11.0006 122.75 5
digoxin 781.051 374.8 280.137 193.229 20 2.6723 7 203.077 -3.79 11.2146 128.583 6
dihydrocodeine 301.42 166.327 112.619 83.5656 5 1.5062 1 41.134 -2.1 2.65139 43.75 1
Dihydroergosine 118.21 549.74 506.427 148.448 9 2.8029 4 413.303 -3.17 6.04256 90.1667 1
Dihydroergotamine 118.21 583.75 517.093 159.393 9 3.2933 4 442.516 -3.41 6.19692 96.5 1
Dilevalol 69.55 327.46 347.497 95.7518 7 3.0614 8 255.434 -4.52 6.67046 57 2
Diltiazem 414.56 241.128 137.629 114.339 5 2.3969 7 59.086 -4.39 7.20953 65.3 0
Dimercaprol 20.23 124.23 129.549 32.7701 4 0.0923 2 89.5857 -1.65 4.25871 12.7778 1
diphenhydramin 255.39 169.041 104.317 79.927 2 3.6159 6 12.472 -3.53 5.13142 37.1667 0
Dirithromycin 196.35 835.221 711.467 212.949 21 2.2609 12 659.265 -3.56 17.5766 133.583 4
disopyramide 339.53 178.947 119.742 102.418 4 3.5272 8 59.224 -3.84 6.80283 53.9167 0
Distigmine 66.86 416.58 451.125 115.08 4 2.7998 11 317.181 -6.02 10.0184 68.6667 0
disulfiram 296.56 157.899 113.369 89.0288 2 4.7516 9 6.476 -4.37 10.2814 25.1333 0
Dixyrazine 40.87 427.66 412.296 126.856 5 2.9732 9 323.134 -4.12 7.81754 57.1333 1
Dofetilide 441.61 263.236 146.878 114.017 8 1.3337 11 104.81 -4.35 8.31706 73.8 0
dolasetron 332.49 204.078 141.688 89.4666 6 1.2299 3 62.405 -3.09 3.79648 49.6667 0
Doxepin 279.41 192.72 104.137 89.0687 2 3.5655 4 12.472 -3.94 4.18303 40.3333 0
doxorubicin 543.57 249.729 176.705 134.019 18 0.171802 5 206.074 -2.67 7.0384 109.417 5
doxycycline 444.48 210.382 141.815 113.125 15 -2.8004 2 181.614 -2.85 5.10331 93.5833 5
eflornithine 182.2 111.161 71.7719 37.7328 7 -1.0467 5 89.345 -0.56 4.22091 45.75 1
enalapril 376.5 217.1 145.306 99.5722 8 2.101 10 95.94 -3.25 8.24443 68.6667 1
enalaprilat 348.44 195.618 128.714 90.0551 9 1.7268 8 106.934 -2.6 6.95061 67.6667 2
Encainide 352.52 228.206 129.763 105.486 4 3.8831 6 41.57 -4.94 6.55577 53.6667 0
entacapone 305.32 161.047 104.954 80.395 8 1.5266 5 130.381 -3.58 6.03161 68.5 2
Epanolol 114.61 369.46 375.117 101.212 10 1.5011 10 273.721 -3.78 8.57852 69.1667 2
Epirubicin 206.08 557.6 475.978 138.568 18 0.104301 6 393.173 -2.81 7.5028 110.917 5
Eprosartan 92.42 424.55 352.539 118.755 7 4.6711 11 324.662 -5.89 8.0494 72.4667 2
Estradiol 40.46 272.42 270.852 79.6175 4 4.0079 0 208.477 -4.11 2.7726 40.5833 2
Estradiol 17-valerate 46.53 356.55 359.872 102.598 4 5.5578 5 286.252 -5.76 4.95701 53.25 1
ethambutol 204.36 156.144 104.244 57.8872 8 0.290401 9 64.51 -1.43 9.28976 32.6667 2
ethanol 46.08 63.2038 32.2323 13.0093 2 0.0772 0 20.228 1.1 1.93387 9.5 1
ethinylestradiol 296.44 170.001 111.419 87.0873 4 4.0174 1 40.456 -4.64 2.99027 47 2
Etidronate 135.28 206.04 158.803 33.3638 12 0.4419 2 124.507 -1.25 2.70093 47.8611 5
etoposide 588.61 280.328 195.188 138.584 16 0.918701 5 160.861 -2.78 7.41546 103.333 3
famciclovir 321.38 188.357 127.443 81.5349 8 -0.6945 9 122.242 -2.39 7.09464 59.6667 0
Famotidine 337.48 203.802 121.412 80.8407 9 -0.6491 9 175.854 -3.1 8.1158 53.75 0
Felbamate 238.27 169.214 90.6974 59.5868 6 0.7793 7 104.656 -2.51 5.44157 48.3333 0
felodipine 384.28 187.036 123.348 99.1964 5 1.6672 6 64.637 -4.73 6.5428 57.9555 0
Femoxetine 21.71 311.46 312.271 93.7979 3 3.5335 5 248.059 -4.41 5.44182 44.6667 0
fenclofenac 297.14 151.737 90.4496 73.216 4 4.1425 4 46.532 -4.68 4.55626 44.6222 1
fenoterol 303.39 175.572 117.268 84.1362 10 2.7878 6 92.99 -3.27 5.65183 56.5 4
fentanyl 336.52 206.673 134.176 103.482 2 3.7746 6 23.547 -4.15 6.3729 49.8333 0
Journal of Computational Interdisciplinary Sciences, Vol. 2(3), 2011
“main” — 2013/4/1 — 19:47 — page 185 — #7
RAJNISH KUMARA, ANJU SHARMA, PRITISH VARADWAJ, AUSAF AHMAD and GHULAM MD ASHRAF 185
Table 1 – (continuation).
Name of drugMolecular
MolecularMolecular Molecular
Total H
logPRotable
TPSA logS
Shape Sum ofHydroxyl
masssurface
volume refractivitybond
bondsflexibility E-states
groupsarea counting index indices
Fexofenadine 80.99 501.72 515.169 147.782 8 6.2599 10 399.004 -5.28 8.60357 83 3
finasteride 372.61 201.232 137.426 108.194 4 2.9957 2 58.196 -5.27 4.47274 55.75 0
Flecainide 414.39 202.762 124.572 87.8977 6 2.9815 7 59.593 -4.11 7.81195 94 0
Fluconazole 306.31 162.636 94.8887 76.6249 6 1.2158 5 81.664 -2.34 4.96568 61.25 1
Flucytosine 129.11 95.6792 50.4012 28.3514 4 -0.9747 0 71.777 -0.09 1.63973 31.5 0
flumazenil 303.32 164.789 106.688 75.3538 4 1.345 3 64.44 -2.46 3.94963 59.1667 0
Flunisolide 93.07 434.55 349.895 111.977 8 1.8116 2 325.551 -4.07 4.38391 79 2
Flunitrazepam 313.31 166.912 101.855 82.5482 4 2.5842 1 78.497 -4.56 4.0657 65.1667 0
Fluorouracil 130.09 94.7107 50.8243 27.3802 4 -1.0593 0 65.724 -0.43 1.37263 34 0
Fluoxetine 309.36 197.862 104.255 80.3675 3 4.1937 6 21.261 -5.26 5.5746 60.5833 0
Fluphenazine 437.57 235.138 141.516 117.37 4 3.5182 6 31.638 -4.36 6.69367 73.7167 1
Flurbiprofen 244.28 165.219 91.9894 67.2927 3 4.0638 3 37.299 -3.99 3.53229 48.6667 1
Fluticasone propionate 80.68 500.62 398.985 121.867 6 2.8691 6 367.562 -4.64 6.26109 94.9667 1
Fluvastatin 411.51 200.683 146.599 114.854 7 3.8804 9 82.689 -4.97 6.94553 77.6667 3
Fluvoxamine 318.38 179.142 104.983 79.1967 5 2.6885 10 56.855 -4.64 8.52913 63.25 0
Foscarnet 126.01 72.4961 38.4522 18.4995 8 0.2579 1 94.826 -0.88 1.65931 33.9722 3
fosfomycin 138.07 87.4929 54.3809 25.2061 6 0.3208 1 70.055 -0.47 1.2033 27.4722 2
fosmidomycin 183.12 109.876 73.4989 36.1213 8 -0.2284 4 98.064 -0.92 4.47563 40.8056 3
Frovatriptan 70.91 243.34 245.072 71.3392 5 0.4988 2 169.781 -3.3 2.77876 39.8333 0
Furosemide 330.76 179.149 100.294 75.1956 8 0.9383 5 122.631 -3.45 4.56793 60.1278 1
Gabapentin 171.27 110.912 73.3154 46.3283 5 0.9552 3 63.322 -1.6 3.23123 30.4167 1
Gallopamil 73.2 484.7 503.534 139.567 7 4.6309 14 388.876 -4.95 11.3151 75.75 0
gallopamil 484.701 274.59 194.004 139.567 7 4.6309 14 73.2 -4.95 11.3151 75.75 0
Ganciclovir 254.26 141.169 90.0066 57.9173 10 -0.9621 5 139.293 -1.42 4.75762 52 2
gatifloxacin 375.44 182.627 129.148 98.5862 7 1.0608 4 83.803 -2.37 4.68983 69.5 1
Gemfibrozil 250.37 177.309 94.8295 71.8187 4 4.3269 6 46.533 -3.95 5.05297 42.9167 1
Gentamicin C1 199.74 477.69 435.567 118.019 20 -3.0525 7 362.763 -1.58 9.08806 80.25 3
Gentamicin C1a 187.71 448.64 396.991 110.148 18 -2.2722 6 339.279 -1.53 8.30797 75.9167 3
GI-147211 86.14 502.62 433.72 138.643 8 0.2797 3 351.036 -3.02 5.84189 79.8333 0
glimepiride 490.68 271.318 181.213 129.803 8 2.8182 7 124.674 -4.11 8.88575 85.15 0
glipizide 445.59 250.333 159.41 115.395 9 2.1228 7 130.149 -4.43 8.66521 77.65 0
Glucosamine 116.16 179.2 164.804 37.5809 11 -2.1078 1 126.7 0.49 2.99364 39.6667 4
glyburide 494.05 255.734 170.988 126.481 8 3.4985 8 113.599 -5.38 9.13147 80.1278 0
Granisetron 312.46 220.731 124.887 91.0078 4 1.7053 2 50.162 -2.86 4.03979 46.6667 0
Guanethidine 65.14 198.36 227.704 59.5808 4 1.1125 4 168.976 -2.29 6.24197 28.6667 0
guanoxan 207.26 134.803 80.9848 54.9351 5 0.8751 3 80.37 -2.19 3.38222 35.8333 0
Haloperidol 375.9 212.425 126.051 102.591 4 3.3784 6 40.537 -4.93 6.06954 60.3944 1
Hesperidin 234.299 610.62 502.428 140.193 23 -0.1597 7 427.654 -2.36 9.57336 121 8
Hexobarbital 236.3 153.405 80.8345 62.1823 5 2.2043 1 69.972 -2.39 3.23404 44.9167 1
Hydralazine 63.84 160.2 169.122 50.2778 5 1.7633 1 101.725 -1.79 2.20038 27.5 0
Hydrochlorothiazide 297.75 124.189 76.9855 61.3288 7 -0.5292 1 118.361 -2.12 2.9235 51.1111 0
hydrocortisone 362.51 174.574 121.066 97.4923 8 1.4307 2 94.826 -3.26 4.0378 64.0833 3
Hydromorphone 285.37 172.695 90.4839 77.8995 5 1.8775 0 49.771 -1.81 2.19981 45.5833 1
hydroxyurea 76.07 69.7511 34.2725 14.6204 5 -0.8179 0 75.349 0.55 1.66684 21.1667 1
Hypericin 155.51 504.46 394.345 137.591 14 4.6352 0 315.974 -4.84 3.66703 102 6
Journal of Computational Interdisciplinary Sciences, Vol. 2(3), 2011
“main” — 2013/4/1 — 19:47 — page 186 — #8
186 CLASSIFICATION OF ORAL BIOAVAILABILITY OF DRUGS BY MACHINE LEARNING APPROACHES
Table 1 – (continuation).
Name of drugMolecular
MolecularMolecular Molecular
Total H
logPRotable
TPSA logS
Shape Sum ofHydroxyl
masssurface
volume refractivitybond
bondsflexibility E-states
groupsarea counting index indices
Ibandronate 138.52 319.27 297.884 68.4749 13 1.2093 9 226.611 -1.38 7.37629 60.8611 5
Ibuprofen 206.31 153.199 77.7689 60.7319 3 3.8302 4 37.299 -3.48 4.03629 36.1667 1
Idarubicin 497.54 248.469 152.775 125.854 15 0.9801 3 176.616 -2.81 5.95833 98.75 4
ifosfamide 261.11 128.419 88.0822 58.4781 5 0.782501 5 41.57 -1.24 5.75129 28.4278 0
Iloprost 77.76 360.54 387.692 105.181 7 3.6387 12 290.194 -4.62 8.08649 61.8333 3
Imipenem 116.223 299.38 284.294 75.6864 8 -2.3217 7 215.536 -2.59 5.03617 54.8 2
imipramine 280.45 179.112 114.95 90.708 1 3.9819 4 6.476 -3.63 4.37209 38.1667 0
Indinavir 613.881 293.576 175.142 175.86 11 3.4564 12 118.02 -4.11 11.2399 99.9167 2
indomethacine 357.81 186.946 117.183 94.6078 5 3.6415 4 68.538 -5.17 4.83122 61.3111 1
Indoramin 48.13 347.5 347.506 105.44 4 2.9043 5 255.231 -4.6 5.25052 52.6667 0
Irabesartan 428.59 232.354 140.078 127.733 6 5.0254 7 87.14 -4.7 6.86568 66.4167 0
Irinotecan 113.68 588.77 545.474 165.35 9 -0.431 5 437.066 -3.86 7.80905 96.4167 1
isoniazid 137.16 100.952 55.4772 36.9343 5 0.0204 1 68.013 -0.59 2.42411 27.8333 0
Isoproterenol 72.11 197.26 207.255 52.8903 8 1.6534 3 154.3 -1.18 3.59787 38.1667 3
isoxicam 335.36 163.303 100.08 83.7239 8 -0.5591 2 112.74 -3.2 3.98964 63.9833 1
isradipine 371.43 173.237 116.502 100.082 8 0.6701 6 103.561 -3.21 6.01531 66.6667 0
kanamycin 254.3 149.652 90.8072 72.5156 4 3.4613 4 54.37 -4.08 3.87529 49.6667 1
Ketamine 237.75 149.284 79.9286 65.5534 3 3.1695 2 29.098 -3.71 3.3114 33.0611 0
Ketoprofen 254.3 149.652 90.8072 72.5156 4 3.4613 4 54.37 -4.08 3.87529 49.6667 1
ketorolac 255.29 152.027 92.5972 70.1941 4 1.7575 3 59.304 -2.7 2.8899 48.6667 1
k-strophanthoside 484.58 210.993 165.783 106.134 26 -5.6338 6 282.624 -0.72 8.98513 96.5 7
Labetalol 328.45 212.64 126.241 93.9296 8 2.5865 8 95.577 -4.75 6.63399 59 2
Lacidipine 90.94 455.6 418.813 129.91 7 1.9456 12 356.306 -5.31 9.19165 80.5833 0
lactulose 342.34 172.281 126.059 68.7741 19 -2.4695 5 189.526 0.36 5.92011 74.9167 8
Lamivudine 229.28 134.793 70.7576 55.1051 6 -0.0843 2 90.382 -0.7 3.4781 39.1333 1
Lamotrigine 256.11 131.017 75.79 66.6197 5 2.3937 1 90.722 -2.72 3.91722 35.6222 0
Lansoprazole 369.39 209.736 120.065 87.7582 5 2.8347 5 67.88 -3.17 5.56233 71.6722 0
letrozole 285.33 159.512 96.6924 85.133 4 3.3412 3 78.302 -3.55 4.28678 53 0
Leucovorin 473.5 269.587 150.618 114.367 15 -1.4996 9 219.836 -3.07 8.65707 99.6667 2
Levetiracetam 170.24 128.821 66.6904 44.0785 3 -0.7139 3 63.403 0.24 2.94331 32.6667 0
levodopa 197.21 119.552 73.4903 48.5041 9 0.5835 3 103.778 -1.78 3.3168 44.5 3
Levodopa 197.21 124.493 72.9467 48.5041 9 0.5835 3 103.778 -1.78 3.3168 44.5 3
levofloxacin 361.41 181.481 121.275 94.7015 6 0.848201 2 75.014 -1.87 4.24503 67.6667 1
levonorgestrel 312.49 186.716 124.64 92.1184 3 2.8711 2 37.299 -4.73 3.50421 48.1667 1
Lidocaine 234.38 172.96 94.2785 72.1476 3 2.3815 5 32.336 -2.6 5.32265 36.6667 0
lincomycin 406.6 214.237 154.169 102.719 12 0.062801 7 122.148 -1.14 8.50656 67.3 4
lisinopril 405.55 216.988 149.153 107.367 11 1.4934 12 132.957 -3.27 9.55958 75.6667 2
Lisuride 51.365 338.5 333.846 101.811 4 1.721 3 246.922 -3.38 4.33246 50.6667 0
Loracarbef 349.8 184.423 113.249 86.6367 8 -0.9616 4 112.729 -3.03 4.61713 63.8111 1
lorazepam 321.17 152.688 92.4157 80.9184 5 3.3177 1 61.69 -4.26 4.04774 48.1222 1
Lorcainide 23.547 370.96 369.355 108.181 2 4.2371 5 294.924 -4.69 6.46697 51.1444 0
Lormetazepam 335.2 160.688 100.999 85.8151 4 3.5642 1 52.901 -4.31 4.28476 49.6222 1
lornoxicam 371.83 169.005 103.373 88.5845 7 -0.5009 2 99.598 -3.93 4.43274 60.4278 1
Losartan 422.96 209.252 131.327 123.184 7 5.0315 8 92.521 -4.97 7.71104 62.6444 1
lovastatin 404.6 238.19 166.929 113.181 6 3.7675 7 72.838 -4.22 7.46643 65.6667 1
Journal of Computational Interdisciplinary Sciences, Vol. 2(3), 2011
“main” — 2013/4/1 — 19:47 — page 187 — #9
RAJNISH KUMARA, ANJU SHARMA, PRITISH VARADWAJ, AUSAF AHMAD and GHULAM MD ASHRAF 187
Table 1 – (continuation).
Name of drugMolecular
MolecularMolecular Molecular
Total H
logPRotable
TPSA logS
Shape Sum ofHydroxyl
masssurface
volume refractivitybond
bondsflexibility E-states
groupsarea counting index indices
Lynestrenol 20.228 284.48 289.583 86.806 2 3.9223 1 235.388 -4.89 3.05975 39.5 1
Mannitol 121.368 182.2 170.334 38.4036 12 -2.1984 5 132.652 0.1 5.30519 44.3333 6
Mebendazole 295.32 192.453 109.433 79.7231 6 2.5231 4 84.086 -3.87 4.15423 55.1667 0
Medifoxamine 21.706 257.36 271.852 75.8301 3 3.7267 6 210.396 -2.9 5.09523 39.1667 0
Medroxyprogesterone 344.54 182.966 105.655 98.7468 4 3.3025 1 54.37 -4.35 3.68622 54.5833 1
Melagatran 148.608 429.58 416.119 114.786 10 0.5471 9 332.588 -3.57 8.51361 78.5 1
Melatonin 50.696 232.31 245.151 65.7819 4 0.3568 4 178.312 -3.06 3.97496 39 0
meloxicam 351.42 164.191 101.397 88.5629 7 -0.1615 2 99.598 -3.36 4.24029 61.1167 1
Melphalan 305.23 164.736 101.153 77.5102 5 2.3515 8 66.56 -3.92 7.34464 43.4556 1
meperidine 247.37 161.874 101.98 72.4823 3 2.4651 4 29.543 -2.35 4.14591 38.5833 0
Meptazinol 23.466 233.39 255.586 71.9905 3 3.5125 2 200.37 -2.82 3.848 33.5833 1
Mercaptopurine 152.19 111.987 60.1268 41.4233 5 0.4524 0 57.366 -2.19 1.64517 21.2667 0
Meropenem 110.172 383.51 349.883 97.6798 9 -2.0366 5 281.583 -1.83 5.39707 67.4667 2
metaproterenol(orciprenaline) 211.29 140.002 90.4087 57.8229 8 1.3864 4 72.711 -1.48 4.22865 39.6667 3
Metergoline 46.504 403.57 387.769 119.298 4 3.7523 5 305.493 -4.93 5.29034 60.5 0
Metformin 129.2 126.769 61.1555 35.8129 4 0.212 3 88.992 -1.97 3.94527 25.8333 0
methadone 309.49 180.576 115.096 97.3884 2 5.3821 7 20.309 -4.72 5.72787 47.5833 0
Methapyrilene 19.368 261.42 262.547 79.3882 2 2.2727 6 207.935 -2.96 5.35926 33.4667 0
Methotrexate 454.5 268.409 150.529 118.142 14 0.128201 9 210.548 -3.42 8.87585 92 2
Methyldopa 211.24 121.43 75.7615 53.2168 9 0.7861 3 103.778 -1.97 3.20716 46.4167 3
Methylphenidate 38.332 233.34 246.569 66.7274 4 2.1224 4 190.514 -3.11 4.28636 37 0
Methylphenidate 233.34 171.46 91.7685 66.7274 4 2.1224 4 38.332 -3.11 4.28636 37 0
Methylprednisolone 374.52 175.335 103.608 103.134 8 1.8404 2 94.826 -3.54 4.12416 66.9167 3
Methysergide 57.498 353.51 341.907 104.472 5 1.5005 4 268.582 -3.2 4.56753 55.5 1
metoclopramide 299.84 183.14 119.625 83.0188 5 1.2729 7 67.593 -2.99 7.11817 44.6444 0
Metoclopramide 203.26 128.905 68.4948 56.3486 2 1.6164 1 37.38 -1.98 2.1955 37.75 0
Metolazone 365.86 166.409 108.187 92.3093 5 2.1933 2 92.501 -3.95 4.22722 60.1278 0
Metoprolol 267.41 213.414 118.167 76.696 6 1.7894 9 50.723 -2.82 7.66912 41.5 1
metronidazole 171.18 110.966 67.0501 41.6633 5 0.3793 2 83.878 -1.46 2.96884 37.3333 1
mexiletine 179.29 233.878 146.94 54.9716 3 2.3508 3 35.257 -2.52 3.4575 27.3333 0
Mianserin 6.476 264.4 266.817 83.7778 1 3.5212 0 207.662 -3.06 2.86486 36 0
mibefradil 495.7 244.225 172.283 140.046 6 4.5625 12 67.46 -5.68 8.99673 79.0833 0
Miconazole 27.06 416.14 338.415 103.036 2 5.9949 6 294.312 -7.27 6.73428 46.0778 0
midazolam 325.79 290.75 208.399 88.2939 2 4.6312 1 30.19 -4.52 3.82934 50.1444 0
mifobate 358.67 164.125 103.989 76.7988 7 2.985 8 80.314 -1.87 7.04263 54.0889 0
Minocycline 457.53 218.613 131.737 121.052 13 -2.5928 3 164.624 -2.17 5.53286 91.5833 4
minoxidilne 209.29 139.284 86.6577 59.8 4 -2.0664 1 93.635 -1.02 3.20992 36.5 0
mirtazapine 265.39 170.272 104.43 81.9344 2 2.9079 0 19.368 -2.38 3.05008 37 0
Misoprostol 382.6 202.349 117.296 107.878 7 3.8945 15 83.832 -4.37 11.0434 64.5833 2
Modafinil 273.37 169.705 96.4589 77.3608 3 1.6196 5 60.165 -2.64 4.60062 46.2556 0
montelukast 586.231 288.272 196.549 169.725 6 8.2857 13 70.419 -7.85 9.30437 85.7778 2
Morphine 285.37 290.285 189.497 79.7595 6 1.3589 0 52.928 -1.45 2.21228 45.25 2
Moxalactam(Latamoxef) 520.52 235.485 138.46 124.703 16 0.095001 9 206.311 -2.84 8.20128 103.05 3
Moxifloxacin 401.48 215.076 125.48 108.075 7 -1.993 4 83.803 -2.71 4.63664 71.8333 1
moxonidine 241.71 141.074 84.8712 62.666 6 1.3047 3 71.436 -3.32 4.43187 34.1444 0
Journal of Computational Interdisciplinary Sciences, Vol. 2(3), 2011

“main” — 2013/4/1 — 19:47 — page 188 — #10
188 CLASSIFICATION OF ORAL BIOAVAILABILITY OF DRUGS BY MACHINE LEARNING APPROACHES
Table 1 – (continuation).
Name of drugMolecular
MolecularMolecular Molecular
Total H
logPRotable
TPSA logS
Shape Sum ofHydroxyl
masssurface
volume refractivitybond
bondsflexibility E-states
groupsarea counting index indices
Nabumetone 228.31 170.097 96.1728 68.4311 2 3.3705 4 26.305 -5.07 3.54603 37.8333 0
N-Acetylprocainamide (Acecainide) 277.41 199.346 112.044 80.1326 5 0.6397 7 61.434 -3.04 7.07517 47.6667 0
nadolol 309.45 170.56 113.879 85.5243 9 1.2691 6 81.945 -2.14 5.57887 52.25 3
Nafcillin 98.769 413.5 354.173 106.711 6 1.5601 4 293.204 -4.4 4.98114 73.05 0
nalbuphine 357.49 191.19 131.454 96.6362 8 1.7042 2 73.156 -2.23 3.13426 55.5 3
nalmefene 339.47 174.44 113.129 94.8462 6 2.1596 2 52.928 -2.61 2.71475 51.3333 2
naloxone 327.41 161.691 103.805 88.3591 7 1.7416 2 70.999 -1.76 2.80209 56 2
Naltrexone 341.44 189.611 104.851 91.1382 7 1.7109 2 69.999 -2.05 2.68542 55.3333 2
naproxen 454.53 224.899 139.571 115.272 8 2.419 7 46.533 -4.4 6.1064 83.2167 1
Naratriptan 335.51 213.881 124.714 94.5036 5 1.3125 5 65.198 -3.47 4.86729 50.3167 0
Naringin 225.065 580.59 452.397 133.73 22 0.093 6 400.011 -2.16 8.84478 115.833 8
Nedocromil 126.814 371.37 311.002 97.3645 9 0.264 5 248.495 -3.91 4.98581 78.3333 2
nefazodone 470.07 275.972 179.671 131.655 4 4.2872 10 55.451 -3.74 8.95508 66.1444 0
nelfinavir 567.861 271.287 196.161 161.832 9 4.6422 10 101.89 -5.47 10.5979 87.55 2
Neomycin 353.138 628.781 531.011 140.833 32 -7.44 10 452.564 -1.1 12.0567 119.833 7
netivudine 282.28 174.264 107.215 65.4861 10 -1.1366 4 63.58 -1.87 4.29421 60.8333 3
Nevirapine 266.33 179.177 99.4313 75.305 4 1.8723 1 63.58 -3.41 2.86633 43.8333 0
nicardipine 479.58 251.287 164.923 134.795 8 1.998 10 113.699 -5.29 8.9118 88.3333 0
Nicotine 162.26 130.329 69.9689 49.6227 2 1.4827 1 16.13 -0.24 2.36077 22.5 0
nicotinic acid(niacin) 123.12 90.7132 47.4626 30.628 4 0.898 1 50.191 -0.17 1.85293 27.3333 1
nifedipine 346.37 303.568 210.127 92.1635 7 0.2423 5 110.461 -4.29 5.7028 70.1667 0
Nimodipine 130.689 376.4 332.539 98.4379 9 0.0458 7 278.106 -4.12 6.8307 77.1667 1
nisoldipine 388.46 194.566 128.899 105.908 7 1.4562 7 110.461 -4.83 7.08869 75 0
Nitrazepam 281.29 156.601 89.3893 77.4351 5 2.1982 1 87.286 -3.97 3.64352 56 0
nitrendipine 360.4 184.162 122.533 96.9115 7 0.5848 6 110.461 -4.41 6.27469 71.6667 0
Nitrofurantoin 238.18 152.34 84.7954 53.1211 7 0.0407 3 120.735 -2.76 3.24856 55.1667 0
Nizatidine 331.5 205.386 115.333 89.1165 6 1.1397 10 86.008 -3.93 9.29925 48.2667 0
Nordiazepam 270.73 145.876 87.7843 74.9152 3 2.7626 1 41.462 -4.09 3.41029 41.3111 0
Norepinephrinel 86.707 169.2 176.178 43.8821 8 0.2225 2 117.054 -1.13 2.77629 35.8333 3
Norfenefrine 66.479 153.2 171.435 42.188 6 0.5069 2 113.434 -0.91 2.59321 30.1667 2
Norfloxacin 319.37 189.211 112.873 85.2424 6 0.846701 3 74.569 -1.9 4.35954 61.6667 1
nortriptyline 263.41 306.13 204.704 87.0364 2 4.1572 4 12.027 -5.48 3.98206 36.8333 0
ofloxacin 361.41 176.094 124.086 94.7015 6 0.848201 2 75.014 -1.87 4.24503 67.6667 1
olanzapine 312.47 185.213 118.151 93.1032 3 2.2728 1 35.159 -3.52 3.90693 40.1333 0
Olsalazine 139.782 302.26 274.043 77.282 12 3.1766 5 184.349 -3.59 5.10618 69.3333 4
olsalazine 302.26 160.489 98.4169 77.282 12 3.1766 5 139.782 -3.59 5.10618 69.3333 4
omeprazole 359.59 206.683 145.465 96.4368 9 0.137202 5 77.114 -2.98 6.32132 48.0889 0
ondansetron 293.4 175.488 111.212 87.2219 2 2.3371 2 39.831 -3.07 3.31777 45.8333 0
oseltamivir 312.46 183.362 124.71 84.2016 7 0.528102 8 90.66 -2.66 7.8867 53.8333 0
Ouabain 206.59 584.73 471.211 140.832 20 -1.5009 4 426.734 -2.1 7.31816 108 8
Oxacillin 401.47 228.606 131.095 101.239 8 1.5823 4 112.738 -3.67 4.83719 71.55 1
Oxalic acid 74.598 90.04 90.9757 14.4386 6 -0.241 1 57.9416 -0.14 1.43452 29.3333 2
oxatomide 426.61 247.314 155.482 129.01 4 3.8589 7 61.69 -4.04 6.4138 63.6667 0
Oxprenolol 265.39 182.485 114.204 76.0002 6 2.2826 9 50.723 -2.59 7.36471 43 1
oxybutynin 252.29 144.977 81.098 71.5579 3 1.6598 0 63.403 -3.2 2.73939 47.5 0
Journal of Computational Interdisciplinary Sciences, Vol. 2(3), 2011
“main” — 2013/4/1 — 19:47 — page 189 — #11
RAJNISH KUMARA, ANJU SHARMA, PRITISH VARADWAJ, AUSAF AHMAD and GHULAM MD ASHRAF 189
Table 1 – (continuation).
Name of drugMolecular
MolecularMolecular Molecular
Total H
logPRotable
TPSA logS
Shape Sum ofHydroxyl
masssurface
volume refractivitybond
bondsflexibility E-states
groupsarea counting index indices
oxyfedrine 313.43 194.965 126.078 90.751 6 2.6061 8 58.56 -4.16 6.46883 53.3333 1
Paclitaxel 853.991 748.869 551.96 217.299 18 3.9632 14 221.307 -5.19 12.3465 160.5 3
pafenolol 337.52 229.341 150.191 95.7857 8 1.7211 10 82.614 -3.58 9.74525 55 1
Pamidronate 161.305 235.09 182.96 39.9314 14 -1.1641 4 144.919 -1.17 3.82633 52.8611 5
Papaverine 49.828 339.42 330.046 95.7229 5 3.0613 6 260.052 -4.42 5.71289 53.8333 0
Paromomycin 347.34 615.73 503.565 134.243 32 -6.8255 9 434.413 -0.89 11.4718 120.333 8
pefloxacin 333.4 187.613 120.99 89.3291 5 0.949701 3 65.7 -1.96 4.59658 63.1667 1
Pentamidine 118.218 340.47 333.214 98.7032 6 2.6629 10 272.485 -4.16 8.2279 58.5 0
Pentazocine 285.47 185.367 106.191 89.5115 3 4.2756 3 23.466 -3.37 3.70644 40.5833 1
Pentoxifylline 278.35 317.399 204.655 73.0241 4 0.315201 5 78.907 -1.73 4.52343 52.3333 0
Phenacetin 38.332 179.24 210.72 50.3514 3 0.9853 3 132.112 2 3.61004 31.5 0
phenglutarimide 288.43 172.417 118.289 83.8526 4 1.788 6 49.407 -3.08 5.64761 47.6667 0
phenobarbital 232.26 132.267 76.1919 59.7463 5 1.5606 2 75.267 -2.93 2.87015 47.4167 0
Phenoperidinl 49.771 367.53 370.087 107.923 5 3.9213 8 292.125 -3.98 6.77636 58.5833 1
Phenoxymethylpenicillin 350.42 184.345 111.203 85.6734 7 0.570199 5 95.94 -2.89 4.58454 63.05 1
Phenylbutazone 308.41 206.886 115.7 88.7583 2 4.2216 5 40.618 -3.33 4.6468 52.5 0
Phenylephrine 167.23 139.62 74.809 46.9626 6 0.9152 3 52.483 -0.88 3.22184 30.6667 2
Phenytoin 252.29 170.463 96.6996 69.9813 4 2.2587 2 58.196 -3.5 2.73939 46.9167 0
Physostigminel 44.808 261.36 262.178 73.2575 4 1.2538 2 197.151 -2.12 3.14236 41.3333 0
Pimozide 479.781 273.84 178.089 132.674 3 4.3413 7 41.034 -5.43 8.58552 70.3333 0
Pindolol 248.36 155.823 84.9222 71.4608 6 1.5679 6 57.28 -2.46 4.49301 39.1667 1
pirbuterol 240.34 158.417 98.6598 64.6814 9 0.700001 5 85.603 -1.59 4.95164 44.0833 3
Pirenzepine 74.235 351.45 303.074 98.6471 6 0.5935 2 256.495 2.71 4.86874 59 0
piroxicam 331.37 168.565 97.5722 84.9759 7 -0.3903 2 99.599 -3.37 4.07555 62.8167 1
piroximone 217.25 134.997 79.007 59.6213 5 -1.034 3 78.616 -2.13 3.17317 41.8333 0
Practolol 266.38 177.552 114.359 73.4565 7 0.6436 7 70.587 -2.74 6.65708 46.1667 1
Pramipexole 211.36 160.251 84.268 62.0095 4 1.2555 3 50.942 -3.18 3.5818 25.9667 0
Pravastatin 424.59 215.32 160.527 113.597 11 2.1716 11 124.288 -3.24 9.37263 78.1667 4
praziquantel 312.45 188.524 126.25 88.7847 2 2.1569 1 40.618 -2.91 4.03538 48.8333 0
Prazosin 383.45 230.534 129.731 103.279 7 1.163 4 106.962 -2.74 5.82569 64.8333 0
Prednisolone 360.49 180.896 107.283 98.5856 8 1.5099 2 94.826 -3.18 3.89428 65.0833 3
Prednisone 358.47 352.333 219.861 97.661 7 1.8777 2 91.669 -3.51 3.73802 66.4167 2
Primidone 218.28 151.442 77.2158 59.0376 4 1.4856 2 58.196 -2.32 2.8511 40.25 0
Probenecid 285.39 189.999 101.065 73.3121 5 2.3799 7 74.679 -2.83 5.65245 52.3167 1
Procainamide 235.37 179.215 99.6079 71.7508 4 1.0076 6 58.359 -1.89 5.83063 38.5 0
Prochlorperazine 11.41 373.98 349.604 109.909 2 3.5965 4 282.817 -4.53 5.34115 42.7778 0
Progesterone 314.51 168.243 112.93 92.7986 2 3.6889 1 34.142 -4.76 3.41582 46.8333 0
Promethazine 8.172 284.45 277.583 88.6067 1 3.6382 3 210.681 -4.07 3.83254 36.1333 0
Propafenone 58.56 341.49 363.571 100.206 6 3.4004 11 258.23 -4.65 8.32312 56 1
propanolol 259.38 172.039 108.396 76.8245 5 2.7969 6 41.489 -3.51 4.90793 40.6667 1
propiverine 367.53 201.466 132.8 107.525 4 3.982 8 38.777 -4.76 6.77636 56.5833 0
Propoxyphene 29.543 339.52 330.992 102.88 3 4.637 9 281.411 -4.91 6.91435 52.5833 0
Propranolol 259.38 172.039 108.396 76.8245 5 2.7969 6 41.489 -3.51 4.90793 40.6667 1
Propylthiouracil 168.23 119.861 73.0952 47.7039 4 1.3709 2 48.653 -2.27 3.3177 26.2667 0
Proquazone 34.897 278.38 276.9 84.6536 2 4.5173 2 206.557 -4.48 3.68815 45.3333 0
Journal of Computational Interdisciplinary Sciences, Vol. 2(3), 2011
“main” — 2013/4/1 — 19:47 — page 190 — #12
190 CLASSIFICATION OF ORAL BIOAVAILABILITY OF DRUGS BY MACHINE LEARNING APPROACHES
Table 1 – (continuation).
Name of drugMolecular
MolecularMolecular Molecular
Total H
logPRotable
TPSA logS
Shape Sum ofHydroxyl
masssurface
volume refractivitybond
bondsflexibility E-states
groupsarea counting index indices
Proscillaridin 129.591 530.72 453.708 140.053 12 2.6956 3 397.732 -4.09 6.58443 88.25 4
Protriptyline 263.41 179.399 100.471 87.303 2 4.3343 4 12.027 -6.06 3.98206 37 0
Pseudoephedrine 165.26 135.097 72.5887 49.6867 4 1.6127 3 32.255 -1.3 3.25867 26.8333 1
Quetiapine 383.55 229.572 133.912 111.573 5 2.8402 6 48.83 -3.98 6.53087 53.4667 1
Quinidine 324.46 210.108 130.596 94.6611 5 3.0841 4 45.592 -2.99 4.37891 49.5 1
Quinine 324.46 211.193 118.3 94.6611 5 3.0841 4 45.592 -2.99 4.37891 49.5 1
Raffinose 268.678 504.5 399.853 101.187 27 -3.6862 8 341.611 0.12 9.18478 108.083 11
Raloxifene 69.999 473.62 427.153 136.943 7 4.89 7 344.646 -5.97 6.94474 74.3 2
ranitidine 314.45 199.237 129.643 85.127 6 0.715301 10 86.256 -3.6 8.4307 50.1333 0
recainam 263.43 174.833 114.727 79.552 5 2.2306 6 53.15 3.43 6.70032 41 0
repaglinide 452.65 221.416 156.016 130.608 6 4.7464 10 78.869 -5.19 9.32307 74.3333 1
reproterol 389.46 211.392 144.334 100.886 11 -0.098 7 134.547 -2.13 6.41085 74.5 3
ribavirin 244.24 128.405 85.8159 54.3191 11 -2.1039 3 143.73 -0.87 3.86949 52.6667 3
rimiterol 223.3 142.038 91.31 60.4681 8 1.4233 2 72.711 -1.51 3.55505 40.1667 3
Risperidone 410.54 237.698 139.642 113.851 5 2.2349 4 64.167 -3.47 5.87601 66.1667 0
Ritodrine 72.711 287.39 297.466 82.4421 8 3.0722 6 224.023 -3.21 5.47116 50.8333 3
Rizatriptan 269.39 197.087 107.708 82.8446 4 1.6758 5 49.747 -2.9 4.30232 39.6667 0
rofecoxib 314.37 156.382 96.1324 83.8311 4 2.2409 3 60.447 -4.47 3.68081 56.3167 0
Ropinirole 260.42 186.068 104.894 79.5707 3 2.2802 7 32.336 -2.87 5.1103 38.6667 0
rosiglitazone 357.46 205.323 130.929 97.0371 5 3.1267 7 71.533 -3.97 6.26016 57.8 0
saccharin 183.19 101.349 54.9342 41.8214 4 0.2558 0 63.24 -1.45 1.33293 36.8167 0
Salicylic acid 138.13 98.4897 52.0031 34.5105 5 1.4606 1 57.527 -1.09 1.79792 32 2
Saquinavir 166.746 670.941 612.855 186.173 12 2.9936 13 524.271 -5.43 12.5189 114.583 1
Scopolamine 303.39 191.134 121.111 79.7213 6 1.0072 5 62.299 -1.66 3.5316 49.8333 1
Selegiline 187.31 220.66 164.316 61.3537 1 2.8721 5 3.238 -3.87 4.22382 28.5 0
sildenafil 473.63 242.726 168.173 126.15 8 2.1254 7 113.432 -2.68 7.66379 77.65 0
Simvastatin 418.63 400.76 337.381 117.682 6 4.4326 7 72.838 -4.53 7.36399 67.5833 1
Sodium oxybate 57.527 104.12 125.317 23.7999 5 -0.2905 3 81.1842 0.68 3.54814 25.1667 2
Sorivudine 348.15 171.478 116.56 69.7954 10 0.1478 4 124.785 -1.04 5.00317 59.3958 3
Sotalol 272.4 161.101 102.727 71.4893 7 0.721401 6 78.424 -2.54 5.27559 46.8167 1
spironolactone 416.62 193.513 135.012 113.645 4 2.3927 2 60.447 -5.32 4.49946 62.3833 0
Stavudine 224.24 217.19 154.9 57.5 6 0.1812 2 84.329 -0.46 3.27 42.66 1
Streptomycin 331.434 581.67 478.436 128.64 27 -4.5666 11 409.082 -1.66 11.4848 119.25 7
Streptozocin 151.917 265.26 233.621 55.9552 13 -1.7592 2 182.959 -0.9 5.60039 60.8333 4
sudoxicam 337.39 156.014 93.4781 83.4138 7 -0.176 2 99.599 -3.12 4.00206 59.45 1
Sulfadiazine 250.3 160.981 88.6155 64.1694 6 0.7233 3 97.976 -2.62 3.71719 45.8167 0
Sulfamethoxazole 253.3 165.181 89.1154 64.4952 6 0.9292 3 98.224 -2.47 3.34749 45.9833 0
sulfasalazine 398.42 202.315 120.273 103.787 11 4.0621 7 141.316 -3.93 6.5744 78.4833 2
Sulfinpyrazone 404.51 216.172 125.145 113.56 3 3.5477 6 57.689 -3.1 5.7573 68.0889 0
Sulfisoxazole 267.33 161.668 90.7885 68.2267 6 1.2754 3 98.224 -2.93 3.58556 47.65 0
sulindac 356.43 174.271 113.339 99.4754 4 2.6837 5 54.37 -4.15 4.78972 64.9222 1
Sulpiride 341.47 154.275 98.1515 88.1339 7 0.111501 6 101.735 -2.8 5.87737 58.8167 0
sultopride 354.51 186.724 124.514 94.4786 6 1.0793 7 75.712 -3.25 6.50956 58.3167 0
sumatriptan 295.44 186.336 113.896 82.3314 5 0.819501 6 72.838 -3.37 4.59358 46.4833 0
Tacrine 38.915 198.29 215.179 61.9435 2 2.8303 0 139.605 -3.16 2.17479 29.3333 0
Journal of Computational Interdisciplinary Sciences, Vol. 2(3), 2011
“main” — 2013/4/1 — 19:47 — page 191 — #13
RAJNISH KUMARA, ANJU SHARMA, PRITISH VARADWAJ, AUSAF AHMAD and GHULAM MD ASHRAF 191
Table 1 – (continuation).
Name of drugMolecular
MolecularMolecular Molecular
Total H
logPRotable
TPSA logS
Shape Sum ofHydroxyl
masssurface
volume refractivitybond
bondsflexibility E-states
groupsarea counting index indices
Tacrolimus 178.376 804.141 712.467 215.711 15 5.1656 8 630.309 -5.3 17.5439 137.083 3
Tamsulosin 408.56 247.282 142.088 108.863 8 2.2098 11 99.894 -4.79 8.55585 66.9833 0
telmisartan 514.67 281.189 188.248 153.819 5 7.5316 7 72.951 -5.17 7.03226 83.1667 1
Temazepam 300.76 169.913 99.8883 81.0103 4 3.0462 1 52.901 -3.75 3.85211 48.6444 1
Tenidap 320.76 158.628 96.5863 81.3625 5 1.0015 2 85.327 -4.53 3.56139 53.2778 1
Tenofovir 136.394 287.25 269.268 66.806 10 0.2327 5 186.631 -1.57 4.99343 53.1389 2
tenoxicam 337.39 158.438 92.6938 83.7786 7 -0.6337 2 99.598 -3.12 4.00206 59.45 1
Terazosin 387.49 251.764 146.206 104.455 7 0.545001 4 103.056 -2.41 6.20721 63 0
terbutaline 225.32 143.831 90.9709 62.4605 8 1.4646 4 72.711 -1.59 4.04284 41.5833 3
Terfenadine 43.694 471.74 493.619 146.065 5 7.0287 9 389.271 -6.01 8.10866 70.3333 2
Terguride 51.365 340.52 340.066 101.191 4 1.9414 3 259.828 -3.59 4.49784 49.8333 0
Testosterone 288.47 161.401 110.73 84.5227 3 2.8985 0 37.299 -3.94 2.95854 42.1667 1
Tetrabenazine 38.777 317.47 332.937 91.307 4 3.3272 4 247.83 -2.94 4.85273 47.8333 0
tetracycline 444.48 186.194 130.862 113.42 15 -3.1477 2 181.614 -2.52 4.92084 93.6667 5
theophylline 184.23 116.621 76.3016 43.6117 6 -0.8989 0 72.693 -0.9 1.91801 34.5 0
Tiagabine 375.58 215.249 126.348 110.029 4 3.8023 7 40.537 -4.25 6.44438 50.6 1
Ticarcillin 135.649 383.44 320.932 88.1638 8 -0.3761 3 272.509 -2.89 4.64702 72.35 0
Timolol 316.47 199.844 131.128 85.235 8 0.8882 7 79.745 -3.07 6.91271 45.05 1
Tizanidine 62.202 253.73 219.862 65.0233 5 2.2647 2 160.752 -2.92 3.44448 31.2778 0
tobramycin 467.6 230.856 172.331 106.695 24 -5.5567 6 268.191 -0.94 8.78724 88.6667 5
Tocainide 192.29 154.206 81.1827 57.0756 4 1.4643 2 55.121 -2.08 3.38373 33.5 0
tolbutamide 270.38 171.713 103.6 70.2696 5 2.2143 5 75.267 -0.13 5.45695 47.8167 0
Tolcapone 273.26 154.84 94.1415 72.3876 7 3.12 2 103.351 -3.68 3.71027 60.6667 2
tolmesoxide 214.3 130.325 82.6951 58.3038 3 0.962301 3 35.539 -1.72 3.80157 33.0889 0
Tolterodine 325.54 200.988 117.517 103.668 3 5.8232 7 23.466 -4.78 6.58654 47.6667 1
Topotecan 421.49 228.368 137.731 114.729 9 0.160301 3 104.896 -2.37 4.69548 76.0833 2
torasemide 348.46 187.806 115.067 91.5648 7 2.0278 5 100.186 -3.77 6.12097 61.4833 0
toremifene 406 217.154 145.697 124.234 2 5.9097 10 12.474 -6 8.06225 54.8111 0
tramadol 263.42 166.376 108.113 78.2688 4 2.3021 4 32.7 -2.55 4.6085 38.9167 1
Trandolapril 95.94 430.6 414.857 115.785 8 3.2778 10 337.036 -4.32 8.48701 74.3333 1
Tranexamic acid 157.24 113.738 75.6231 41.9035 5 0.6158 2 63.322 -0.94 3.02492 28.8333 1
trapidil 205.3 136.895 84.9866 61.2336 3 1.5741 3 46.329 -2.03 3.6371 31 0
trazodone 371.91 225.257 140.725 105.159 3 2.7936 5 45.788 -2.43 5.57443 52.4778 0
TRH 150.282 362.44 339.504 89.5049 9 -3.0287 6 269.923 -2.46 6.10122 69.8333 0
Triamcinolone acetonide 93.066 420.52 342.225 107.284 8 1.4153 2 314.749 -3.72 4.16041 77.1667 2
triamterene 253.3 149.819 83.0386 75.1259 7 1.3677 1 129.637 -2.42 3.62249 45.6667 0
Triazolam 343.23 180.427 107.47 92.7297 3 4.8512 1 43.082 -4.27 4.2637 44.4556 0
Trimethoprim 290.36 195.359 109.67 81.5094 7 1.0485 5 105.532 -2.67 5.61871 49.6667 0
Trovafloxacin 416.39 191.532 129.786 101.388 7 0.5559 3 101.457 -3.53 4.3726 88.6667 1
urapidil 387.54 237.156 156.811 108.734 5 0.830701 7 71.4747 -2.64 7.05848 62.8333 0
Uridine 125.043 244.23 215.726 52.8005 11 -0.6807 2 169.119 -0.66 3.62125 53.6667 4
valacyclovir 323.38 190.553 126.981 77.9553 10 0.045301 8 151.165 -2 6.74278 61.5 0
valproic acid 144.24 108.314 69.3015 40.2491 3 2.6079 5 37.299 -1.79 5.21715 26 1
Valsartan 435.58 390.46 331.32 125.791 8 4.9235 10 112.075 -4.28 9.16053 75.8333 1
Venlafaxine 277.45 295.93 230.19 83.0234 4 2.5538 5 32.7 -3.08 5.19071 40.4167 1
Journal of Computational Interdisciplinary Sciences, Vol. 2(3), 2011
“main” — 2013/4/1 — 19:47 — page 192 — #14
192 CLASSIFICATION OF ORAL BIOAVAILABILITY OF DRUGS BY MACHINE LEARNING APPROACHES
Table 1 – (continuation).
Name of drugMolecular
MolecularMolecular Molecular
Total H
logPRotable
TPSA logS
Shape Sum ofHydroxyl
masssurface
volume refractivitybond
bondsflexibility E-states
groupsarea counting index indices
Vidarabine 139.551 267.28 231.946 63.2276 11 -1.2405 2 173.449 -1.14 3.7758 52.3333 3
Vigabatrin 129.18 102.564 62.2648 34.2903 5 0.1732 4 63.322 -0.13 3.91763 28 1
Viloxazine 237.33 165.269 101.612 65.2015 5 1.2294 5 39.79 -2.28 4.9416 35.1667 0
Vincamine 53.009 356.51 314.281 99.2316 5 3.3193 3 265.855 -2.57 3.64318 54.5 1
Vinpocetine 34.477 348.48 323.043 104.33 2 2.961 4 262.052 -4.34 3.57611 52.5833 0
Viomycin 685.811 352.709 250.522 161.163 28 -9.204 11 392.852 -2.44 17.4738 144.333 3
Warfarin 322.49 199.444 126.659 87.2306 5 3.1228 4 67.51 -3.32 5.52599 51.8333 1
Xamoterol 103.287 339.44 349.101 87.8404 10 -0.3301 8 250.214 -1.99 8.26306 59.3333 2
Ximoprofen 261.35 158.982 103.222 72.308 6 3.9265 4 69.891 -3.66 4.78079 47.3333 2
Zalcitabine 211.25 142.706 87.523 52.4398 6 -0.3252 2 93.281 -0.34 3.20992 40 1
Zanamivir 332.36 299.62 236.33 75.799 15 -3.1695 7 198.217 -2.35 7.44706 74.3333 4
Zidovudine 266.27 166.922 108.439 63.8679 7 0.4937 3 133.812 -0.68 4.74792 56.5 1
Zimeldine 16.13 317.25 279.249 84.7307 2 3.7813 5 213.104 -4.12 5.23579 36.2292 0
Ziprasidone 412.97 219.951 145.71 116.185 4 2.9721 4 48.466 -4.76 5.2439 54.2778 0
Zolmitriptan 287.4 192.225 110.293 82.4384 5 1.672 5 57.361 -3.18 4.16605 45.1667 0
Zolpidem 321.57 229.887 147.032 94.2383 4 2.5813 3 37.616 -0.99 5.44004 43.1667 0
Zotepine 12.472 331.88 312.396 97.3374 2 3.4929 4 252.163 -5.63 4.88846 40.4445 0
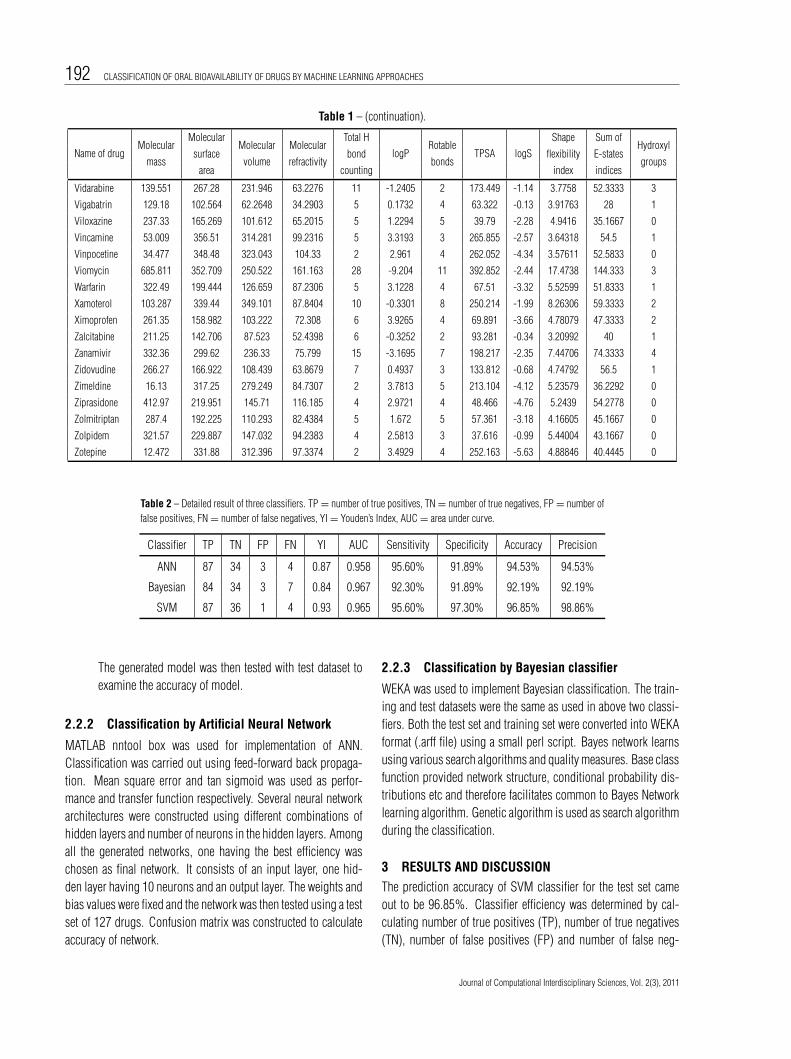
Table 2 – Detailed result of three classifiers. TP = number of true positives, TN = number of true negatives, FP = number offalse positives, FN = number of false negatives, YI = Youden’s Index, AUC = area under curve.
Classifier TP TN FP FN YI AUC Sensitivity Specificity Accuracy Precision
ANN 87 34 3 4 0.87 0.958 95.60% 91.89% 94.53% 94.53%
Bayesian 84 34 3 7 0.84 0.967 92.30% 91.89% 92.19% 92.19%
SVM 87 36 1 4 0.93 0.965 95.60% 97.30% 96.85% 98.86%
The generated model was then tested with test dataset toexamine the accuracy of model.
2.2.2 Classification by Artificial Neural Network
MATLAB nntool box was used for implementation of ANN.Classification was carried out using feed-forward back propaga-tion. Mean square error and tan sigmoid was used as perfor-mance and transfer function respectively. Several neural networkarchitectures were constructed using different combinations ofhidden layers and number of neurons in the hidden layers. Amongall the generated networks, one having the best efficiency waschosen as final network. It consists of an input layer, one hid-den layer having 10 neurons and an output layer. The weights andbias values were fixed and the network was then tested using a testset of 127 drugs. Confusion matrix was constructed to calculateaccuracy of network.
2.2.3 Classification by Bayesian classifier
WEKA was used to implement Bayesian classification. The train-ing and test datasets were the same as used in above two classi-fiers. Both the test set and training set were converted into WEKAformat (.arff file) using a small perl script. Bayes network learnsusing various search algorithms and quality measures. Base classfunction provided network structure, conditional probability dis-tributions etc and therefore facilitates common to Bayes Networklearning algorithm. Genetic algorithm is used as search algorithmduring the classification.
3 RESULTS AND DISCUSSION
The prediction accuracy of SVM classifier for the test set cameout to be 96.85%. Classifier efficiency was determined by cal-culating number of true positives (TP), number of true negatives(TN), number of false positives (FP) and number of false neg-
Journal of Computational Interdisciplinary Sciences, Vol. 2(3), 2011
“main” — 2013/4/1 — 19:47 — page 193 — #15
RAJNISH KUMARA, ANJU SHARMA, PRITISH VARADWAJ, AUSAF AHMAD and GHULAM MD ASHRAF 193
Figure 1 – Plot between different descriptors. (a): Molecular Surface Area vs. Molecular Mass, (b): Molecular Volume vs. Molecular Mass, (c): Molecular Refractivityvs. Molecular Mass, (d): Hydrogen Count vs. Molecular mass.
atives (FN) and these values were found to be 87, 36, 1, and4 respectively. Using these variables, Sensitivity came out tobe 95.6% and 0.79% false positive proportion. Specificity wasfound to be 97.30% with 3.15% false negative proportion.Youden’s Index was calculated as 0.929. Area under ROC wasfound to be 0.965.
From confusion matrix of ANN Number of TP, TN, FP and FNwere calculates as 87, 34, 3, 4 respectively. Sensitivity and Speci-ficity of the network was found to be 95.60% and 91.89%. Over-all accuracy of network is 94.53. Youden’s Index was calculatedas 0.87. Area under ROC curve was 0.958.
The accuracy of prediction for Bayesian classifier was found92.19 for test set. Total correctly classified instances were foundto be 118 while incorrectly classified instances were 10. Thenumber of TP, TN, FP and FN were found to be 84, 34, 3 and
7 respectively. The confusion matrix for the prediction was gener-ated. F-test result was 0.923. Area under ROC curve was foundto be 0.967, whereas Youden’s index was calculated as 0.84.Quite a few researchers have been tried to generate absorp-tion models using different machine learning approaches and re-ported good results [6, 24]. This is the first time we are present-ing a comparative study between three potential machine learningapproaches viz. SVM, ANN and Bayesian for the same dataset.The basic idea behind generating the three models is to com-pare these models and to get some idea about the most effi-cient machine learning approach for considered oral bioavailabil-ity dataset.
The performance of developed classifiers using SVM, ANNand Bayesian classifier were compared to determine most effi-cient classifier among three for prediction of oral bioavailabil-
Journal of Computational Interdisciplinary Sciences, Vol. 2(3), 2011
“main” — 2013/4/1 — 19:47 — page 194 — #16
194 CLASSIFICATION OF ORAL BIOAVAILABILITY OF DRUGS BY MACHINE LEARNING APPROACHES
Figure 2 – Dot plot representing the distribution of descriptor values for drugs with low (LO) and high oral (HO) bioavailability. (a): Rotatable Bonds, (b): HydrogenCount, (c): Shape Flexibility Index and (d): logS. The red and black points indicate the data of LO and HO drugs respectively.
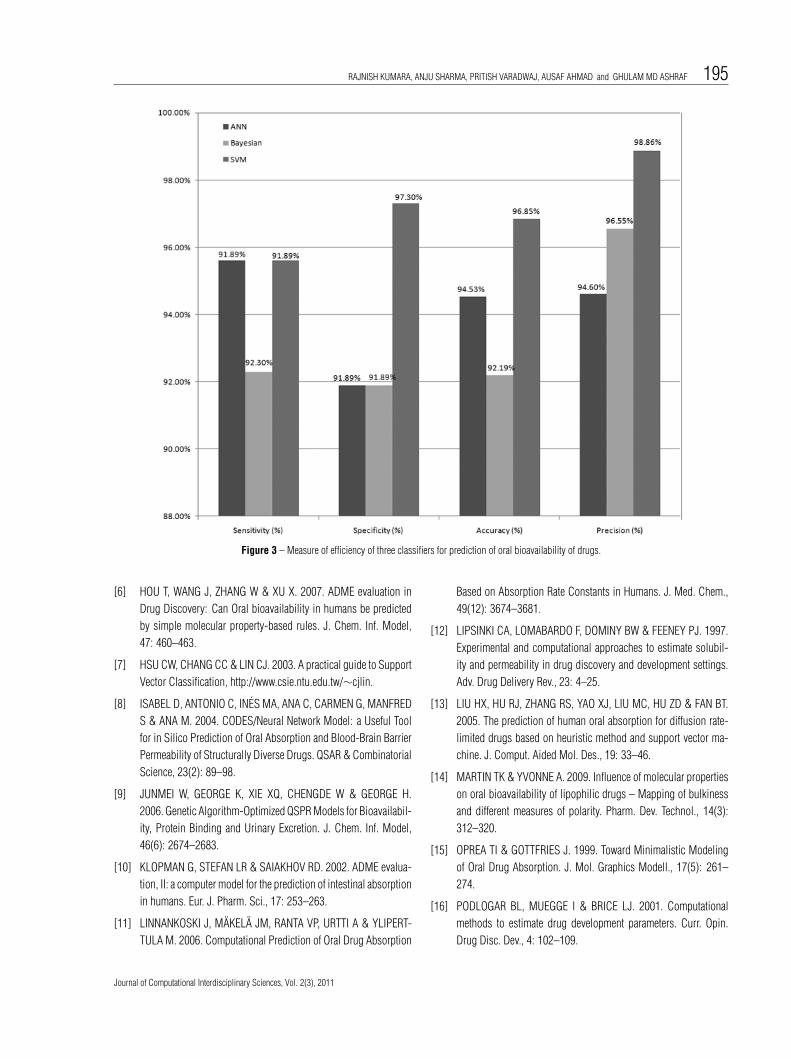
ity of drugs (Fig. 3). Precision of SVM was found to be 4.33%and 6.67% greater than ANN and Bayesian classifier respectively.Moreover, accuracy of SVM for this dataset was found to be2.32% and 4.66% more than ANN and Bayesian classifier re-spectively. Although sensitivity of ANN and SVM is same for thisdataset, but RBF kernels based SVM classifier appears to be thebest in terms of accuracy and precision.
4 CONCLUSION
The study suggests that machine learning approaches such asSVM, ANN and Bayesian classifier are efficient in binary classifi-cation based on oral bioavailability of drugs using physicochem-ical properties. Comparative studies of all three classifiers sug-gest that overall efficiency of SVM for considered dataset is betterfollowed by ANN and Bayesian classifiers.
REFERENCES
[1] CANTU-PAZ E, NEWSAM S & KAMATH C. 2004. Feature selection
in scientific applications. International Conference on Knowledge
Discovery and data Mining, US.
[2] CHANG CC & LIN CJ. 2001. LIBSVM, version 2.81,
http://www.csie.ntu.edu.tw∼cjlin/libsvm
[3] FRANCESCO A, STEFANO L, ENZA M & LEONARDO V. 2006. Ge-
netic programming for Human bioavailability of drugs GECCO’6,
255–262.
[4] GOODMAN LS & GILMAN A. 2001. The Pharmacological Basis of
Therapeutics, 10th edn. McGraw-Hill, Now York, pp. 1917–2023.
[5] HALL LM, LOWELL HH & LEMONT BK. 2003. Modeling Drug
Albumin Binding Affinity with E-State Topological Structure Rep-
resentation. J. Chem. Inf. Comput. Sci., 43(6): 2120–2128.
Journal of Computational Interdisciplinary Sciences, Vol. 2(3), 2011
“main” — 2013/4/1 — 19:47 — page 195 — #17
RAJNISH KUMARA, ANJU SHARMA, PRITISH VARADWAJ, AUSAF AHMAD and GHULAM MD ASHRAF 195
Figure 3 – Measure of efficiency of three classifiers for prediction of oral bioavailability of drugs.
[6] HOU T, WANG J, ZHANG W & XU X. 2007. ADME evaluation in
Drug Discovery: Can Oral bioavailability in humans be predicted
by simple molecular property-based rules. J. Chem. Inf. Model,
47: 460–463.
[7] HSU CW, CHANG CC & LIN CJ. 2003. A practical guide to Support
Vector Classification, http://www.csie.ntu.edu.tw/∼cjlin.
[8] ISABEL D, ANTONIO C, INES MA, ANA C, CARMEN G, MANFRED
S & ANA M. 2004. CODES/Neural Network Model: a Useful Tool
for in Silico Prediction of Oral Absorption and Blood-Brain Barrier
Permeability of Structurally Diverse Drugs. QSAR & Combinatorial
Science, 23(2): 89–98.
[9] JUNMEI W, GEORGE K, XIE XQ, CHENGDE W & GEORGE H.
2006. Genetic Algorithm-Optimized QSPR Models for Bioavailabil-
ity, Protein Binding and Urinary Excretion. J. Chem. Inf. Model,
46(6): 2674–2683.
[10] KLOPMAN G, STEFAN LR & SAIAKHOV RD. 2002. ADME evalua-
tion, II: a computer model for the prediction of intestinal absorption
in humans. Eur. J. Pharm. Sci., 17: 253–263.
[11] LINNANKOSKI J, MAKELA JM, RANTA VP, URTTI A & YLIPERT-
TULA M. 2006. Computational Prediction of Oral Drug Absorption
Based on Absorption Rate Constants in Humans. J. Med. Chem.,
49(12): 3674–3681.
[12] LIPSINKI CA, LOMABARDO F, DOMINY BW & FEENEY PJ. 1997.
Experimental and computational approaches to estimate solubil-
ity and permeability in drug discovery and development settings.
Adv. Drug Delivery Rev., 23: 4–25.
[13] LIU HX, HU RJ, ZHANG RS, YAO XJ, LIU MC, HU ZD & FAN BT.
2005. The prediction of human oral absorption for diffusion rate-
limited drugs based on heuristic method and support vector ma-
chine. J. Comput. Aided Mol. Des., 19: 33–46.
[14] MARTIN TK & YVONNE A. 2009. Influence of molecular properties
on oral bioavailability of lipophilic drugs – Mapping of bulkiness
and different measures of polarity. Pharm. Dev. Technol., 14(3):
312–320.
[15] OPREA TI & GOTTFRIES J. 1999. Toward Minimalistic Modeling
of Oral Drug Absorption. J. Mol. Graphics Modell., 17(5): 261–
274.
[16] PODLOGAR BL, MUEGGE I & BRICE LJ. 2001. Computational
methods to estimate drug development parameters. Curr. Opin.
Drug Disc. Dev., 4: 102–109.
Journal of Computational Interdisciplinary Sciences, Vol. 2(3), 2011
“main” — 2013/4/1 — 19:47 — page 196 — #18
196 CLASSIFICATION OF ORAL BIOAVAILABILITY OF DRUGS BY MACHINE LEARNING APPROACHES
[17] SOMOGYI A, EICHELBAUM M & GUGLER R. 2006. Prediction
of bioavailability for drugs with a high first-pass effect using oral
clearance data. Eur. J. of Clinical Pharm., 22(1): 85–90.
[18] TETKO IV, GASTEIGER J, TODESCHINI R, MAURI A, LIVING-
STONE D, ERTL P, PALYULIN VA, RADCHENKO EV, ZEFIROV
NS, MAKARENKO AS, TANCHUK VY & PROKOPENKO VV. 2005.
Virtual computational chemistry laboratory – design and descrip-
tion, J. Comput. Aid. Mol. Des., 19: 453–63.
[19] TURNER JV, MADDALENA DJ & AGATONOVIC KS. 2004. Bio-
availability prediction based on molecular structure for a diverse
series of drugs. Pharm. Res., 21: 68–82.
[20] USANSKY H & SINKO PJ. 2005. Estimating human drug oral ab-
sorption kinetics from Caco-2 permeability using an absorption-
disposition model: model development and evaluation and deriva-
tion of analytical solutions for k (a) and F (a). J. Pharmacol. Exp.
Ther., 314: 391–399.
[21] VEBER DF, JOHNSON SR, CHENG HY, SMITH BR, WARD KW &
KOPPLE KD. 2002. Molecular properties that influence the oral
bioavailability of drug candidates. J. Med. Chem., 45: 2615–2623.
[22] YOSHIDA F & TOPLISS JG. 2000. QSAR model for drug human
oral bioavailability. J. Med. Chem., 43: 2575–2585.
[23] WATERBEEMD HV. 2009. Drugbioavailability, permeability, ab-
sorption, estimation of solubility and bioavailability. Bernard Testa,
2nd edition, 40: 433–454.
[24] XUE Y, LI ZR, YAP CW, SUN LZ, CHEN X & CHEN YZ. 2004.
Effect of Molecular Descriptor Feature Selection in Support Vec-
tor Machine Classification of Pharmacokinetic and Toxicological
Properties of Chemical Agents. J. Chem. Inf. Comput. Sci., 44:
1630–1638.
[25] ZHAO YH, ABRAHAM MH, LE J, HERSEY A, LUSCOMBE CN,
BECK G, SHERBORNE B & COOPER I. 2002. Rate limited steps of
human oral absorption and QSAR studies. Pharma. Res., 19(10):
1446–1457.
A APPENDIX
1. Start with empty set Y = {8}
2. Select the best feature X+ = arg maxX∈Y k
[J (Y k + x)
]
Y k = Y k + X+; k = k + 1
3. Select the worst feature
X− = arg maxX∈Y k
[J (Y k − x)
]
4. If J(Y k − X−
)> J
(Y k
)then
Y k + 1 = Y k − x; k = k + 1
go to step 3
else
go to step 2
Journal of Computational Interdisciplinary Sciences, Vol. 2(3), 2011


![European Journal of Pharmaceutics and Biopharmaceutics...of the dissolution rate and in turn oral bioavailability of poorly water-soluble drugs, including solid dispersions [5–7]](https://img.pdfslide.us/doc/110x75/60de688d70e83212ee0ad292/european-journal-of-pharmaceutics-and-biopharmaceutics-of-the-dissolution-rate.jpg)