Embed Size (px)
Citation preview
Classification of ionisable drugs by apparent dissolution and precipitation rates
Jon MoleSirius Analytical13th June 2007
© 2007/ 482
Contents
Introduction
Principle of the CheqSol method
Our early theories
Precipitation rate graph – a new tool
Four classes of solubility behaviour
Future research and conclusions
© 2007/ 483
Introduction
Recent investigations at Sirius using our CheqSol solubility assay has given us some interesting insights into the relationships between dissolution and precipitation rates for a range of drugs.
Our latest research indicates that molecules can be placed into one of four classes: Chasers, Non-Chasers, Super-Chasersand Ghosts.
© 20074
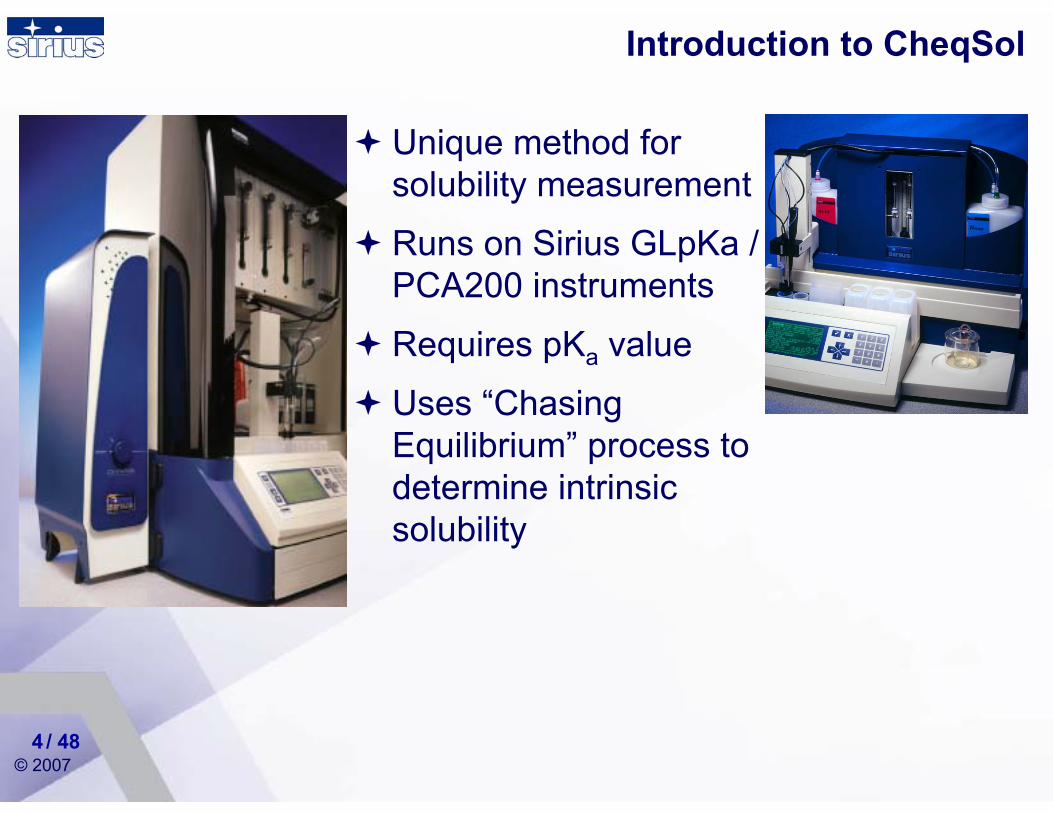
Introduction to CheqSol
Unique method for solubility measurement
Runs on Sirius GLpKa / PCA200 instruments
Requires pKa value
Uses “Chasing Equilibrium” process to determine intrinsic solubility
/ 48
© 2007/ 485
Sirius definitions of solubility
Kinetic Solubility is the concentration of a compound in solution at the time when an induced precipitate first appears
Equilibrium Solubility* is the concentration of compound in a saturated solution when excess solid is present, and solution and solid are at equilibrium
Intrinsic Solubility ** is the equilibrium solubility of the free acid or base form of an ionizable compound at a pH where it is fully un-ionized
* also called Thermodynamic Solubility** Hörter, D.; Dressman, J. B. Adv. Drug Deliv. Rev., 1997, 25, 3-14
© 2007/ 486
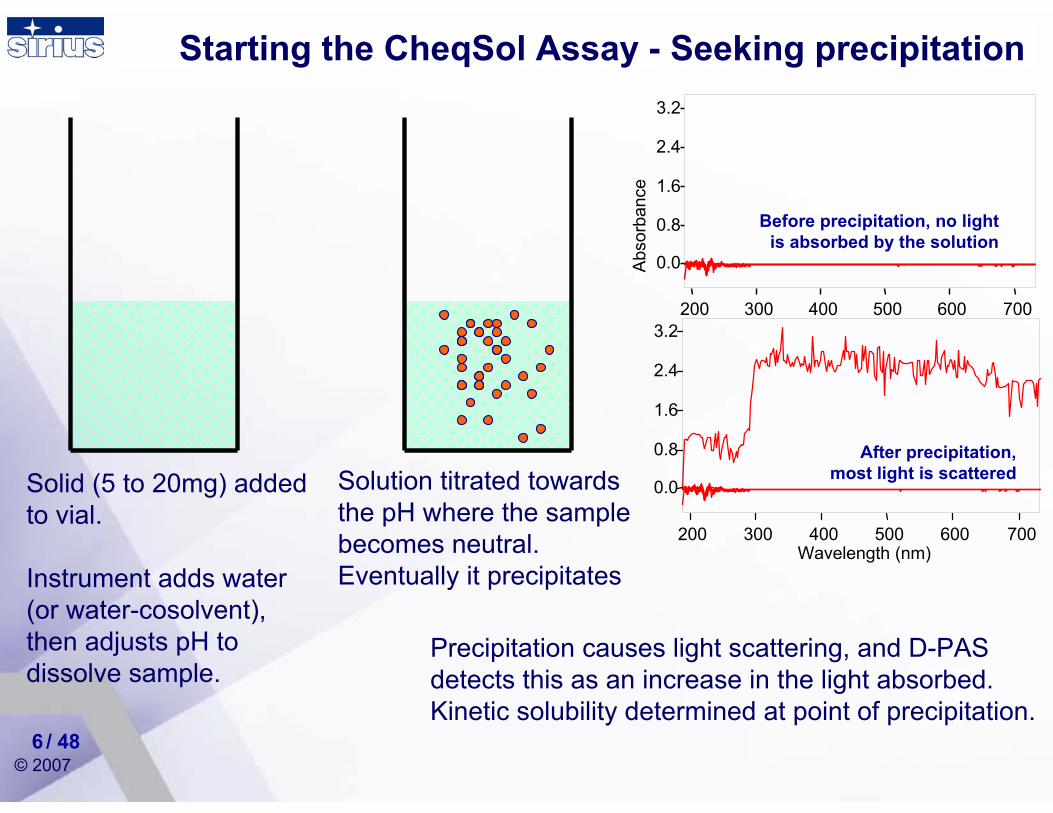
Solid (5 to 20mg) added to vial.
Instrument adds water (or water-cosolvent), then adjusts pH to dissolve sample.
Solution titrated towards the pH where the sample becomes neutral.Eventually it precipitates
Precipitation causes light scattering, and D-PAS detects this as an increase in the light absorbed. Kinetic solubility determined at point of precipitation.
Starting the CheqSol Assay - Seeking precipitation
Before precipitation, no light is absorbed by the solution
Abs
orba
nce
0.0
0.8
1.6
2.4
3.2
200 300 400 500 600 700
After precipitation, most light is scattered
Wavelength (nm)
0.0
0.8
1.6
2.4
3.2
200 300 400 500 600 700
© 2007/ 487
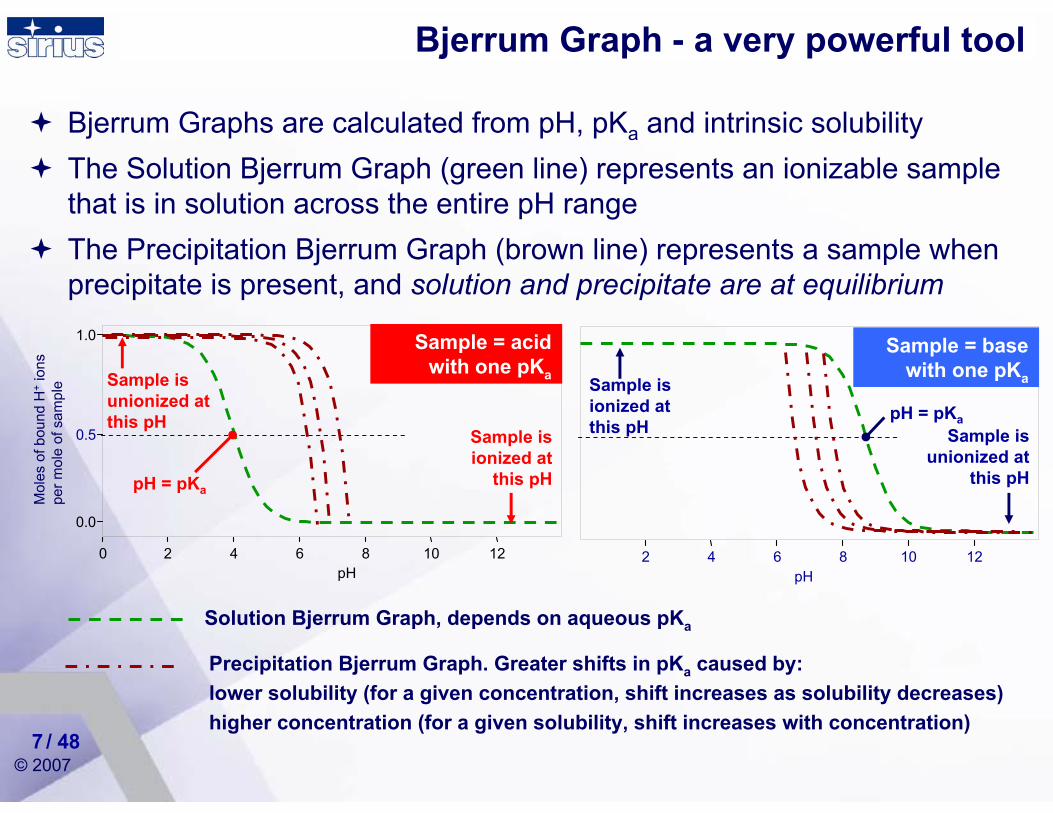
Bjerrum Graph - a very powerful tool
Bjerrum Graphs are calculated from pH, pKa and intrinsic solubilityThe Solution Bjerrum Graph (green line) represents an ionizable sample that is in solution across the entire pH rangeThe Precipitation Bjerrum Graph (brown line) represents a sample when precipitate is present, and solution and precipitate are at equilibrium
Solution Bjerrum Graph, depends on aqueous pKa
Precipitation Bjerrum Graph. Greater shifts in pKa caused by:lower solubility (for a given concentration, shift increases as solubility decreases)higher concentration (for a given solubility, shift increases with concentration)
Mol
es o
f bou
nd H
+io
ns
per m
ole
of s
ampl
e
pH
0.0
1.0
0 2 4 6 8 10 12
0.5
pH = pKa
Sample = acid with one pKa
Sample is ionized at
this pH
Sample is unionized at this pH
pH2 4 6 8 10 12
pH = pKa
Sample = base with one pKa
Sample is unionized at
this pH
Sample is ionized at this pH
© 2007/ 488
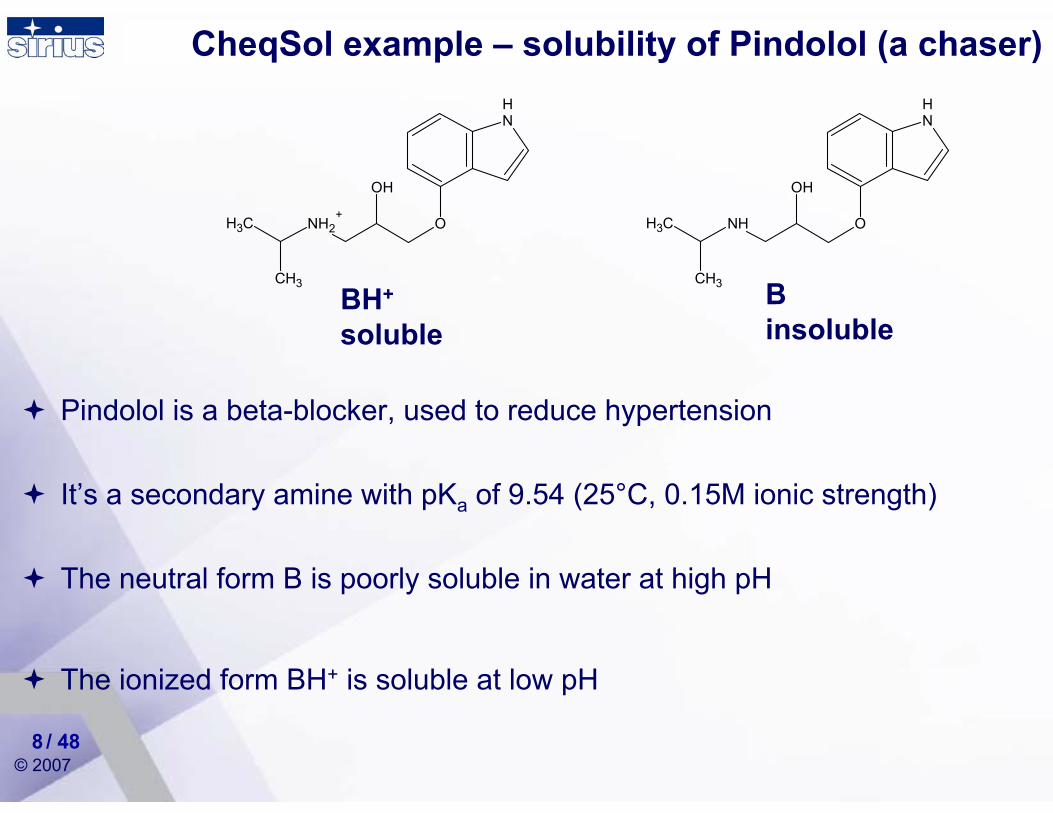
CheqSol example – solubility of Pindolol (a chaser)
Pindolol is a beta-blocker, used to reduce hypertension
It’s a secondary amine with pKa of 9.54 (25°C, 0.15M ionic strength)
The neutral form B is poorly soluble in water at high pH
The ionized form BH+ is soluble at low pH
BH+
solubleBinsoluble
NH
ONH
OH
CH3
CH3
NH
ONH2+
OH
CH3
CH3
© 2007/ 489
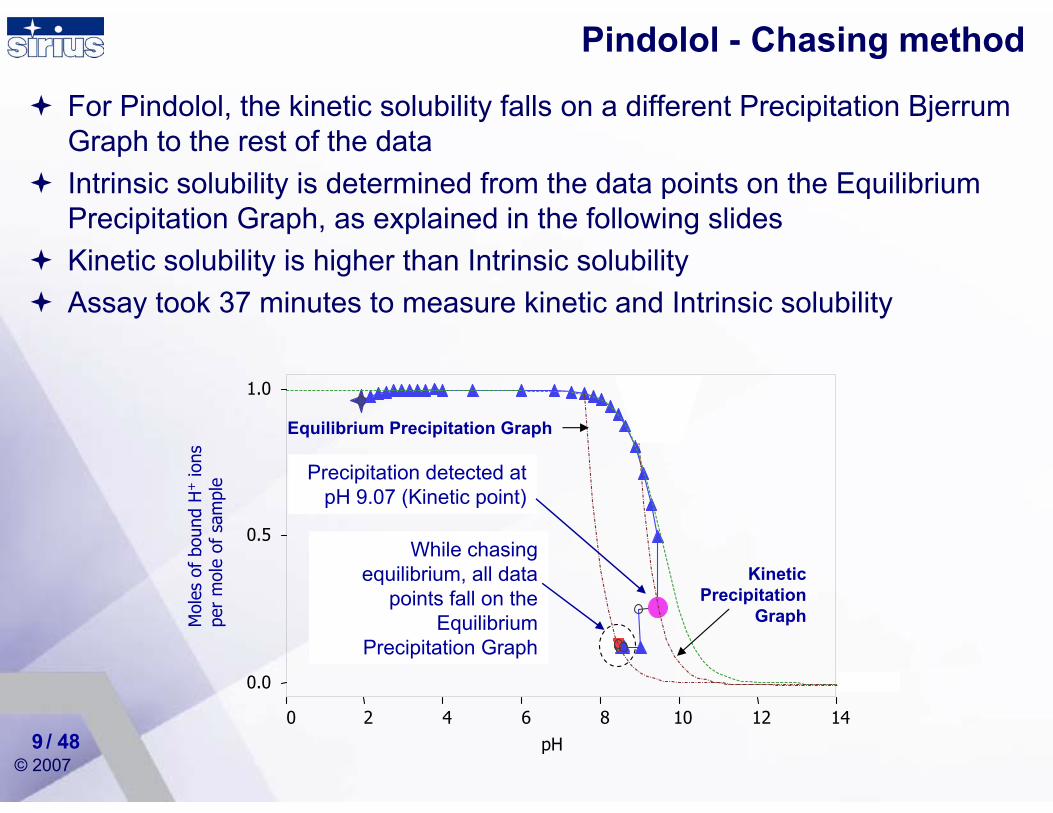
Pindolol - Chasing method
For Pindolol, the kinetic solubility falls on a different Precipitation Bjerrum Graph to the rest of the dataIntrinsic solubility is determined from the data points on the Equilibrium Precipitation Graph, as explained in the following slides Kinetic solubility is higher than Intrinsic solubilityAssay took 37 minutes to measure kinetic and Intrinsic solubility
pH
0.0
0.5
1.0
0 2 4 6 8 10 12 14
Mol
es o
f bo
und
H+
ions
pe
r m
ole
of s
ampl
e Precipitation detected at pH 9.07 (Kinetic point)
While chasing equilibrium, all data
points fall on the Equilibrium
Precipitation Graph
Equilibrium Precipitation Graph
Kinetic Precipitation
Graph
© 2007/ 4810
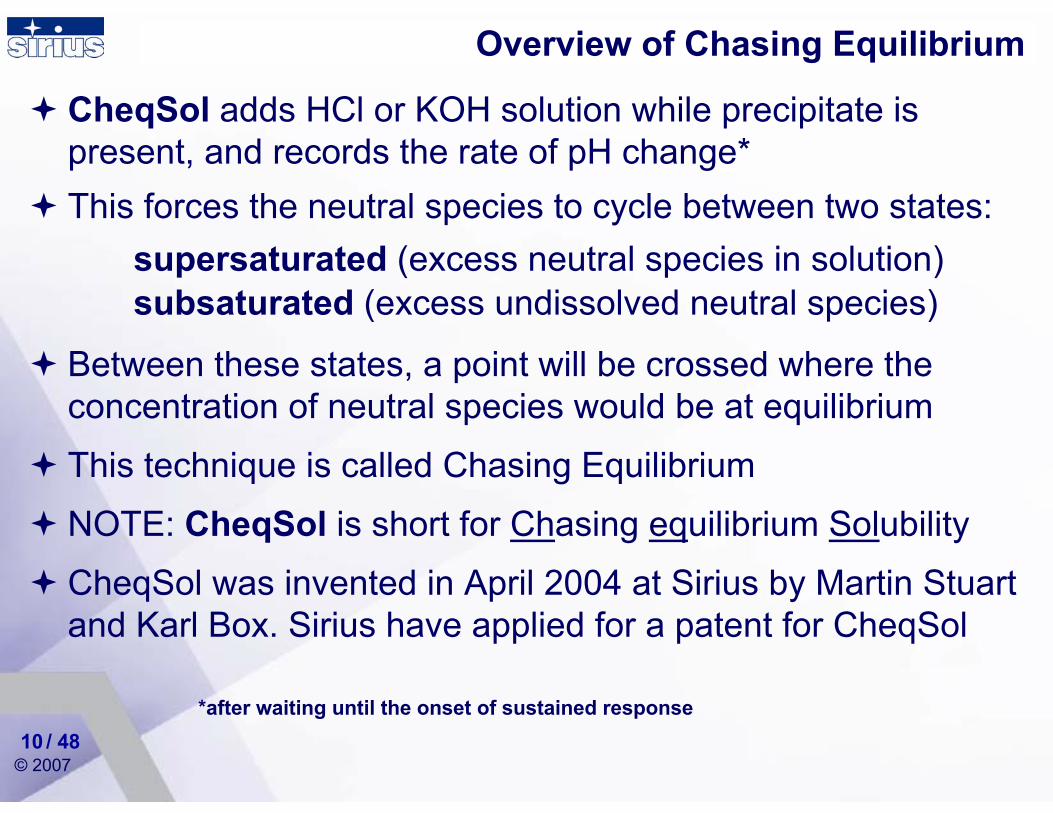
Overview of Chasing Equilibrium
CheqSol adds HCl or KOH solution while precipitate is present, and records the rate of pH change*
*after waiting until the onset of sustained response
This forces the neutral species to cycle between two states:
Between these states, a point will be crossed where the concentration of neutral species would be at equilibrium
This technique is called Chasing Equilibrium
NOTE: CheqSol is short for Chasing equilibrium Solubility
CheqSol was invented in April 2004 at Sirius by Martin Stuart and Karl Box. Sirius have applied for a patent for CheqSol
supersaturated (excess neutral species in solution)subsaturated (excess undissolved neutral species)
© 2007/ 4811
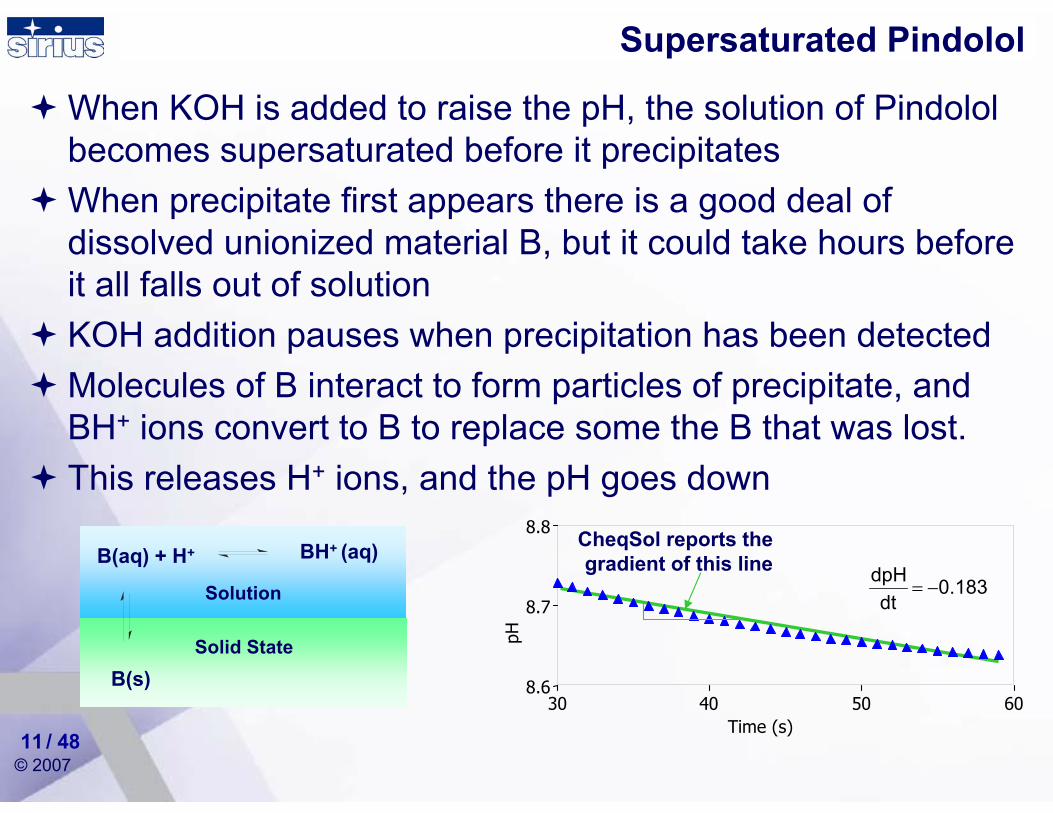
When KOH is added to raise the pH, the solution of Pindolol becomes supersaturated before it precipitatesWhen precipitate first appears there is a good deal of dissolved unionized material B, but it could take hours before it all falls out of solution KOH addition pauses when precipitation has been detected Molecules of B interact to form particles of precipitate, and BH+ ions convert to B to replace some the B that was lost. This releases H+ ions, and the pH goes down
Supersaturated Pindolol
B(aq) + H+
B(s)
BH+ (aq)
Solid State
Solution
CheqSol reports the gradient of this line
0.183dt
dpH−=
pH
Time (s)
8.6
8.7
8.8
30 40 50 60
© 2007/ 4812
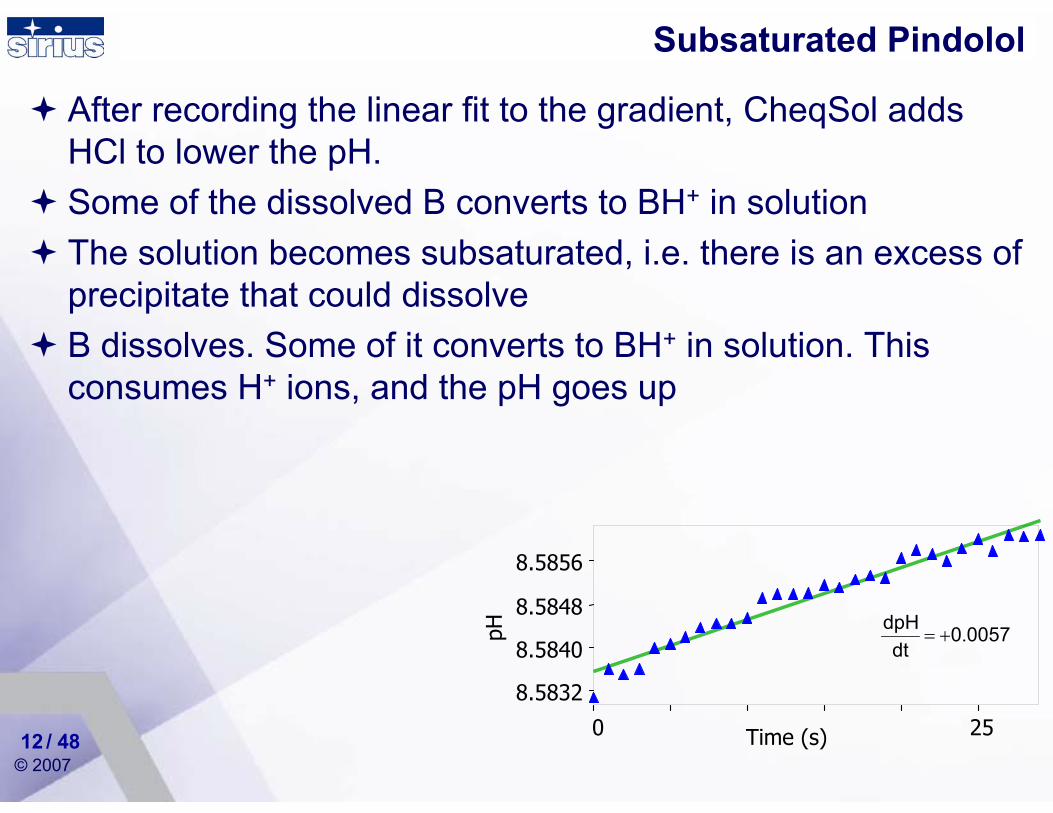
Subsaturated Pindolol
After recording the linear fit to the gradient, CheqSol adds HCl to lower the pH.Some of the dissolved B converts to BH+ in solution The solution becomes subsaturated, i.e. there is an excess of precipitate that could dissolveB dissolves. Some of it converts to BH+ in solution. This consumes H+ ions, and the pH goes up
pH
Time (s)
8.5832
8.5840
8.5848
8.5856
0 25
00570dt
dpH .+=
© 2007/ 4813
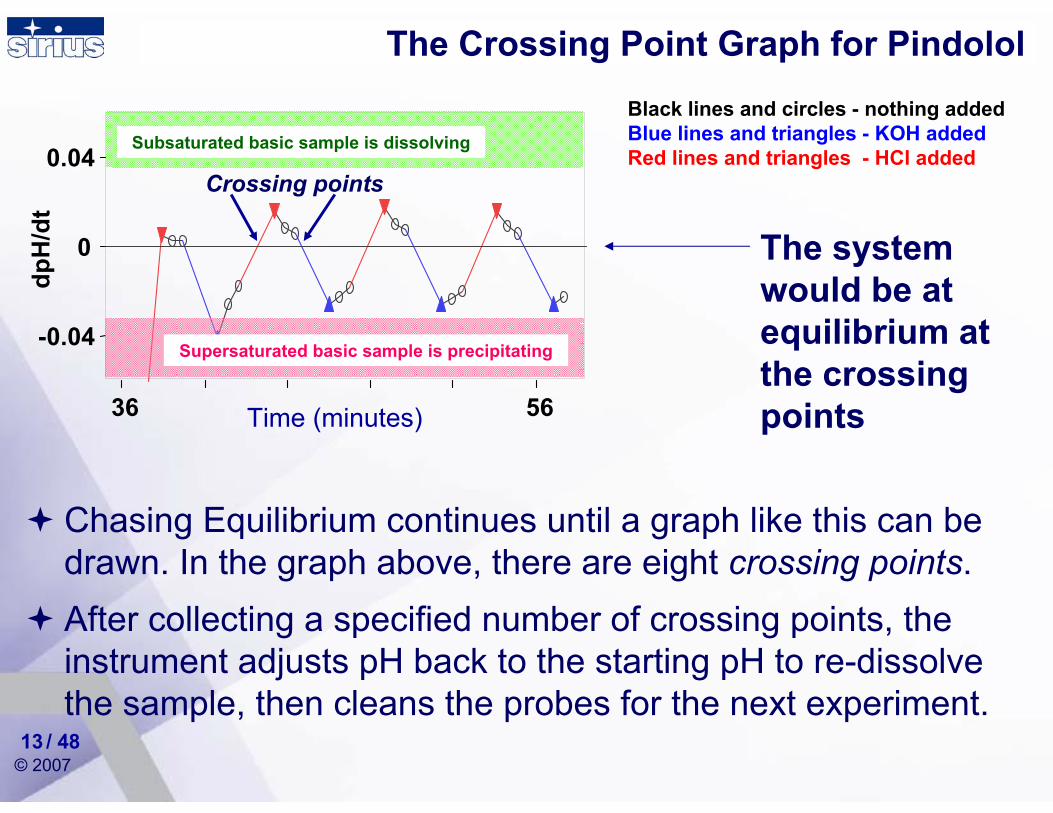
Chasing Equilibrium continues until a graph like this can be drawn. In the graph above, there are eight crossing points. After collecting a specified number of crossing points, the instrument adjusts pH back to the starting pH to re-dissolve the sample, then cleans the probes for the next experiment.
The Crossing Point Graph for Pindolol Black lines and circles - nothing addedBlue lines and triangles - KOH addedRed lines and triangles - HCl added
The system would be at equilibrium at the crossing points
dpH
/dt
-0.04
0
0.04
36 56Time (minutes)
Subsaturated basic sample is dissolving
Supersaturated basic sample is precipitating
Crossing points
© 2007/ 4814
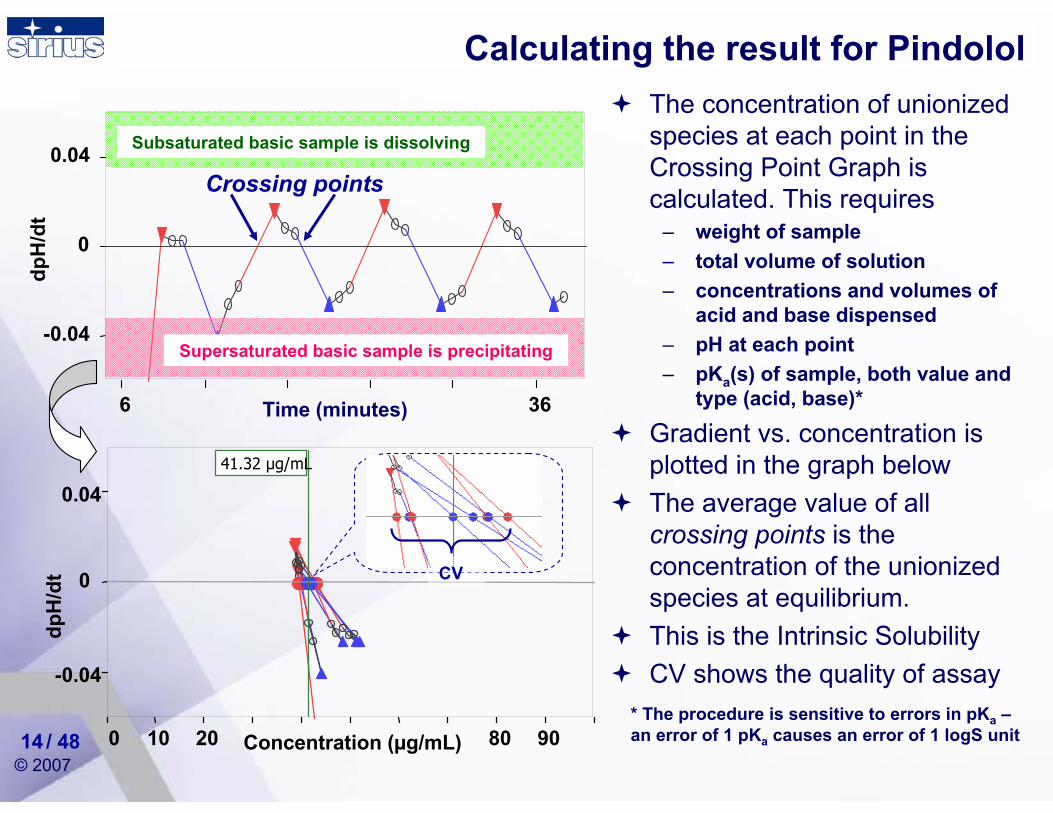
dpH
/dt
Concentration (µg/mL)
-0.04
0
0.04
0 10 20 80 90
41.32 µg/mL
dpH
/dt
-0.04
0
0.04
6 36Time (minutes)
Subsaturated basic sample is dissolving
Supersaturated basic sample is precipitating
Crossing points
The concentration of unionized species at each point in the Crossing Point Graph is calculated. This requires
– weight of sample– total volume of solution– concentrations and volumes of
acid and base dispensed– pH at each point– pKa(s) of sample, both value and
type (acid, base)*
Gradient vs. concentration is plotted in the graph belowThe average value of all crossing points is the concentration of the unionized species at equilibrium. This is the Intrinsic SolubilityCV shows the quality of assay
Calculating the result for Pindolol
CV
* The procedure is sensitive to errors in pKa –an error of 1 pKa causes an error of 1 logS unit
© 2007/ 4815
Pindolol is a chaser
Pindolol is a chaser because its kinetic solubility is significantly higher than its Intrinsic solubilityThe neutral species of Pindolol forms a supersaturated aqueous solutionIt precipitates slowly, and would take a long time for all the substance to precipitate at a given pH
© 2007
Everything a “Chaser”?
When we initially discovered CheqSol – we thought every drug would supersaturate to some degree, and therefore “Chase Equilibrium”
Our first paper presents 6 chasers:
Stuart, M. Box, K. Chasing equilibrium: measuring the intrinsic solubility of weak acids and bases. Anal. Chem. 2005 (77(4)) pp 983-990
/ 4816
© 2007/ 4817
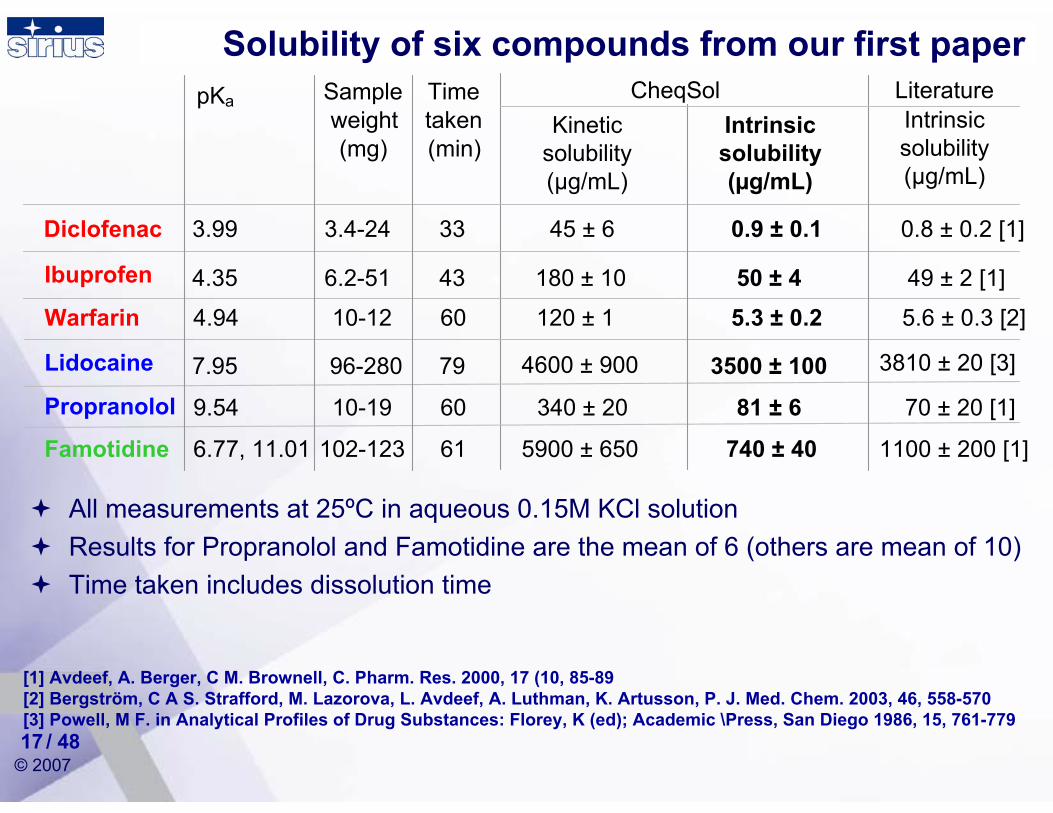
Solubility of six compounds from our first paperpKa Sample
weight (mg)
Time taken (min)
Kinetic solubility (µg/mL)
Intrinsic solubility (µg/mL)
33 45 ± 6 0.9 ± 0.1 0.8 ± 0.2 [1]
43 180 ± 10 50 ± 4 49 ± 2 [1]
79 4600 ± 900 3500 ± 100 3810 ± 20 [3]Lidocaine 7.95 96-280
3.4-24
Ibuprofen 4.35 6.2-51
Diclofenac 3.99
CheqSolIntrinsic solubility (µg/mL)
Literature
All measurements at 25ºC in aqueous 0.15M KCl solutionResults for Propranolol and Famotidine are the mean of 6 (others are mean of 10)Time taken includes dissolution time
61 5900 ± 650 740 ± 40 1100 ± 200 [1]
60 120 ± 1 5.3 ± 0.2 5.6 ± 0.3 [2]
60 340 ± 20 81 ± 6 70 ± 20 [1]Propranolol 9.54 10-19
102-123
Warfarin 4.94 10-12
Famotidine 6.77, 11.01
[1] Avdeef, A. Berger, C M. Brownell, C. Pharm. Res. 2000, 17 (10, 85-89[2] Bergström, C A S. Strafford, M. Lazorova, L. Avdeef, A. Luthman, K. Artusson, P. J. Med. Chem. 2003, 46, 558-570[3] Powell, M F. in Analytical Profiles of Drug Substances: Florey, K (ed); Academic \Press, San Diego 1986, 15, 761-779
© 2007
Everything a “Chaser”?
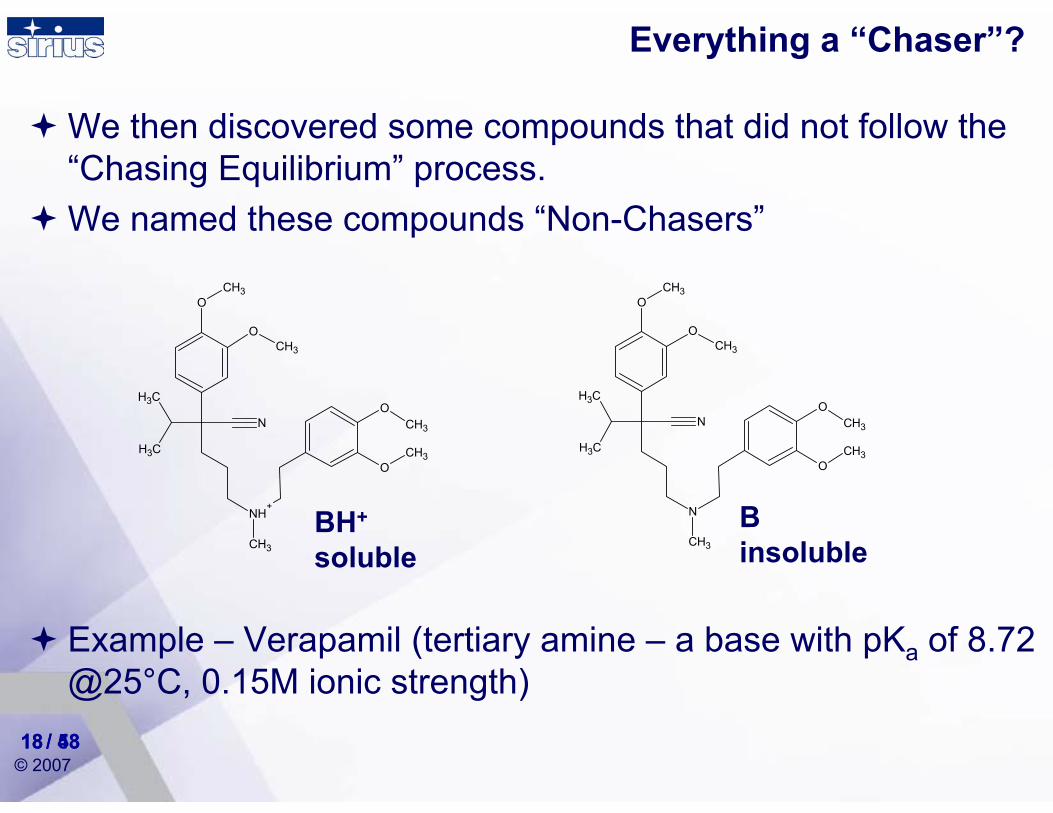
We then discovered some compounds that did not follow the “Chasing Equilibrium” process.We named these compounds “Non-Chasers”
/ 4818 / 5318
Example – Verapamil (tertiary amine – a base with pKa of 8.72 @25°C, 0.15M ionic strength)
N
NH+
O
O
O
O
CH3
CH3
CH3
CH3
CH3
CH3
CH3 N
N
O
O
O
O
CH3
CH3
CH3
CH3
CH3
CH3
CH3
BH+
solubleBinsoluble
© 2007/ 4819
Verapamil Bjerrum Curve
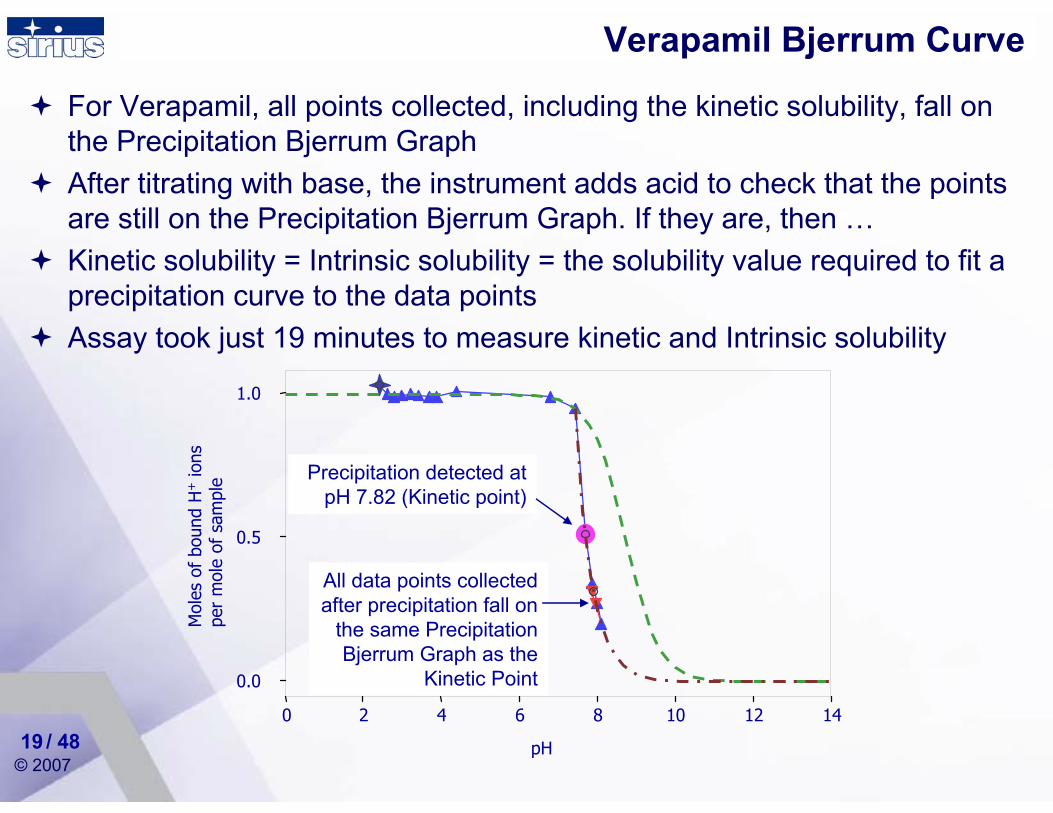
For Verapamil, all points collected, including the kinetic solubility, fall on the Precipitation Bjerrum GraphAfter titrating with base, the instrument adds acid to check that the points are still on the Precipitation Bjerrum Graph. If they are, then …Kinetic solubility = Intrinsic solubility = the solubility value required to fit a precipitation curve to the data pointsAssay took just 19 minutes to measure kinetic and Intrinsic solubility
Precipitation detected at pH 7.82 (Kinetic point)
Mol
es o
f bo
und
H+
ions
pe
r m
ole
of s
ampl
e
pH
0.0
0.5
1.0
0 2 4 6 8 10 12 14
All data points collected after precipitation fall on
the same Precipitation Bjerrum Graph as the
Kinetic Point
© 2007
Other Non-Chasers
Chlorpromazine, Imipramine, Quinine, Amitryptyline, Diphenhydramine, Nortriptyline, Desipramine, Diltiazem, Deprenyl.
Questions raised:– What determines the degree to which a compound will
supersaturate or not?– Can we predict supersaturation behaviour from structure?– Do chasers precipitate and dissolve at equal rates?
/ 4820
© 2007/ 4821
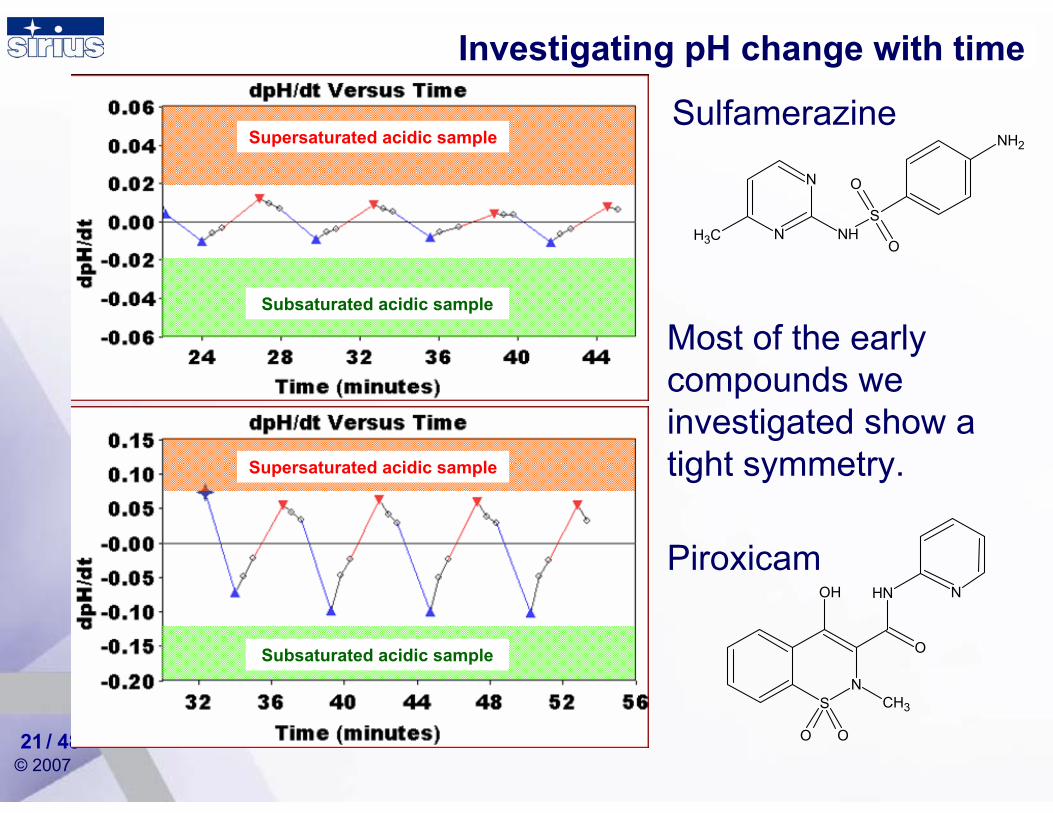
Investigating pH change with time
Piroxicam
SN
NH
O O
O
NOH
CH3
SNHN
O
O
N
NH2
CH3
SulfamerazineSupersaturated acidic sample
Subsaturated acidic sample
Subsaturated acidic sample
Supersaturated acidic sample
Most of the early compounds we investigated show a tight symmetry.
© 2007/ 4822
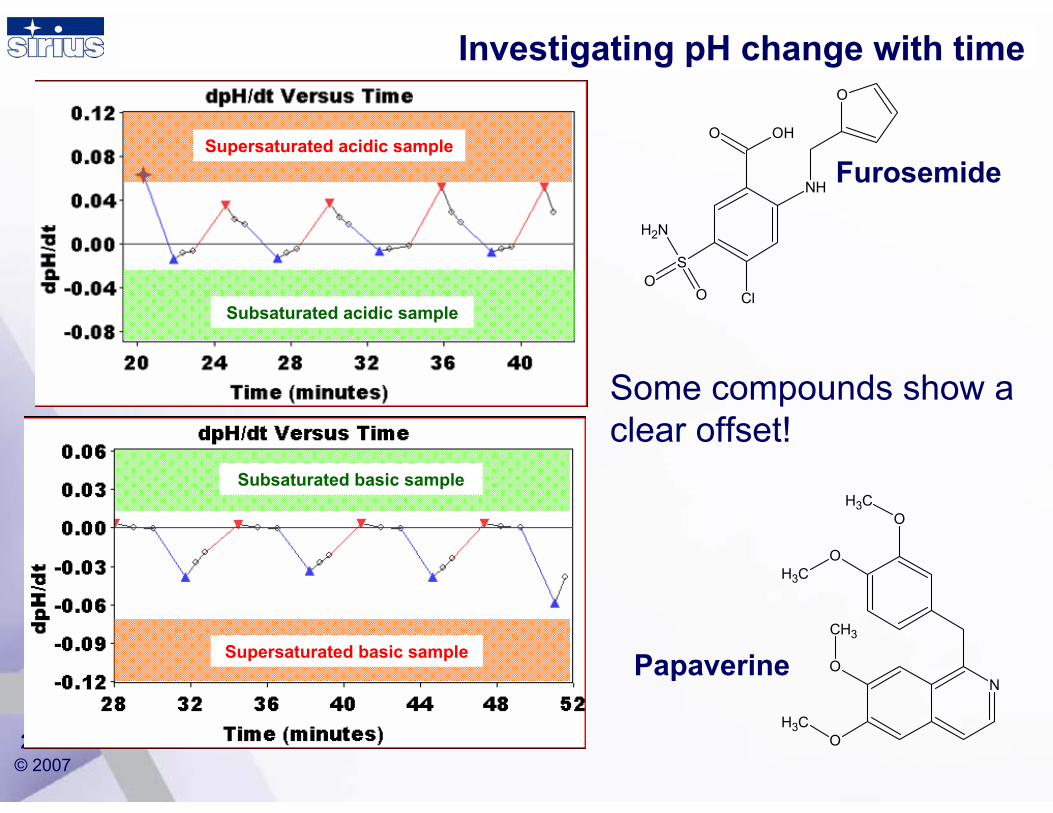
Investigating pH change with time
NO
O
O
O
CH3
CH3
CH3
CH3
Papaverine
Furosemide
S
NH
OO
O
NH2
O
Cl
OHSupersaturated acidic sample
Subsaturated acidic sample
Subsaturated basic sample
Supersaturated basic sample
Some compounds show a clear offset!
© 2007
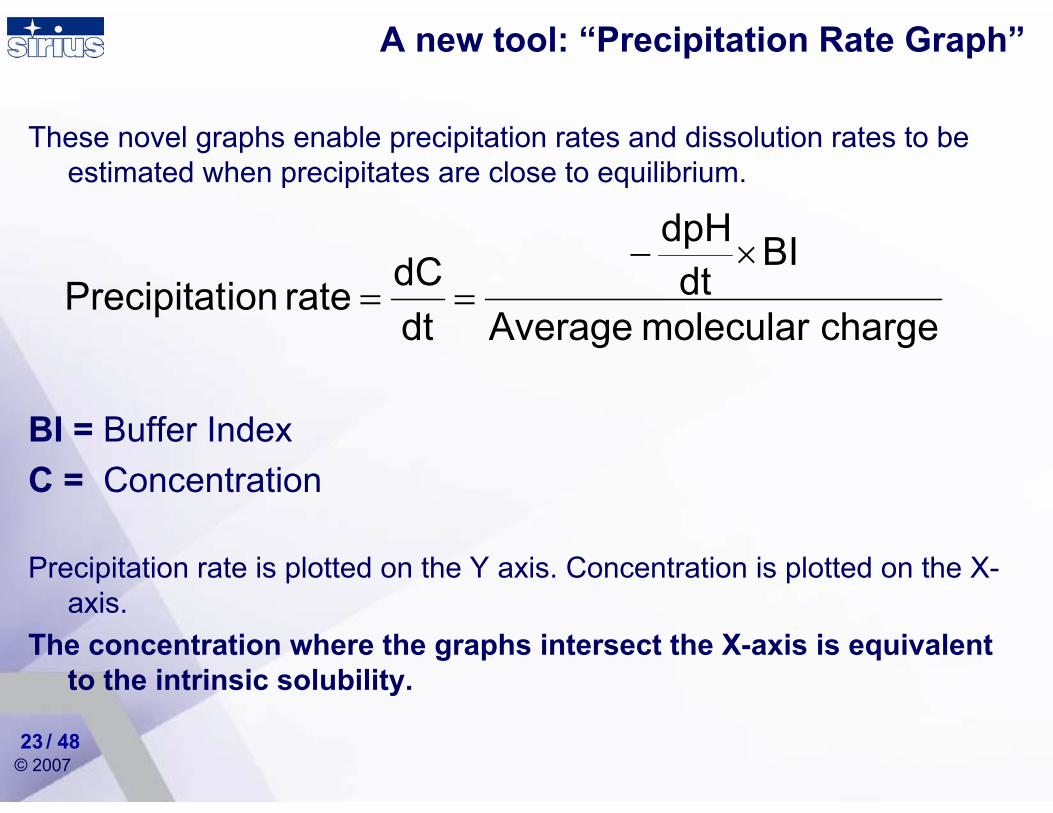
A new tool: “Precipitation Rate Graph”
These novel graphs enable precipitation rates and dissolution rates to be estimated when precipitates are close to equilibrium.
BI = Buffer IndexC = Concentration
Precipitation rate is plotted on the Y axis. Concentration is plotted on the X-axis.
The concentration where the graphs intersect the X-axis is equivalent to the intrinsic solubility.
/ 4823
charge molecular Average
BIdt
dpH
dtdC rate ionPrecipitat
×−==
© 2007
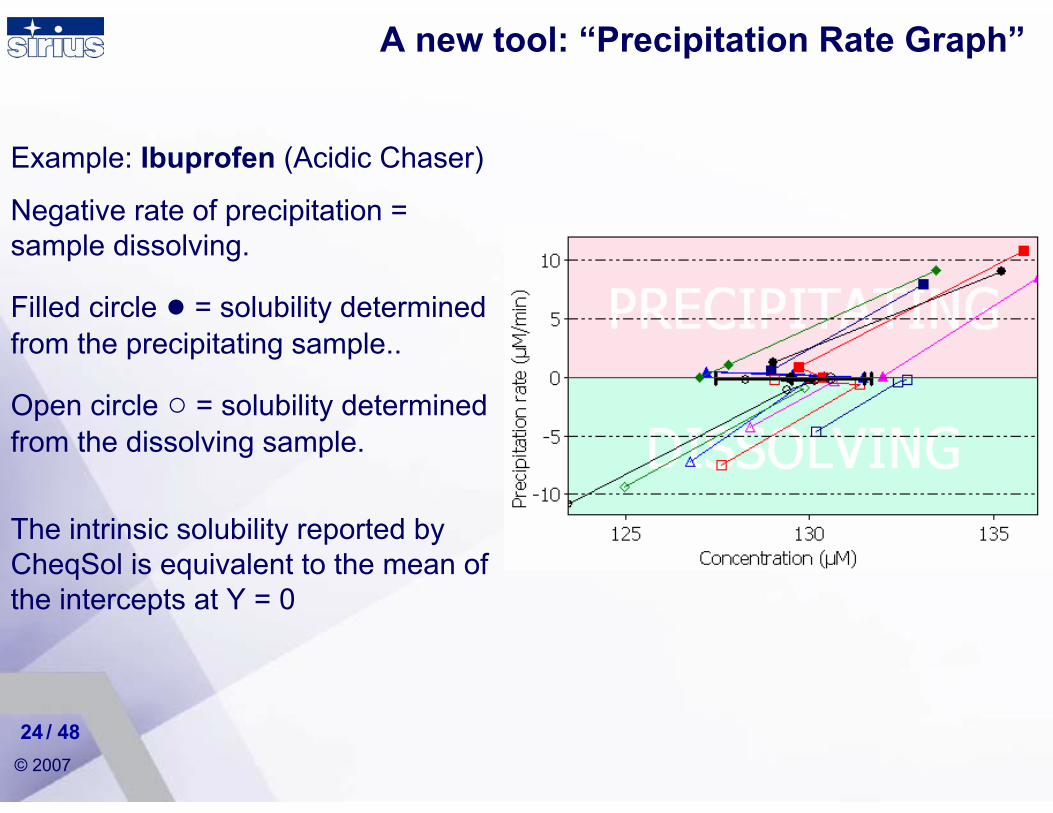
A new tool: “Precipitation Rate Graph”
/ 4824
Example: Ibuprofen (Acidic Chaser)
Negative rate of precipitation = sample dissolving.
Filled circle ● = solubility determined from the precipitating sample..
Open circle ○ = solubility determined from the dissolving sample.
The intrinsic solubility reported by CheqSol is equivalent to the mean of the intercepts at Y = 0
© 2007
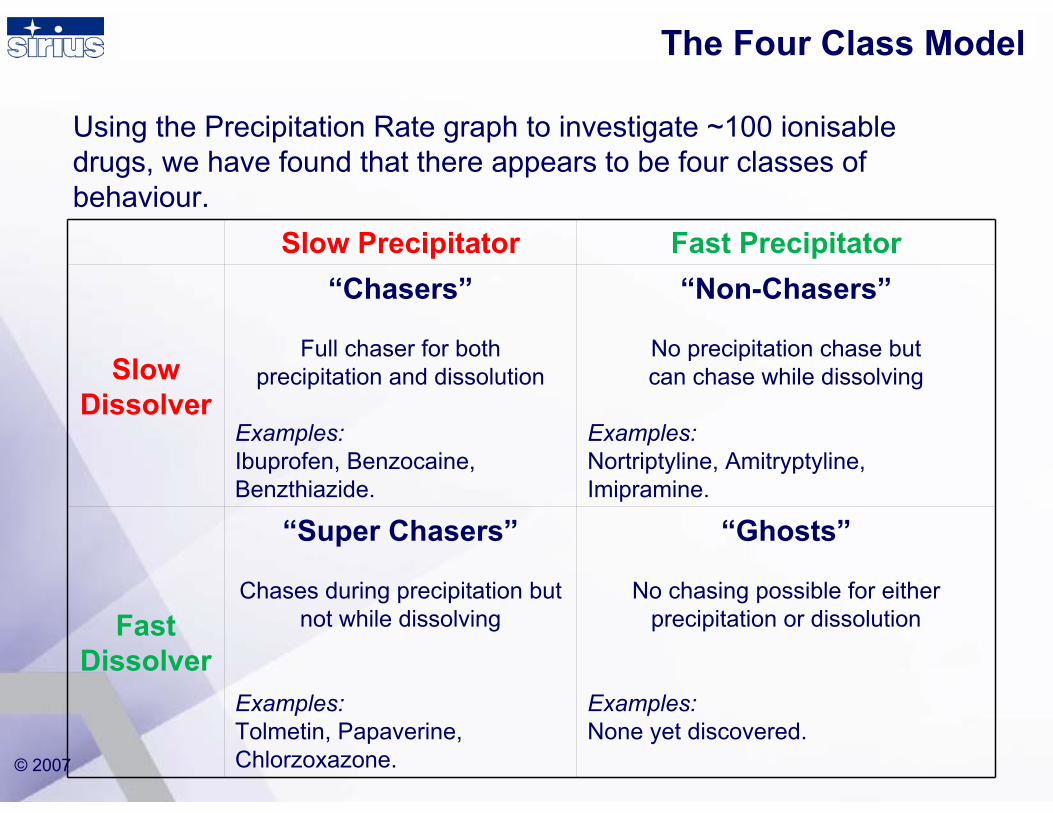
Using the Precipitation Rate graph to investigate ~100 ionisabledrugs, we have found that there appears to be four classes of behaviour.
Slow Precipitator Fast Precipitator
Slow Dissolver
“Chasers”
Full chaser for bothprecipitation and dissolution
Examples:Ibuprofen, Benzocaine, Benzthiazide.
“Non-Chasers”
No precipitation chase butcan chase while dissolving
Examples:Nortriptyline, Amitryptyline, Imipramine.
Fast Dissolver
“Super Chasers”
Chases during precipitation but not while dissolving
Examples:Tolmetin, Papaverine, Chlorzoxazone.
“Ghosts”
No chasing possible for eitherprecipitation or dissolution
Examples:None yet discovered.
The Four Class Model
© 2007
Precipitation Rate Graph: Chaser
/ 4826
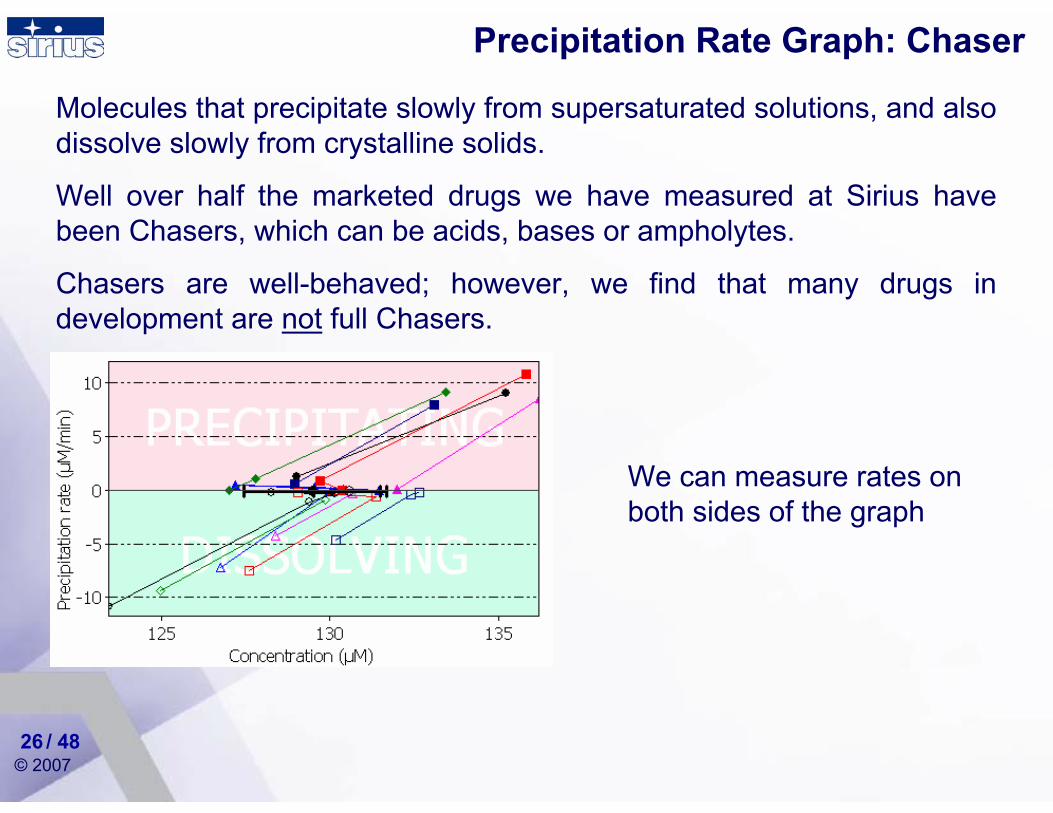
Molecules that precipitate slowly from supersaturated solutions, and also dissolve slowly from crystalline solids.
Well over half the marketed drugs we have measured at Sirius have been Chasers, which can be acids, bases or ampholytes.
Chasers are well-behaved; however, we find that many drugs in development are not full Chasers.
We can measure rates on both sides of the graph
© 2007
Precipitation Rate Graph: Non Chaser
/ 4827
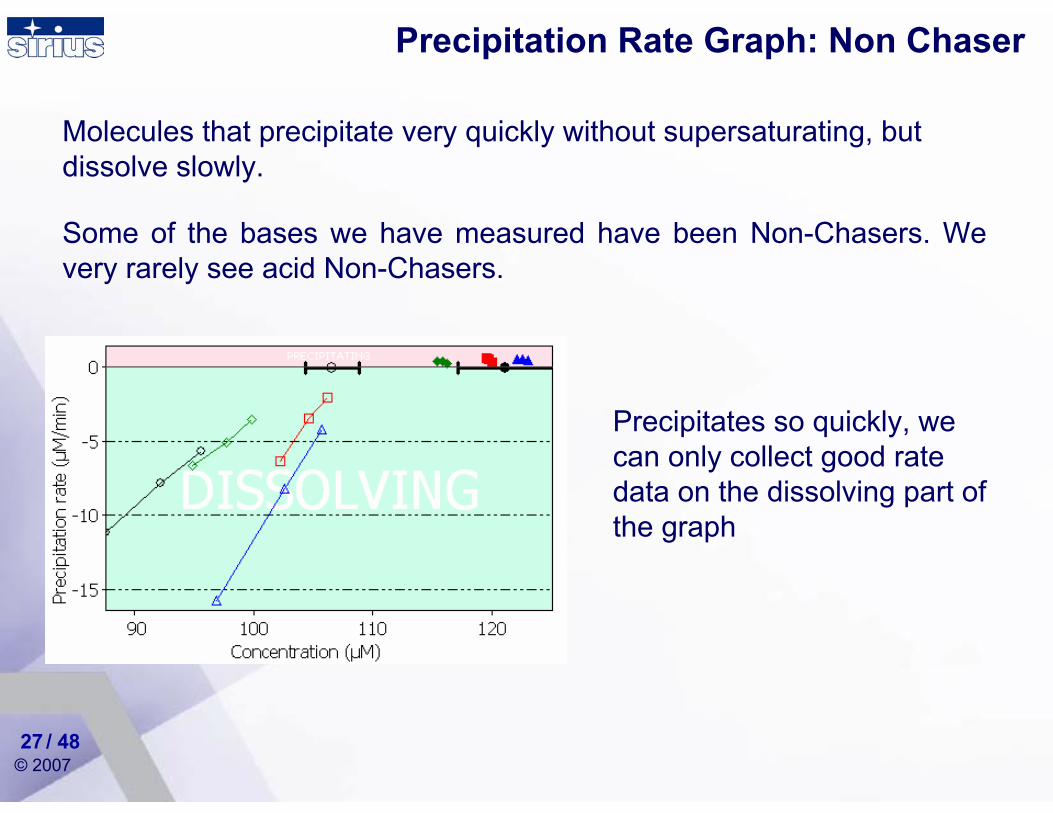
Molecules that precipitate very quickly without supersaturating, but dissolve slowly.
Some of the bases we have measured have been Non-Chasers. We very rarely see acid Non-Chasers.
Precipitates so quickly, we can only collect good rate data on the dissolving part of the graph
© 2007
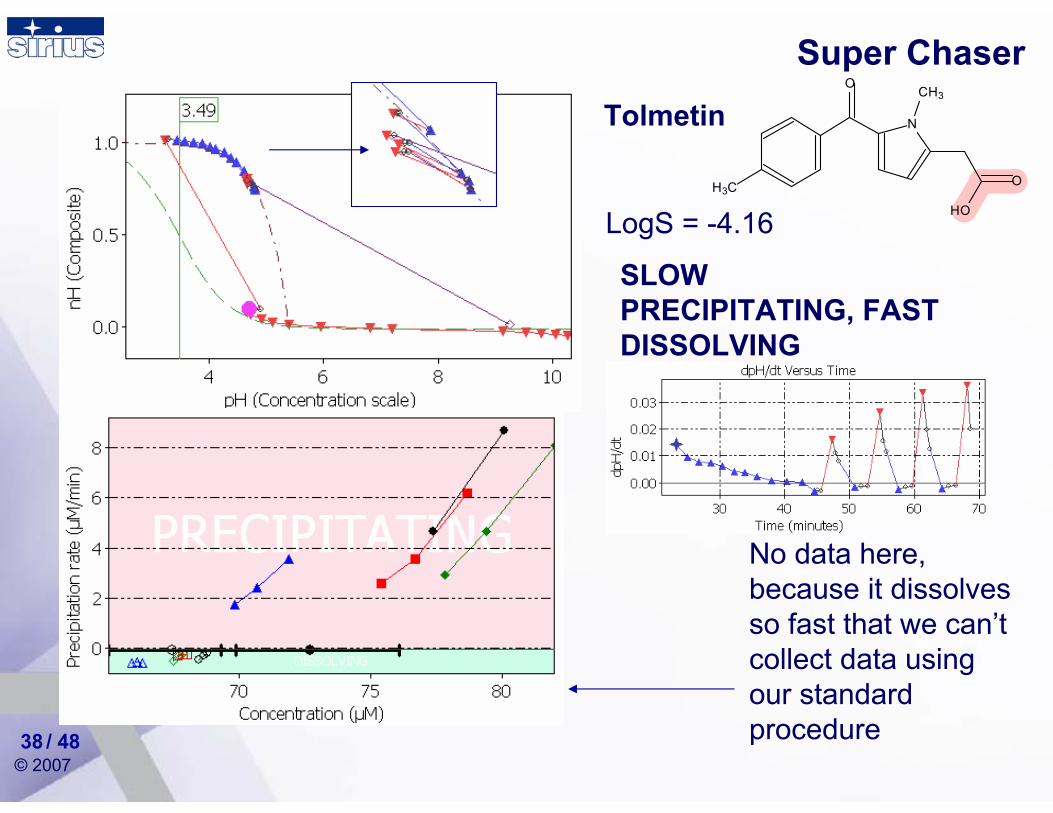
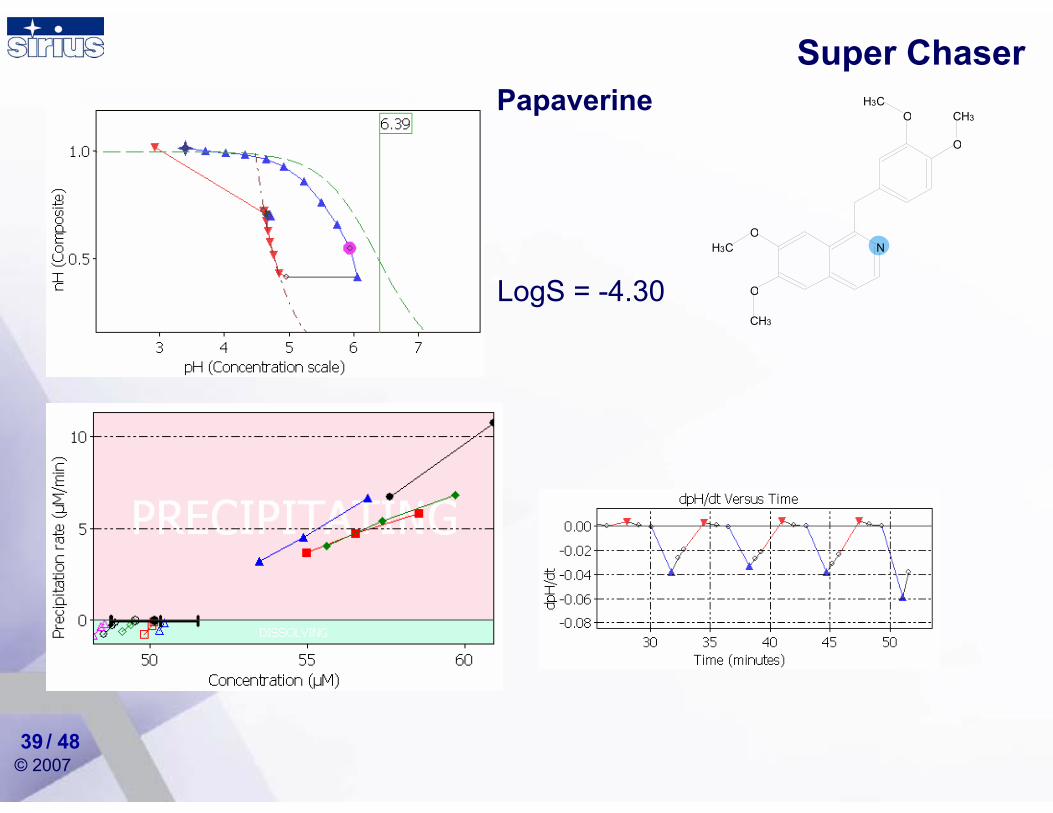
Precipitation Rate Graph: Super-Chasers
/ 4828
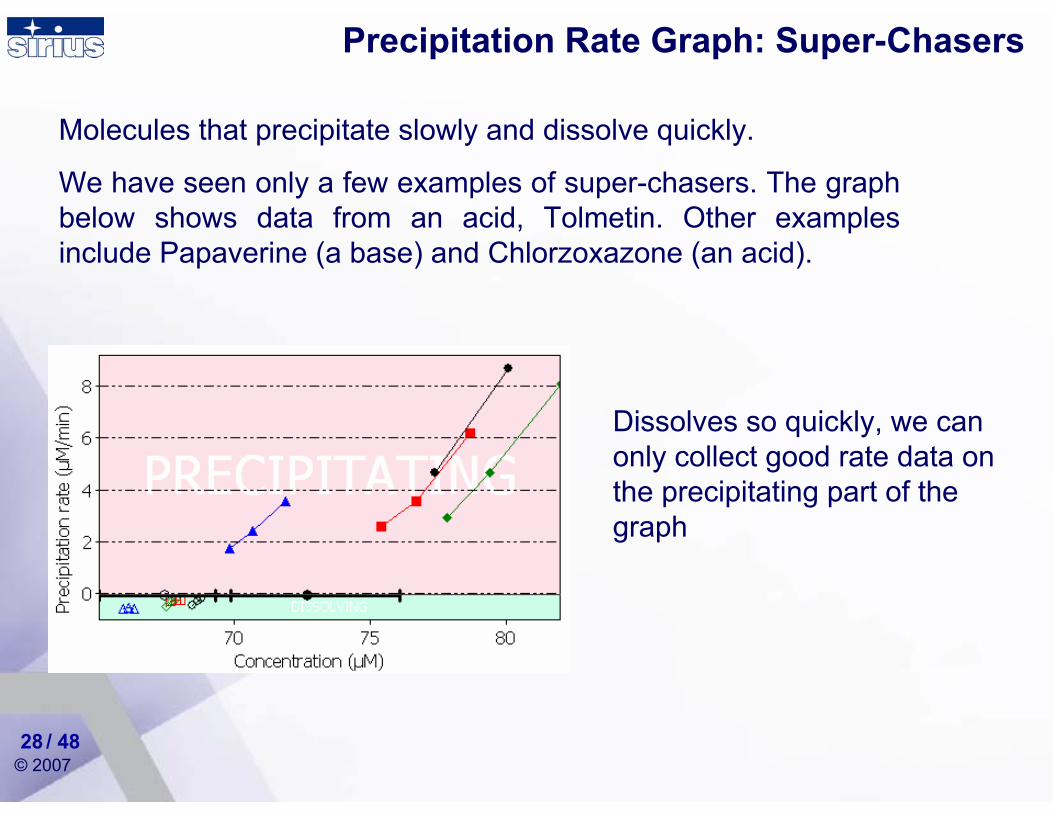
Molecules that precipitate slowly and dissolve quickly.
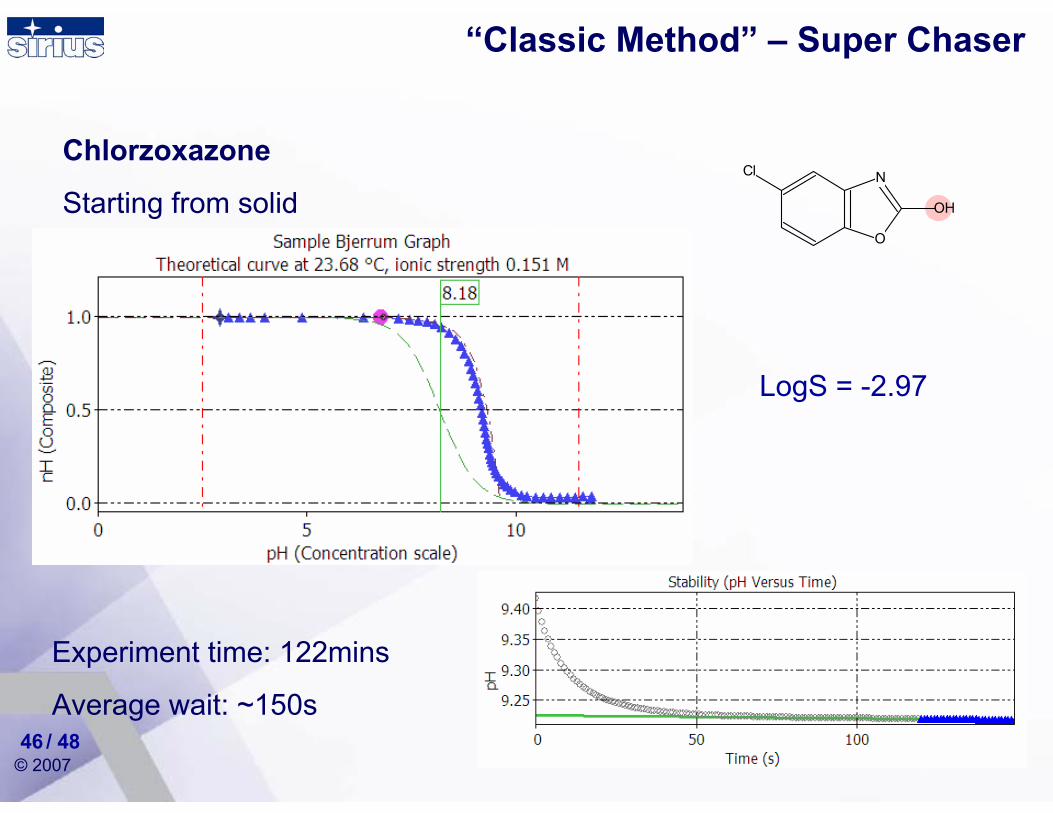
We have seen only a few examples of super-chasers. The graph below shows data from an acid, Tolmetin. Other examples include Papaverine (a base) and Chlorzoxazone (an acid).
Dissolves so quickly, we can only collect good rate data on the precipitating part of the graph
© 2007
Ghosts
/ 4829
Molecules that precipitate very quickly and dissolve very quickly.
We postulate the existence of this class of molecule, but we have never seen a drug that shows this behaviour.
We would be able to measure its solubility by the same method we use to measure Non-Chasers.
Data collection would be very fast, and all the data points would fall on the precipitation Bjerrum Curve, both for titration with KOH and with HCl.
© 2007/ 4830
Examples of drugs classified by the Four-Class model
© 2007
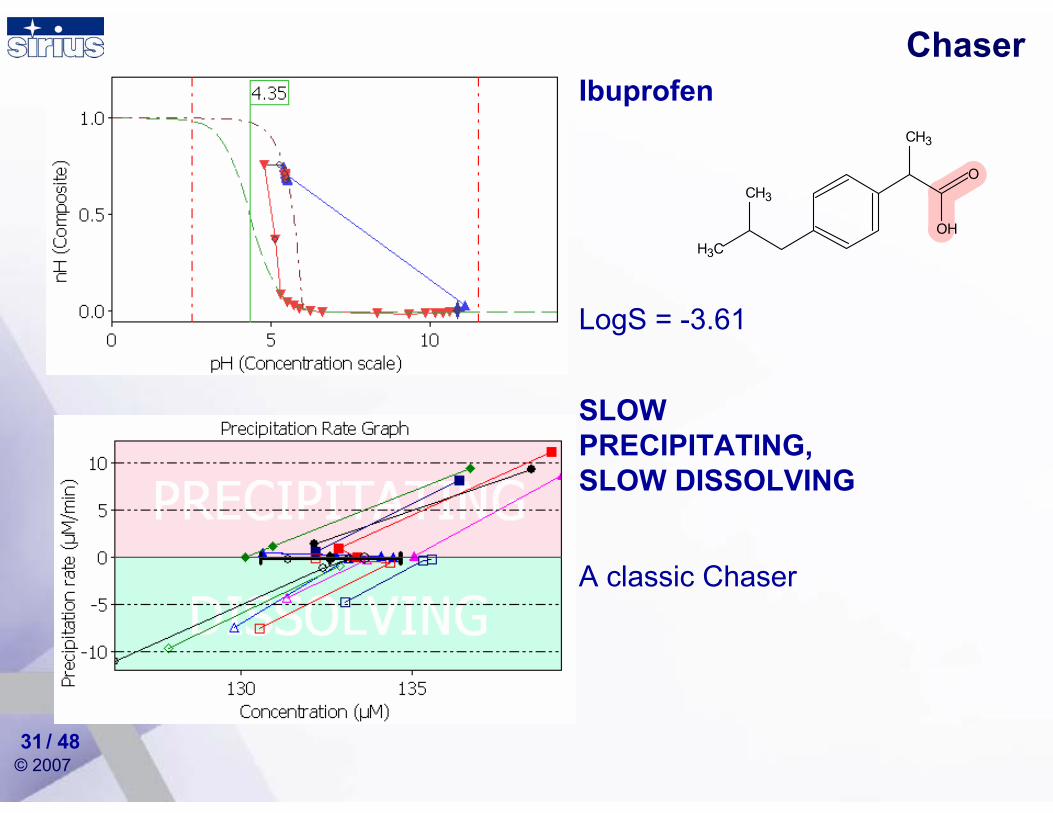
Ibuprofen
LogS = -3.61
SLOW PRECIPITATING, SLOW DISSOLVING
A classic Chaser
O
OH
CH3
C3H
CH3
31 / 48
Chaser
© 2007
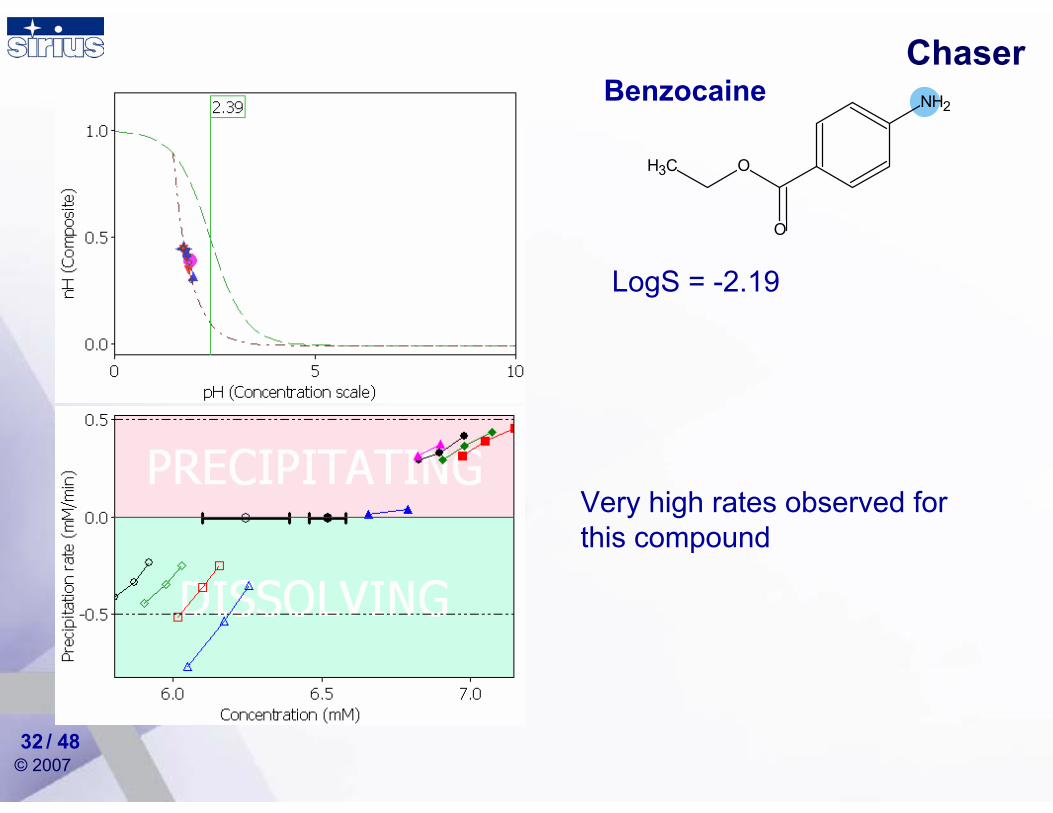
Benzocaine
LogS = -2.19
O
O
NH2
C3H
32 / 48
Chaser
Very high rates observed for this compound
© 2007
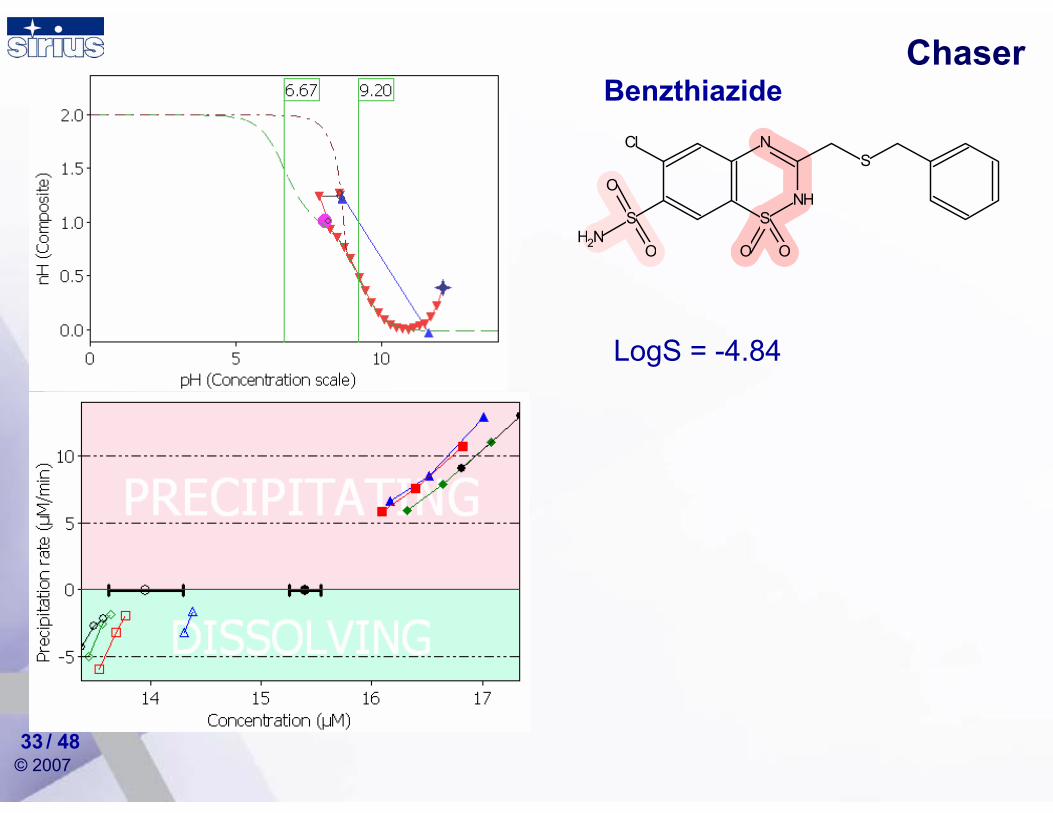
Benzthiazide
LogS = -4.84
SNH
S
N
OO
O
ON2H
SCl
33 / 48
Chaser
© 2007/ 4834
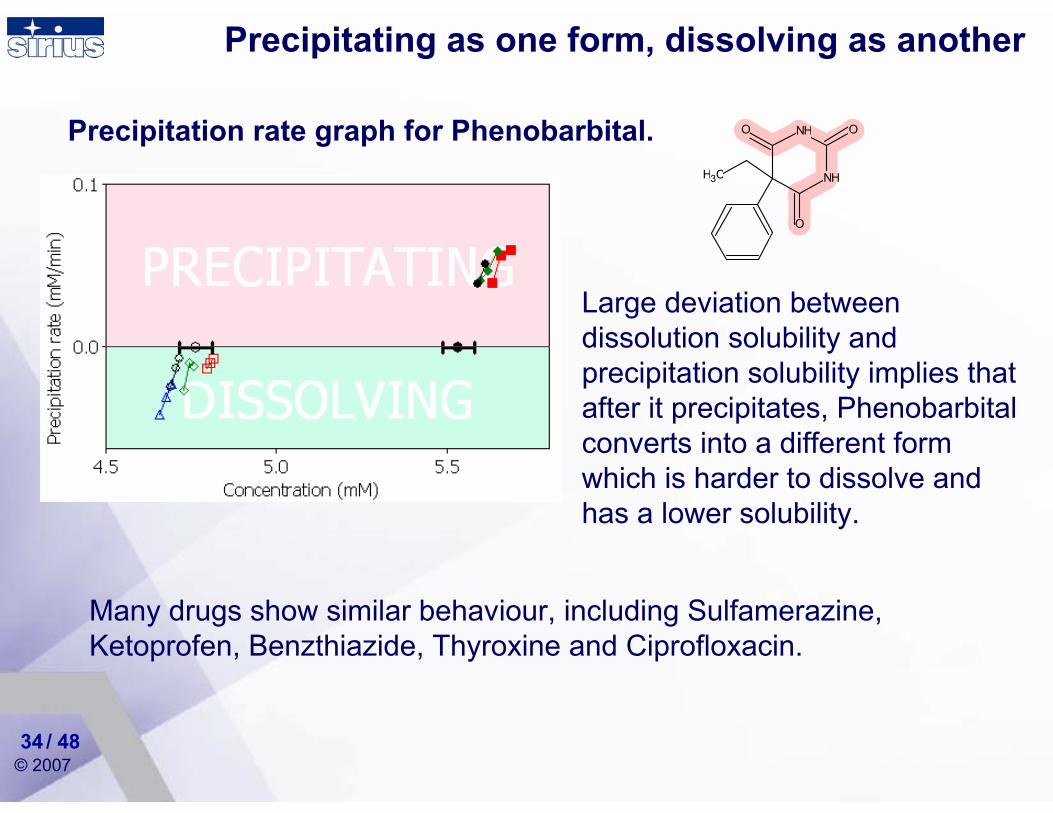
Large deviation between dissolution solubility and precipitation solubility implies that after it precipitates, Phenobarbital converts into a different form which is harder to dissolve and has a lower solubility.
Precipitation rate graph for Phenobarbital.
Many drugs show similar behaviour, including Sulfamerazine, Ketoprofen, Benzthiazide, Thyroxine and Ciprofloxacin.
NH
NHO
O
O
C3H
Precipitating as one form, dissolving as another
© 2007
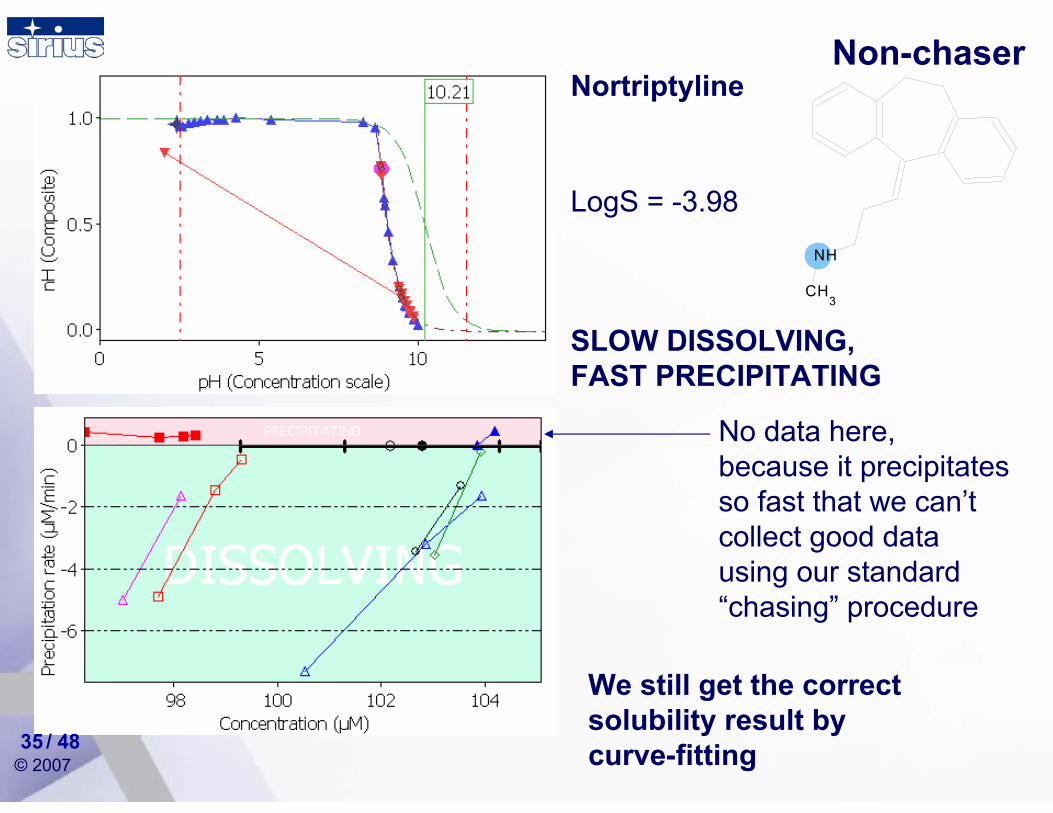
Nortriptyline
LogS = -3.98
No data here, because it precipitates so fast that we can’t collect good data using our standard “chasing” procedure
SLOW DISSOLVING, FAST PRECIPITATING
NH
CH3
35 / 48
Non-chaser
We still get the correct solubility result by curve-fitting
© 2007
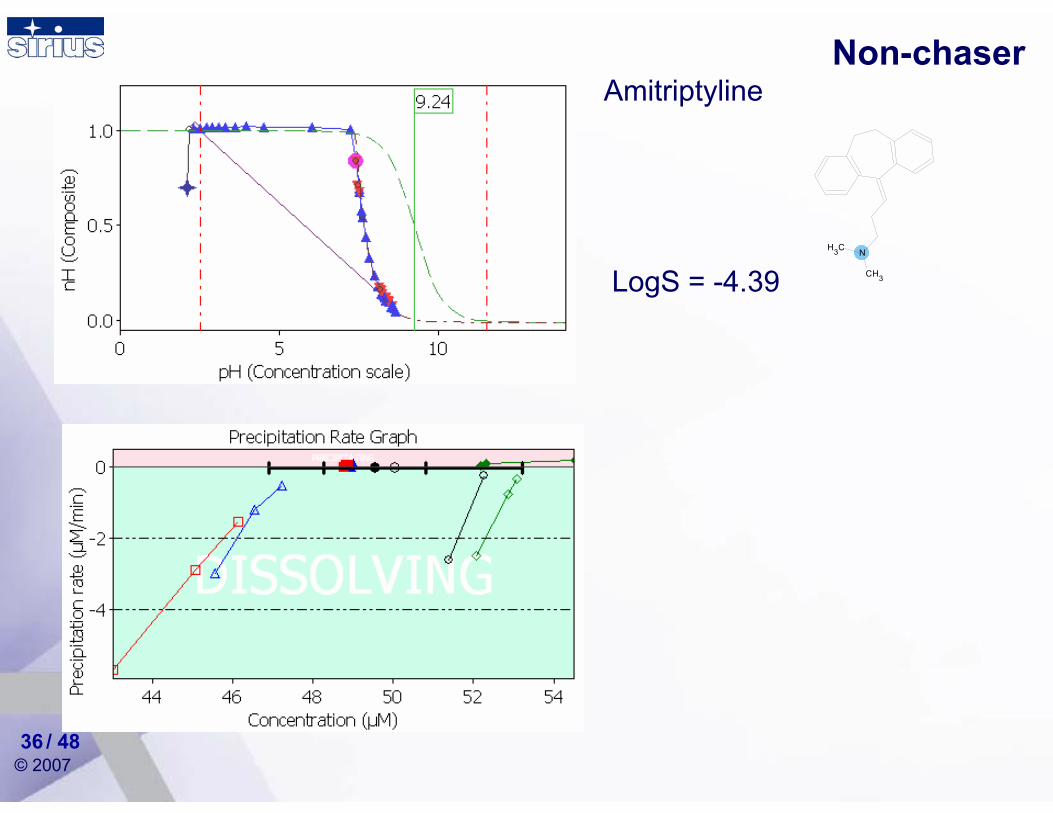
Amitriptyline
LogS = -4.39
Non-chaser
NC3H
CH3
36 / 48
© 2007
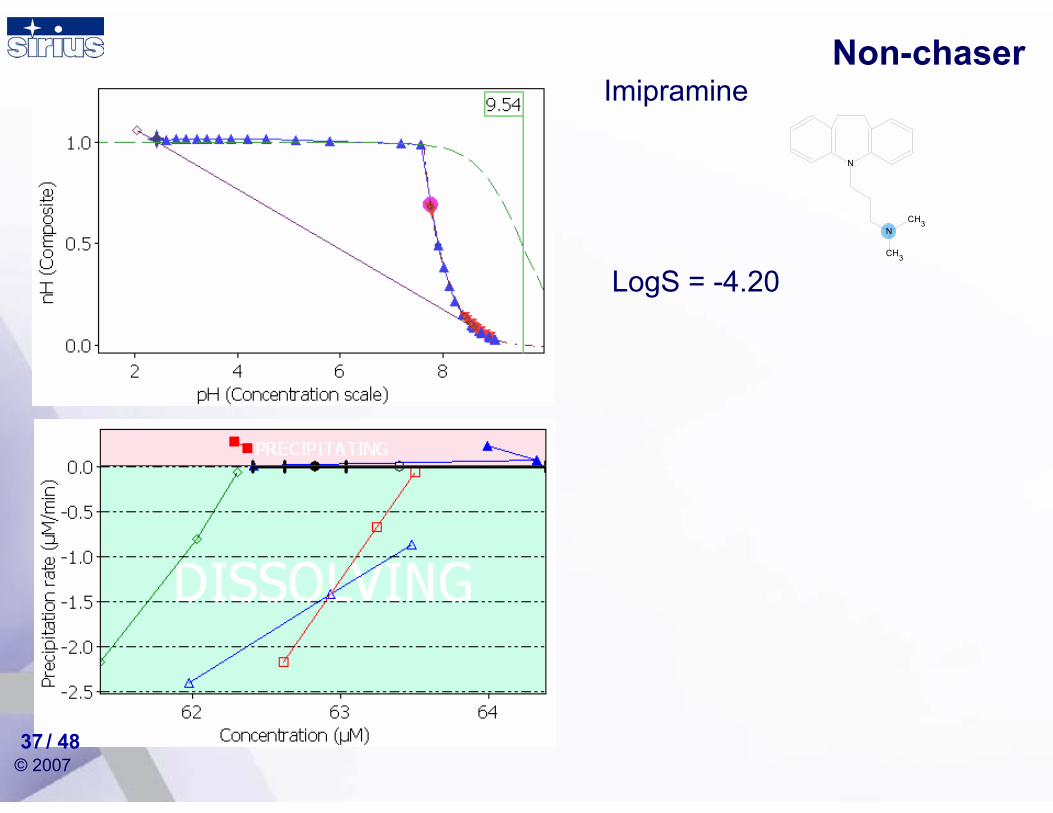
Imipramine
LogS = -4.20
Non-chaser
N
N
CH3
CH3
37 / 48
© 2007
Tolmetin
LogS = -4.16
No data here, because it dissolves so fast that we can’t collect data using our standard procedure
SLOW PRECIPITATING, FAST DISSOLVING
N
O
O
CH3
OH
C3H
38 / 48
Super Chaser
© 2007
Papaverine
LogS = -4.30
NO
O
O
O
C3H
CH3
C3HCH3
39 / 48
Super Chaser
© 2007
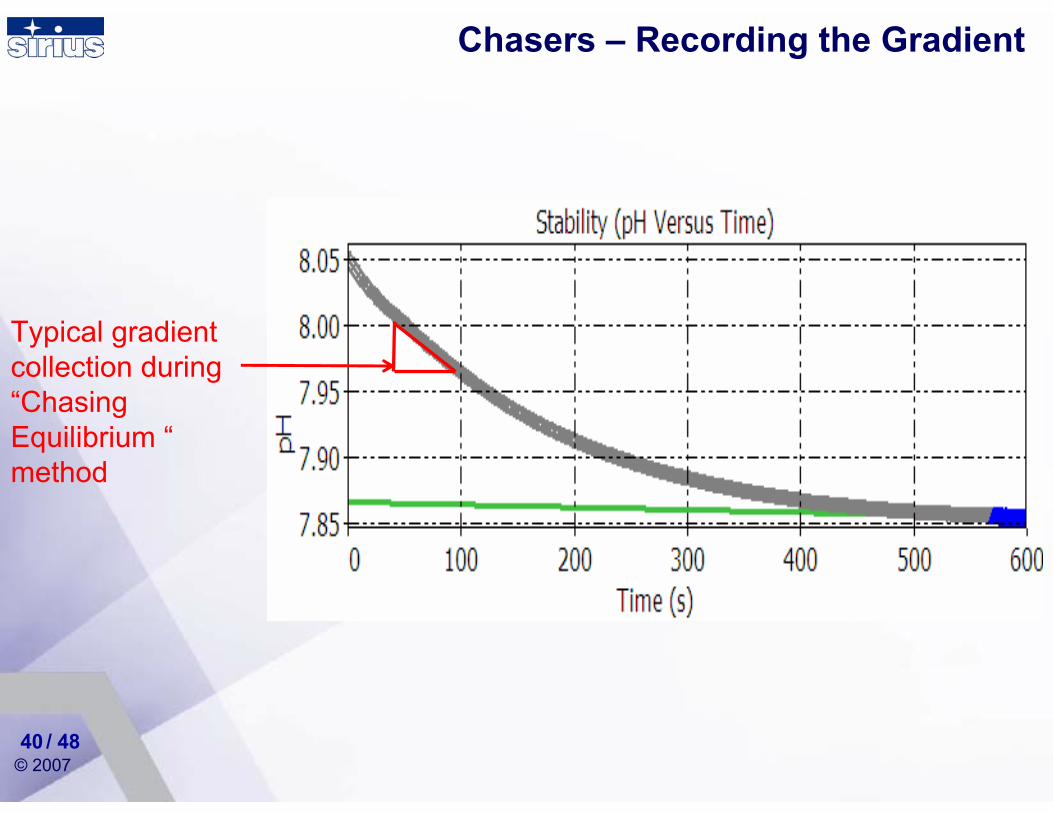
Chasers – Recording the Gradient
/ 4840
Typical gradient collection during “Chasing Equilibrium “method
© 2007
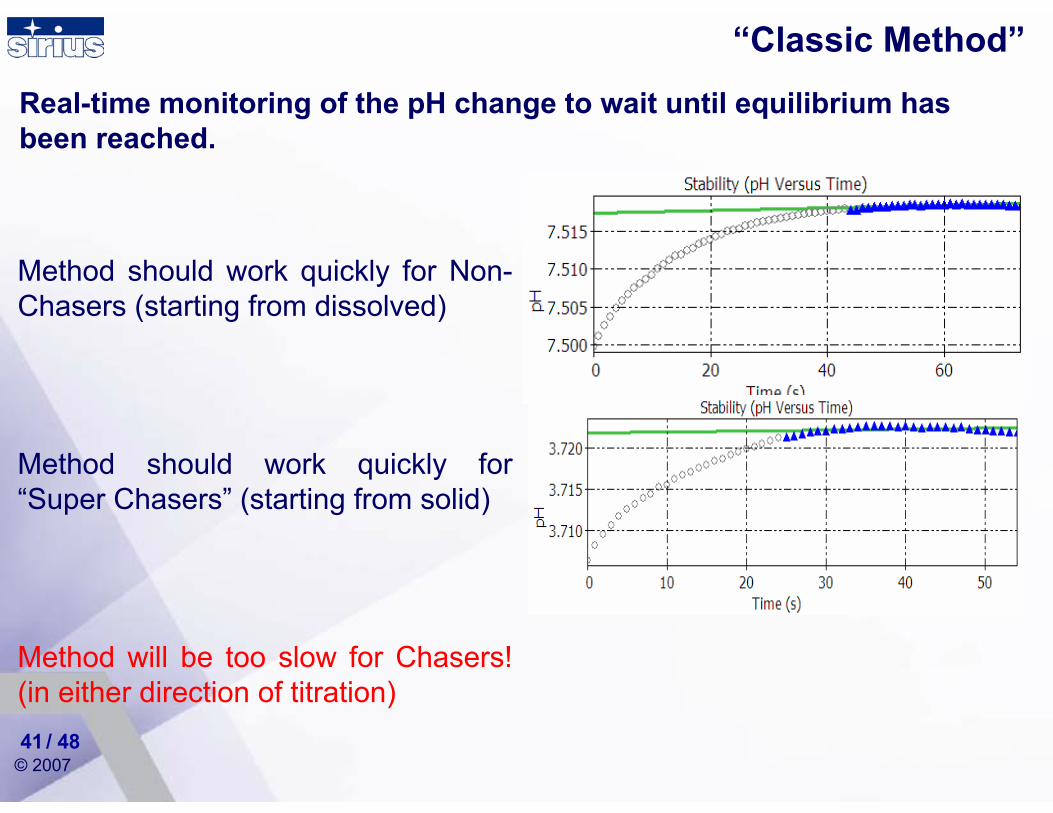
“Classic Method”
/ 4841
Method should work quickly for Non-Chasers (starting from dissolved)
Method should work quickly for “Super Chasers” (starting from solid)
Method will be too slow for Chasers! (in either direction of titration)
Real-time monitoring of the pH change to wait until equilibrium has been reached.
© 2007
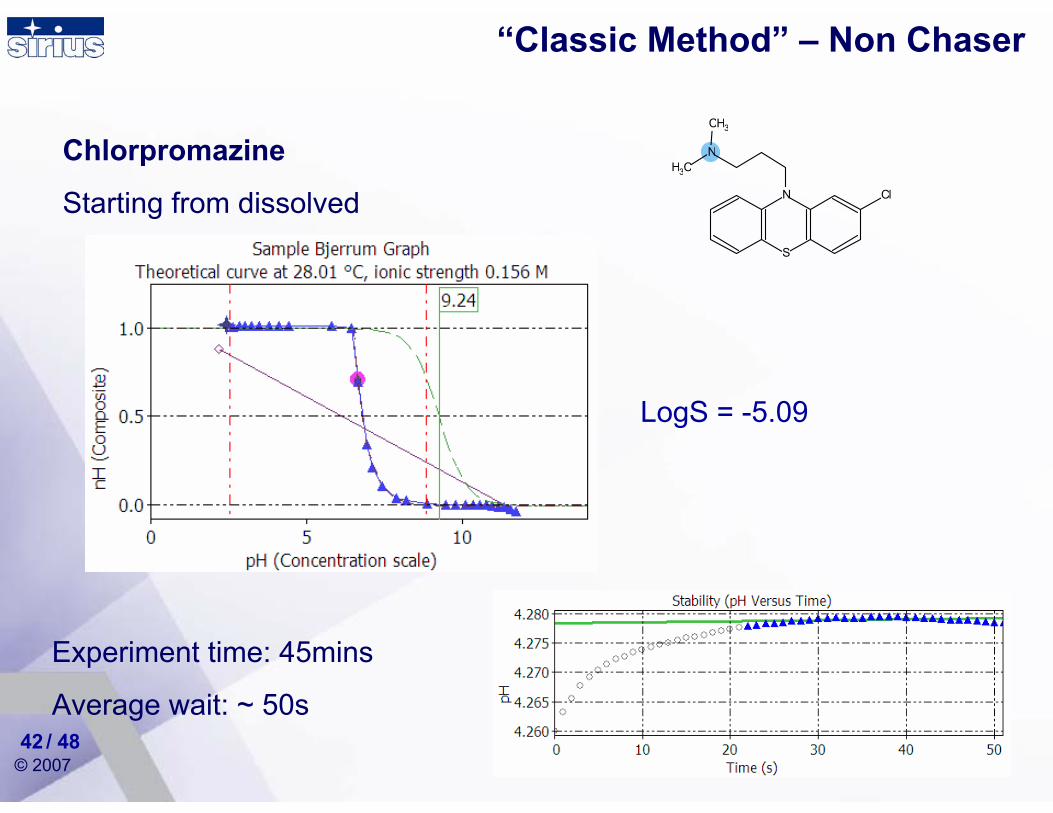
“Classic Method” – Non Chaser
/ 4842
Chlorpromazine
Starting from dissolved N
S
N
Cl
CH3
C3H
Experiment time: 45mins
Average wait: ~ 50s
LogS = -5.09
© 2007
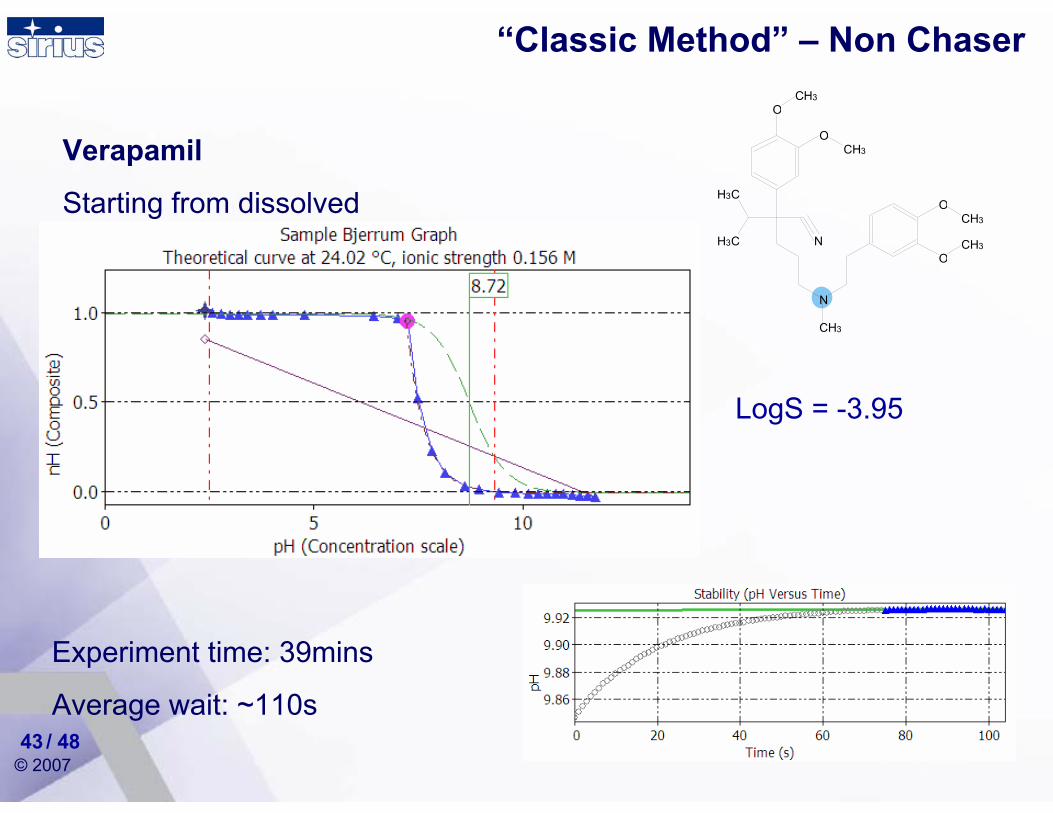
“Classic Method” – Non Chaser
/ 4843
Verapamil
Starting from dissolved
Experiment time: 39mins
Average wait: ~110s
LogS = -3.95
N
N
O
O
O
O
CH3
C3H
C3H
CH3
CH3
CH3
CH3
© 2007
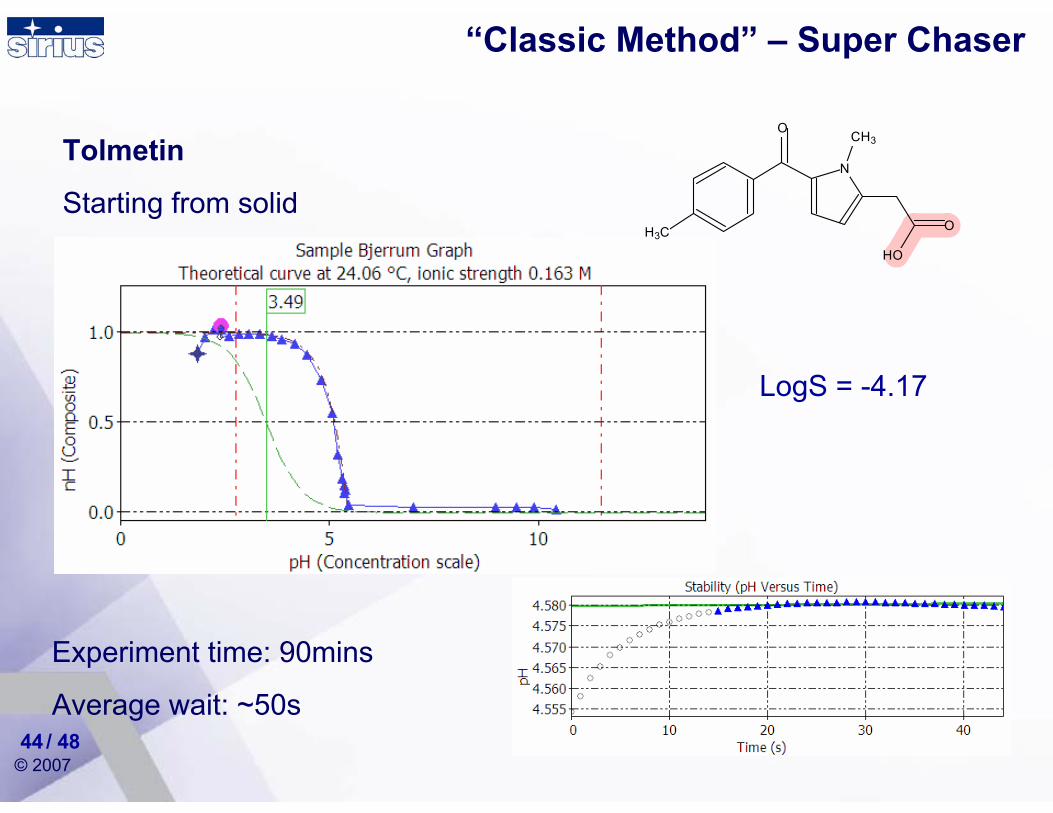
“Classic Method” – Super Chaser
/ 4844
Tolmetin
Starting from solidN
O
O
CH3
OH
C3H
Experiment time: 90mins
Average wait: ~50s
LogS = -4.17
© 2007
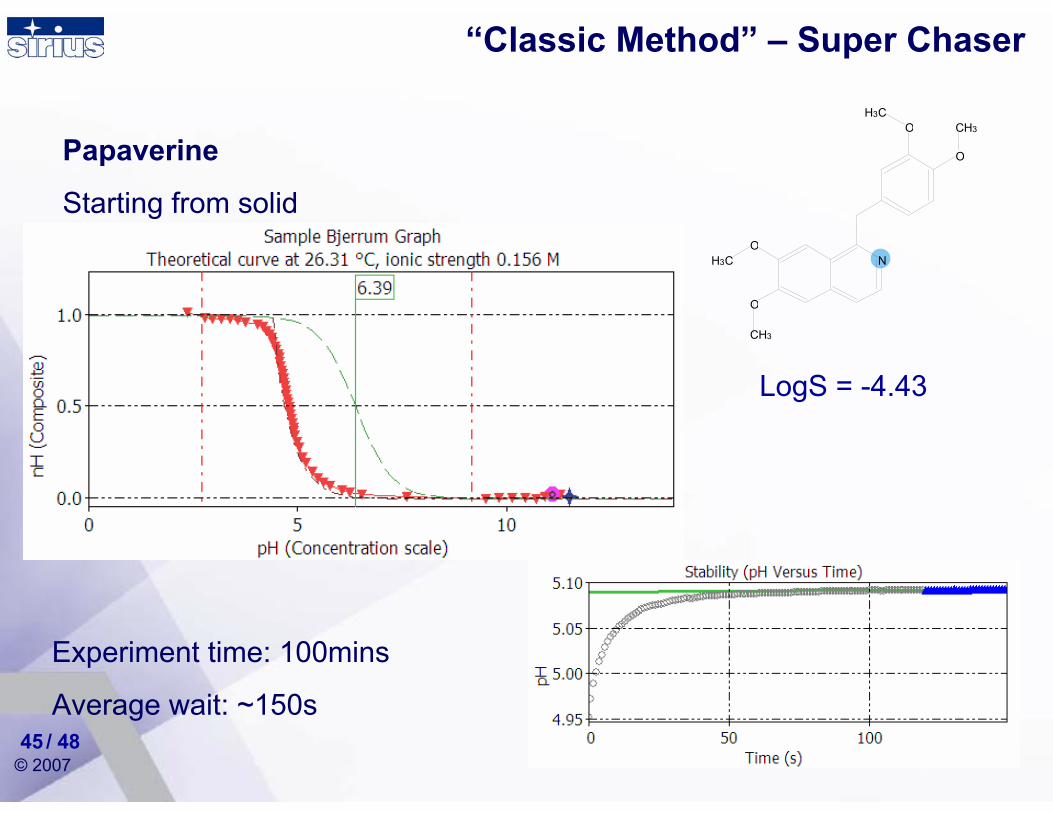
“Classic Method” – Super Chaser
/ 4845
Papaverine
Starting from solid
Experiment time: 100mins
Average wait: ~150s
LogS = -4.43
NO
O
O
O
C3H
CH3
C3HCH3
© 2007
“Classic Method” – Super Chaser
/ 4846
Chlorzoxazone
Starting from solid
Experiment time: 122mins
Average wait: ~150s
LogS = -2.97
N
O
OH
Cl
© 2007
Conclusions and Future Research
/ 4847
Real time monitoring of precipitation/dissolution effects duringthe CheqSol assay yields interesting insights into the solution chemistry of ionisable drugs.
Future Research:Can we find any “ghost” molecules?Can we relate the precipitation/dissolution behaviour to
structural properties and/or bioavailability?Compare our data against traditional dissolution
measurements.Are they any other techniques that measure precipitation
rates?What impact does this information have on formulation
design?
© 2007
CheqSol Papers
/ 4848
Stuart, M. Box, K. Chasing equilibrium: measuring the intrinsic solubility of weak acids and bases. Anal. Chem. 2005, 77(4), 983-990 Box, K J. Völgyi, G. Baka, E. Stuart, M. Takács-Novák, K. Comer, J E A. Equilibrium vs. kinetic measurements of aqueous solubility, and the ability of compounds to supersaturate in solution - a validation study. J. Pharm. Sci. 2006, 95, 1298-1307.Sköld, C. Winiwarter, S. Johan Wernevik, J. Bergström, F. Engström, L. Allen, R. Box, K. Comer, J. Mole, J. Hallberg, A. Lennernäs, H. Lundstedt, T. Ungell, A-L. Karlén, A. Presentation of a Structurally Diverse and Commercially Available Drug Data Set for Correlation and Benchmarking Studies. J. Med. Chem. 2006, 49(23), 6660-6671Llinàs, A. Burley, J C. Box, K J. Glen, R C. Goodman, J M. J. Diclofenac Solubility: Independent Determination of the Intrinsic Solubility of Three Crystal Forms. Med. Chem.; 2007, 50 (5), 979-983 Collaborative research with the University of CambridgeLlinàs, A. Box, K J. Burley, J C.Glen, R C. Goodman, J M.J. A new method for the reproducible generation of polymorphs: two forms of Sulindac with very different solubilities. J. Applied Crystallography, 2007, 40(2), 379-381. Collaboration with the University of Cambridge.