Embed Size (px)
Citation preview
Copyright 0 1996 by the Genetics Society of America
Classification of European mtDNAs From an Analysis of Three European Populations
Antonio Torr~ni,*?~ Kirsi Huoponen,* Paolo Francalacci,* Maurizio Petrozzi,t Laura Morelli,: Rosaria Scoz~ari,~'~ Domenica Obinu,: Marja-Liisa Savontaus** and Douglas C. Wallace"
"Department of Genetics and Molecular Medicine, Emoly University School of Medicine, Atlanta, Georgia 30322, iDipartimento di Genetica e Biologia Molecolare, Universita' di Roma ' Z a Sapienza, " 00185 Rome, Italy, :Istituto di Antropologza, Universita' di Sassari, 07100 Sassari, Italy, $Centra d i Genetica Evoluzionistica, C.N.R., Rome, Italy and ""Department of Medical Genetics,
University of Turku, 20520 Turku, Finland Manuscript received March 12, 1996
Accepted for publication August 26, 1996
ABSTRACT Mitochondrial DNA (mtDNA) sequence variation was examined in Finns, Swedes and Tuscans by PCR
amplification and restriction analysis. About 99% of the mtDNAs were subsumed within 10 mtDNA haplogroups (H, I, J, K, M, T, U, V, W, and X) suggesting that the identified haplogroups could encompass virtually all European mtDNAs. Because both hypervariable segments of the mtDNA control region were previously sequenced in the Tuscan samples, the mtDNA haplogroups and control region sequences could be compared. Using a combination of haplogroupspecific restriction site changes and control region nucleotide substitutions, the distribution of the haplogroups was surveyed through the published restriction site polymorphism and control region sequence data of Caucasoids. This supported the conclusion that most haplogroups observed in Europe are Caucasoid-specific, and that at least some of them occur at varying frequencies in different Caucasoid populations. The classification of almost all European mtDNA variation in a number of well defined haplogroups could provide additional insights about the origin and relationships of Caucasoid populations and the process of human colonization of Europe, and is valuable for the definition of the role played by mtDNA backgrounds in the expression of pathological mtDNA mutations
T WO aspects of the mitochondrial DNA (mtDNA) make it particularly useful in human evolutionary
studies. First, it is maternally transmitted and thus does not undergo recombination (GILES et al. 1980). Second, the mtDNA sequence evolution rate is much higher than that of the average nuclear gene (MIYATA et al. 1982; WALLACE et al. 1987). Consequently, a substantial number of mtDNA mutations have accumulated se- quentially along radiating maternal lineages that have diverged as human populations colonized different geo- graphical regions of the world. Restriction fragment length polymorphism (RFLP) studies of mtDNAs from a wide range of human populations have revealed a number of stable polymorphic sites in the mtDNA cod- ing regions. These define related groups of mtDNAs called haplogroups. Most of the mutations observed in both mtDNA coding and control regions in modern human populations have occurred on these preexisting haplogroups and define the individual mtDNA types or haplotypes (TORRONI et al. 1993a; GRAVEN et al. 1995).
The majority of haplogroups have been shown to be continent-specific. In Africa, haplogroup L encom- passes between 70 and 100% of the sub-Saharan mtDNAs (CHEN et al. 1995; GRAVEN et al. 1995). In Asia,
Corresponding author: Antonio Torroni, Dipartimento di Genetica e Biologia Molecolare, Universita' di Roma "La Sapienza," P.le A. Mor0 5 , 00185 Rome, Italy. E-mail: [email protected]
Genetics 144: 1835-1850 (December, 1996)
-55% of East Asian and Siberian mtDNAs are members of haplogroup M (BALLINGER et al. 1992; TORRONI et al. 1993b,c; CHEN et al. 1995; WALLACE 1995). Haplogroup M is subdivided into smaller subhaplogroups desig- nated C, D, G and E. Most of the remaining Asian mtDNAs are encompassed by haplogroups A, B and F (TORRONI et al. 1994~). Among Native Americans, only four Asian haplogroups (A, B, C and D) are observed, thus indicating that these haplogroups predated the colonization of the Americas (SCHURR et al. 1990; WARD et al. 1991; HORAI et al. 1993; TORRONI et al. 1993a, 1994a,d).
A recent high resolution RFLP study of individuals of European ancestry living in the United States and Canada has revealed four European-specific haplo- groups (H, I, J and K) that encompassed -64% of the subjects analyzed (TORRONI et al. 1994b). While useful in delineating European mtDNA haplogroups, the di- verse European origins of the samples precluded identi- fication of associations between particular populations and haplogroups. Since such associations have provided powerful tools for reconstructing African, Asian, and Native American origins, we have endeavored to deter- mine the nature and frequency of mtDNA variation in well defined European populations.
In this study, we report the extent and nature of mtDNA variation in three European populations, the
1836 A. Torroni et al.
Finns, the Swedes and the Tuscans of Central Italy. These populations encompass a large portion of the linguistic and genetic differentiation of modern Euro- pean populations (CAVALLI-SFORZA and PIAZZA 1993; CAVALLI-SFORZA et al. 1994). The Finnish language be- longs to the Uralic family, and the ancestral Finns prob- ably were a mixture of preexisting populations of un- known origin and population groups of Baltic and Germanic ancestry (DE LA CHAPELLE 1993). The Swed- ish language belongs to the Germanic branch of the Indo-European family, and the ancestors of modern Swedes could have been either Neolithic farmers who expanded into Europe from the Middle East “10,000 yr before present (YBP) (AMMERMANN and CAVALLI- SFORZA 1984; CAVALLI-SFORZA et ai. 1988; SOKAL et al. 1991) or pastoral nomads that began to expand from the Eurasian regions north of the Black Sea -6500 YBP (GIMBUTAS 1991). The Tuscan sample is from an area of Central Italy that was the core of the Etruscan coloni- zation. The Etruscan language, although not com- pletely known, is not of Indo-European origin and it was spoken in the area up to the first century A.D., when it was replaced by Latin, a language of the Indo- European family.
This survey revealed five new mtDNA haplogroups, in addition to the previous four described in Europeans from North America and one already reported in Asians. When combined, these 10 haplogroups encom- passed virtually all Finnish, Swedish and Tuscan mtDNAs. This finding suggests that the same 10 haplo- groups could encompass almost all mtDNAs in Europe and implies a scenario similar to that described in the Americas, where four haplogroups were found to en- compass almost the entire mtDNA variation of Native American populations.
MATERIALS AND METHODS
Subjects: Of the 86 Scandinavian subjects analyzed, 49 were unrelated Finns collected from various regions of Fin- land and 37 were unrelated Swedes collected among the medi- cal students of the Gothenburg University. DNAs from these samples were extracted from buffy coats using standard proce- dures. The DNAs from 48 unrelated Tuscan individuals whose maternal grandmothers were also born in Tuscany (Central Italy) were extracted from hair roots using the method de- scribed in VIGILANT et al. (1989). Sequence analysis of the two hypervariable segments of the mtDNA control region from these Tuscan samples was previously performed, and it is de- scribed in FRANCALACCI et al. (1996). All samples (1 -52) ana- lyzed by FRANCALACCI and collaborators (1996), except sam- ples 6, 8, 52 and 50, were also analyzed in this study. Samples 6, 8 and 52 were maternally related to other individuals of the sample and were included as sequence controls by FRAN- CALACCI et al. (1996). Sample 50 was discarded because of intersample contamination.
mtDNA analysis: The entire mtDNA of each Finn and Swedish sample was amplified in nine overlapping fragments by PCR using the same primer pairs and amplification condi- tions described in TORRONI et al. (1992, 1993a). Each of the nine PCR segments was then digested with 14 restriction en-
donucleases (Ala], AvaII, BamHI, Ddel, HaeII, HaeIII, HhaI, HincII, HinfI, HpaI, MspI, MboI, Rsal, TaqI) and tested for the A to G sequence polymorphism at nucleotide position (np) 12308 in the tRNA”” gene, previously observed in European mitochondrial disease patients (LAUBER et al. 1991). This mu- tation was detected by PCR using a mismatched primer with the 3‘ end adjacent to np 12308 and a G at np 12312. When the 12308G mutation is present, this generates a H i d site. In addition, all subjects were screened for the presence of a BstNI site at np 13104, an AccI site at np 15254, and a NlalII site at np 4577. Restriction fragments were resolved through electrophoresis in NuSieve plus SeaKem agarose (FMC Bio- Products) gels and visualized by UV-induced fluorescence. The resulting haplotypes are reported in APPENDIX A.
The phylogenetic relationships among and between Finn- ish and Swedish haplotypes were inferred by parsimony analy- sis. The dendrograms were rooted using the African haplo- type AF71 {‘‘African outgroup”). This haplotype, which has been observed in the Senegalese, is a member of the African- specific haplogroup L (CHEN et al. 1995) and has been pre- viously used as an outgroup in TORRONI et al. (1993a,b, 1994a- d). Maximum parsimony (MP) trees were generated through random addition of sequences using the Tree Bisection and Reconnection (TBR) algorithm (PAUP 3.1.1, SN70FFORD 1993). The PAUP analysis was terminated at 350 trees after 30,000 replications. These trees were obtained by saving no more than 10 MP trees for each replication. Although shorter trees could exist, none were observed in our analyses. A 50% majority-rule consensus of the 350 MP trees generated by the TBR algorithm was also obtained. A NJ tree was obtained from P distances by using the program MEGA 1.01 (KUMAR et at. 1993). Currently available program packages, including MEGA 1.01 and PHYLIP 3 . 5 ~ (FELSENSTEIN 1993), do not allow the users to compute genetic distances from restriction site data, but only from nucleotide sequences. To obtain P distances, we recoded the O / 1 haplotype matrix by replacing the 0’s with A’s, and the 1’s with G’s, and treated the restric- tion site data set as a sequence data set. The reliability of haplogroups observed in the NJ tree was assessed by bootstrap analysis (500 replications). Intrahaplogroup divergence esti- mates from restriction analysis data were calculated using the maximum likelihood procedure of NEI and TAJIMA (1983) and the mtDNA evolution rate of 2.2-2.9% per million yr (TORRONI et aZ. 1994d).
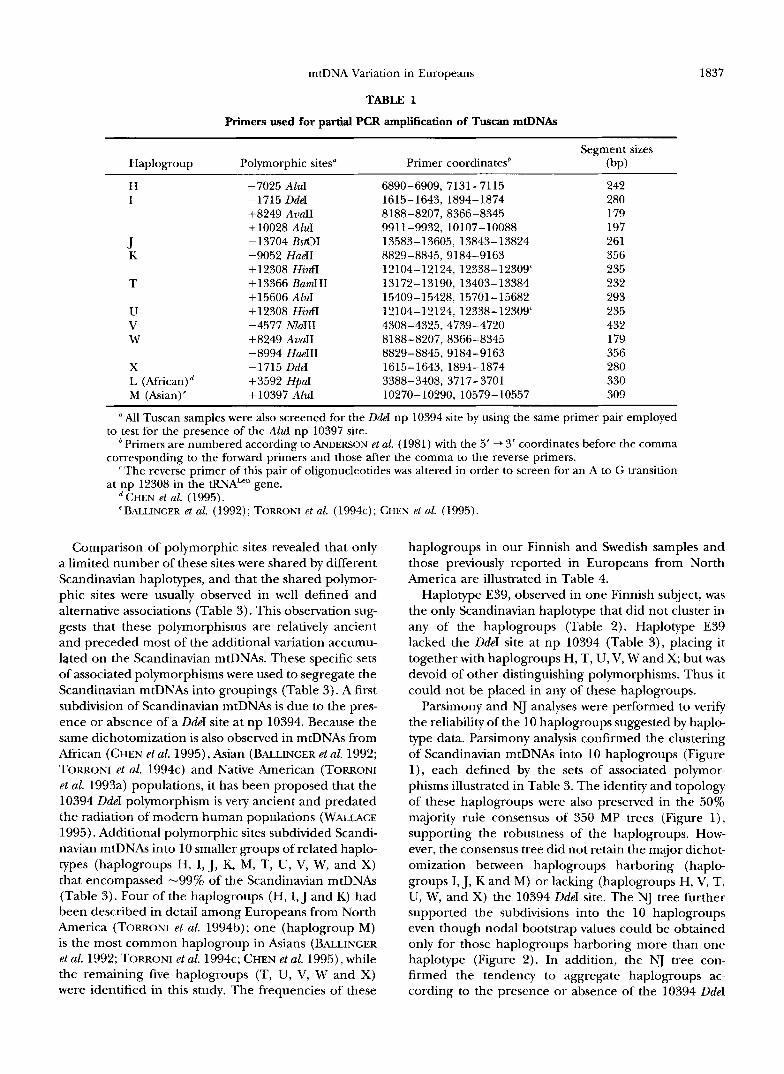
In contrast to the Finnish and Swedish samples, the limited amount and poor quality of the DNA extracted from hair roots of the Tuscans did not allow a complete haplotype analy- sis of their mtDNAs. However, it was possible to amplify 12 short PCR fragments (-200-300 bp each) from each Tuscan mtDNA (Table l ) , and to screen these fragments for the presence of 14 polymorphic restriction sites that define the mtDNA haplogroups (TORRONI et al. 1994b,c; CHEN et a[. 1995).
RESULTS
Haplotype analysis of Finnish and Swedish mtDNAs: Fiftytwo haplotypes (El -E52), defined by 84 polymor- phic restriction sites, were observed among the 86 Fin- nish and Swedish samples analyzed (Table 2, APPENDIX A). Only 13 haplotypes were observed in more than one subject, and only five (E2, El l , E19, E24, E45) were shared by Finns and Swedes. Of these haplotypes E2, E19 and E45 were the most common haplotypes, repre- senting 15.1, 7.0 and S.l%, respectively, of the total samples analyzed.
mtDNA Variation in Europeans
TABLE 1
Primers used for partial PCR amplification of Tuscan mtDNAs
1837
Haplogroup Polymorphic sites"
H -7025 AluI I -1715 DdeI
+8249 AvuII +lo028 AZuI
K -9052 Hue11 + 12308 H i d
T + 13366 BamHI +15606 AZuI
U + 12308 H i d V -4577 NlaIII W +8249 AvaII
-8994 Hue111 X -1715 DdeI L (African)d +3592 HpaI M (Asian)" +lo397 AluI
J - 13704 BsOI
Primer coordinate?
6890-6909, 7131-7115 1615-1643, 1894-1874 8188-8207, 8366-8345 9911-9932, 10107-10088 13583-13605, 13843-13824 8829-8845, 9184-9163 12104-12124, 12338-12309" 13172-13190, 13403-13384 15409-15428, 15701-15682 12104-12124, 12338-12309' 4308-4325, 4739-4720 8188-8207, 8366-8345 8829-8845, 9184-9163 1615-1643, 1894-1874 3388-3408, 3717-3701 10270-10290, 10579-10557
Segment sizes (bp)
242 280 179 197 261 356 235 232 293 235 432 179 356 280 330 309
"All Tuscan samples were also screened for the DdeI np 10394 site by using the same primer pair employed
'Primers are numbered according to ANDERSON et al. (1981) with the 5' + 3' coordinates before the comma
'The reverse primer of this pair of oligonucleotides was altered in order to screen for an A to G transition
to test for the presence of the AluI np 10397 site.
corresponding to the forward primers and those after the comma to the reverse primers.
at np 12308 in the tRNALe" gene. CHEN et al. (1995). BALLINCER et al. (1992) ; TOFXONI et al. (1994~) ; CHEN et al. (1995).
Comparison of polymorphic sites revealed that only a limited number of these sites were shared by different -Scandinavian haplotypes, and that the shared polymor- phic sites were usually observed in well defined and alternative associations (Table 3). This observation sug- gests that these polymorphisms are relatively ancient and preceded most of the additional variation accumu- lated on the Scandinavian mtDNAs. These specific sets of associated polymorphisms were used to segregate the Scandinavian mtDNAs into groupings (Table 3). A first subdivision of Scandinavian mtDNAs is due to the pres- ence or absence of a DdeI site at np 10394. Because the same dichotomization is also observed in mtDNAs from African (CHEN et al. 1995), Asian (BALLINGER et al. 1992; TORRONI et al. 1994c) and Native American (TORRONI et al. 1993a) populations, it has been proposed that the 10394 DdeI polymorphism is very ancient and predated the radiation of modern human populations (WALLACE 1995). Additional polymorphic sites subdivided Scandi- navian mtDNAs into 10 smaller groups of related haplo- types (haplogroups H, I, J, K, M, T, U, V, W, and X) that encompassed -99% of the Scandinavian mtDNAs (Table 3). Four of the haplogroups (H, I, J and K) had been described in detail among Europeans from North America (TORRONI et al. 199413); one (haplogroup M) is the most common haplogroup in Asians (BALLINGER et al. 1992; TORRONI et al. 1994c; CHEN et al, 1995), while the remaining five haplogroups (T, U, V, W and X) were identified in this study. The frequencies of these
haplogroups in our Finnish and Swedish samples and those previously reported in Europeans from North America are illustrated in Table 4.
Haplotype E39, observed in one Finnish subject, was the only Scandinavian haplotype that did not cluster in any of the haplogroups (Table 2). Haplotype E39 lacked the DdeI site at np 10394 (Table 3), placing it together with haplogroups H, T, U, V, Wand X; but was devoid of other distinguishing polymorphisms. Thus it could not be placed in any of these haplogroups.
Parsimony and NJ analyses were performed to verify the reliability of the 10 haplogroups suggested by haplo- type data. Parsimony analysis confirmed the clustering of Scandinavian mtDNAs into 10 haplogroups (Figure l), each defined by the sets of associated polymor- phisms illustrated in Table 3. The identity and topology of these haplogroups were also preserved in the 50% majority rule consensus of 350 MP trees (Figure l), supporting the robustness of the haplogroups. How- ever, the consensus tree did not retain the major dichot- omization between haplogroups harboring (haplo- groups I, J, K and M) or lacking (haplogroups H, V, T, U, W, and X) the 10394 DdeI site. The NJ tree further supported the subdivisions into the 10 haplogroups even though nodal bootstrap values could be obtained only for those haplogroups harboring more than one haplotype (Figure 2). In addition, the NJ tree con- firmed the tendency to aggregate haplogroups ac- cording to the presence or absence of the 10394 DdeI
1838 A. Torroni et al,
TABLE 2
MtDNA haplotypes in Finns and Swedes
Population
Haplotype Haplogroup Finn Swede N ~~
El E2 E3 E4 E5 E6 E7 E8 E9 E10 El 1 E12 E13 E14 E15 E16 E17 E18 E19 E20 E2 1 E22 E23 E24 E25 E26 E27 E28 E29 E30 E31 E32 E33 E34 E35 E36 E37 E38 E39 E40 E41 E42 E43 E44 E45 E46 E47 E48 E49 E50 E5 1 E5 2 Total
H H H H H H H H H H H H H H H H H H T T T T T U U U U U U U U U U U U V V V Other V W X x I K J J J J J 1 M (Asian) 1
49
2 13 2 1 1 1 1 1 1 1 3 1 1 1 2 1 1 1 6 1 1 1 2 2 1 1 1 2 1 1 1 1 1 1 1 1 1 1 1 1 2 1 1 1 7 2 2 1 1 1 1 1
86
site. The exception is represented by haplogroup I, which is connected to haplogroup W with a nodal boot- strap Pvalue of 40%. If it is confirmed, this aggregation
could indicate that the 10394 DdeI site has undergone a certain number of parallelisms/reversals during recent human evolution. The nodal Pvalues for haplogroups T, J, V and X were comprised between 90 and 63%. These were followed by haplogroups H and U with P values of 33 and 21%, respectively. Bootstrap values are commonly taken as the level of statistical confidence for the subset of haplotypes taken into consideration, and are considered statistically significant when P 2
95%. According to this, none of the Pvalues observed in this European data set would appear statistically sig- nificant. However, it has to be considered that 95% bootstrap values have not been reported for a major clade in any of the numerous studies that have been dealing with human mtDNA variation [as examples, see HEDGES et ul. (1991) and SOODYALL et ul. (1996)l. This is because of homoplasy in conjunction with the rela- tively low number of stable and informative characters (BANDELT et ul. 1995) and the fact that bootstrap values tend to underestimate true values, especially when many haplotypes or sequences are analyzed (LI and ZHARKIKH 1995).
In contrast to the parsimony trees, the NJ tree also suggests that haplogroups I, W and X are more closely related to each other than to the other haplogroups (Figure 2). The tendency to aggregate them in a major branch of the NJ tree is probably due to the fact that haplogroups I and X share a restriction site loss (DdeI np 1715), and haplogroups I and W share a site gain (AvuII np 8249) (Table 3).
Screening of Tuscan mDNAs for haplogroup-specific mutations: To determine if the 10 haplogroups found in the Finnish and Swedish mtDNAs were also charac- teristic of southern European populations, we screened 48 Tuscan mtDNAs for the 14 polymorphic sites listed in Table 5. These sites included most of the polymor- phisms that define each of the haplogroups observed in Scandinavia, as well as the HpuI np 3592 site that defines the African-specific haplogroup L (CHEN et ul. 1995).
This analysis revealed that 98% of the Tuscan mtDNAs could be aggregated into the 10 haplogroups (Table 5). The AZuI np 7025 site loss in association with the lack of the DdeI np 10394 site was found in 41.7% of the Tuscan mtDNAs, thus indicating that haplogroup H is also the most common haplogroup in southern Europe (Table 4). The BamHI np 13366 and AluI np 15606 sites, which characterize haplogroup T, were observed in 10.4% of the Tuscan mtDNA. The HinfI np 12308 site without the Hue11 np 9052 site loss and the DdeI np 10394 site gain, which is typical of haplogroup U, was also observed in 10.4% of the Tuscans. The associated Am11 np 8249 site gain/HueIII np 8994 site loss, which defines haplogroup W, was observed in 2.1 % of the Tus- cans. The DdeI np 1715 site loss in the absence of the DdeI site at np 10394, AluI site at np 10028, and AuuII site at np 8249 defines haplogroup X, and was observed
mtDNA Variation in Europeans
TABLE 3
Haplogroupspecific polymorphic sites in Finnish and Swedish mtDNAs
1839
Sites"
m r. 3
3
m o.1
b 0
+ I + + + + 3
I
Q, to m (o 3
+ Frequency ( % ) b Haplogroup ~~ ~
_ " + " " " " " " - 40.7 H + + " + " + 1.2 I + + " " _ " - - - - - - - - + " - + " + - 9.3 J """ + - + - + " " " 8.1 K
+ - + + " 12.8 T 17.3 U
" + " " " " " " " 3.6 V "" + + " " " " " - 2.3 W + " " " " " " " " 2.3 x
1.2 M 1.2 Other
" " " " " - """"" + " " "
- - - - - - - - + + _ " " " " _ " " " " " " "
The polymorphic restriction sites are listed as either absent (-) or present (+) relative to the reference sequence (ANDERSON et al. 1981). A plus or minus indicates whether the listed haplogroups have that polymorphism.
bFinns + Swedes.
in 8.3% of the subjects. The DdeI np 1715 site loss in association with the DdeI site at np 10394, AvuII site at np 8249 and AZuI site at np 10028 defines haplogroup I, and was found in 4.2% of the subjects. The associated HinfI np 12308 site gain and Hue11 9052 site loss, t e gether with the D&I site gain at np 10394 define haplo- group K and was found in 6.3% of the sample. Finally, the BstNI np 13704 site loss in association with the D&I np 10394 site that defines haplogroup J was obselved in 14.6% of the Tuscans, with one of the seven haplo- group J mtDNAs (sample #21) also having the AZuI site gain at np 15606 site gain that is characteristic of haplo- group T mtDNAs (Table 5). The presence of the AZuI
site at np 15606 in a haplotype J background suggests that this polymorphism arose as an independent muta- tional event. Neither the Mu111 np 4577 site loss in the absence of the D&I np 10394 site that defines haple group V, nor the AZuI np 10397 site in the presence of the D&I np 10394 site that define haplogroup M were observed in any of the Tuscan mtDNAs (Table 5).
DISCUSSION
Ten haplogroups encompass almost all mtDNAs from three European populations: The mtDNA analy- sis of Swedish and Finnish samples revealed that virtu-
TABLE 4
Distribution of mtDNA haplogroups in three European populations
Haplogroups Finland" Sweden" Tuscany" North Americab
H I J K M T U V W X Others Total
20 (40.8) 1 (2.0) 7 (14.3) 2 (4.1) 1 (2.0) 3 (6.1) 8 (16.3) 2 (4.1) 2 (4.1) 2 (4.1) 1 (2.0)
49
15 (40.5) 0 1 (2.7) 5 (13.5) 0 8 (21.6) 6 (16.2) 2 (5.4) 0 0 0
37
20 (41.7) 2 (4.2) 7 (14.6) 3 (6.3) 0 5 (10.4) 5 (10.4) 0 1 (2.1) 4 (8.3) 1 (2.1)
48
40.0 7.4 9.1 7.4 0
ND ND ND ND ND ND
I) Values are number of subjects with percentage in parentheses. Data from TORRONI et al. (1994b); ND, not determined. At the time of this study only mtDNA haplogroups
H, I, J, K and M were defined. Values are percentage of subjects.
1840 A. Torroni et al.
I I 9 7
r
H E
African outgroup I
K
J
* !
H
T
-10394~
W X
-7025a 1 2 $ I"
FA 18 17
+13366m, +15606a, -15925i 20 21 I 19
r, ~ 22
"I"" I 24
-1 26 25
27 29
30 28 31
32 34 35 - 33
40
+8249b, -8994e 41
-1715~ 42
43
-1715c, 452911, +8249b, +10028a, +16389m 44
-9052n, +12308g 45
48
49 -13704p, -160659 47
51 50
+I 0397a 52 + Asian
African outgroup
FIGURE 1.-Parsimony tree of Finnish and Swedish mtDNA haplotypes. This MP tree has been obtained by PAUP analysis and includes the 52 haplotypes (El-E52) observed in 49 Finns and 37 Swedes. The numbers at the nodes or end of each branch indicate different mtDNA haplotypes. The tree was rooted by using the African haplotype AF71 ("African outgroup"). This haplotype is a member of the African-specific haplogroup L (CHEN et al. 1995) and has been previously used as an outgroup in TORRONI et ut. (1993a,b; 1994a-d). The capital letters H, I, J, K, M, T, U, V, W and X indicate the 10 haplogroups, and the numbers associated with the lowercase letters indicate the restriction sites that define the specific haplogroups. The restriction enzymes correspond to the following code: a, AluI; b, AvuII; c, DdeI; e, HmIII; g, H i d ; i, MspI; m, BamHI; n, HueII; p, BstNI; q, NluIII. The horizontal branch lengths are proportional to the number of mutational events that separate the haplotypes with the exception of the 16517 Hue111 site. In the parsimony analysis, this hypervariable site was assigned half of the weight assigned to all other sites. This tree is 192 steps in length, has consistency and retention indices of 0.768 and 0.929, respectively, and is one of the 350 MP trees generated with the TBR branch swapping algorithm. The inset illustrates the 50% majority-rule consensus of the 350 MP trees. The consensus tree is 201 steps in length and has consistency and retention indices of 0.662 and 0.880, respectively. Note that all haplogroups are retained in the consensus tree.
ally all Scandinavian mtDNAs fell into 10 mtDNA haplo- groups, designated H, I, J, K, M, T, U, V, W and X. Each of these was defined by relatively ancient and stable polymorphic sites located in the coding regions of the mtDNA. An additional analysis of Tuscans from Central Italy using the diagnostic markers of these haplogroups revealed that the same haplogroups encompassed 98% of the Tuscan mtDNAs (Table 5). The predominance of these haplogroups in three divergent European pop- ulations suggests that they may encompass most of the European mtDNA variation, in a manner analogous to
the A, B, C and D haplogroups that arose in Asians and encompass virtually all Native Americans (TORRONI and WALLACE 1994). Comparison of the haplogroup data from Europeans with those of Asians and Africans should permit identification of and deductions about the progenitors of Europeans.
The distribution of the 10 haplogroups in non-Euro- pean populations: Previous studies have shown that the large majority of non-European mtDNAs belong to haplogroups whose distribution appears to be conti- nent-specific (WALLACE 1995). In the Americas, haplo-
mtDNA Variation in Europeans 1841
1
42 43
28 33
29
70 24
26
30 25
27
L= M Atrlcan outgroup (haplogroup L )
Scale: each ___ is appmximateiy equal to the dstawe 01 0.0097.
1. l J
never been described in non-European populations. To date no non-European population has been screened for the enzyme BstNI. As a result the frequency of the BstNI np 13704 site loss of haplogroup J among Afri- cans, Native Americans and Asians remains unknown. However, European haplotypes belonging to haplo- groupJ also harbor a Hinff np 16065 site loss (TORRONI et al. 1994b) and none of the 1175 non-European mtDNAs lacked this site (CANN et al. 1987; STONEKING et al. 1990; BALLINGER et al. 1992; TORRONI et al. 1993a,b; 1994a,c,d; CHEN et al. 1995), indicating that haplogroup J is European-specific.
The distribution of haplogroup X in non-European populations is more difficult to define because the DdeI site at np 1715 appears to have arisen several indepen- dent times during human evolution, including in a few African and Asian mtDNAs. However, the combination of the DdeI np 1715 and np 10394 site losses has not been observed in African mtDNAs, and it has been re- ported in only one Asian mtDNA and one Native Ameri- can population, the Ojibwa from Northern Ontario. The Ojibwa are the only Native American group show- ing a high proportion of mtDNAs not belonging to haplogroup A, B, C and D, and the prevalence of these additional mtDNA haplotypes, defined by the combina- tion of the DdeI np 1715 and np 10394 site losses, was initially attributed to recent genetic admixure with Eu- ropeans (TORRONI et al. 1993a). A recent extensive re-
FIGURE 2.-Neighbor joining tree of Finnish and Swedish analysis of Native American control region and haplo-
mtDNA haplotypes. This tree includes the same haplotypes we data has shown that these Ojibwa of Figure 1 and was rooted by using the same African out- mtDNAs belong to a well defined haplogroup (FOSTER group. As in Figure 1, the capital letters H, I, J, K, M, T, U, et al. 1996) that corresponds to the haplogroup X o b v! w and x indicate the 10 haPlogrouPs. Numbers in served in Europeans. However, the data from FOSTER indicate haplotypes, while the numbers at the nodes indicate and collaborators (1996) indicate that haplogroup x bootstrap Pvalues (0-100%) obtained by 500 bootstrap repli- cations. in the Ojibwa is not due to post-Columbian genetic
admixture with Europeans, but it probably represents
groups A, B, C and D encompass virtually all Native American variation; in Africa, haplogroup L represents -70% of sub-Saharan African mtDNAs; and in Asia, haplogroup M represents -55% of mtDNAs with other less common haplogroups (A, B, E, F, G) making up most of the remaining Asian mtDNAs (TORRONI et al. 1994~). With the exception of one Finnish mtDNA that belonged to haplogroup M, none of the Asian- and African-specific haplogroups were observed in our Eu- ropean samples. This implies that the overlap between European and non-European mtDNA variation is very limited.
A survey of published data confirms this observation. Haplogroup H, which represents -40% of European mtDNAs, and haplogroup K, which represents -8% of European mtDNAs, have each been observed in only three out of 1175 non-European subjects (CANN et at. 1987; STONEKING et al. 1990; BALLINGER et al. 1992; TOR- RONI et al. 1993a,b, 1994a,c,d; CHEN et al. 1995). The same survey revealed that haplogroups T, I and W have
a fifth Native American founding haplogroup of Asian ancestry.
Haplogroups U and V are defined by a Hznfl np 12308 site gain and a NlaIII np 4577 site loss, respec- tively, polymorphisms that have not been screened for in non-European populations. To assess the distribu- tion of haplogroup U in non-Europeans, we have screened for the np 12308 mutation 116 Asians (12 Malay Chinese, 21 Vietnamese, 11 Malays, 13 Borneans, 13 Koreans, 20 Taiwanese, 26 Malay Aborigines), 51 Native Americans (2 Tlingit, 10 Dogrib, 10 Navajo, 9 Pima, 10 Maya, 10 Ticuna), and 140 Africans (60 Man- denka, 41 other Senegalese and 39 Pygmies) whose mtDNA haplotypes were previously reported (BAL LINGER et al. 1992; TORRONI et al. 1992; CHEN et al. 1995). None of the Asian and Native American mtDNAs exhibited the 12308 mutation, though four Senegalese including one Mandenka and three Tukulors did. The Mandenka harbored haplotype -1, while the Tukulors harbored haplotype AF2. Similar to haplogroup U mtDNAs, AF1 and AF2 lacked the DdeI np 10394 site.
. -
1842 A. Torroni et al.
TABLE 5
Screening of haplogroupspecific polymorphic sites in Tuscan mtDNAs
Sites" CI
4 1
m m r . L n m l m m m m o w 0 0 ~ g ~ g ~ g g ~ z z ~ ~ ~ ~ H m t - m 1 + 1 1 + 1 1 + + + + + 1 + Sample numbers Haplogroup
" _ + " " " " " 3, 7, 10, 13, 16-18, 20, 24, 27, 31, 36, 39-43, 47, 49, 51 H + - + 22, 25, 29, 32, 48 T
+ " - 4, 5 , 19, 30, 44 U " " + + " " " - - 2 W + " " " " " " - 26, 28, 34, 38 X + " - + " + + " " - 9, 15 I
+ - + - + - - - 33, 37, 45 K - - - - - - - - + " - + - 1, 11, 12, 23, 35, 46 J + + 21 J
" " " " " _ """""
"""
- - - - - - - - + " - """"""" 14 Other
a The diagnostic sites are listed as either absent (-) or present (+) relative to the reference sequence (ANDERSON et al. 1981). A lus or minus indicates whether the listed samples harbor that polymorphism.
'This site characterizes the African-specific haplogroup L (CHEN et al. 1995).
In fact, AF2 is identical to the Finnish haplotype E28, and AFl is closely related to the Swedish haplotype E25, with which it also shares a MboI np 3348 site gain. These findings indicate that haplogroup U, although much more prevalent in Europe, is shared between Europe- ans and some Sub-Saharan Africans.
To assess the distribution of haplogroup V in non- European populations, we have tested for the NluIII np 4577 site loss the 140 African mtDNAs previously described by CHEN et al. (1995), but none harbored this polymorphism. Thus haplogroup V could be absent in Africans, though its distribution in other African popu- lations and Asians has yet to be determined.
In conclusion, it appears that at least six of the Euro- pean haplogroups (haplogroups H, I, J, K, T, W) are essentially confined to European populations and prob- ably originated after the ancestral Caucasoids became genetically separated from the ancestors of modern Af- ricans and Asians. Haplogroup U, by contrast, is found at low frequencies in African populations.
The specificity to Caucasoids of most haplogroups observed in Europeans is supported by the age esti- mates of the haplogroups. These estimates (Table 6) were calculated from restriction site data from the hap- lotypes observed in Finns and Swedes only for those haplogroups (H, J, T, U and V) that harbored enough variation to allow these calculations. Because these esti- mates are based only on the mtDNA variation observed in Scandinavia, they could be biased by specific genetic phenomena associated to the peopling of this Euro- pean region. However, the ages of haplogroups H and J (17,000-30,000 yr) were similar to those reported for the same haplogroups in the heterogeneous Europeans
from North America (TORRONI et al. 1994b), and overall the relatively recent origin of Caucasoid-specific haplo- groups H, J, T, and V (8000-30,000 y r ) supports the hypothesis that they originated recently after the ge- netic and geographic separation of the ancestral Cauca- soids from the ancestors of modern African and Asians. On the contrary, haplogroup U appears to be much older than the other haplogroups with an estimated age of 51,000-67,000 yr. Interestingly, this haplogroup is the only haplogroup that Europeans share with Afri- cans. This raises the possibility that haplogroup U origi- nated in Africa and subsequently expanded into the Middle East and Europe.
The correlation between haplogroups and control region sequences: The sequences of the control region hypervariable segments HVSI and HVS-I1 for the Tuscan mtDNAs have been previously determined (FRANCALACCI et ul. 1996). Consequently, they can be correlated with the restriction site variants of the haplo- groups H, I, J, K, M, T, U, V, W, and X defined in the present study. This correlation between haplogroups and D-loop sequences had two major objectives. First, to corroborate the reliability of the haplogroups identi- fied by haplotype and phylogenetic analyses. Indeed it is expected that, if the haplogroup classification is cor- rect, the control region sequences within the same haplogroup should harbor unique and monophyletic sets of nucleotide polymorphisms. Second, to differenti- ate the control region variants that are phylogenetically associated and thus relatively ancient and stable from those that are recent or have undergone repeated for- ward and backward mutations.
In Table 7 the 48 control region sequences have been
mtDNA Variation in Europeans
TABLE 6
Sequence divergences and divergence times of haplogroups in Scandinavians
No. of No. of Sequence Divergence time Haplogroups haplotypes subjects divergence (%) (years)
H 18 35 0.065 22,414-29,545 J 6 8 0.050 17,241-22,727 T 5 11 0.024 8,276-10,909 U 12 14 0.148 51,034-67,273 V 4 4 0.048 16,552-21,818
“The divergence times were calculated from intra-haplogroup sequence divergences using the mtDNA evolution rate of 2.2-2.9%/myr (TORRONI et al. 1994d).
1843
subdivided into the observed Tuscan haplogroups (Ta- ble 5), which include all but haplogroups M and V. This subdivision confirms the validity of the haplogroup classi- fication. Indeed, the control region sequences aggre- gated within the same haplogroup share a common set of ancient sequence polymorphisms (boxed in Table 7).
The haplogroup H control sequences appear to share only one common nucleotide variant, an A at residue 73 in HVS-11. Exceptions to this rule include two of the 20 haplogroup H mtDNAs (subjects 27 and 49) that harbor a G at np 73, and three nonhaplogroup H mtDNAs (subjects 4, 14 and 25) that have an A at np 73. These latter three subjects indicate that the control region sequence is highly prone to repetitive mutations. The Cambridge reference sequence is closely related to the Tuscan haplogroup H sequences and, similar to all haplogroup H mtDNAs, lacks the DdeI np 10394 and AZuI np 7025 sites. These observations suggest that the European reference sequence is also a haplogroup H mtDNA.
Four of the five Tuscan haplogroup T control region sequences are characterized by T’s at nps 16294 and 16296. The fifth subject (32) has one T at np 16294. A T at np 16294 is only seen outside of haplogroup T in subject 38 of haplogroup X, while the T at np 16296 is exclusive of haplogroup T.
The haplogroup U control region sequences do not harbor any characteristic mutations, and like most haplogroups are characterized by a G at np 73. How- ever, two subjects (19 and 44) form a subgroup defined by T’s at nps 16192 and 16270.
Haplogroup W was observed in only one Tuscan sam- ple (subject 2). Consequently, it was not possible to directly determine specific control region mutations that define this haplogroup. However, one of the 100 control region sequences obtained from British subjects (PIERCY et aZ. 1993) showed a striking homology with that of Tuscan subject 2, as both sequences share a T at np 16223, G at 73, A at 143, G at 189, C at 195, C at 204, and A at 207. Hence, these residues may be characteristic of some mtDNAs from haplogroup W.
The haplogroup X control region sequences are asso- ciated with T’s at nps 16223 and 16278. The association of these two mutations is very common in African
mtDNAs (GRAVEN et al. 1995). However, African mtDNAs lack the DdeI np 1715 site loss and have addi- tional characteristic variants both in the coding and control regions.
Haplogroup I control region sequences were ob- tained from two Tuscan subjects. These mtDNAs shared an A at np 16129, T at 16223, C at 16311, C at 152, G at 189, C at 199, A at 203, C at 204, and C at 250 (Table 4). This same array of base substitutions has been re- ported in Sardinians (DI RIENZO and WILSON 1991), Britons (PIERCY et al. 1993) and in a heterogeneous Caucasian sample (STONEKING et aZ. 1991). Haplogroup I is also characterized by five distinctive restriction site polymorphisms. The NJ tree (Figure 2) had indicated that haplogroups I , W and X could be more closely related to each other than to other haplogroups. This suggestion appears to be partially supported by compar- ison of their control regions. Indeed, even though the control region sequences belonging to haplogroups I , W and X are distinguished by a substantial number of different base substitutions, they all share a T at 16223.
The haplogroup K control region sequences could be examined in three Tuscan mtDNAs and are charac- terized by C’s at nps 16224 and 16311 of HVSI. One of the three Tuscan mtDNAs belonging to this haplogroup lacked the C at np 16311, but this T to C transition appears to have arisen repeatedly, being also observed in both individuals from haplogroup I , as well as in some individuals from haplogroups H and J.
Haplogroup J mtDNAs are represented by seven Tus- can control region sequences and are defined by three distinct polymorphisms: a T at np 16069, a C at np 16126, and a T at np 295. The T at np 16069 is detected as a Hid site loss at np 16065 in haplotype analysis (Figure 1). The control region sequence of individual 21 is concordant with a haplogroup J classification, con- firming that the AZuI np 15606 site found in subject 21, but normally characteristic of haplogroup T (Table 5), is due to a separate mutational event.
This correlation between nucleotide changes in the coding region and in the noncoding control region of the mtDNA permits a direct comparison of all pub- lished data obtained by both haplotype analysis and control region sequencing, thus providing additional
1844 A. Torroni et al.
TABLE 7
MtDNA control region sequences from Tuscans
Polymorphic nucleotide positions"
1111111111 1111111111 1111111111 1111111111 1111111111 11111 6666666666 6666666666 6666666666 6666666666 6666666666 66666 0001111111 1111111112 2222222222 2222222222 2222333333 33333 1111111111112222 2222222222 33333 5690122344 5567788991 2223344456 6677788899 9999000111 22556 5667445558 8889990000 1222235569 00111 1934169457 3632669233 2340108961 3504814601 2467049168 45262 7043360230 5894593457 5256840935 99159
Sb H' aa a b
Camd
10 H 20 H 31 H 41 H 47 H 3 H
36 H 39 H 16 H 43 H 51 H 17 H 18 H 7 H
42 H 24 H 13 H 40 H 49 H 27 H
~~~~ ~~ ~ ~ ~ ~~~~~~
ACTCCTGCGC GGATCCTCCG CCTATACTCC TACGCAACCC CCCTATATAATTTTT "CAGTCTAT GAACTTGTGGACGTGATAAC - - E T .......... ........G. ...C.
........................................................................... .....---G. ."C-
...........................................................................
........G. ...C. ...........................................................................
........G. ...C- ...........................................................................
------..G. -"C.
G- C--C- G- C - - C -
....................................................... ......T... .......... --......G. C..C.
.......................................................... T......
...................................................................................
...................................................................................
......A". ...................................... G. ..... .......C.. .......... ........G. ...C.
.......... - - - ( - - . A ................................... .....(.. .......... ......--G- C--C- .................... ..-.....T. .......... .......c.- .-c" ..
.""-.c" .................. G. CC.C.
."T-"... .................... .."T....T ............... .......C.. .................. G. ...(.
..-T"".. ...C...... ...............................................................
......... T """C..- .............................. ...C. ................................. G. C..C. ........................................ .-...c....
........................................... G. ...C. .............................. ..T--G.-.- ................................. G. C..C. .......... .......T.. .......-.T .......... .......C..
...T....A. ........ G. C..C. .................... .....-.c.. .......... .......C.. ...............
G. CC.C.
...G....G. ..-.C..... ........ G. C--C- .......... ---...C... .......... ......GT.. ...............
...G..T... .....C-... ........ G. C.-C- .......................................................
.......... .....C.... -....G..G. ...C.
-
25 T .--..c.. . . .................... .G-....... .TT..c.... ......................... ...-"..G. cc.c. 22 T --...C.... ....--C... .................... .TT..-.... ..... ...G-..... .......... ........G. C"c. 29 T .....C.... ............................... T....... C...- ...G...... .......... ...-....G. c..C.
48 T ..........A......... .................... .TT....... ..... ...G..T... .......... ........G. ...c. 32 T .......... ..G..Tc... .......... ...A...... .T........ ..... ...G...c.. .................. G. .-.cc Y 19 u .......... ..-....T.. .......... ..T.-...T. ............... .--G..T... ...-C..... ........G. C..C.
44 u .......... ....-..T.. T....-..T. ..T....... ............... .-.G...... .......C.. .-......G. C.-C. 30 u G-........ .............................. ...-..G..c ..... ...G...cG. .......... ......-GG. ...c.
4 U .-...c.... .......... .-.G...... ......................... .TT....... .......... .-......G. -..C. 5 u .......T.. .................... C......... .......... ..-C. ...G..-... ....C-.... ........ G. ...C.
2 W ..c .............. T.. .B ................ T T ......... .c... ...&(.. ..B-fl.m ........ G. ...C. 28 X .......... ......c... .T ....... ....T .... ...c...... ..... ...G-...G. ....C...-- ..AC.-..G. C..C- 26 X .......... ....-.c... .T -..T... ... T..". .......... c."- ...G..-C.. .................. G. - - - C - 38 X .................... .T .......... T .... -T.......- ....C -..G.C...- .......... ..--....G- - - - C - 34 X ....T...-. ..................... 1 ' 1 T ................... ...G.....- ....C..C.A ..--....G. - - - ( -
9 I ........ ...C.-.... .T ....................... C.. ..... ...G.-. ........ ....................... ......
15 I B ...c...... .T U n c.. ....c .-.G... [I ::[.I.. [-G. ...C.
..CAC.- .....-C.G. ..-C.
33 K .................... ..c....... .......... .......C.. ..... ...G...C.. .......... -.......G. ...C- 37 K ..C....... .A........ ..c..C.... ........................ ...G...-.. ....C..... .....".G. ..-C. 45 K .................... ..c....... ......................... . . .G..-- . . .......... ......-.G. ...C. u 0
mtDNA Variation in Europeans 1845
TABLE 7
Continued
Polymorphic nucleotide positions" ~~ ~
1111111111 1111111111 1111111111 1111111111 1111111111 11111 6666666666 6666666666 6666666666 6666666666 6666666666 66666 0001111111 1111111112 2222222222 2222222222 2222333333 33333 111111 1111112222 2222222222 33333 5690122344 5567788991 2223344456 6677788899 9999000111 22556 5667445558 8889990000 1222235569 00111 1934169457 3632669233 2340108961 3504814601 2467049168 45262 7043360230 5894593457 5256840935 99159
Sh H' aa ab
1 J .T... .... ....T..... ................................... ...G...... .......... . . . . A . . . T (..(.
23 J ..................................................... ..-G.c.... AG ........ .T..A... T ...c.
46 J ..................................................... ...G...... A ......... . . . .A . . . T ...C.
11 J . . . . . . A . .......... ....C....T ......................... ..-G..TC.. ....C..... G....... T ..TCC
35 J .... . . A - .......... T-..-."-T . . . A - - - - - - ...............
".G.."" .................. T ...(.
12 J ................ T. .................... .......C.. ..... ...G--TC.. .................. T ..-C-
21 J ........ ........T. ........T. .......... ....G.G... ..... ...G".C.. .................. T ..-C- 'iI 1
14 Other .....c.... ............................................. C-T ......C .......... ........G. C C - C .
n Boxes define the D-loop nucleotide variants which either by themselves, or in association with other variants, define each
b S is Sample. The numbering of individual samples is according to FRANCALACCI et al. (1996). 'H is Haplogroup. Haplogroups as determined by restriction analysis screening of informative polymorphic sites. d Cam is Cambridge; from ANDERSON et al. (1981).
haplogroup. Nucleotide positions 57a, 60a, 309a, 309b indicate nucleotide insertions relative to the Cambridge sequence.
information about the distribution of these haplo- groups in other populations. Surveys of published con- trol region sequences from non-European populations confirm that haplogroups I, K, J, T, W are essentially European-specific (VIGILANT et al. 1991; TORRONI et al. 1993a,b; GRAVEN et al. 1995). For haplogroup H, both the distinctive AZuI np 7025 site loss and the A residue at np 73 have only been sporadically observed in non- Europeans (STONEKING et aZ. 1991; VIGILANT et al. 1991; GRAVEN et al. 1995). As for haplogroup U, the shared African and European haplogroup, the lack of distin- guishing control region variants does not permit fur- ther continental discrimination. Finally, for haplogroup X, the association between T's at at nps 16223 and 16278 is very common in African mtDNAs (GRAVEN et al. 1995), and thus European and African mtDNAs must be distinguished by continent-specific restriction site polymorphisms, such as the DdeI np 1715 site loss.
The haplogroup aggregation of control region se- quences also permits identification of hypervariable nu- cleotides (WAKELEY 1993; COMAS et al. 1995). These include a C at np 16189, T at 16256, T at 150, C at 152, and C at 195, each of which appears in three or more haplogroups. A particularly high mutation rate of cer- tain nucleotides has important implications for phylo- genetic studies (BANDELT et al. 1995) because both max- imum parsimony analysis (VIGILANT et al. 1989; DI RIENZO and WILSON 1991; TORRONI et al. 1993a,b) and painvise difference analysis (DI RIENZO and WILSON 1991; ROGERS and WENDING 1992) usually assign an equal weight to all nucleotide changes.
The distribution of the 10 haplogroups in Caucasoid populations: Table 4 shows the distribution of the 10 haplogroups in the three European samples, as well as in an aggregate of Europeans from North America. Haplogroup H is the most prevalent in these samples, with a strikingly consistent frequency of -41%. Haplo- groups J, K, T and U are also very common and shared by all populations. The remaining haplogroups I, V, W and X are less common, though still shared between at least two of the three populations.
Although detailed restriction site analyses are not available for other European populations, some addi- tional data about the distribution of specific haplo- groups can be deducted from surveys that have employed a more limited number of restriction endo- nucleases. The linked BamHI np 13366 site gain and MspI np 15925 site loss of haplogroup T has been ob- served in 11.9% of the Greeks, 6.0% of the Albanians, 9.9% of the Sardinians, 12.6% of the Apulians, 14.6% of the Sicilians, 4.8% of the Arabs from Palestine, and 1.3% of the Ashkenazi Jews, but was not observed in the Yemenite Jews (SANTACHLUA-BENERECETTI et al. 1988; DE BENEDICTIS et al. 1989; SEMINO et al. 1989; TORRONI et al. 1990; k T T E et al. 1993; ASTIUNIDIS and KOWATSI 1994). These haplogroup T markers have also been seen in 3.8% of the Hindus from Northern India (SEMINO et al. 1991), indicating that haplogroup T is present, at varying frequencies, throughout the entire range of Caucasoid populations. A similar distri- bution is observed for haplogroup K defined by the HmII np 9052 site loss. This polymorphism has been
1846 A. Torroni et al.
described in 6.8% of the Greeks, 6.0% of the Albanians, 4.5% of the Sardinians, 9.2% of the Apulians, 12.2% of the Sicilians, 1.6% of the Arabs from Palestine, 8.0% of the Yemenite Jews, and 1.2% of the Hindus. In addition, 29.3% of the Ashkenazi Jews appear to belong to this haplogroup suggesting a recent founder effect in Cen- tral European Jewish populations ( SANTACHIARA-BENER- ECETTI et al. 1988; DE BENEDICTIS et al. 1989; SEMINO et al. 1989; TORRONI et al. 1990; RITTE et al. 1993; ASTRIN- IDIS and KOWATSI 1994).
Additional information about the distribution of the haplogroups in Europeans can be inferred by published studies of control region sequences, in spite of the fact that several of these studies analyzed only HVSI (DI RIENZO and WILSON 1991; BERTRANPETIT et al. 1995; SAJANTILA et al. 1995). The specific HVSI polymor- phisms of haplogroup J, a T at np 16069 and a C at np 16126, have been observed in 12.0% of the British, 4.4% of the Basques, 5.8% of the Sardinians, 16.7% of a het- erogeneous Middle Eastern sample (Bedouins, Israeli Arabs and Yemenite Jews), but none of 98 individuals from south-western India. The haplogroup K polymor- phisms of C’s at nps 16224 and 16226 were observed 10.0% of the British, 2.2% of the Basques, 5.8% of the Sardinians, and 2.4% of the subjects from Middle East, but were absent in the Indians. Haplogroup T mtDNAs defined by T’s at nps 16294 and 16296 were observed in 10.0% of the British, 4.4% of the Basques, 13.0% of the Sardinians, and 14.3% of the individuals from Mid- dle East, but again were not observed in Indians (DI RIENZO and WILSON 1991; PIERCY et al. 1993; BERTRAN- PETIT et al. 1995; MOUNTAIN et al. 1995).
British and Indian populations have been analyzed for both control region hypervariable segments (PIERCY et al. 1993; MOUNTAIN et al. 1995), thus providing data on the distribution of the haplogroup H np 73 A poly- morphism. This data indicates that 54% of the British mtDNAs but only 1% of the Indian mtDNAs could be- long to haplogroup H. This difference is statistically highly significant (X, d,f,;Yates = 66.6; P 4 0.001). This raises the possibility that haplogroup H frequencies may be more variable than those found in the current study.
Because most of the 10 haplogroups appear to be confined to Caucasoids, they probably originated in an- cestral Caucasoid population (s) after they separated from the progenitors of modern Africans and Asians. Therefore, it is possible that frequency clines in mtDNA haplogroups might reveal the homeland and patterns of expansions of ancient proto-European populations. For instance, a steep cline appears to exist for haplo- group H, which encompasses 40-50% of mtDNAs from western European populations, but is virtually absent in Indians. Such a cline for haplogroup H has been recently confirmed by screening a number of Caucasoid populations for the absence of the 7025 AluI site (PAS- SARINO et al. 1996). The detection and analysis of these clines may be extremely useful in examining current
models postulated to explain the bio-cultural diversity of Caucasoids (AMMERMANN and CAVALLI-SFORZA 1984; CAVALLI-SFORZA et al. 1988; BAREWJANI and SOW 1990; SOKAL et al. 1991; PIAZZA 1993; BARBUJANI et al. 1995).
Applications in studies of ancient human remains: The correlation between stable restriction site changes in the coding regions and informative polymorphisms of the control region allows haplogroup classification of control region sequences obtained from ancient hu- man remains. Recently, the control region sequence was published from an -5000-year-old mummified body found in the Tyrolean Alps at the border between Italy and Austria (HANDT et al. 1994). This sequence encompassed from np 16056 to 16409, including HSV- I. It differed from the Cambridge sequence only by a C at np 16224 and a C at np 16311. Because identical sequences were found only in Europeans, it was con- cluded that the mtDNA from the 5000-year-old body fitted into the genetic variation of contemporary Euro- peans (HANDT et al. 1994). The current study shows that this control region sequence is characteristic of the European-specific haplogroup K (Table 7), and there- fore, that haplogroup K mtDNAs were present in the human populations living in the Alpine region -5000 yr ago. We also know that haplogroup K is shared by all modern European populations, reaching the highest frequency values among the Ashkenazi Jews (29%) (RITTE et al. 1993), the Swedes analyzed in this study (14%), and the Sicilians (12%) (SEMINO et al. 1989). In addition, the identification of these 10 haplogroups in Europeans may permit genetic analyses of ancient human populations from Europe and the Middle East, such as the identification of the Native American-spe- cific haplogroups A, B, C and D (TORRONI et al. 1992, 1993a) have allowed the classification of 50 mtDNAs from pre-Columbian Oneota of Illinois (STONE and STONEKING 1993; STONEKING 1995). Indeed, with the distinctive haplogroup restriction sites identified, mtDNAs from ancient human remains could be classi- fied into haplogroups even when template damage per- mits PCR amplification of only 40- to 50-bp fragments.
Implications for studies of mtDNA diseases: One of the most important and common criterion used to de- termine whether a DNA mutation is causal to a disease or is a neutral polymorphism is the screening for the mutation in control populations. The pathological sig- nificance of DNA mutations is generally ruled out when the mutation is detected in the general population. However, mtDNA studies have shown that most of mtDNA variation is continent-specific, and that certain variants and haplogroups can be extremely common in certain populations and completely absent in other ethnic groups. Consequently, the application of this criterion to mtDNA disease studies requires that control populations are accurately ethnically matched to the ethnic background of the patients. However, such eth- nically matched control populations are not easy to se-
mtDNA Variation in Europeans 1847
lect, particularly in those regions of the World that are inhabited by populations with a heterogeneous ethnic background and have undergone through extensive ge- netic admixture. In recent years, a new approach has been developed in mtDNA disease study to overcome this difficulty. This method requires the comparison of the patient’s mtDNA variation with that observed in the control mtDNAs that are phylogenetically most closely related, ie., with control mtDNAs belonging to the same mtDNA haplogroup observed in the patient. This approach has proven extremely valuable. For instance, it has allowed the identification of the first LHON plus dystonia mutation (14459A) in an Hispanic family from California whose mtDNA was a member of Native Amer- ican haplogroup D ( JUN et al. 1994). It has revealed that a 270-bp tandem duplication in the mtDNA control region is not associated with deletions in mitochondrial myopathies as initially suggested (BROCKINGTON et al. 1993), but is a polymorphism that characterizes all mtDNAs belonging to haplogroup I, one of the Euro- pean-specific haplogroups (TORRONI et al. 1994b). It has proven that the 4336C mutation is associated with late-onset Alzheimer disease (SHOFFNER et al. 1993; HUTCHIN and CORTOPASSI 1995), and that this muta- tion arose as a single mutational event on the European- specific haplogroup H (TORRONI et al. 1994b). Last, it has shown that the degree of penetrance of some pathologcal mtDNA mutations depends on the mtDNA background on which they occur. For instance, the risk of expression of LHON in presence of the primary mu- tation 14484C is eightfold higher when this mutation occurs on the European-specific haplogroup J (TOR- RONI et al. 1996). These important results have been obtained in a context in which only four haplogroups (H, I, J and K) were defined among Europeans. Now, the classification of almost all European mtDNA varia- tion in 10 haplogroups provides an additional opportu- nity for correlating mtDNA disease and evolutionary studies, for discriminating between neutral polymor- phisms and pathological mutations, and for defining the role played by mtDNA backgrounds in disease ex- pression.
In conclusion, this study identifies 10 mtDNA haplo- groups in Europeans by haplotype comparison, phylo- genetic analyses and correlation of restriction site changes and control region sequence polymorphisms. These haplogroups encompass virtually all mtDNAs ob- served in three European populations representative of both northwestern and southwestern Europe.
Using the combination of the informative restriction site and control region sequence polymorphisms, it has been possible to begin a survey of mtDNA haplogroup distributions throughout the Caucasoid range, sug- gesting that clinal distributions might exist for certain haplogroups. Moreover, the ability to discriminate among the 10 haplogroups represents a powerful tool for molecular anthropology and mtDNA disease stud-
ies. Hence, haplotype discrimination promises to con- tinue to be a useful approach for both theoretical and applied studies of individual and global origins.
We are indebted to Dr. NILS-GORAN LARSSON for providing the DNA samples from Sweden. This work was supported by Telethon grant E.069 to A.T., by the J. Worley Brown Fellowship fund and the National Institutes of Health grant GM-46915 to D.C.W., by grants from Centro Nazionale Ricerche “Biological Archive” and the Sar- dinian Autonomous Region to P.F., and a grant from the Italian Ministry for Universities (MURST, 40%) to R.S.
LITERATURE CITED
AMMERMAN, A. J., and L. L. CAVALLI-SFORZA, 1984 The Neolithic Tran- sition and the Genetics ofPcpulations in Europe. Princeton University Press, Princeton, NJ.
ANDERSON, S., A. T. BANKIER, B. G. BARREI.~., M. H. L. DE BRUIJN, A. R. COUISON et al., 1981 Sequence and organization of the human mitochondrial genome. Nature 290: 457-465.
ASTRJNIDIS, A,, and A. KOUVATSI, 1994 Mitochondrial DNA polymor- phism in Northern Greece. Hum. Biol. 66: 601-61 1 .
BALLINGER, S. W., T. G. SCHURR, A. TORRONI, Y.-Y. CAN, J. A. HODGE et al., 1992 Southeast Asian mitochondrial DNA analysis reveals genetic continuity of ancient Mongoloid migrations. Genetics
BANDEI.T, H. J., P. FORSTER, B. C . SWS and M. B. RICHAROS, 1995 Mitochondrial portraits of human populations using median net- works. Genetics 141: 743-753.
BARBUJANI, G., and S. S. Sow. , 1990 Zones of sharp genetic change in Europe are also linguistic boundaries. Proc. Natl. Acad. Sci.
BARBUJANI, G., G. BERTOREILE, G. CAPITANI and R. SCOZZARI, 1995 Geographical structuring in the mtDNA of Italians. Proc. Natl. Acad. Sci. USA 92: 9171-9175.
BERTRANPETIT, J., J. SALA, F. WAFELL, P. A. UNDERHIIL, P. MORAL et al., 1995 Human mitochondrial DNAvariation and the origin of Basques. Ann. Hum. Genet. 59: 63-81.
BROCKINGTON, M., M. G. SWENEY, S. R. HAMMANS, J. A. MORGAN- HUGHES and A. WING, 1993 A tandem duplication in the D-loop of human mitochondrial DNAs is associated with dele- tions in mitochondrial myopathies. Nat. Genet. 4: 67-71.
CANN, R. L., M. STONEKING and A. C. WILSON, 1987 Mitochondrial DNA and human evolution. Nature 325: 31-36.
CAVALLI-SFORZA, L. L., and A. PIAZZA, 1993 Human genomic diver- sity in Europe: a summary of recent research and prospects for the future. Eur. J. Hum. Genet. 1: 3-18.
CAVALLI-SFORZZ, L. L., A. PIAZZA, P. MENOZZI and J. L. MOUNTAIN, 1988 Recon struction of human evolution: bringing together genetic, archaeological and linguistic data. Proc. Natl. Acad. Sci.
CAVALLI-SFORZA, L. L., P. MENOZZI and A. PIAZZA, 1994 The Histoly and Geography of Human Genes. Princeton University Press, Princeton, NJ.
CHEN, Y.S., A. TORRONI, L. EXCOFFIER, A. S. SANTACHIARA-BENERE CETTI and D. C . WALLACE, 1995 Analysis of mtDNA variation in African populations reveals the most ancient of all human continent-specific haplogroups. Am. J. Hum. Genet. 57: 133-149.
C o r n , D., S. P ~ o and J. BERTRANPETIT, 1995 Heteroplasmy in the control region of human mitochondrial DNA. Gen. Res. 5: 89-90.
DE BENEDICTIS, G., G. ROSE, G. PASSARINO and C. QUAGLIARELLO, 1989 Restriction fragment length polymorphism of human mi- tochondrial DNA in a sample population from Apulia (South Italy). Ann. Hum. Genet. 53: 311-318.
DE LA CHAPELLE, A., 1993 Disease gene mapping in isolated popula- tions: the example of Finland. J. Med. Genet. 30: 857-865.
DI RIENZO, A., and A. C. WILSON, 1991 Branching pattern in the
Acad. Sci. USA 88: 1597-1601. evolutionary tree for human mitochondrial DNA. Proc. Natl.
FELSENSTEIN, J., 1993 PHYLJP: Phylogeny Inference Package, version 3.5~. Distributed by the author. Department of Genetics, Univer- sity of Washington, Seattle.
FORSTER, P., R. HARDING, A. TORRONI and H. J. BANDELT, 1996 Ori-
130 139-152.
USA 87: 1816-1819.
USA 85: 6002-6006
1848 A. Torroni et al.
gin and evolution of Native American mtDNA variation: a r eap praisal. Am. J. Hum. Genet. 5 9 935-945.
FRANCAIACCI, P., J. BERTRANPETIT, F. WEI.I. and P. UNDERHILI., 1996 Sequence diversity of the control region of mitochondrial DNA in Tuscany and its implications for the peopling of Europe. Am. J. Phys. Anthropol. 100: 443-460.
GILES, R. E., H. BLANC, H. M. CANN and D. C. WALLACE, 1980 Mater- nal inheritance of human mitochondrial DNA. Proc. Natl. Acad. Sci. USA 77: 6715-6719.
GIMBUTAS, M., 1991 The Civilization ofthe Goddess. Harper, San Fran- cisco.
GRAVEN, L., G. PASSARINO, 0. SEMINO, P. BOURSOT, A. S. S~NTACHIARA- BENERECETTI et al., 1995 Evolutionary correlation between con- trol region sequence and restriction polymorphisms in the mito- chondrial genome of a large Senegalese Mandenka population. Mol. Biol. Evol. 12: 334-345.
HANDT, O., M. RICHARDS, M. TROMMSDORFF, C. KILGER, J. SIMANAINEN et al., 1994 Molecular genetic analyses of the Tyrolean Ice Man. Science 264: 1775-1778.
HEDGES, S. B., S. KUMAR, K. TAMURA and M . STONEKING, 1991 Hu- man origins and analysis of mitochondrial DNA sequences. Sci- ence 255: 737-739.
HORAI, S., R. KONDO, Y. NAKAGAWA-~TTORI, S. HAYASHI, S. SONODA et al., 1993 Peopling of the Americas, founded by four major lineages of mitochondrial DNA. Mol. Biol. Evol. 1 0 23-47.
HUTCHIN, T., and G. CORTOPASSI, 1995 A mitochondrial DNA clone is associated with increased risk for Alzheimer disease. Proc. Natl. Acad. Sci. USA 92: 6892-6895.
JUN, A. S., M. D. BROWN and D. C. WAI.IACE, 1994 A mitochondrial DNA mutation at nucleotide pair 14459 of the NADH dehydroge- nase subunit 6 gene associated with maternally inherited Leber hereditary optic neuropathy and dystonia. Proc. Natl. Acad. Sci.
KUMAR, S., K TAMURA and M. NEI, 1993 MEGA: MolecularEvolution- ary Genetics Analysis, version 1.01. The Pennsylvania State Univer- sity, University Park, PA.
LAUBER, J., C. MARSAC, B. KADENBACH and P. SEIBEL, 1991 Mutations in mitochondrial tRNA genes: a frequent cause of neuromuscu- lar diseases. Nucleic Acids Res. 19: 1393-1397.
LI, W.-H., and A. ZHARKIKI~, 1995 Statistical tests of DNA phyloge- nies. Syst. Biol. 44: 49-63.
MIYATA, T., H. HAYASHIDA, R. KIKUNO, M. HASEGAWA, M. KOBAYASHI et ab, 1982 Molecular clock of silent substitution: at least six- fold preponderance of silent changes in mitochondrial genes over those in nuclear genes. J. Mol. Evol. 19: 28-35.
MOUNTAIN, J. L., J. M. HEBERT, S. BHATTACHARYYA, P. A. UNDERHILL, C. OTTOLENGHI et al., 1994 Demographic history of India and mtDNAsequence diversity. Am. J. Hum. Genet. 56: 979-992.
NEI, M., and F. TAJIMA, 1983 Maximum likelihood estimation of the number of nucleotide substitutions from restriction site data. Genetics 105: 207-217.
PASSARINO, G., 0. SEMINO, L. F. BERNINI and A. S. SANTACHIARA- BENERECETTI, 1996 Pre-Caucasoid and Caucasoid genetic fea- tures of Indian population revealed by mtDNA polymorphisms. Am. J. Hum. Genet. 59: 927-934.
PIAZZA, A., 1993 Who are the Europeans? Science 260: 1767-1769. PIERCY, R., K M. SULLIVAN, N. BENSON and P. GILL 1993 The appli-
cation of mitochondrial DNA typing to the study of white Cauca- sian genetic identification. Int. J. Leg. Med. 106: 85-90.
RITTE, U., E. NEUFELD, F. M. PREGER, M. GROSS, I. HAIUM et al., 1993 Mitochondrial DNA affinities of several Jewish communities. Hum. Biol. 65: 359-385.
ROGERS, A. R., and H. HARPENDING, 1992 Population growth make waves in the distribution of pairwise genetic distances. Mol. Biol.
SAJANTIW, A,, P. LAHERMO, T. ANTINNEN, M. LUKKA, P. SISTONEN et al., 1995 Genes and languages in Europe: an analysis of mito- chondrial lineages. Gen. Res. 5: 42-52.
SANTACHIAM-BENERECETTI, A. S., R. SCOZZARI, 0. SEMINO, A. TOR- RONI, A. BREGA et al., 1988 Mitochondrial DNA polymorphisms in Italy. 11. Molecular analysis of new and rare morphs from Sardinia and Rome. Ann. Hum. Genet. 5 2 39-56.
SCHURR, T. G., S. W. BALLINGER, Y. Y. GAN, J. A. HODGE, D. A. MERRI- UTTHER et al., 1990 Amerindian mitochondrial DNAs have rare Asian mutations at high frequencies, suggesting they derived
USA 91: 6206-6210.
Evol. 9: 552-569.
from four primary maternal lineages. Am. J. Hum. Genet. 46: 613-623.
SEMINO, O., A. TORRONI, R. SCOZZARI, A. BREGA, G. DE BENEDICTIS et al., 1989 Mitochondrial DNA polymorphisms in Italy. 111. Population data from Sicily: a possible quantitation of maternal African anacestry. Ann. Hum. Genet. 53: 193-202.
SEMINO, O., A. TORRONI, R. SCOZZARI, A. BREGA and A. S. SANTACHIARA- BENERECETTI, 1991 Mitochondrial DNA polymorphisms among Hindus: a comparison with the Tharu of Nepal. Ann. Hum. Genet. 55: 123-136.
SHOFFNER, J. M., M. D. BROWN, A. TORRONI, M. T. L o n , M. CABELI. et al., 1993 Mitochondrial DNA variants observed in Alzheimer and Parkinson disease patients. Genomics 17: 171-184.
SOW-, R. R., N. L. ODEN and C. WILSON, 1991 Genetic evidence for the spread of agriculture in Europe by demic diffusion. Na- ture 351: 143-145.
SOO~YALI., H., L. VIGILANT, A. V. HILL, M. STONEKING and T. JENKINS, 1996 MtDNA control-region sequence variation suggests multi- ple independent origins of an “Asian-specific” 9-bp deletion in subsaharan Africans. Am. J. Hum. Genet. 5 8 595-608.
STONE, A. C., and M. STONEKING, 1993 Ancient DNA from a Pre- Columbian Amerindian population. Am. J. Phys. Anthropol. 92: 463-471.
STONEKING, M., 1995 Ancient DNA how do you know when you have it and what can you do with it? Am. J. Hum. Genet. 57:
STONEKING, M., L. B. JORDE, K. BHATIA and A. C. WILSON, 1990 Geo- graphic variation in human mitochondrial DNA from Papua New Guinea. Genetics 124: 717-733.
STONLKING, M., D. HEDGECOCK, R. G. HIGUCHI, L. VIGnAmand H. A. ERI.ICH, 1991 Population variation of human mtDNA control region sequences detected by enzymatic amplification and se- quence-specific oligonucleotide probes. Am. J. Hum. Genet. 4 8
SWOFFORD, D., 1993 Phylogenetic Analysis UsingParsimony (PACJP), Vm- sion 3.1.1. Illinois Natural History Survey, Champaign, IL.
TORRONI, A,, and D. C. WAILACE, 1994 MtDNA variation in human populations and implications for detection of mitochondrial DNA mutations of pathological significance. J. Bioenerg. Bio- memb. 26 261-271.
TORRONI, A,, 0. SEMINO, G. ROSE, G. DE BENEDICTIS, C. BRANCATI et al., 1990 Mitochondrial DNA polymorphisms in the Albanian population of Calabria (Southern Italy). Int. J. Anthropol. 5(2): 97-104.
TORRONI, A,, T. G. SCHURR, C.-C.YANG, E. J. E. SZATHMARY, R. C. WIL LIAMS et al., 1992 Native American mitochondrial DNA analysis indicates that the Amerind and the Nadene populations were founded by two independent migrations. Genetics 130 153-162.
TORRONI, A,, T. G. SCHURR, M. F. CABEI.I., M. D. BROWN, J. V. NEEL d al., 1993a Asian affinities and continental radiation of the four founding Native American mtDNAs. Am. J. Hum. Genet.
TORRONI, A,, R. I. SUKERNIK, T. G. SCHURR,Y. B. STARIKOVSKAYA, M. F. CAELL et al., 199313 MtDNA variation of Aboriginal Siberians reveals distinct genetic affinities with Native Americans. Am. J. Hum. Genet. 53: 591-608.
TORRONI, A.,Y.-S. CHEN, 0. SEMINO, A. S. SANTACHIARA-BENECERETTI, R. C. SCOTT et al., 1994a MtDNA and Y-chromosome polymor- phisms in four Native American populations from Southern Mex- ico. Am. J. Hum. Genet. 54: 303-318.
TORRONI, A,, M. T. L o n , M. F. CABELL, Y.4. CHEN, L. LAVERGNE et al., 1994b MtDNA and the origin of Caucasians. Identification of ancient Caucasian-specific haplogroups, one ofwhich is prone to a recurrent somatic duplication in the D-loop region. Am. J. Hum. Genet. 5 5 760-776.
TORRONI, A,, J. A. MII.LER, L. G. MOORE, S. ZAMUDIO, J. ZHUANG et al., 1994c Mitochondrial DNA analysis in Tibet. Implications for the origin of the Tibetan population and its adaptation to high altitude. Am. J. Phys. Anthropol. 93: 189-199.
TORRONI, A., J. V. NEEI,, R. BARRANTES, T. G. SCHURR and D. C. WAL LACE, 1994d A mitochondrial DNA “Clock” for the Amerinds and its implications for timing their entry into North America. Proc. Natl. Acad. Sci. USA 91: 1158-1162.
TORRONI, A,, V. CAREI.I.I , M. PETROZZI, M. TERRACINA, P. BARBONI et al., 1996 Detection of the mtDNA 14484 mutation on an African-specific haplotype. Implications about its role in causing
1259-1262.
370-382.
5 3 563-590.
mtDNA Variation in Europeans 1849
Leber hereditary optic neuropathy. Am. J. Hum. Genet. 5 9 248- WALLACE, D. C., 1995 Mitochondrial DNA variation in human evo- 252. lution, degenerative disease, and aging. Am. J. Hum. Genet. 57:
VIGILANT, L., R. PENNINGTON, H. W E N D I N G , T. D. KOCHER and 201-223. A. C. WILSON, 1989 Mitochondrial DNA sequences in single WALLACE, D. c.9 J. H. YE, s. N. NECKELM, G. SINGH, K. A. WEBsTER hairs from a southern African population. Proc. Natl. Acad. Sci. et aZ., 1987 Sequence analysis of cDNAs for the human and
bovine ATP synthase beta subunit: mitochondrial DNA genes substain seventeen times more mutations. Curr. Genet. 12: 81-
USA 86 9350-9354. VIGILANT, L., M. STONEKING, H. HARPENDING, K. HAWKES and A. C. nn
WILSON, 1991 African populations and the evolution of human mitochondrial DNA. Science 253: 1503-1507.
WAKELEY, J., 1993 Substitution rate variation among sites in hyper- variable region I of human mitochondrial DNA..]. Mol. Evol. 37:
YU.
WARD, R. H., B. L. FRAZIER, K. DEW-JAGER and S. PAABO, 1991 Exten- sive mitochondrial diversity within a single Amerindian tribe. Proc. Natl. Acad. Sci. USA 88: 8720-8724.
- 613-623. Communicating editor: W.-H. LI
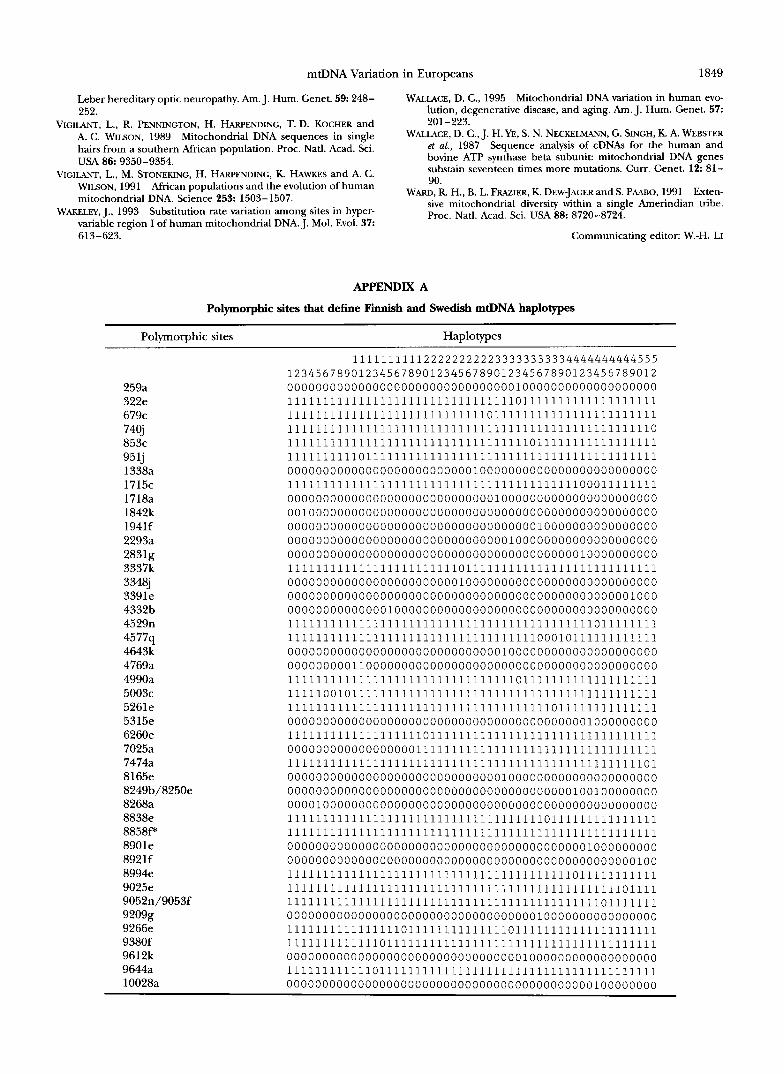
APPENDIX A
Polymorphic sites that define Finnish and Swedish mtDNA haplotypes
Polymorphic sites Haplotypes
259a 322e 679c 740j 853c 95 lj 1338a 1715c 1718a 1842k 1941f 2293a 2831g 3337k 3348j 3391e 4332b 4529n
4643k 4769a 4990a 5003c 5261e 5315e 6260e 7025a 7474a 8165e 8249b/8250e 8268a 8838e 8858P 8901e 8921f 8994e 9025e 9052n/9053f 92098 9266e 9380f 9612k 9644a 10028a
4577q
1 1 1 1 1 1 1 1 1 1 2 2 2 2 2 2 2 2 2 2 3 3 3 3 3 3 3 3 3 3 4 4 4 4 4 4 4 4 4 4 5 5 5 1234567890123456789012345678901234567890123456789012 0000000000000000000000000000000010000000000000000000 1 1 1 1 1 1 1 1 1 1 1 1 1 1 1 1 1 1 1 1 1 1 1 1 1 1 1 1 1 1 1 1 0 1 1 1 1 1 1 1 1 1 1 1 1 1 1 1 1 1 1 1 1111111111111111111111111111011111111111111111111111 1111111111111111111111111111111111111111111111111110 1111111111111111111111111111111111011111111111111111 1111111111011111111111111111111111111111111111111111 0000000000000000000000000010000000000000000000000000 1111111111111111111111111111111111111111100011111111 0000000000000000000000000000010000000000000000000000 0010000000000000000000000000000000000000000000000000 0000000000000000000000000000000000010000000000000000 0000000000000000000000000000000100000000000000000000 0000000000000000000000000000000000000000010000000000 1111111111111111111111110111111111111111111111111111 0000000000000000000000001000000000000000000000000000 0000000000000000000000000000000000000000000000001000 0000000000000010000000000000000000000000000000000000 1111111111111111111111111111111111111111111011111111 1111111111111111111111111111111111100010111111111111 0000000000000000000000000000001000000000000000000000 0000000001100000000000000000000000000000000000000000 1111111111111111111111111111111101111111111111111111 1111100101111111111111111111111111111111111111111111 1111111111111111111111111111111111111011111111111111 0000000000000000000000000000000000000000001000000000 1111111111111111111011111111111111111111111111111111 0000000000000000001111111111111111111111111111111111 1111111111111111111111111111111111111111111111111101 0000000000000000000000000000001000000000000000000000 0000000000000000000000000000000000000000100100000000 0000100000000000000000000000000000000000000000000000 1111111111111111111111111111111111110111111111111111 1111111111111111111111111111111111111111111111111111 0000000000000000000000000000000000000000001000000000 0000000000000000000000000000000000000000000000000100 1111111111111111111111111111111111111111011111111111 1111111111111111111111111111111111111111111111101111 1111111111111111111111111111111111111111111101111111 0000000000000000000000000000000000010000000000000000 1111111111111111011111111111111011111111111111111111 1111111111111011111111111111111111111111111111111111 0000000000000000000000000000000001000000000000000000 1111111111110111111111111111111111111111111111111111 0000000000000000000000000000000000000000000100000000
1850 A. Torroni et ul.
TABLE APPENDIX A
Continued
Polimorphic sites Haplotypes
10097a 10394c 10397a 10746~ 11 196k 123088 12406h 12679j 12891c 13103g/13104j 1332513 13366m/13367i/13367b 13651 13702e* 13704p 137308 13968j 14015a 140681 141990” 14268g* 14347k 14368g* 14493c 14855c 15172e 15254r 15606a 15754c 15872k 15882b/15883e 15925i 16049k 16065g 161431 16145e 161 70j 16215j 162241 1630313 16389g/16390b 16389m/1639Oj/16390b 16398e 164531 16517e
0001000000000000000000000000000000000000000000000000 00000000000000000000000000000000000000000001~1~~~1~~ 000000000000000000000000000000000000000000000000000~ 0000000000000000000001000000000000000000000000000000 0000000000000000000000000000000001000000000000000000 00000000000000000000000111111111l1100000000010000000 111111111111111111110111l11l11l111111111~111~~~11111 0000000000000000000000000000000000000000100000000000 11 1 1 1 1 1 1 1 1 1 1 1 1 1 1 1 1 1 1 l l l l l l l l l l l l l l l l l l l l ~ l l ~ ~ ~ l l l o l l 1 1 1 1 1 1 1 1 1 1 1 1 1 1 1 1 1 1 1 1 l l l 1 l l l l l l l l o l l l l l l l l l ~ ~ l ~ l l l ~ l l 1 1 1 1 1 1 1 0 1 1 1 1 1 1 1 1 1 1 1 1 l l l l l l l l l l l l l l l l l l l 1 1 ~ ~ ~ ~ 1 1 ~ 1 1 ~ ~ 0000000000000000001111100000000000000000000000000000 0000000000000000000000000000010000000000000000000000 0000000000000000000000000000000000000000000000000000 11111111111111111111lllllllllllllllllllllllllooooool 0000000000000000000000000000000001100000000000000000 0000000000000000000000000000000100000000000000000000 11 1 1 1 1 1 1 1 1 1 1 1 1 1 1 1 1 1 1 l l l l l l l l l l l l l l l l l l l o l ~ l l l ~ l l ~ l l l 0000000000000000000000000000000010000000000000000000 0000000000000000000000000000000000000000000000000000 1 1 1 1 1 1 1 1 1 1 1 1 1 1 1 1 1 1 1 1 l l l l l l l l l l l l l l l l l l l l ~ ~ l ~ l ~ ~ l l l l l 0000001010000000000000000000000000000000000000000000 0000000000000000000000000000000000000000000000000000 0000000000000001000000000000000000000000000000000000 0000000000000000000000000000010000000000000000000000 11111111111111111111llllllllllllllolllll~llll~llllll 11111111111111111111lllllllllllllllllllll~llllll~lol 00000000000000000011 l1100000000000000000000000000000 0000000000000000000000000000000000000000000100000000 0000000000000000000000000000000001100000000000000000 0000001000000000000000000000000000000000000000000000 11111111111111111100000lll1l111111111111~1111~~11111 11111111111111111011ll1l111lllll1111lll1~11~11111111 11111111111111111111lllllllllllllllllllll~lllooooool 00000000000000000000000001l0000000000000000000000000 0000000000000000000000000000100000000000000000000000 0000000000010000000000000000000000000000000000000000 0000000000000000100000000000000000000000000000000000 000000000000000000000000l000000000000000000000000000 11111111111111oo1111loolllllllllllllllllllllllllllll 0000000000000000000000000000000100000000000000000000 0000000000000000000000000000000000000000000~00000000 0000000000000000000000011000000000000000000000000000 1 1 1 1 1 1 1 1 1 1 1 1 1 1 1 1 1 1 1 1 l l l l l l l l l l l l l o o l l l l l l ~ l l ~ ~ l ~ l l ~ l 0 1 1 1 1 0 0 1 0 0 0 1 0 0 0 0 1 1 1 1 l l 1 0 0 0 0 0 0 0 1 1 0 l l 0 0 0 0 0 ~ 1 1 ~ 1 1 0 0 0 ~ 0 1
The 84 polymorphic sites that define 52 distinct mtDNA haplotypes (El-E52) observed in 49 Finns and 37 Swedes. A “1” indicates the presence of a site and a “0” indicates the absence of a site. Sites are numbered from the first nucleotide of the recognition sequence according to the published sequence (ANDERSON et ut. 1981). The restriction enzymes used in the analysis are designated by the following single-letter code: a, AluI; b, AvuII; c, DdeI; e, HueIII; f, Hhd; g, H i d ; h, HpuI; i, HpuII; j , MboI; k, RsuI; 1, TuqI; m, BumHI; n, HueII; 0, HzncII; p, BstNI; q, NlaIII; r, AccI. Sites separated by a diagonal line indicate either simultaneous site gains or site losses for two different enzymes or a site gain for one enzyme and a site loss for another because of a single inferred nucleotide substitution. Such sites are considered to be only one restriction site polymorphism in the parsimony analysis. Sites marked with an asterisk were found to be present or absent in all samples contrary to the published sequence.


![On the internal classification of Indo-European languages · On the internal classification of Indo-European languages: survey[*] Václav Blažek The main purpose of the present study](https://img.pdfslide.us/doc/110x75/5ec18dee2941b5019103c57e/on-the-internal-classification-of-indo-european-on-the-internal-classification-of.jpg)