Embed Size (px)
Citation preview
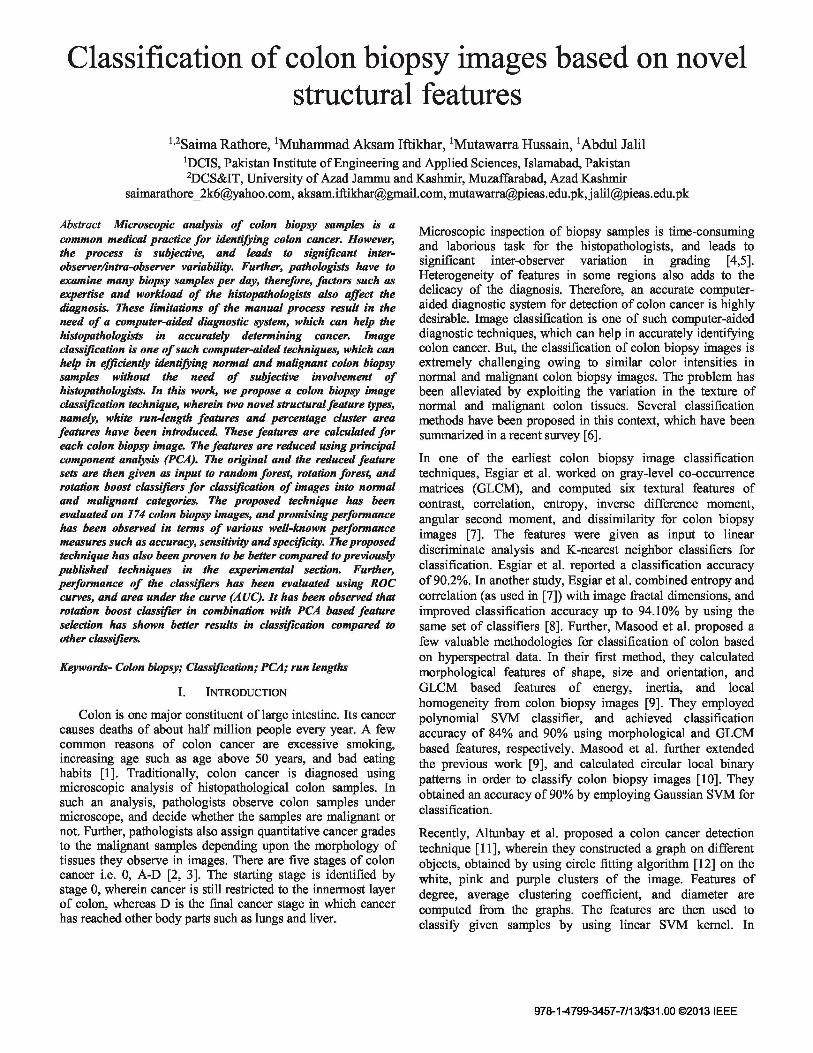
Classification of colon biopsy images based on novel structural features
1,2Saima Rathore, 'Muhammad Aksam Iftikhar, 'Mutawarra Hussain, 'Abdul Jalil 'DCIS, Pakistan Institute of Engineering and Applied Sciences, Islamabad, Pakistan 2DCS&IT, University of Azad Jammu and Kashmir, Muzaffarabad, Azad Kashmir
[email protected], [email protected], [email protected],[email protected]
Abstract—Microscopic analysis of colon biopsy samples is a common medical practice for identifying colon cancer. However, the process is subjective, and leads to significant inter-observerAntra-observer variability. Further, pathologists have to examine many biopsy samples per day, therefore, factors such as expertise and workload of the histopathologists also affect the diagnosis. These limitations of the manual process result in the need of a computer-aided diagnostic system, which can help the histopathologists in accurately determining cancer. Image classification is one of such computer-aided techniques, which can help in efficiently identifying normal and malignant colon biopsy samples without the need of subjective involvement of histopathologists. In this work, we propose a colon biopsy image classification technique, wherein two novel structural feature types, namely, white run4ength features and percentage cluster area features have been introduced. These features are calculated for each colon biopsy image. The features are reduced using principal component analysis (PCA). The original and the reduced feature sets are then given as input to random forest, rotation forest, and rotation boost classifiers for classification of images into normal and malignant categories. The proposed technique has been evaluated on 174 colon biopsy images, and promising performance has been observed in terms of various well-known performance measures such as accuracy, sensitivity and specificity. The proposed technique has also been proven to be better compared to previously published techniques in the experimental section. Further, performance of the classifiers has been evaluated using ROC curves, and area under the curve (AUC). It has been observed that rotation boost classifier in combination with PCA based feature selection has shown better results in classification compared to other classifiers.
Keywords- Colon biopsy; Classification; PCA; run lengths
I. INTRODUCTION
Colon is one major constituent of large intestine. Its cancer causes deaths of about half million people every year. A few common reasons of colon cancer are excessive smoking, increasing age such as age above 50 years, and bad eating habits [1], Traditionally, colon cancer is diagnosed using microscopic analysis of histopathological colon samples. In such an analysis, pathologists observe colon samples under microscope, and decide whether the samples are malignant or not. Further, pathologists also assign quantitative cancer grades to the malignant samples depending upon the morphology of tissues they observe in images. There are five stages of colon cancer i.e. 0, A-D [2, 3]. The starting stage is identified by stage 0, wherein cancer is still restricted to the innermost layer of colon, whereas D is the final cancer stage in which cancer has reached other body parts such as lungs and liver.
Microscopic inspection of biopsy samples is time-consuming and laborious task for the histopathologists, and leads to significant inter-observer variation in grading [4,5]. Heterogeneity of features in some regions also adds to the delicacy of the diagnosis. Therefore, an accurate computer-aided diagnostic system for detection of colon cancer is highly desirable. Image classification is one of such computer-aided diagnostic techniques, which can help in accurately identifying colon cancer. But, the classification of colon biopsy images is extremely challenging owing to similar color intensities in normal and malignant colon biopsy images. The problem has been alleviated by exploiting the variation in the texture of normal and malignant colon tissues. Several classification methods have been proposed in this context, which have been summarized in a recent survey [6].
In one of the earliest colon biopsy image classification techniques, Esgiar et al. worked on gray-level co-occurrence matrices (GLCM), and computed six textural features of contrast, correlation, entropy, inverse difference moment, angular second moment, and dissimilarity for colon biopsy images [7]. The features were given as input to linear discriminate analysis and K-nearest neighbor classifiers for classification. Esgiar et al. reported a classification accuracy of 90.2%. In another study, Esgiar et al. combined entropy and correlation (as used in [7]) with image fractal dimensions, and improved classification accuracy up to 94.10% by using the same set of classifiers [8]. Further, Masood et al. proposed a few valuable methodologies for classification of colon based on hyperspectral data. In their first method, they calculated morphological features of shape, size and orientation, and GLCM based features of energy, inertia, and local homogeneity from colon biopsy images [9]. They employed polynomial SVM classifier, and achieved classification accuracy of 84% and 90% using morphological and GLCM based features, respectively. Masood et al. further extended the previous work [9], and calculated circular local binary patterns in order to classify colon biopsy images [10]. They obtained an accuracy of 90% by employing Gaussian SVM for classification.
Recently, Altunbay et al. proposed a colon cancer detection technique [11], wherein they constructed a graph on different objects, obtained by using circle fitting algorithm [12] on the white, pink and purple clusters of the image. Features of degree, average clustering coefficient, and diameter are computed from the graphs. The features are then used to classify given samples by using linear SVM kernel. In
978-1-4799-3457-7/13/$31.00 ©2013 IEEE
addition, Özdemir et al. presented a method [13] in which reference graphs of a few normal images are generated by employing previously proposed method of graph creation [14], and are stored. Some query graphs are generated from the test images, and are searched in the reference graphs. Three most similar graphs are found in the reference images. Finally, normal or malignant class is assigned to the test sample based on the degree of similarity of the query graph with the three most similar graphs.
The techniques summarized so far yield reasonable classification success, however, they suffer a few drawbacks. First, some of these techniques are computationally non-tractable, and consume considerable CPU time. Second, some of the techniques have been designed for images captured at a particular magnification factors, and cannot perform well at other magnification factors. Third, these techniques require manual adjustment of system parameters. Fourth, most of the techniques are deficient in terms of discriminating features.
In this research, we propose a novel colon biopsy image classification technique. The proposed technique is simple and straightforward. It not only shows its superiority in terms of classification accuracy, but is computationally tractable as well. In the proposed technique, two novel structural feature types, namely, white run-lengths (WRL) and cluster percentage area (CPA) based features have been introduced. The features are large in size, therefore, are reduced using PCA. The original and the reduced features are then employed to classify colon biopsy images into normal and malignant classes. Three classification algorithms, namely, random forest, rotation forest, and rotation boost have been employed for classification.
The rest of the paper is structured as follows. Section II presents the proposed technique in detail. Section III provides information on performance evaluation measures. Section IV presents experiments, and Section V concludes the paper.
II. PROPOSED METHODOLOGY
The proposed technique comprises four steps, namely, (1) pre-processing, (2) feature extraction, (3) feature selection, and lastly, (4) classification of colon into normal and malignant classes. Figure 1 presents top-level layout of the proposed technique, and the following text explains these steps in detail.
Colon image database
Normal/Malignant
Figure 1: Top-level layout of the proposed technique
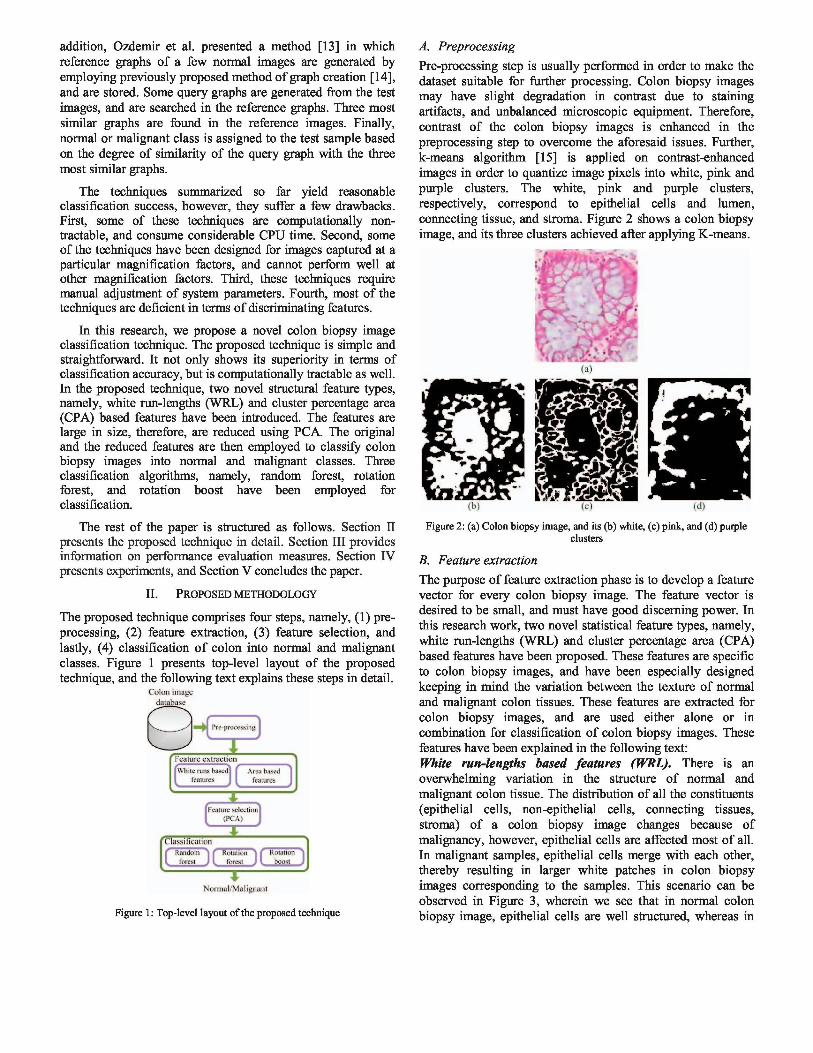
A. Preprocessing Pre-processing step is usually performed in order to make the dataset suitable for further processing. Colon biopsy images may have slight degradation in contrast due to staining artifacts, and unbalanced microscopic equipment. Therefore, contrast of the colon biopsy images is enhanced in the preprocessing step to overcome the aforesaid issues. Further, k-means algorithm [15] is applied on contrast-enhanced images in order to quantize image pixels into white, pink and purple clusters. The white, pink and purple clusters, respectively, correspond to epithelial cells and lumen, connecting tissue, and stroma. Figure 2 shows a colon biopsy image, and its three clusters achieved after applying K-means.
(a)
(b) (c) (d)
Figure 2: (a) Colon biopsy image, and its (b) white, (c) pink, and (d) purple clusters
B. Feature extraction The purpose of feature extraction phase is to develop a feature vector for every colon biopsy image. The feature vector is desired to be small, and must have good discerning power. In this research work, two novel statistical feature types, namely, white run-lengths (WRL) and cluster percentage area (CPA) based features have been proposed. These features are specific to colon biopsy images, and have been especially designed keeping in mind the variation between the texture of normal and malignant colon tissues. These features are extracted for colon biopsy images, and are used either alone or in combination for classification of colon biopsy images. These features have been explained in the following text: White run-lengths based features (WRL). There is an overwhelming variation in the structure of normal and malignant colon tissue. The distribution of all the constituents (epithelial cells, non-epithelial cells, connecting tissues, stroma) of a colon biopsy image changes because of malignancy, however, epithelial cells are affected most of all. In malignant samples, epithelial cells merge with each other, thereby resulting in larger white patches in colon biopsy images corresponding to the samples. This scenario can be observed in Figure 3, wherein we see that in normal colon biopsy image, epithelial cells are well structured, whereas in
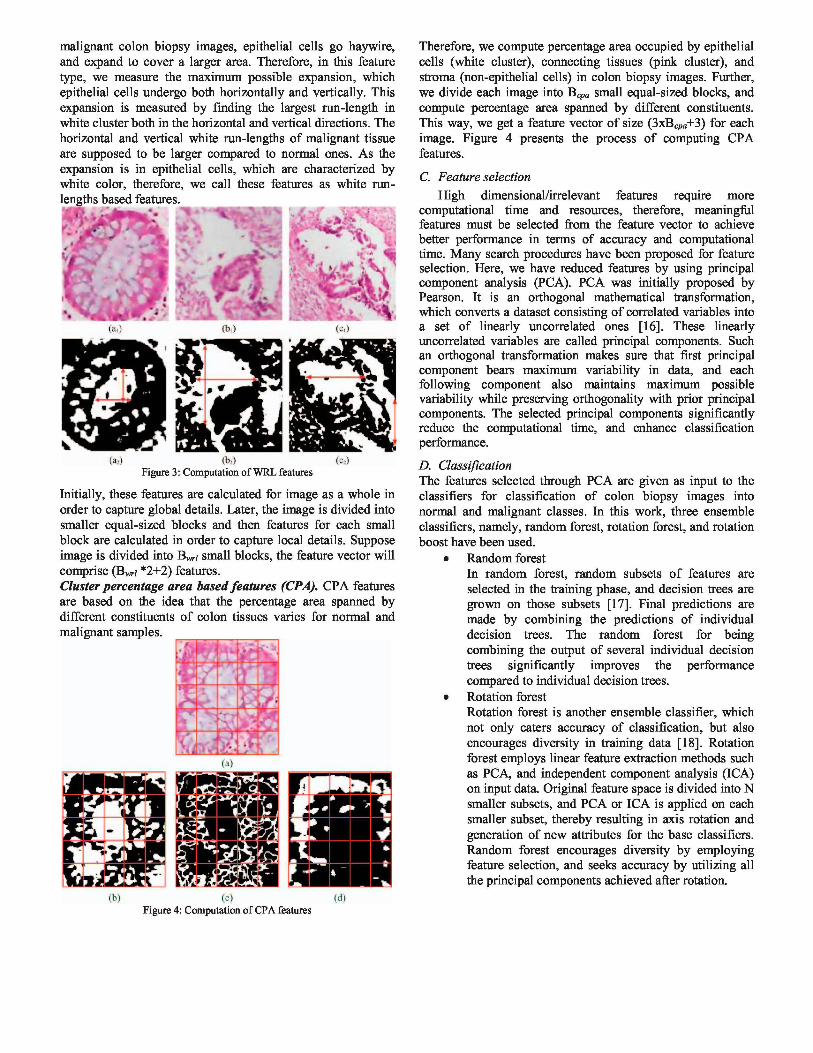
malignant colon biopsy images, epithelial cells go haywire, and expand to cover a larger area. Therefore, in this feature type, we measure the maximum possible expansion, which epithelial cells undergo both horizontally and vertically. This expansion is measured by finding the largest run-length in white cluster both in the horizontal and vertical directions. The horizontal and vertical white run-lengths of malignant tissue are supposed to be larger compared to normal ones. As the expansion is in epithelial cells, which are characterized by white color, therefore, we call these features as white run-lengths based features.
(ai) (b;) fe) Figure 3: Computation of WRL features
Initially, these features are calculated for image as a whole in order to capture global details. Later, the image is divided into smaller equal-sized blocks and then features for each small block are calculated in order to capture local details. Suppose image is divided into B w ; small blocks, the feature vector will comprise (Bw ; *2+2) features. Cluster percentage area based features (CPA). CPA features are based on the idea that the percentage area spanned by different constituents of colon tissues varies for normal and malignant samples.
Therefore, we compute percentage area occupied by epithelial cells (white cluster), connecting tissues (pink cluster), and stroma (non-epithelial cells) in colon biopsy images. Further, we divide each image into Bcpa small equal-sized blocks, and compute percentage area spanned by different constituents. This way, we get a feature vector of size (3xBcpa+3) for each image. Figure 4 presents the process of computing CPA features.
C. Feature selection High dimensional/irrelevant features require more
computational time and resources, therefore, meaningful features must be selected from the feature vector to achieve better performance in terms of accuracy and computational time. Many search procedures have been proposed for feature selection. Here, we have reduced features by using principal component analysis (PCA). PCA was initially proposed by Pearson. It is an orthogonal mathematical transformation, which converts a dataset consisting of correlated variables into a set of linearly uncorrelated ones [16]. These linearly uncorrelated variables are called principal components. Such an orthogonal transformation makes sure that first principal component bears maximum variability in data, and each following component also maintains maximum possible variability while preserving orthogonality with prior principal components. The selected principal components significantly reduce the computational time, and enhance classification performance.
D. Classification The features selected through PCA are given as input to the classifiers for classification of colon biopsy images into normal and malignant classes. In this work, three ensemble classifiers, namely, random forest, rotation forest, and rotation boost have been used.
• Random forest In random forest, random subsets of features are selected in the training phase, and decision trees are grown on those subsets [17]. Final predictions are made by combining the predictions of individual decision trees. The random forest for being combining the output of several individual decision trees significantly improves the performance compared to individual decision trees.
• Rotation forest Rotation forest is another ensemble classifier, which not only caters accuracy of classification, but also encourages diversity in training data [18]. Rotation forest employs linear feature extraction methods such as PCA, and independent component analysis (ICA) on input data. Original feature space is divided into N smaller subsets, and PCA or ICA is applied on each smaller subset, thereby resulting in axis rotation and generation of new attributes for the base classifiers. Random forest encourages diversity by employing feature selection, and seeks accuracy by utilizing all the principal components achieved after rotation.
(b) (c) (d) Figure 4: Computation of CPA features
• Rotation boost Rotation boost is also an ensemble classifier strategy [19] developed by aggregating the rotation matrix concept of rotation forest, and weight updation mechanism of AdaBoost. It works in a sequential manner, wherein a base classifier is trained by considering the performance of previous base classifiers. Initially, equal weights are assigned to all the training samples. However, in succeeding iterations, weights are updated in such a way that more weight is given to the samples which are misclassified in previous iteration, and less weight is given to the samples, which are correctly classified in previous iteration. This way, rotation boost deals with hard samples quite intelligently.
III. PERFORMANCE EVALAUTTON MEASURES
Classification performance has been measured in terms of the following well-known performance measures. Accuracy is a measure of overall usefulness of the classification technique. It can be calculated by
TP+TN Accuracy = xlOO TP+FP+TN+FN
where true positive (TP), true negative (TN) are the number of correctly classified positive and negative samples, respectively. Similarly, false positive (FP) and false negative (FN) are incorrectly classified negative and positive samples, respectively. Sensitivity is the ability of a classifier to recognize patterns of positive class. It can be calculated by c . . . TP Sensitivity =
TP+FN Specificity is the ability of a classifier to recognize patterns of negative class. It can be calculated by
TN Specificity = F TN+FP
The values of sensitivity and specificity range between 0 and 1, where 0 is the worst possible and 1 is the best possible value. Similarly, the value of accuracy ranges between 0 and 100, where 0 and 100, respectively, correspond to worst and best accuracy values.
IV. EXPERIMENTAL RESULTS
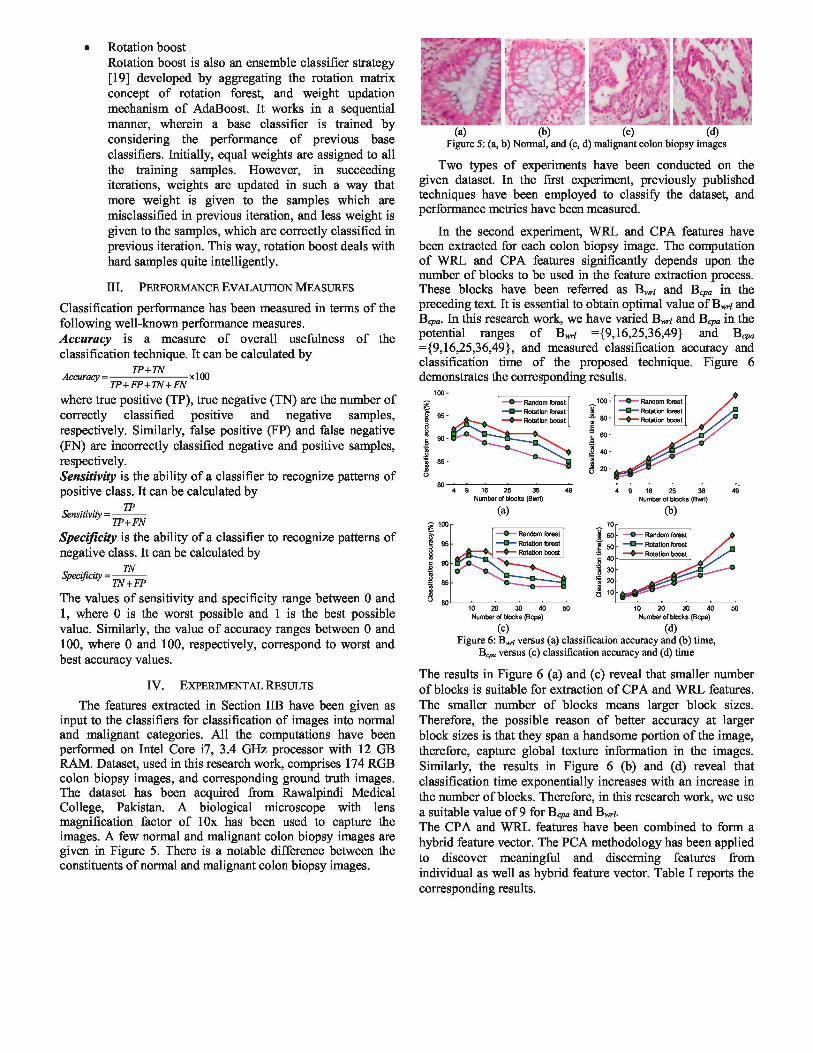
The features extracted in Section IIB have been given as input to the classifiers for classification of images into normal and malignant categories. All the computations have been performed on Intel Core il, 3.4 GHz processor with 12 GB RAM. Dataset, used in this research work, comprises 174 RGB colon biopsy images, and corresponding ground truth images. The dataset has been acquired from Rawalpindi Medical College, Pakistan. A biological microscope with lens magnification factor of lOx has been used to capture the images. A few normal and malignant colon biopsy images are given in Figure 5. There is a notable difference between the constituents of normal and malignant colon biopsy images.
(a) Figure 5: (a,
Two types of experiments have been conducted on the given dataset. In the first experiment, previously published techniques have been employed to classify the dataset, and performance metrics have been measured.
In the second experiment, WRL and CPA features have been extracted for each colon biopsy image. The computation of WRL and CPA features significantly depends upon the number of blocks to be used in the feature extraction process. These blocks have been referred as B w ; and Bcpa in the preceding text. It is essential to obtain optimal value of B w ; and Bapa. In this research work, we have varied B w ; and Bcpa in the potential ranges of B w ; ={9,16,25,36,49} and B cpa ={9,16,25,36,49}, and measured classification accuracy and classification time of the proposed technique. Figure 6 demonstrates the corresponding results.
Random forest
- Rotation forest
- Rotation boost
16 25 36 Number of blocks (Bwrl)
(a)
— • — Random forest
95 — • — Rotation forest
16 25 36 Number of b locks (Bwrl)
(b)
I — Random forest
i — Rotation forest
>— Rotation boost
10 20 30 4 0 Number of blocks (Bcpa)
10 20 30 4 0 Number of blocks (Bcpa)
(C) (d) Figure 6: B*,; versus (a) classification accuracy and (b) time,
Bcpa versus (c) classification accuracy and (d) time
The results in Figure 6 (a) and (c) reveal that smaller number of blocks is suitable for extraction of CPA and WRL features. The smaller number of blocks means larger block sizes. Therefore, the possible reason of better accuracy at larger block sizes is that they span a handsome portion of the image, therefore, capture global texture information in the images. Similarly, the results in Figure 6 (b) and (d) reveal that classification time exponentially increases with an increase in the number of blocks. Therefore, in this research work, we use a suitable value of 9 for B cpa and Bw;. The CPA and WRL features have been combined to form a hybrid feature vector. The PCA methodology has been applied to discover meaningful and discerning features from individual as well as hybrid feature vector. Table I reports the corresponding results.
t & u í i .
c k - P^r F ^ s t S M
(b) (c) (d) b) Normal, and (c, d) malignant colon biopsy images
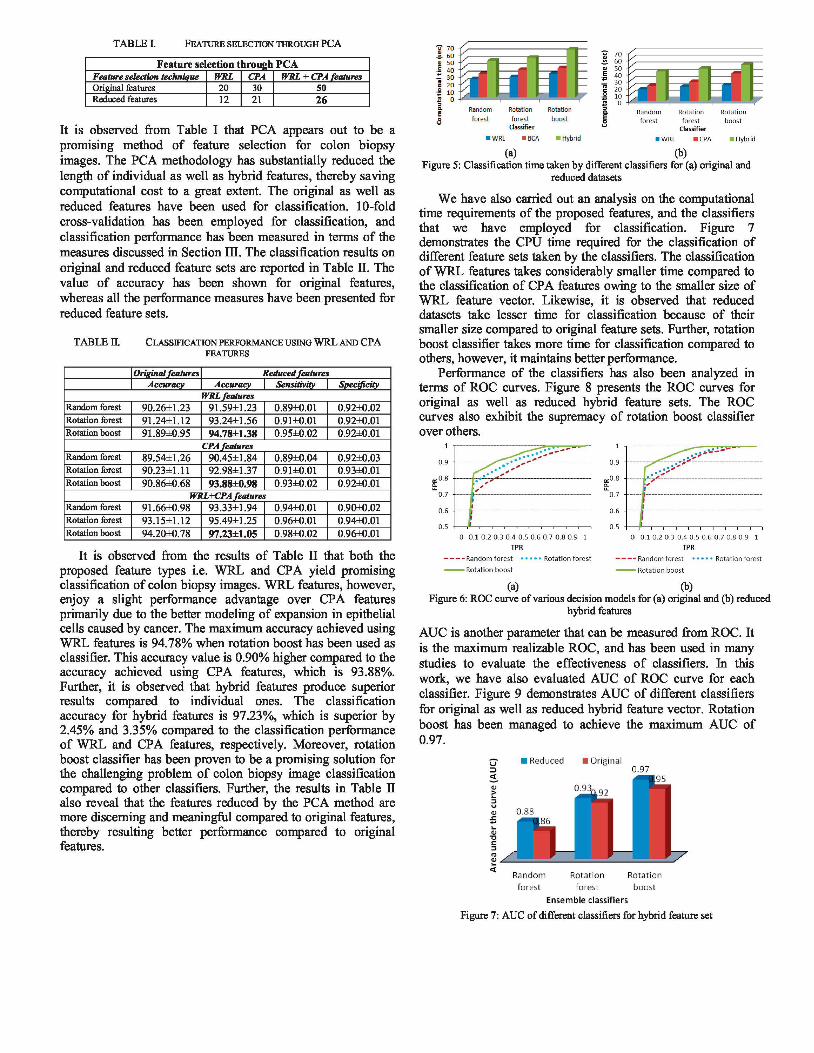
T A B L E I. FEATURE SELECTION THROUGH P C A
Feature selection through PCA Feature selection technique WRL CPA WRL + CPA features Original features 20 30 50 Reduced features 12 21 26
It is observed from Table I that PCA appears out to be a promising method of feature selection for colon biopsy images. The PCA methodology has substantially reduced the length of individual as well as hybrid features, thereby saving computational cost to a great extent. The original as well as reduced features have been used for classification. 10-fold cross-validation has been employed for classification, and classification performance has been measured in terms of the measures discussed in Section in. The classification results on original and reduced feature sets are reported in Table H. The value of accuracy has been shown for original features, whereas all the performance measures have been presented for reduced feature sets.
T A B L E n. CLASSIFICATION PERFORMANCE USING W R L AND C P A FEATURES
Original features Reducedfeatures Accuracy Accuracy Sensitivity Specificity
WRL features Random forest 90.26±1.23 91.59il.23 0.89i0.01 0.92i0.02 Rotation forest 91.24±1.12 93.24il.56 0.9Ü0.01 0.92i0.01 Rotation boost 91.8940.95 94.78il.38 0.95i0.02 0.92i0.01
CPA features Random forest 89.54±1.26 90.45il.84 0.89i0.04 0.92i0.03 Rotation forest 90.23il . l l 92.98il.37 0.9Ü0.01 0.93i0.01 Rotation boost 90.86i0.68 93.88i0.98 0.93i0.02 0.92i0.01
WRL+CPAfeatures Random forest 91.66i0.98 93.33il.94 0.94i0.01 0.90i0.02 Rotation forest 93.15il.12 95.49il.25 0.96i0.01 0.94i0.01 Rotation boost 94.20i0.78 97.23il.05 0.98i0.02 0.96i0.01
It is observed from the results of Table II that both the proposed feature types i.e. WRL and CPA yield promising classification of colon biopsy images. WRL features, however, enjoy a slight performance advantage over CPA features primarily due to the better modeling of expansion in epithelial cells caused by cancer. The maximum accuracy achieved using WRL features is 94.78% when rotation boost has been used as classifier. This accuracy value is 0.90% higher compared to the accuracy achieved using CPA features, which is 93.88%. Further, it is observed that hybrid features produce superior results compared to individual ones. The classification accuracy for hybrid features is 97.23%, which is superior by 2.45% and 3.35% compared to the classification performance of WRL and CPA features, respectively. Moreover, rotation boost classifier has been proven to be a promising solution for the challenging problem of colon biopsy image classification compared to other classifiers. Further, the results in Table II also reveal that the features reduced by the PCA method are more discerning and meaningful compared to original features, thereby resulting better performance compared to original features.
¥¡§fe —• - i T =
i M M M , S u 1 1 1 r so F I Random Rotation Rotation | Random Rotation Rotation 3 forest forest boost g f o r e s t forest boost
Classifier u Classifier • WRL • BCA • Hybrid • WRL «CPA «Hybrid
(a) (b)
Figure 5: Classification time taken by different classifiers for (a) original and reduced datasets
We have also carried out an analysis on the computational time requirements of the proposed features, and the classifiers that we have employed for classification. Figure 7 demonstrates the CPU time required for the classification of different feature sets taken by the classifiers. The classification of WRL features takes considerably smaller time compared to the classification of CPA features owing to the smaller size of WRL feature vector. Likewise, it is observed that reduced datasets take lesser time for classification because of their smaller size compared to original feature sets. Further, rotation boost classifier takes more time for classification compared to others, however, it maintains better performance.
Performance of the classifiers has also been analyzed in terms of ROC curves. Figure 8 presents the ROC curves for original as well as reduced hybrid feature sets. The ROC curves also exhibit the supremacy of rotation boost classifier over others.
0 . 9
0 0 . 1 0 . 2 0 .3 0 . 4 0 . 5 0 . 6 0 .7 0 . 8 0 . 9 1 0 0 . 1 0 . 2 0 .3 0 . 4 0 .5 0 .6 0 . 7 0 . 8 0 .9 1
TPR TPR
Random forest • • • • • Rotation forest Random forest • • • • • Rotation forest
Rotation boost Rotation boost
(a) (b) Figure 6: ROC curve of various decision models for (a) original and (b) reduced
hybrid features
AUC is another parameter that can be measured from ROC. It is the maximum realizable ROC, and has been used in many studies to evaluate the effectiveness of classifiers. In this work, we have also evaluated AUC of ROC curve for each classifier. Figure 9 demonstrates AUC of different classifiers for original as well as reduced hybrid feature vector. Rotation boost has been managed to achieve the maximum AUC of 0.97.
r? • Reduced • Original 3 0.97
Random Rotation Rotation
forest forest boost
Ensemble classifiers
Figure 7: AUC of different classifiers for hybrid feature set
Random Rotation Rotation forest forest boost
Classifier
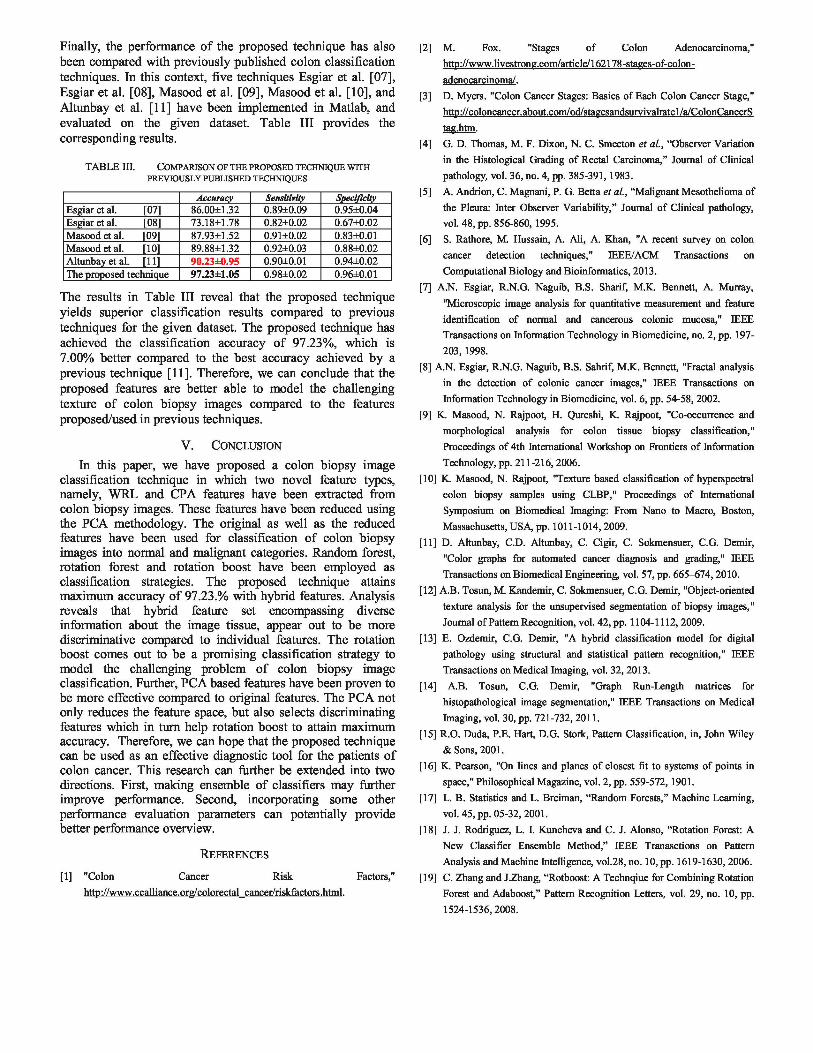
Finally, the per formance of the proposed technique has also been compared with previously published colon classification techniques. In this context, five techniques Esgiar et al. [07], Esgiar et al. [08], Masood et al. [09], Masood et al. [10], and Altunbay et al. [11] have been implemented in Matlab, and evaluated on the given dataset. Table III provides the corresponding results.
T A B L E i n . COMPARISON OF THE PROPOSED TECHNIQUE WITH PREVIOUSLY PUBLISHED TECHNIQUES
Accuracy Sensitivity Specificity Esgiar et al. [07] 86.00±1.32 0.89i0.09 0.95i0.04 Esgiar et al. [08] 73.18±1.78 0.82i0.02 0.67i0.02 Masood et al. [091 87.93il.52 0.9Ü0.02 0.83i0.01 Masood et al. [10] 89.88il.32 0.92i0.03 0.88i0.02 Altunbay et al. [11] 90.23±0.95 0.90i0.01 0.94i0.02 The proposed technique 97.23±1.05 0.98i0.02 0.96i0.01
The results in Table III reveal that the proposed technique yields superior classification results compared to previous techniques for the given dataset. The proposed technique has achieved the classification accuracy of 97.23%, which is 7 .00% better compared to the best accuracy achieved b y a previous technique [11]. Therefore, we can conclude that the proposed features are better able to model the challenging texture of colon b iopsy images compared to the features proposed/used in previous techniques.
V . CONCLUSION
In this paper, we have proposed a colon biopsy image classification technique in which two novel feature types, namely, W R L and C P A features have been extracted from colon biopsy images. These features have been reduced using the P C A methodology. The original as well as the reduced features have been used for classification of colon biopsy images into normal and malignant categories. Random forest, rotation forest and rotation boost have been employed as classification strategies. The proposed technique attains max imum accuracy of 97.23.% with hybrid features. Analysis reveals that hybrid feature set encompassing diverse information about the image tissue, appear out to b e more discriminative compared to individual features. The rotation boost comes out to b e a promising classification strategy to model the challenging problem of colon biopsy image classification. Further, P C A based features have been proven to be more effective compared to original features. The P C A not only reduces the feature space, bu t also selects discriminating features which in turn help rotation boost to attain m a x i m u m accuracy. Therefore, we can hope that the proposed technique can b e used as an effective diagnostic tool for the patients of colon cancer. This research can further be extended into two directions. First, making ensemble of classifiers may further improve performance. Second, incorporating some other performance evaluation parameters can potentially provide better performance overview.
REFERENCES
[1] "Colon Cancer Risk Factors," http://www.ccalliance.org/colorectal_cancer/riskfactors.html.
[2] M. Fox. "Stages of Colon Adenocarcinoma," http://www.livestrong.com/article/162178-stages-of-colon-adenocarcinoma/.
[3] D. Myers. "Colon Cancer Stages: Basics of Each Colon Cancer Stage," http://coloncancer.about.eom/od/stagesandsurvivalratel/a/ColonCaneerS tag.htm.
[4] G. D. Thomas, M. F. Dixon, N. C. Smeeton et al., "Observer Variation in the Histological Grading of Rectal Carcinoma," Journal of Clinical pathology, vol. 36, no. 4, pp. 385-391,1983.
[5] A. Andrion, C. Magnani, P. G. Betta et al., "Malignant Mesothelioma of the Pleura: Inter Observer Variability," Journal of Clinical pathology, vol. 48, pp. 856-860,1995.
[6] S. Rathore, M. Hussain, A. Ali, A. Khan, "A recent survey on colon cancer detection techniques," IEEE/ACM Transactions on Computational Biology and Bioinformatics, 2013.
[7] A.N. Esgiar, R.N.G. Naguib, B.S. Sharif, M.K. Bennett, A. Murray, "Microscopic image analysis for quantitative measurement and feature identification of normal and cancerous colonic mucosa," IEEE Transactions on Information Technology in Biomedicine, no. 2, pp. 197-203,1998.
[8] A.N. Esgiar, R.N.G. Naguib, B.S. Sahrif, M.K. Bennett, "Fractal analysis in the detection of colonic cancer images," IEEE Transactions on Information Technology in Biomedicine, vol. 6, pp. 54-58, 2002.
[9] K. Masood, N. Rajpoot, H. Qureshi, K. Rajpoot, "Co-occurrence and morphological analysis for colon tissue biopsy classification," Proceedings of 4th International Workshop on Frontiers of Information Technology, pp. 211-216,2006.
[10] K. Masood, N. Rajpoot, "Texture based classification of hyperspectral colon biopsy samples using CLBP," Proceedings of International Symposium on Biomedical Imaging: From Nano to Macro, Boston, Massachusetts, USA, pp. 1011-1014,2009.
[11] D. Altunbay, C.D. Altunbay, C. Cigir, C. Sokmensuer, C.G. Demir, "Color graphs for automated cancer diagnosis and grading," IEEE Transactions on Biomedical Engineering, vol. 57, pp. 665-674,2010.
[12] A.B. Tosun, M. Kandemir, C. Sokmensuer, C.G. Demir, "Object-oriented texture analysis for the unsupervised segmentation of biopsy images," Journal of Pattern Recognition, vol. 42, pp. 1104-1112, 2009.
[13] E. Özdemir, C.G. Demir, "A hybrid classification model for digital pathology using structural and statistical pattern recognition," IEEE Transactions on Medical Imaging, vol. 32, 2013.
[14] A.B. Tosun, C.G. Demir, "Graph Run-Length matrices for histopathological image segmentation," IEEE Transactions on Medical Imaging, vol. 30, pp. 721-732, 2011.
[15] R.O. Duda, P.E. Hart, D.G. Stork, Pattern Classification, in, John Wiley & Sons, 2001.
[16] K. Pearson, "On lines and planes of closest fit to systems of points in space," Philosophical Magazine, vol. 2, pp. 559-572,1901.
[17] L. B. Statistics and L. Breiman, "Random Forests," Machine Learning, vol. 45, pp. 05-32,2001.
[18] J. J. Rodriguez, L. I. Kuncheva and C. J. Alonso, "Rotation Forest: A New Classifier Ensemble Method," IEEE Tranasctions on Pattern Analysis and Machine Intelligence, vol.28, no. 10, pp. 1619-1630,2006.
[19] C. Zhang and J.Zhang, "Rotboost: A Technqiue for Combining Rotation Forest and Adaboost," Pattern Recognition Letters, vol. 29, no. 10, pp. 1524-1536,2008.