Embed Size (px)
Citation preview
Classification of cancer profiles
1 ABDBM © Ron Shamir

2
Background: Cancer Classification • Cancer classification is central to cancer treatment; • Traditional cancer classification methods: location;
morphology, cytogenesis; • Limitations of morphology classification: tumors of
similar histopathological appearance can have significantly different clinical courses and response to therapy;
• Traditionally cancer classification relied on specific biological insights
• challenges: – finer classification of morphologically similar tumors at the
molecular level; – systematic and unbiased approaches;
ABDBM © Ron Shamir

3
Challenges
• Class prediction (classification) : Assign particular tumor samples to already-defined classes.
• Feature selection : Identify the most informative genes for prediction
• Class discovery : Define previously unrecognized tumor subtypes ( = clustering)
• Predict prognosis; suggest treatment!
ABDBM © Ron Shamir
Leukemia
Golub et al., Science 286 (Oct 1999) 531-537 Computational paper: Class Prediction and Discovery Using Gene Expression Data Donna K. Slonim, Pablo Tamayo, Jill P. Mesirov, Todd R. Golub, Eric S. Lander Proc. RECOMB 2000 Slides based on: Elashof-Horvath UCLA course, http://www.genetics.ucla.edu/horvathlab/Biostat278/Biostat278.htm
4 ABDBM © Ron Shamir
5
Background: Leukemia • Acute leukemia: variability in clinical outcome;
subtle differences in nuclear morphology • Subtypes: acute lymphoblastic leukemia (ALL) or
acute myeloid leukemia (AML); • ALL subcategories: T-lineage ALL and B-lineage
ALL; • 1999 status:
– A combination of different tests needed for diagnosis (morphology, histochemistry, immunophenotyping..)
– Although usually accurate, leukemia classification imperfect and errors do occur
ABDBM © Ron Shamir
6
Objective
• Develop a systematic approach to cancer classification based on gene expression data
• Use leukemia as test case
ABDBM © Ron Shamir

7
The Data • Primary samples: 38 bone marrow samples (27 ALL,
11 AML) obtained from acute leukemia patients at
the time of diagnosis; • Independent samples: 34 leukemia samples
(24 bone marrow and 10 peripheral blood samples);
• GE expression: Affymetrix arrays (6817 human genes)
• 1st: training set. 2nd : test set.
• Q: is there a class-specific signal in the data?
ABDBM © Ron Shamir

8
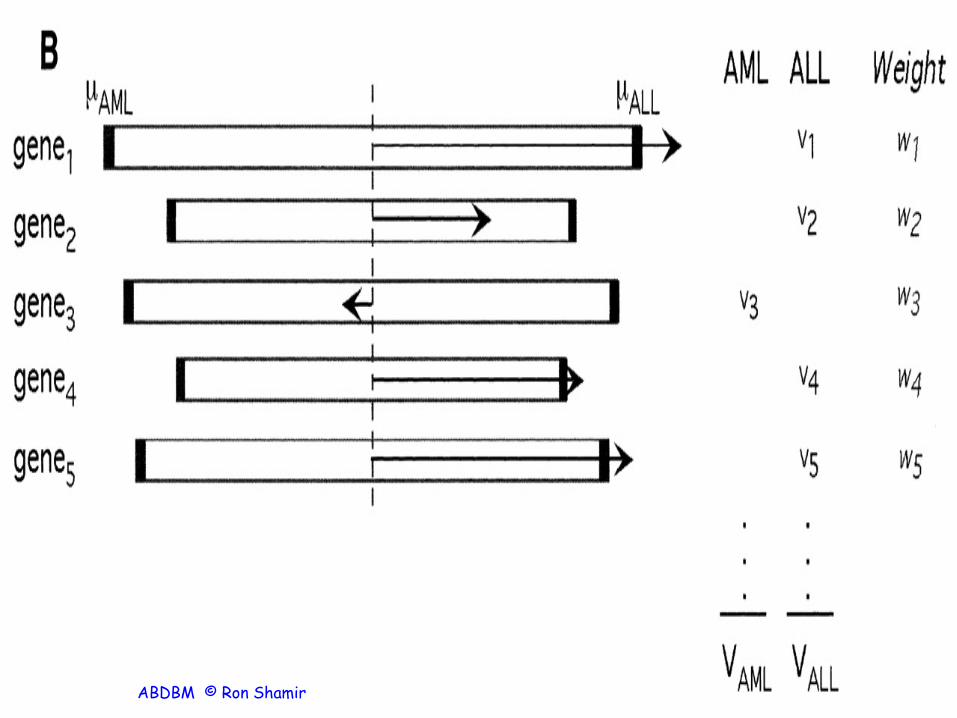
Metric for gene selection
• Want to find a set of predictive genes s.t. – Typical exp patterns differ a lot between classes – Low variance within each class
• c – class vector (1,1,1,1,1,1,0,0,0,0,0,0,0) • g – expression vector of a gene • µi – exp in class i, σi - std in class i • P(g,c) = (µ1- µ0)/(σ1 + σ0) Golub / S2N metric • Pick k genes g with highest |P(g,c)| as predictor
set.
ABDBM © Ron Shamir
9
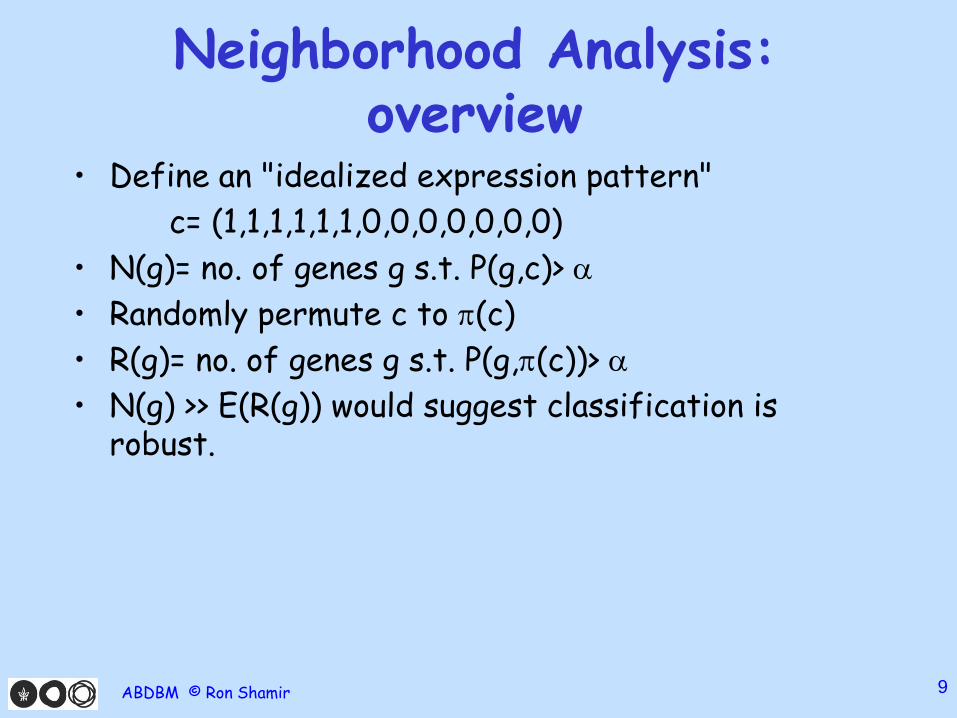
Neighborhood Analysis: overview
• Define an "idealized expression pattern" c= (1,1,1,1,1,1,0,0,0,0,0,0,0) • N(g)= no. of genes g s.t. P(g,c)> α • Randomly permute c to π(c) • R(g)= no. of genes g s.t. P(g,π(c))> α • N(g) >> E(R(g)) would suggest classification is
robust.
ABDBM © Ron Shamir

10 ABDBM © Ron Shamir
11
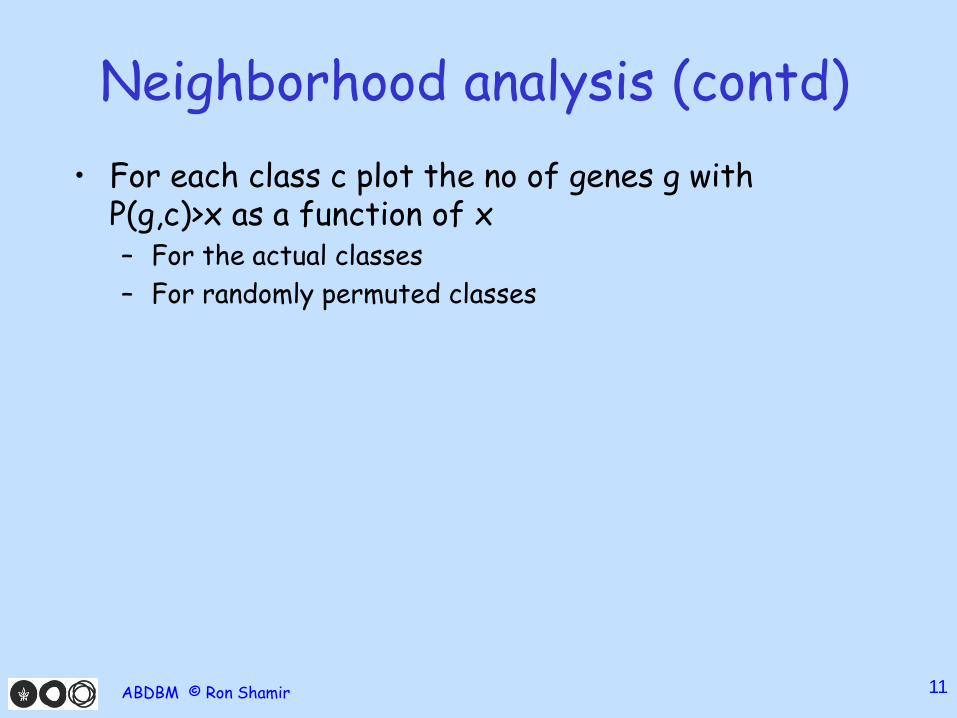
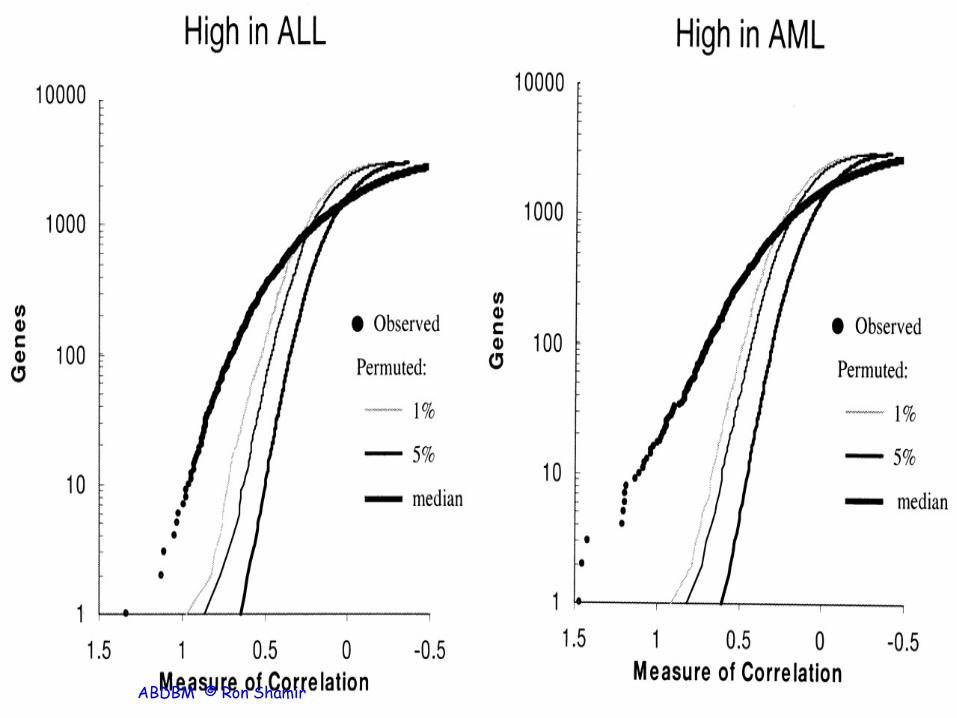
Neighborhood analysis (contd) • For each class c plot the no of genes g with
P(g,c)>x as a function of x – For the actual classes – For randomly permuted classes
ABDBM © Ron Shamir
12 ABDBM © Ron Shamir
13
Neighborhood Analysis: Results • On the training set, ~1100 genes were more
highly correlated with the AML-ALL class distinction than would be expected by chance.
• => ample data for informative class prediction
ABDBM © Ron Shamir
14
Predictor + Feature Selection • Goal: create a classifier (predictor) • Method: filtering. Choose k genes most
correlated with the label on the training set
ABDBM © Ron Shamir

15
The Predictor size • Pick k genes g with highest |P(g,c)| as
predictor set,or, • Pick k1 genes highest P(g,c), k2 with lowest • Choosing k1,k2:
– Roughly equal – Few genes – most statistically significant, best
for clinical setting. – Many genes – more robust, many bio processes – Too many genes – unlikely to be meaningful and
independent
ABDBM © Ron Shamir

16
Weighted voting • S: set of features (genes) selected; x – new sample • Assign a weight w(g)=P(g,c) for each gene in S
• bg=(µ1 - µ2)/2 – “half-way boundary” for gene g
• Vote of gene g: V = w(g) (xg-bg)
• V+= sum of positive votes; V-=sum of neg. votes • The winning class: the one with larger abs value. • prediction strength PS=(Vwinner-Vloser)/ (Vwinner+Vloser) • Assign x to the winning class if PS>0.3 • Otherwise, x is undetermined. • Many other voting schemes possible.
ABDBM © Ron Shamir
17 ABDBM © Ron Shamir
18
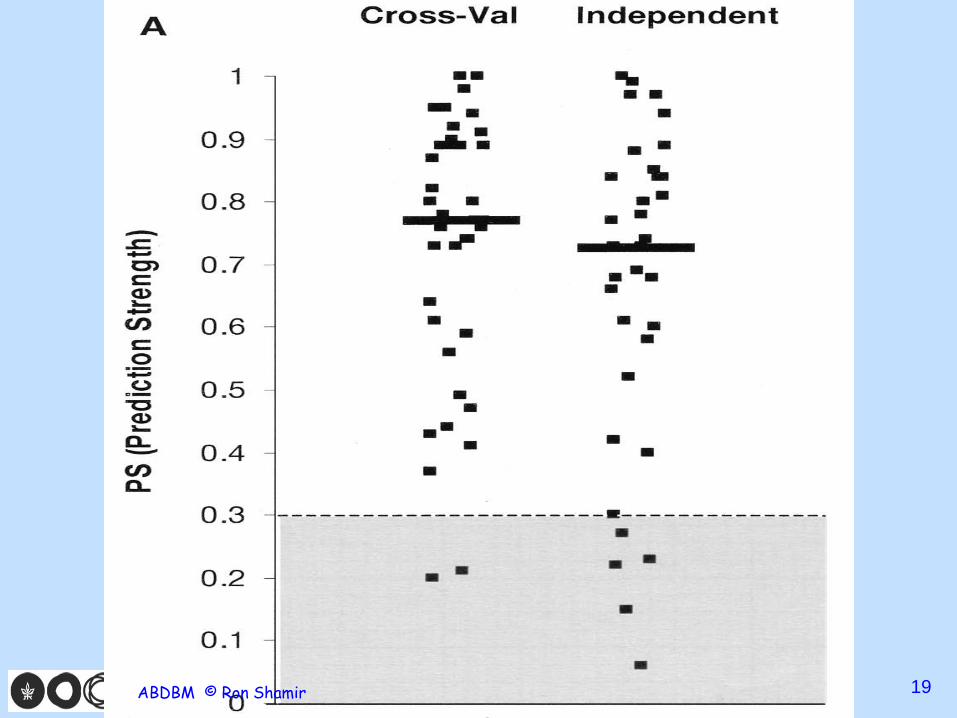
Testing the predictors
• Used a 50-gene predictor • LOOCV : Assigned 36 / 38 samples as either AML
or ALL, 2 as uncertain (PS < 0.3). All predictions
were correct • Independent test: Assigned 29 / 34 samples, at
100% accuracy • Median PS = 0.77 in cross-validation, 0.73 in
independent test (Fig. 3A).
ABDBM © Ron Shamir
19 ABDBM © Ron Shamir

20
Testing the predictors (contd) • The average PS was lower for samples from one
laboratory, which used a very different protocol for sample preparation;
• Should standardize sample preparation in clinical implementation.
ABDBM © Ron Shamir
21
How many features? • Choosing k=50 was a bit arbitrary • Results were insensitive to k: Predictors based on
10-200 genes were all 100% accurate • strong correlation of many genes with the AML-
ALL distinction.
ABDBM © Ron Shamir

23 ABDBM © Ron Shamir

25
Class Discovery
• If the AML-ALL distinction was not already known, could we discover it simply on the basis of gene expression?
• Strategy: – Cluster the samples – Assign a new sample to class with closest
centroid. – Test by cross-validation – Compare to results on random classes
ABDBM © Ron Shamir

26
Class Discovery: Results
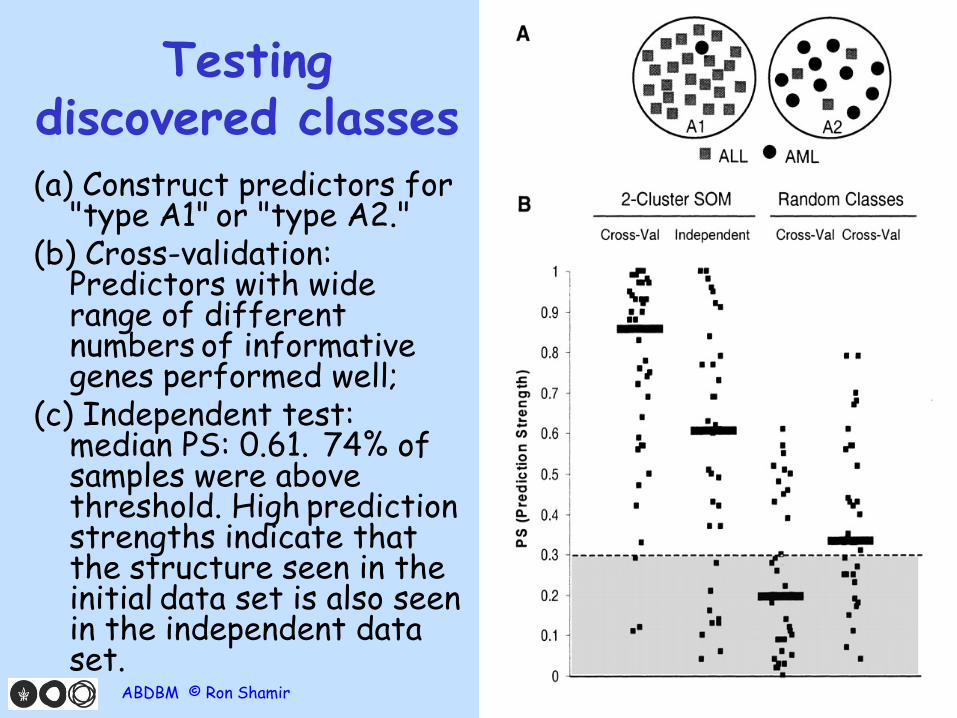
• A 2-cluster SOM was applied to cluster the 38 initial leukemia samples using exp patterns of all 6817 genes.
• The clusters were first evaluated by comparing them to the known AML-ALL classes (Fig. 4A). – Class A1: mostly ALL (24 out of 25) – Class A2: mostly AML (10 of 13 samples).
ABDBM © Ron Shamir
27
Testing discovered classes (a) Construct predictors for
"type A1" or "type A2." (b) Cross-validation:
Predictors with wide range of different numbers of informative genes performed well;
(c) Independent test: median PS: 0.61. 74% of samples were above threshold. High prediction strengths indicate that the structure seen in the initial data set is also seen in the independent data set.
ABDBM © Ron Shamir

28
Testing discovered classes (2)
(d) Random clusters yielded significantly poorer results in CV and the independent
data set (Fig. 4B).
• => A1-A2 distinction is meaningful, not a statistical artifact of the initial data set.
• => the AML-ALL distinction could have been automatically discovered and confirmed without previous biological knowledge.
ABDBM © Ron Shamir

29
Multiple cluster analysis • 4-cluster SOM divides the samples into
clusters, which largely corresponded to AML, T-ALL, B-ALL x 2 (Fig. 4C).
• Evaluated these classes by constructing class predictors. The four classes could be distinguished from one another, with the exception of B3 versus B4 (Fig. 4D).
ABDBM © Ron Shamir

30 ABDBM © Ron Shamir

31
Multiple Clusters (2) • The prediction tests confirmed the
distinctions corresponding to AML, B-ALL, and T-ALL,
• Suggested to merge classes B3 and B4, composed primarily of B-lineage ALL.
ABDBM © Ron Shamir

32
Todd Golub, Donna Slonim
ABDBM © Ron Shamir

Breast Cancer
Van’t Veer et al, Nature 2002
33 ABDBM © Ron Shamir

The Challenge Out of young women who have breast cancer, only 15-20% will develop metastases. These women must be treated aggressively (chemotherapy) - but not the rest Can expression data help to identify this group? Understand disease process?
34

35
Van ‘t Veer’s data • Goal: predict clinical outcome from
expression • 98 primary breast cancers:
– Sporadic: • 34 with metastases within 5 years (poor prognosis
group, mean time to metastasis 2.5 yrs) • 44 without (good prognosis group, mean follow-up 8.7
yrs) – All <55 yrs old, lymph node negative – Carriers: 18 BRCA1, 2 BRCA2 mutation carriers
• Measured expression levels of ~25K genes (reference: mixture of sporadic)
• Selected 5K genes that showed significant change.
ABDBM © Ron Shamir

36
Hierarchical clustering (unsupervised) gives two main clusters: Most carriers fall into one cluster ER & lymphocytic infiltrate – different clsuters
ABDBM © Ron Shamir
38
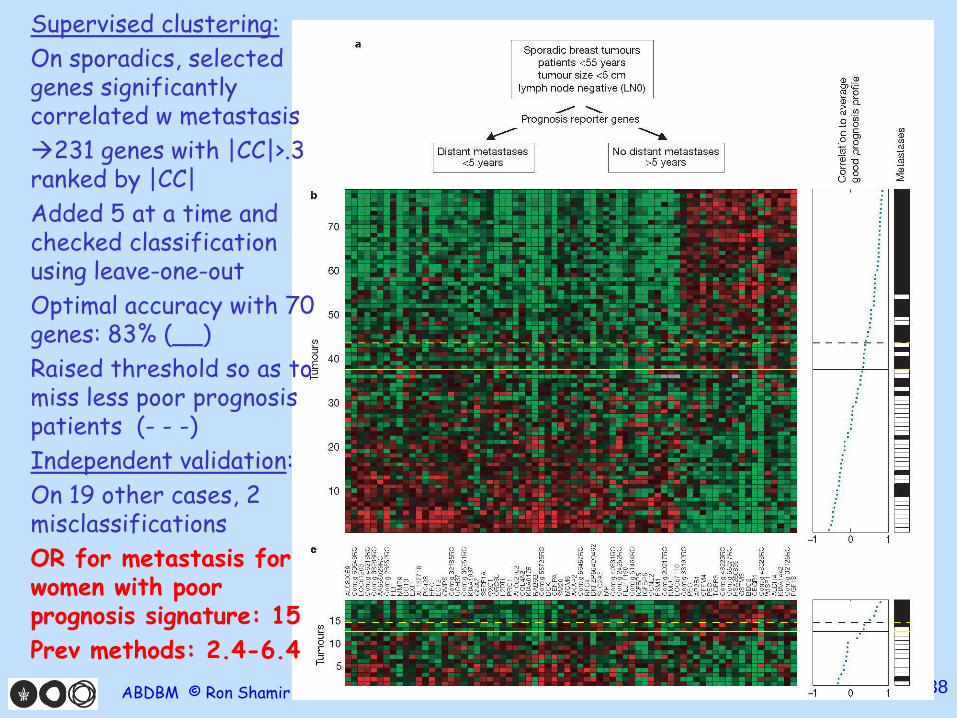
Supervised clustering: On sporadics, selected genes significantly correlated w metastasis 231 genes with |CC|>.3 ranked by |CC| Added 5 at a time and checked classification using leave-one-out Optimal accuracy with 70 genes: 83% (__) Raised threshold so as to miss less poor prognosis patients (- - -) Independent validation: On 19 other cases, 2 misclassifications OR for metastasis for women with poor prognosis signature: 15 Prev methods: 2.4-6.4
ABDBM © Ron Shamir

How many of the women would current medical guidelines subject to chemotherapy?
39

40
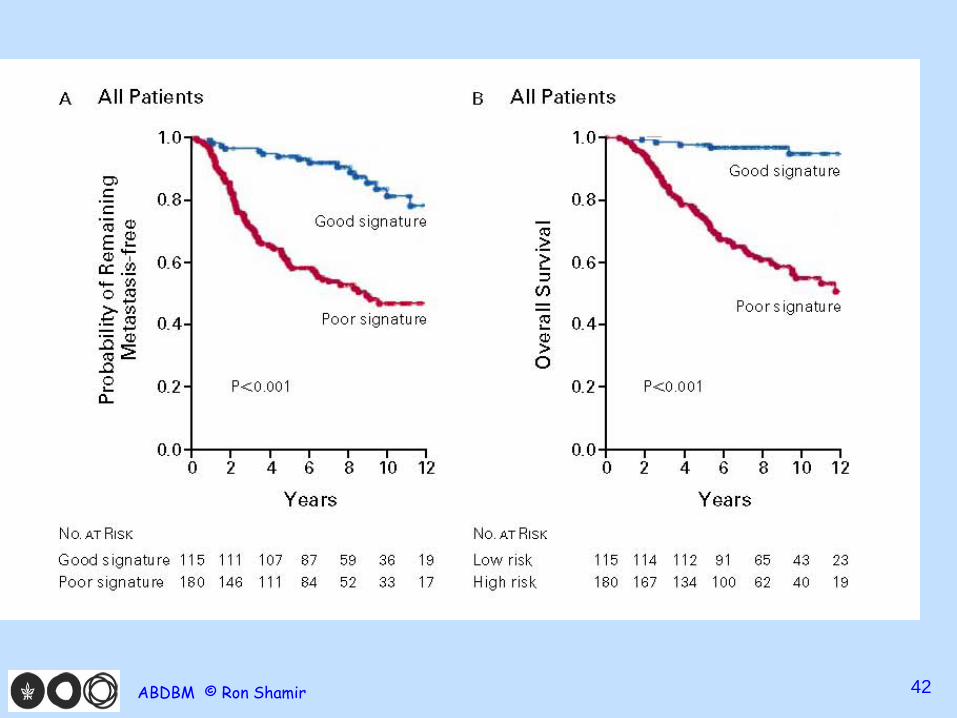
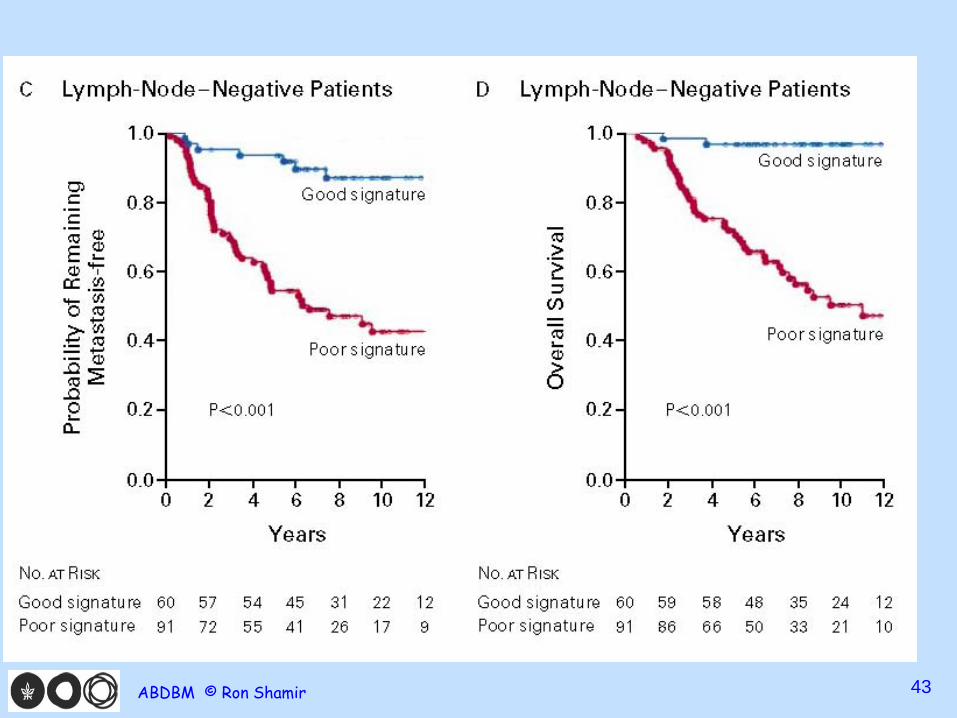
van de Vijver et al. NEJM 2002 • 295 consecutive patients w breast cancer
– 151 lymph node negative – 144 lymph node positive disease
• Applied the 70 gene poor prognosis signature to each: 180 poor, 115 good
• Ave 10 year survival rate: 55% vs 95% • Odds to be free of metastasis at 10 years:
50% vs 85% • (Hazard ratio: 5.1)
ABDBM © Ron Shamir
42 ABDBM © Ron Shamir
43 ABDBM © Ron Shamir

44
Conclusions “The gene-expression profile we studied is a more
powerful predictor of the outcome of disease in young patients with breast cancer than standard systems based on clinical and histologic criteria.”
ABDBM © Ron Shamir

45
Laura van’t Veer
ABDBM © Ron Shamir
46
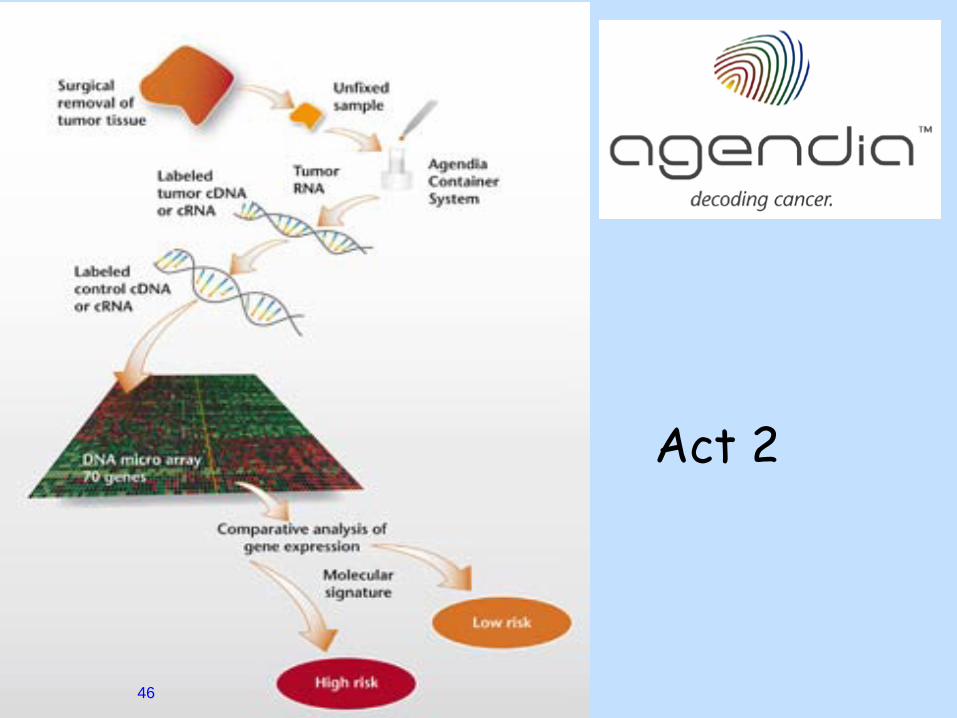
Act 2

A first breast cancer diagnostic chip • Phoenix, AZ April 21, 2005 - The Molecular Profiling Institute, Inc. (MPI) announced today that it is now providing the MammaPrint® breast cancer test to breast cancer patients in the United States. This is the first commercially available microarray cancer diagnostic that analyzes patients' breast tumors for their individual DNA expression profile. "MammaPrint® more accurately distinguishes between lymph node-negative breast cancer patients who would benefit from additional therapy from those who would not, helping oncologists offer more effective therapy to their patients. The 70 genes in a woman's tumor analyzed by
MammaPrint® predict the 10-year survival of the i i ifi l l h i
http://www.eurekalert.org/pub_releases/2005-04/ttgr-tmp042105.php 47
48
ABDBM © Ron Shamir

Caveats
54 ABDBM © Ron Shamir
Mammaprint Act 3

55
Ein-Dor et al. Bioinformatics 05
• Reanalyzed the 96 “sporadics” samples of vant Veer
• Is the 70-gene signature selected unique? • Training set: the same 77 patients of vV • Ranked all genes by correlation to survival • Features for classifier: (vV) genes 1-70; (1)
71-140; (2) 141-210,…(7) 701-770 • Applied each classifier to all 96 samples
ABDBM © Ron Shamir

56
ABDBM © Ron Shamir
57
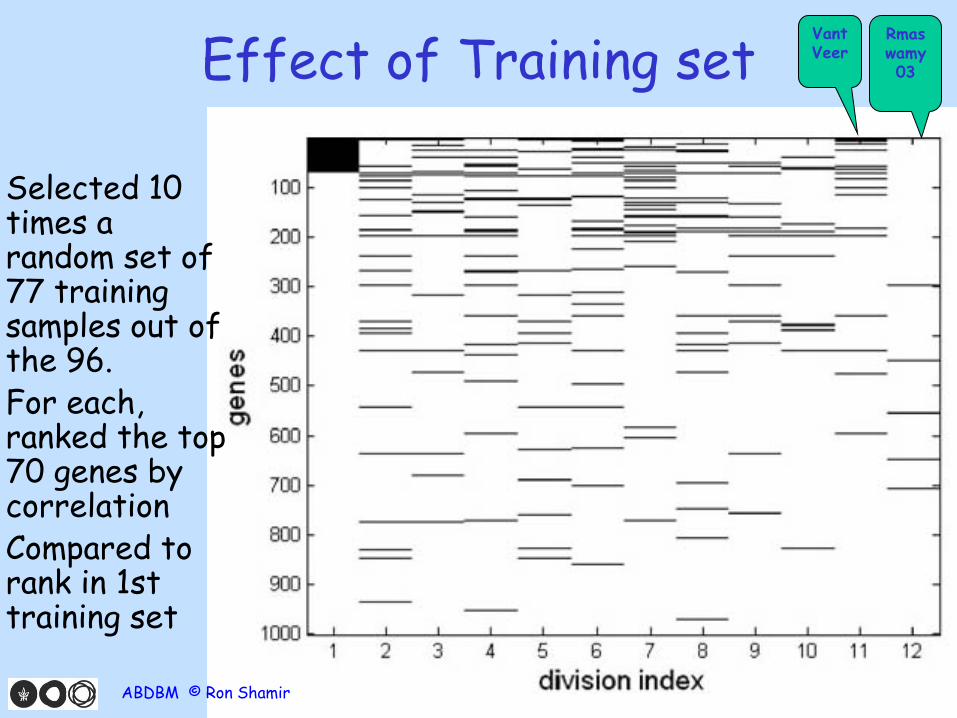
Effect of Training set
Selected 10 times a random set of 77 training samples out of the 96.
For each, ranked the top 70 genes by correlation
Compared to rank in 1st training set
Vant Veer
Rmaswamy 03
ABDBM © Ron Shamir
58
Conclusions • Many genes can be used to predict survival • No gene correlates very strongly • A gene’s rank may fluctuate strongly • Identities of the top 70 genes are not
robust • Much larger number of patients needed to
identify those genes indicative of gene’s importance to cancer pathology
• But: For prognosis, can produce fairly reliable signatures, using large enough gene set.
ABDBM © Ron Shamir

59
The dilemma • “If the results from adjuvant trials confirm
the strong benefit for HER2-positive patients using adjuvant chemotherapy plus trastuzumab, would there be clinicians prepared to withhold adjuvant chemotherapy in a young patient with a node-negative, HER2-positive breast cancer and a “good prognosis” signature?”
Brenton et al., Journal of Clinical Oncology 23 (29) pp7350
(2005)
ABDBM © Ron Shamir

A prospective study
Mammaprint Act 4
ABDBM © Ron Shamir 60

61
• 10 year prospective study of 6,693 patients from 112 institutions, 9 countries
• C – “classic” clinical risk, MP – genomic risk

The study design
62 http://www.agendia.com
Of all patients with high clinical
risk, treating based on MP would have
saved chemo for 46% of the patients

Results
63 http://www.agendia.com
With Chemo: 1.5% higher
Multi-Class Cancer Classification
Ramaswamy et al (Golub’s group), PNAS 2001
65 ABDBM © Ron Shamir

66
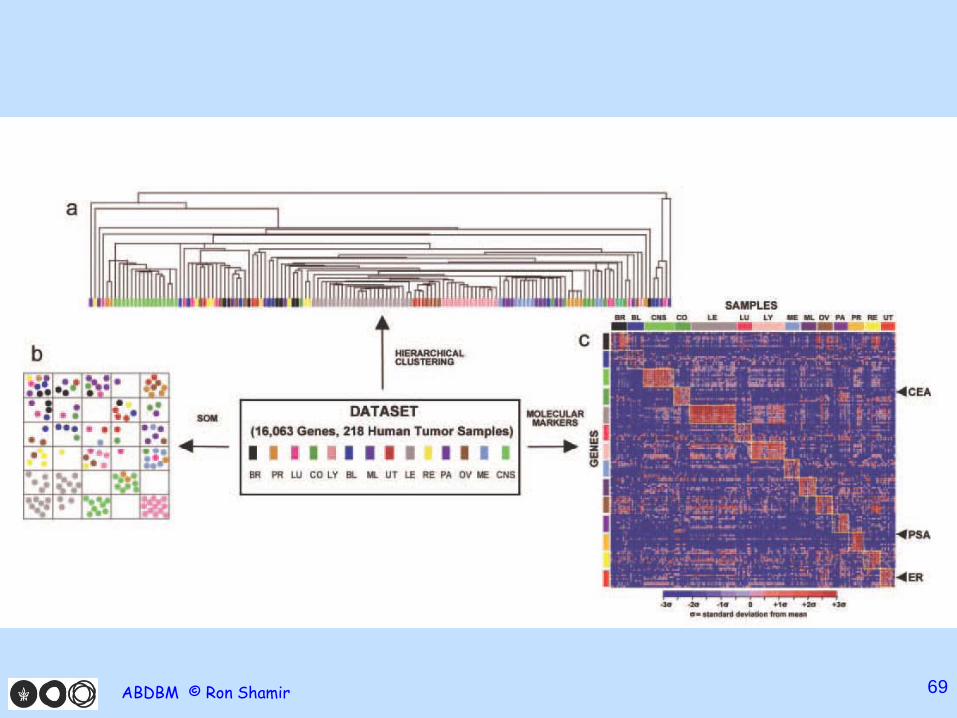
Data • 218 profiles of tumors of 14 types • Affy chips, 16K genes, 11K after variation filtering • Training set: 144 samples; test: 54 samples
• Additional set: PD. 20 poorly differentiated
carcinomas. Difficult to classify with traditional methods as they lack characteristic morphological hallmarks of the organ from which they arise.
ABDBM © Ron Shamir
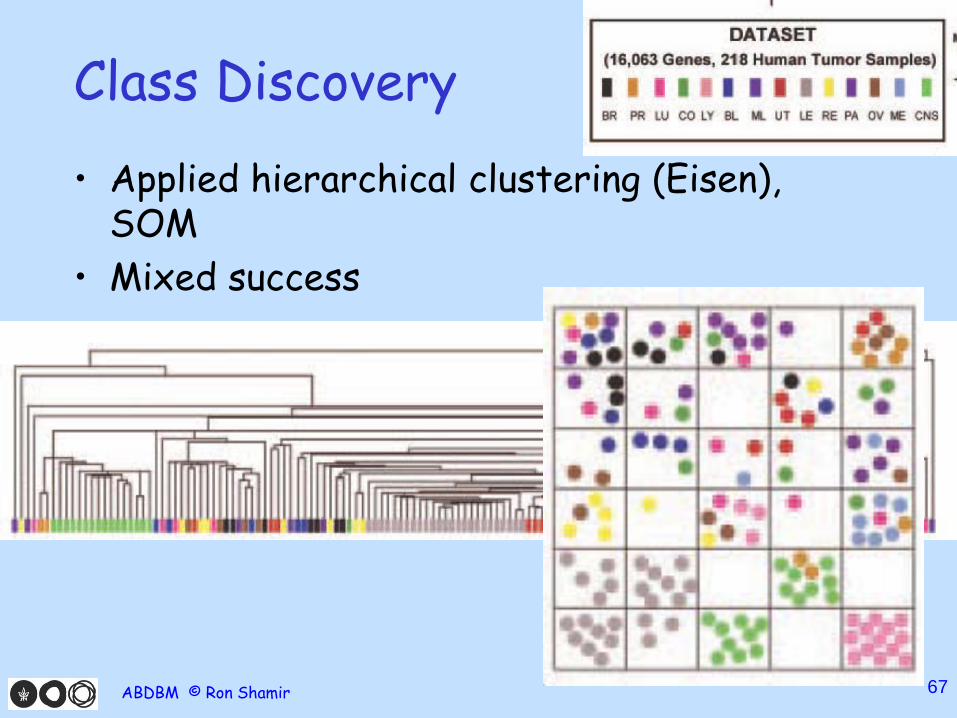
67
Class Discovery • Applied hierarchical clustering (Eisen),
SOM • Mixed success
ABDBM © Ron Shamir
68
Classification – One vs. All (OVA) approach
• Use a 2-way classifier alg A • Label the members of a class 1, rest 0; train A;
classify all samples and get confidence values to assignments
• Repeat for each class. Get 14 • Assign each sample to the class on which it was
accepted with highest confidence.
ABDBM © Ron Shamir
69
ABDBM © Ron Shamir

70
• Weighted voting, KNN and SVM had significant prediction accuracy
• SVM was consistently best
• Genes: best S2N metric in OVA for each class ABDBM © Ron Shamir

71
Classification results
ABDBM © Ron Shamir

72
Recursive feature elimination
• OVA SVM classifier outputs a hyperplane w.
• class = sign (Σwkxik + b) • Recursively remove the 10% with least |wk|
values and retrain • Stop when accuracy decreases • (0r use to study gene number effects)
21min2
. . ( ) 1, i i i
w
s t y w x b x⋅ + ≥ ∀
ABDBM © Ron Shamir

73
Accuracy vs. gene number
ABDBM © Ron Shamir
OVA: One vs All AP: all pairs WV: weighted
voting