Embed Size (px)
Citation preview
Classification: Naïve Bayes
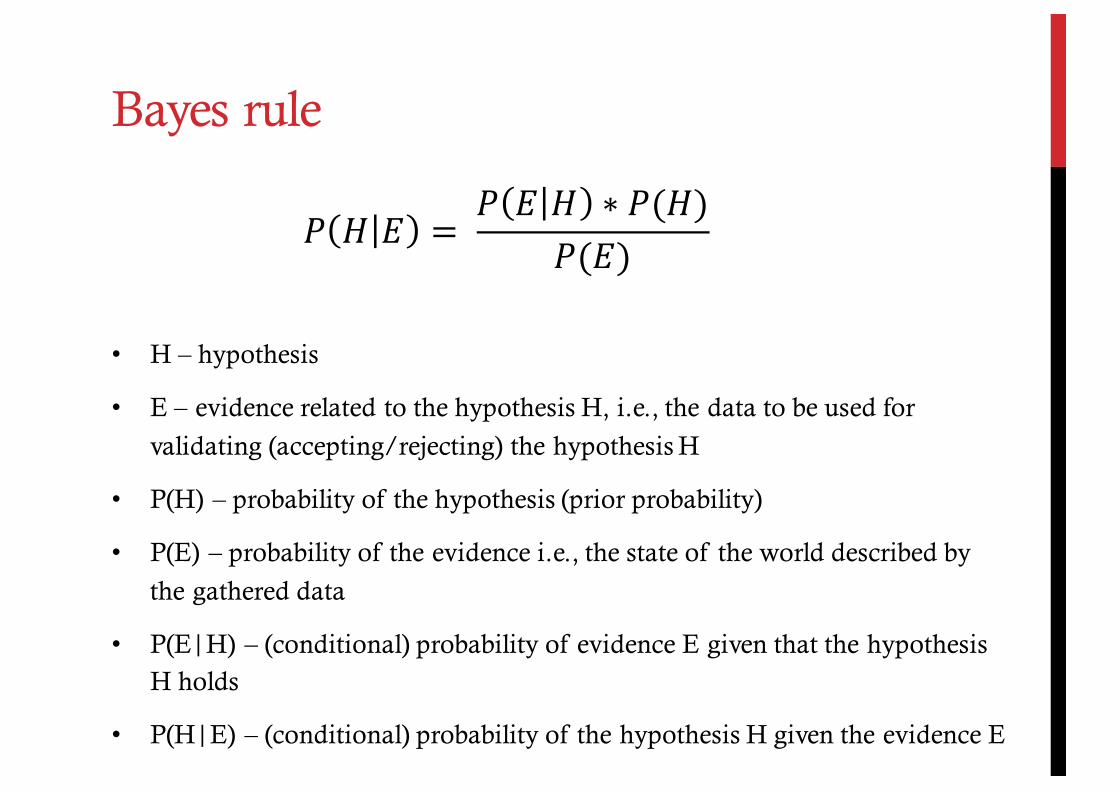
• H – hypothesis
• E – evidence related to the hypothesis H, i.e., the data to be used for
validating (accepting/rejecting) the hypothesis H
• P(H) – probability of the hypothesis (prior probability)
• P(E) – probability of the evidence i.e., the state of the world described by
the gathered data
• P(E|H) – (conditional) probability of evidence E given that the hypothesis H holds
• P(H|E) – (conditional) probability of the hypothesis H given the evidence E
Bayes rule
! ! ! = !! ! ! ∗ !(!)!(!) !
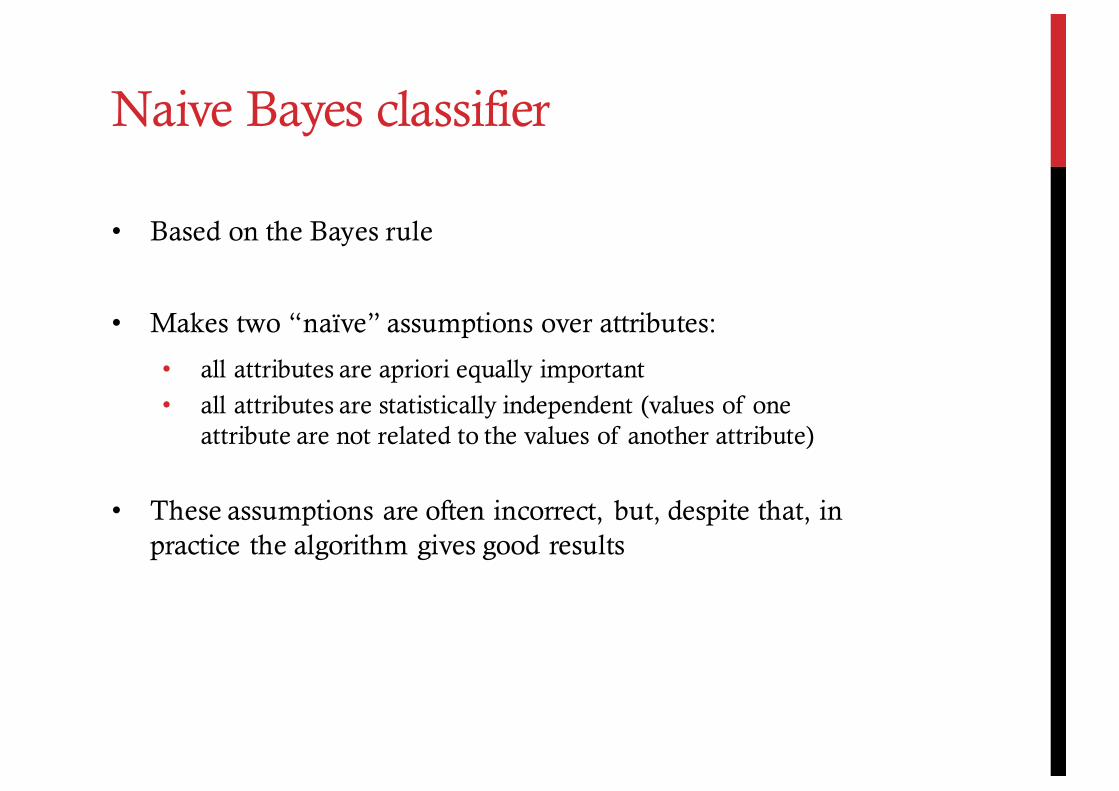
Naive Bayes classifier
• Based on the Bayes rule
• Makes two “naïve” assumptions over attributes:
• all attributes are apriori equally important
• all attributes are statistically independent (values of one attribute are not related to the values of another attribute)
• These assumptions are often incorrect, but, despite that, in practice the algorithm gives good results
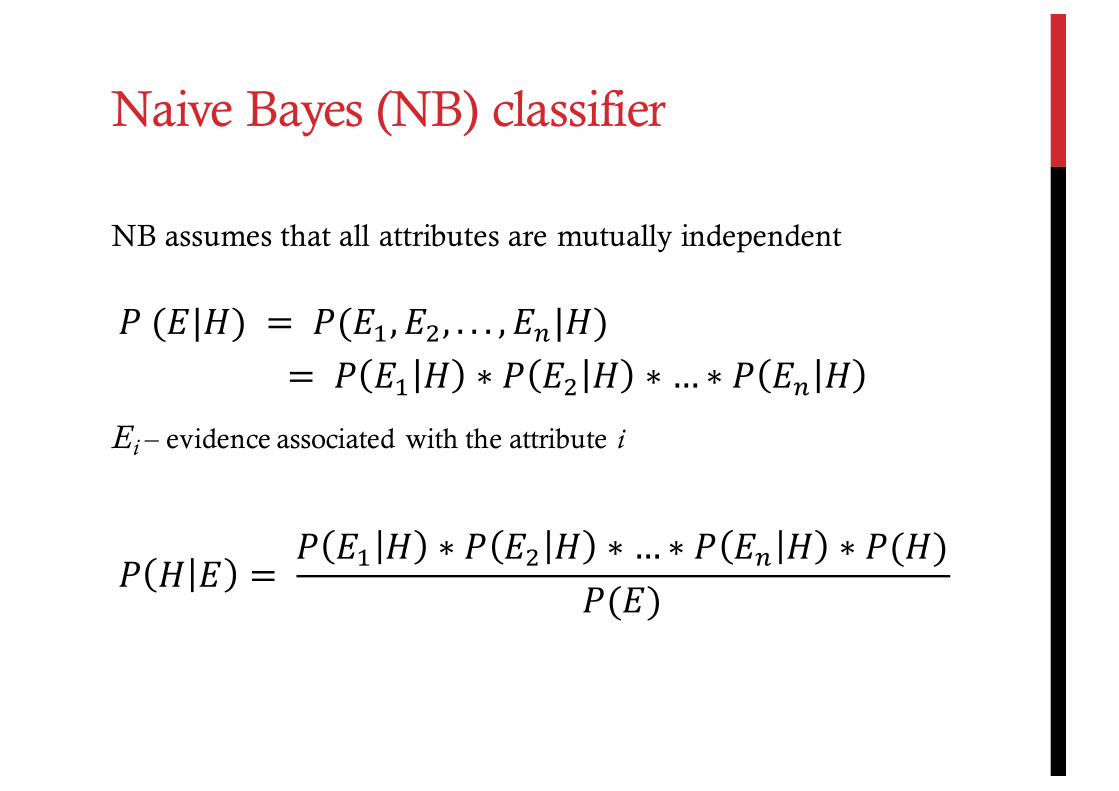
Naive Bayes (NB) classifier
NB assumes that all attributes are mutually independent
Ei – evidence associated with the attribute i
!($|&) = !($), $+, . . . , $-|&) = ! $) & ∗ ! $+ & ∗ …∗ ! $- &
! ! ! = !! !! ! ∗ ! !! ! ∗… ∗ ! !! ! ∗ !(!)!(!) !
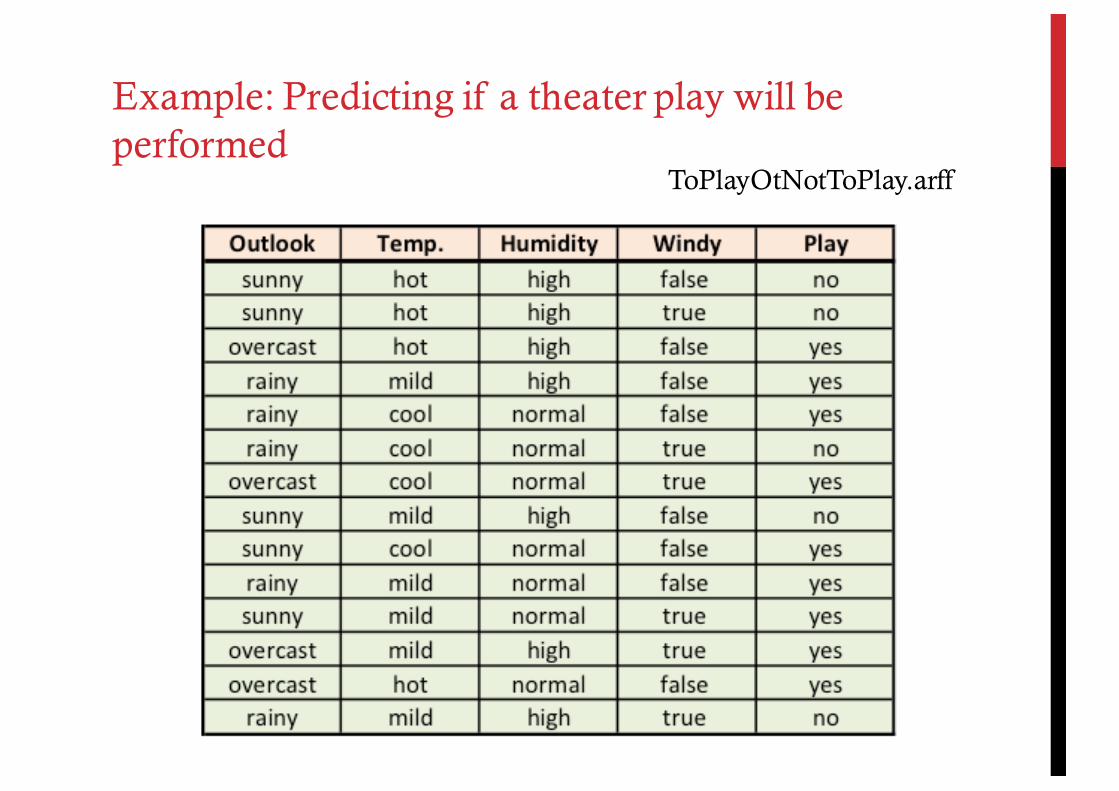
ToPlayOtNotToPlay.arff
Example: Predicting if a theater play will be performed
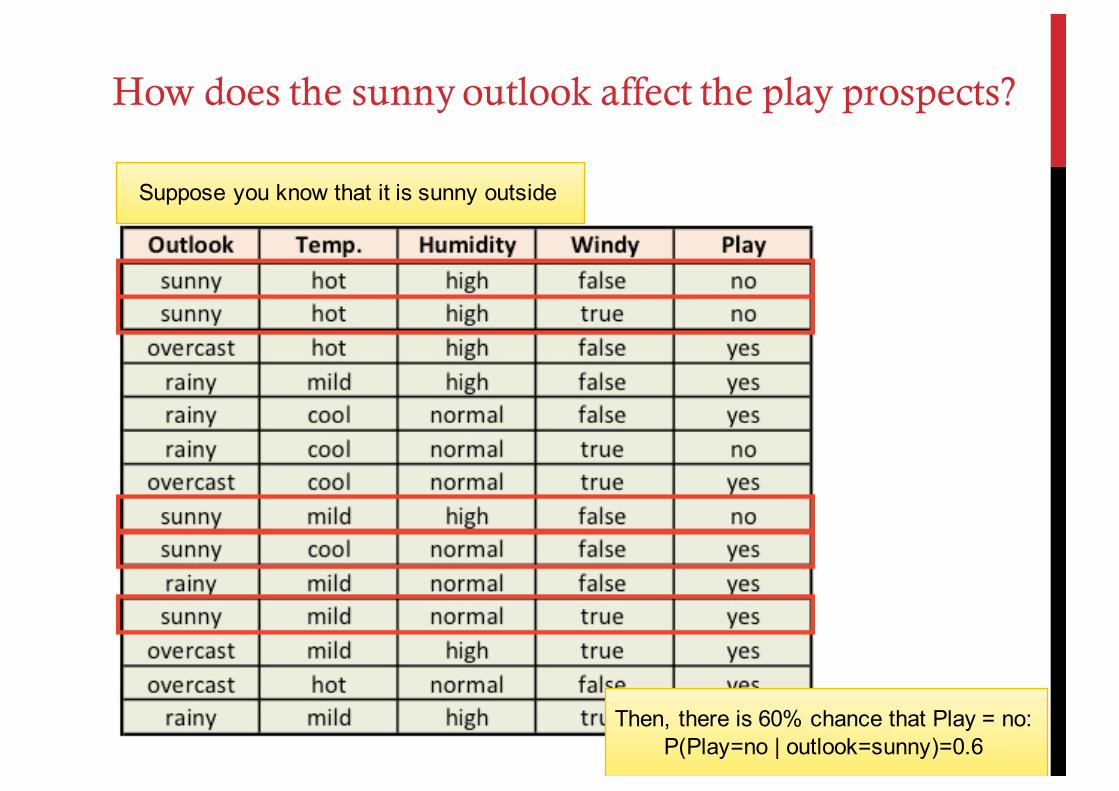
Suppose you know that it is sunny outside
How does the sunny outlook affect the play prospects?
Then, there is 60% chance that Play = no:P(Play=no | outlook=sunny)=0.6
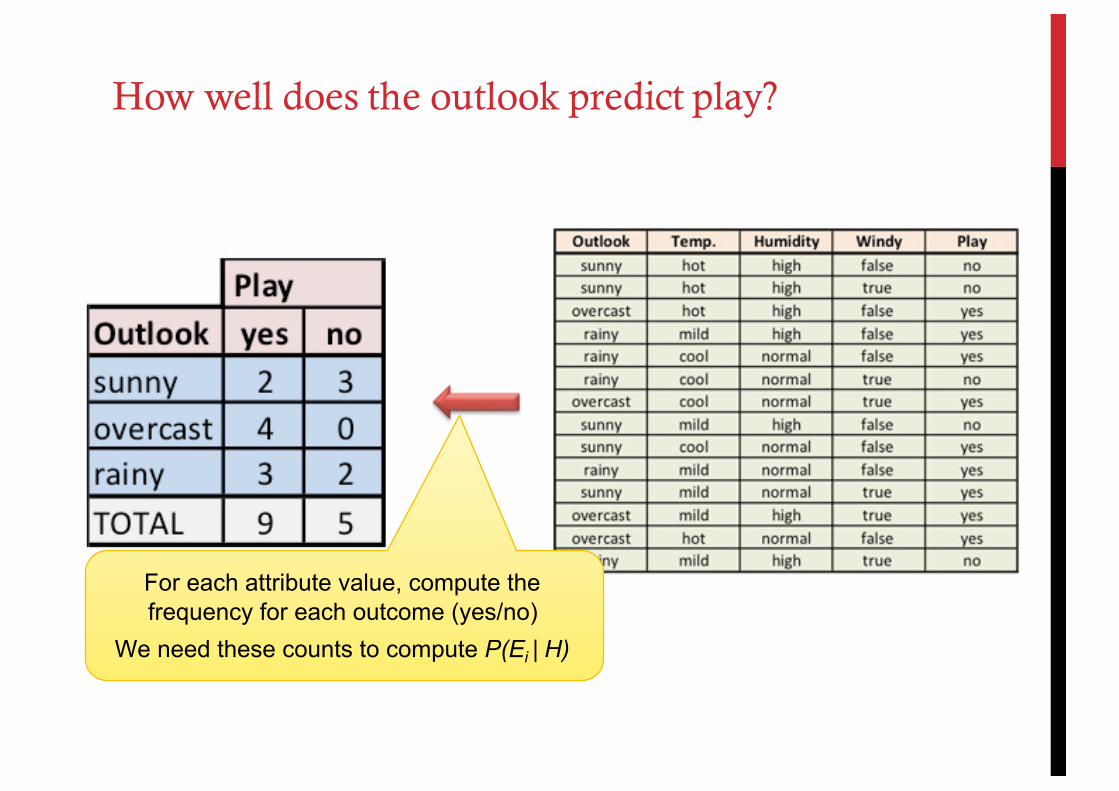
How well does the outlook predict play?
For each attribute value, compute the frequency for each outcome (yes/no)
We need these counts to compute P(Ei | H)
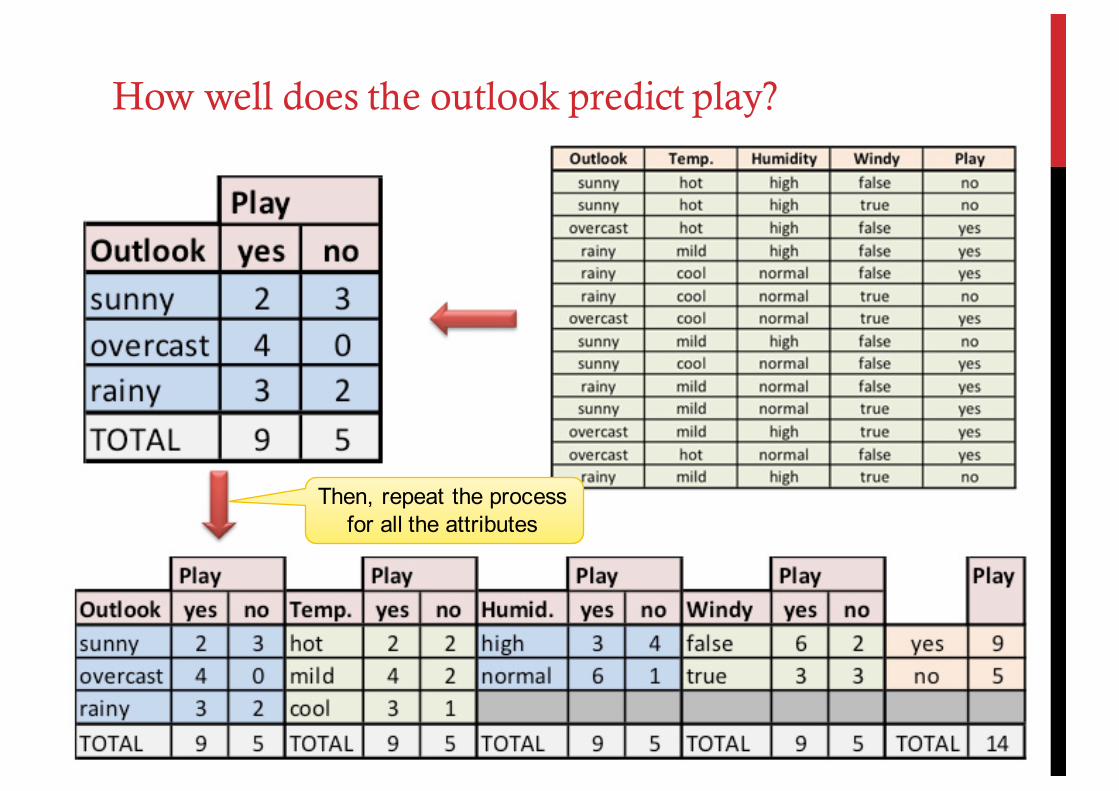
How well does the outlook predict play?
Then, repeat the process for all the attributes
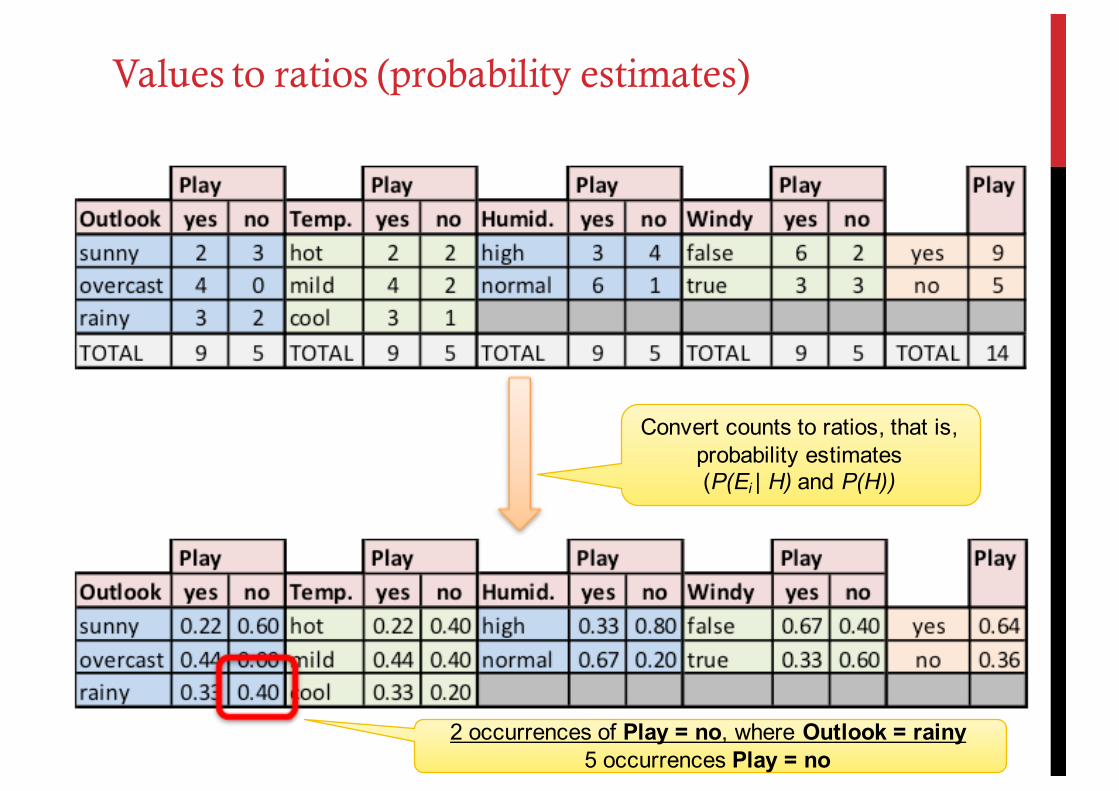
Convert counts to ratios, that is, probability estimates (P(Ei | H) and P(H))
2 occurrences of Play = no, where Outlook = rainy5 occurrences Play = no
Values to ratios (probability estimates)
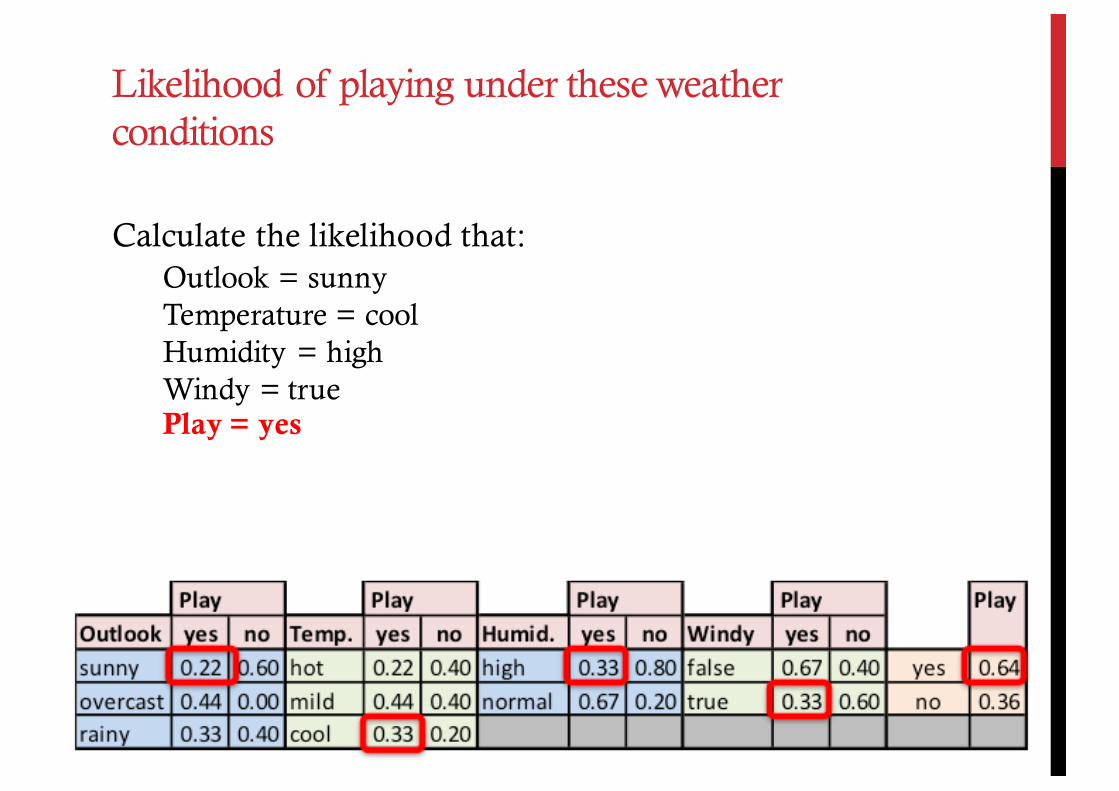
Calculate the likelihood that:Outlook = sunnyTemperature = coolHumidity = highWindy = truePlay = yes
Likelihood of playing under these weather conditions
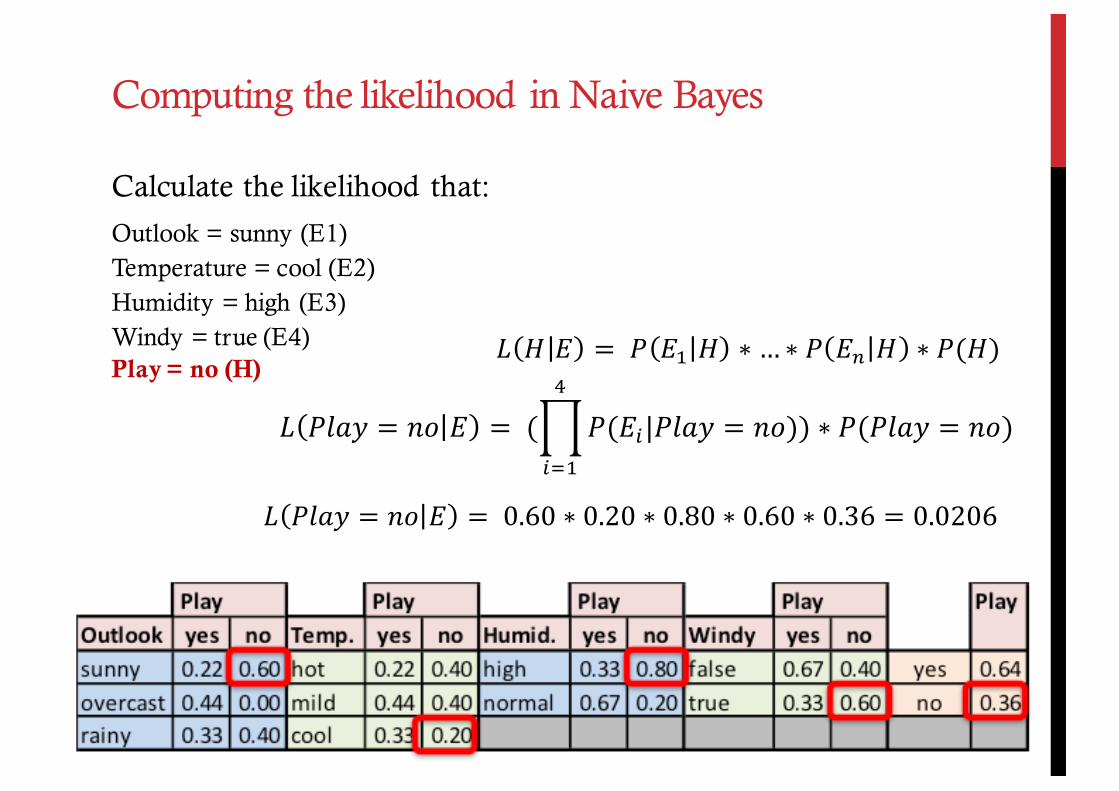
Calculate the likelihood that:
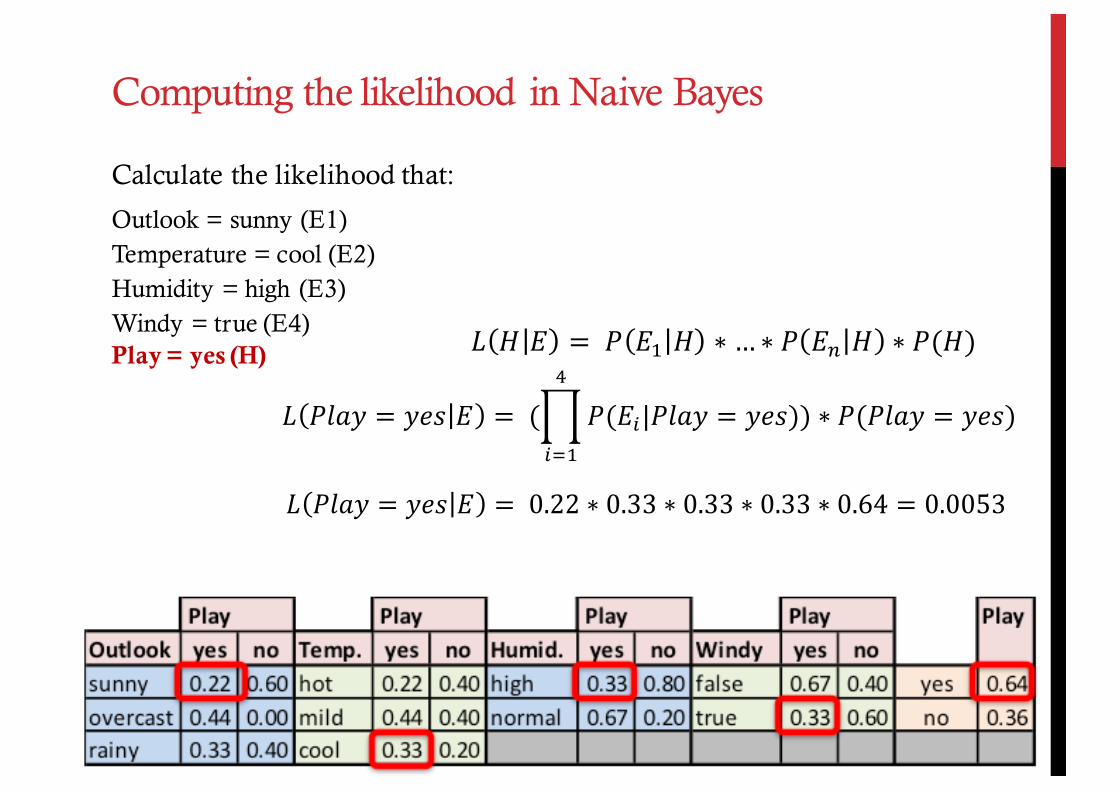
Outlook = sunny (E1)Temperature = cool (E2)Humidity = high (E3)Windy = true (E4)Play = yes (H)
Computing the likelihood in Naive Bayes
! " # = & #' " ∗ …∗ & #* " ∗ &(")
! "#$% = %'( ) = ( "(),|"#$% = %'()/
,01) ∗ "("#$% = %'()
! "#$% = %'( ) = 0.22 ∗ 0.33 ∗ 0.33 ∗ 0.33 ∗ 0.64 = 0.0053
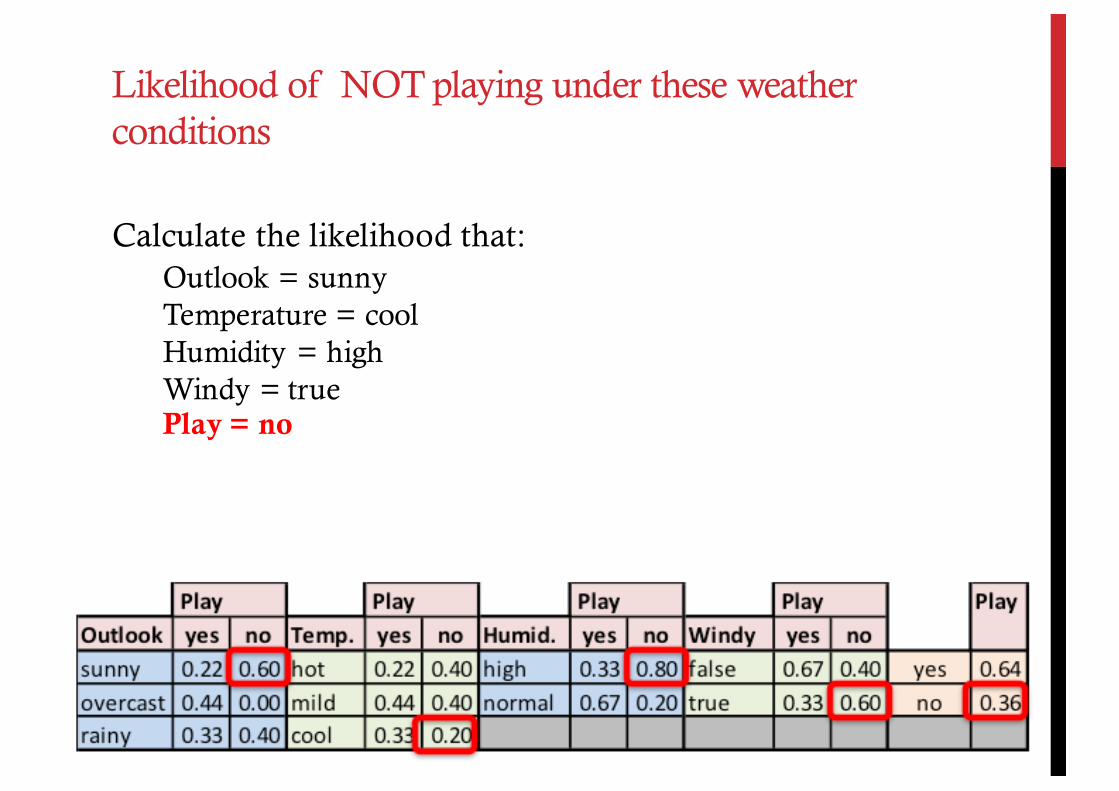
Calculate the likelihood that:Outlook = sunnyTemperature = coolHumidity = highWindy = truePlay = no
Likelihood of NOT playing under these weather conditions
Calculate the likelihood that:
Outlook = sunny (E1)Temperature = cool (E2)Humidity = high (E3)Windy = true (E4)Play = no (H)
Computing the likelihood in Naive Bayes
! " # = & #' " ∗ …∗ & #* " ∗ &(")
! "#$% = '( ) = ( "(),|"#$% = '()/
,01) ∗ "("#$% = '()
! "#$% = '( ) = 0.60 ∗ 0.20 ∗ 0.80 ∗ 0.60 ∗ 0.36 = 0.0206
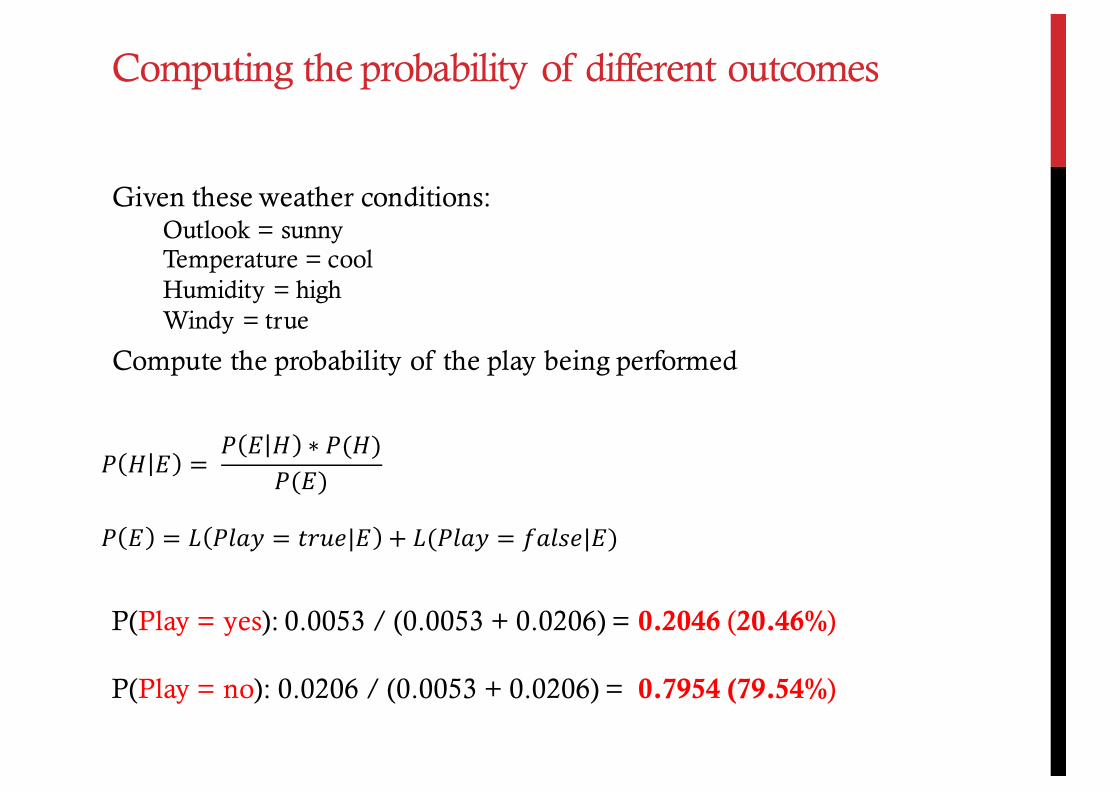
Given these weather conditions:Outlook = sunnyTemperature = coolHumidity = highWindy = true
Compute the probability of the play being performed
P(Play = yes): 0.0053 / (0.0053 + 0.0206) = 0.2046 (20.46%)
P(Play = no): 0.0206 / (0.0053 + 0.0206) = 0.7954 (79.54%)
Computing the probability of different outcomes
! " # = ! # " ∗ !(")!(#)
! # = ) !*+, = -./0|# + )(!*+, = 3+*40|#)
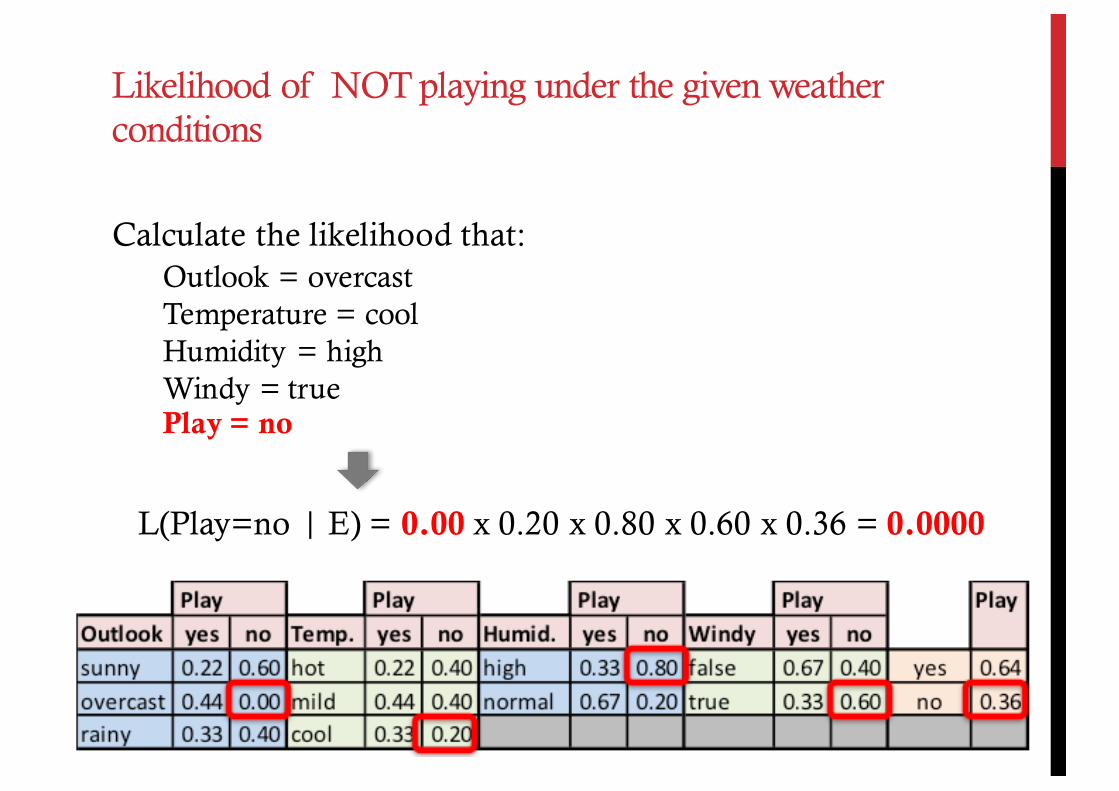
Calculate the likelihood that:Outlook = overcastTemperature = coolHumidity = highWindy = truePlay = no
L(Play=no | E) = 0.00 x 0.20 x 0.80 x 0.60 x 0.36 = 0.0000
Likelihood of NOT playing under the given weather conditions
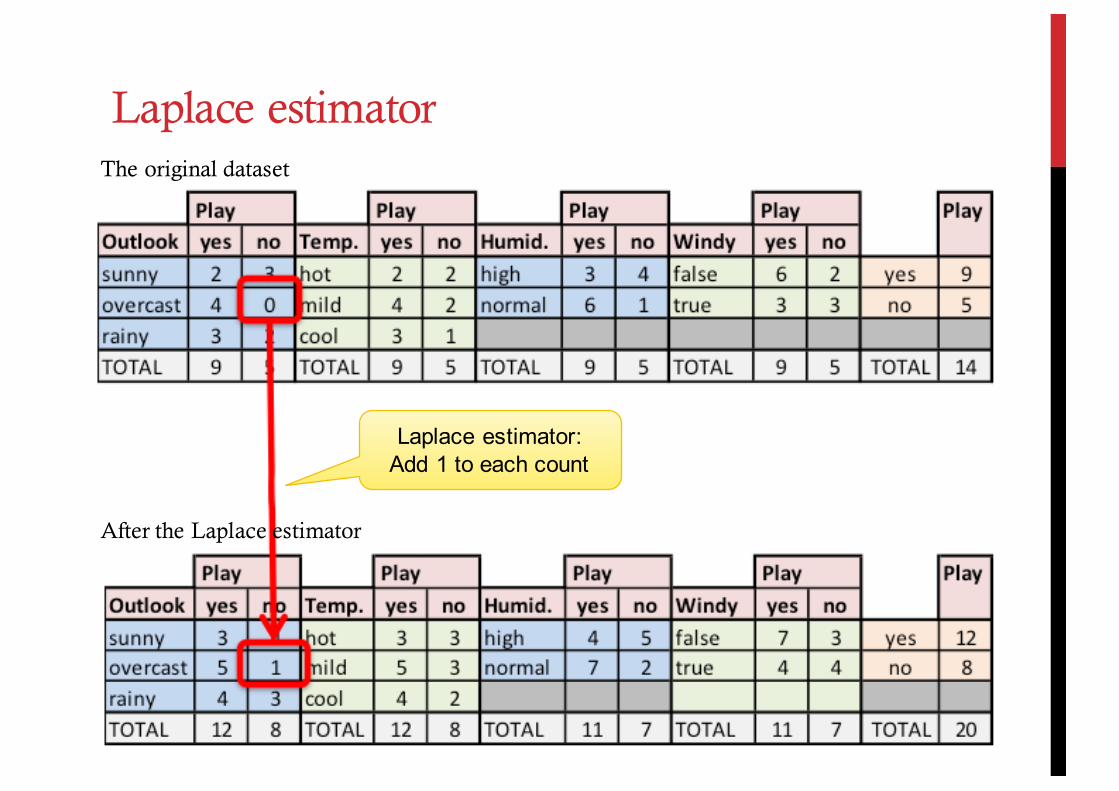
Laplace estimator: Add 1 to each count
The original dataset
Laplace estimator
After the Laplace estimator
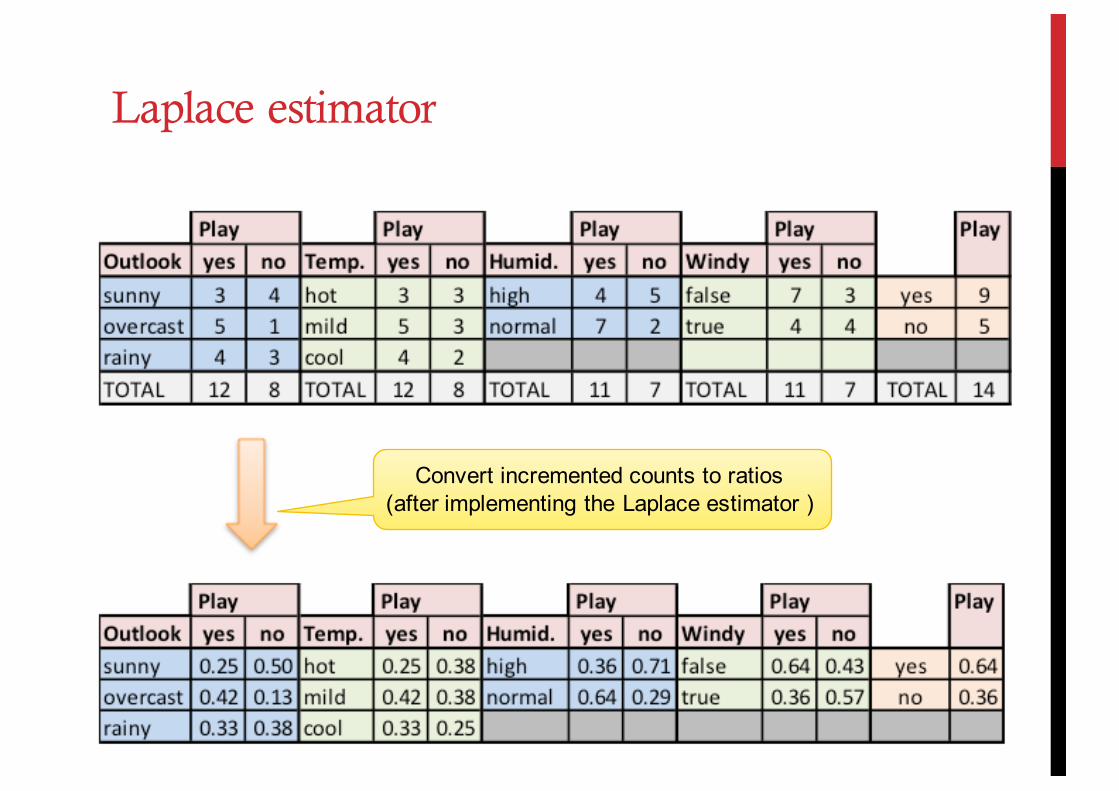
Convert incremented counts to ratios (after implementing the Laplace estimator )
Laplace estimator
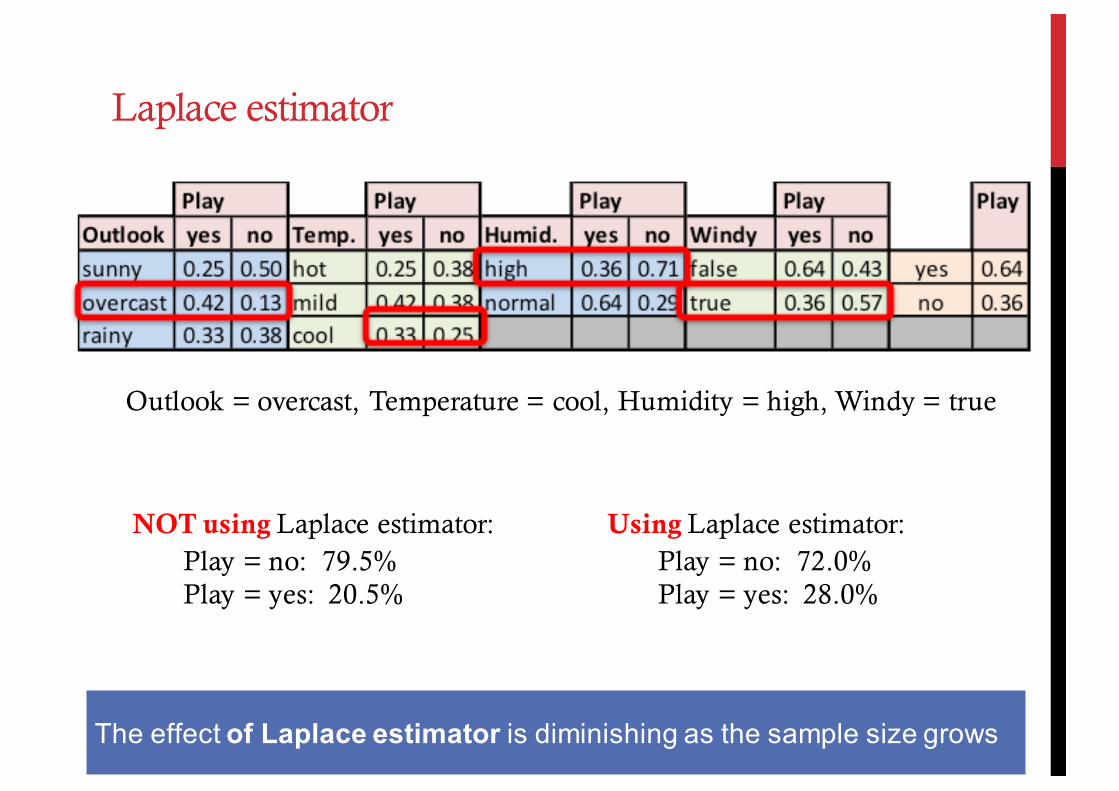
Outlook = overcast, Temperature = cool, Humidity = high, Windy = true
Laplace estimator
NOT using Laplace estimator:Play = no: 79.5%Play = yes: 20.5%
Using Laplace estimator:Play = no: 72.0%Play = yes: 28.0%
The effect of Laplace estimator is diminishing as the sample size grows
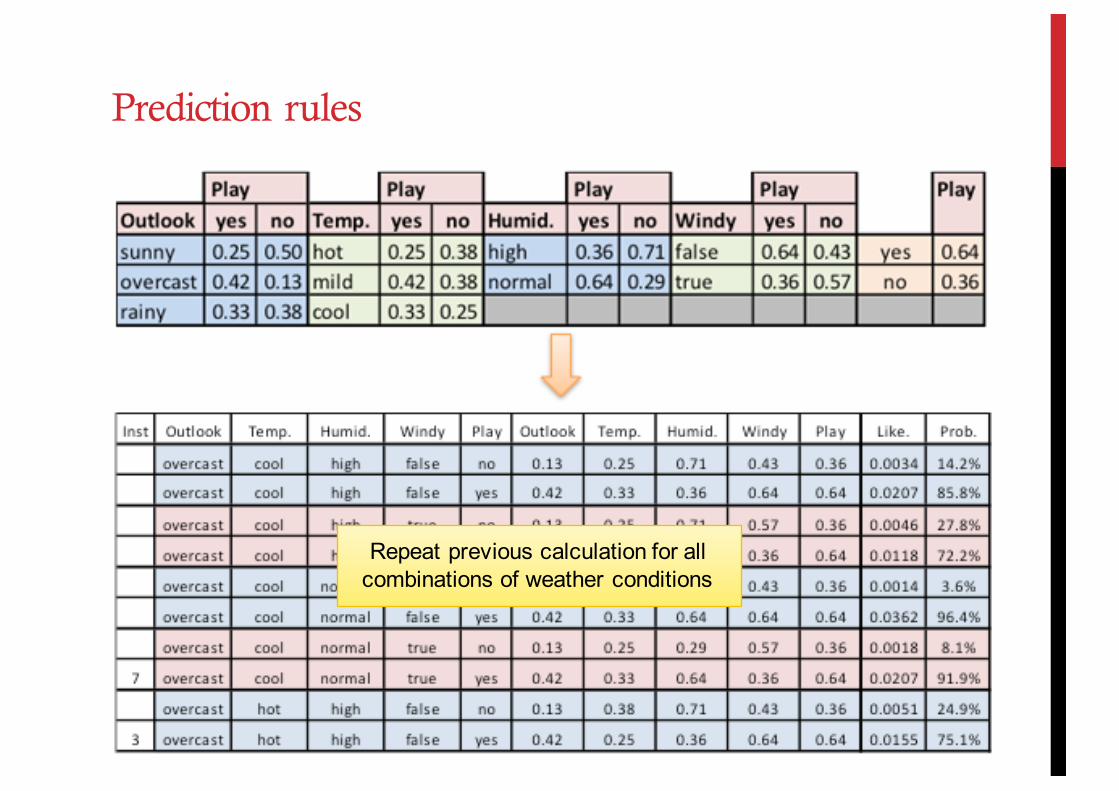
Repeat previous calculation for all combinations of weather conditions
Prediction rules
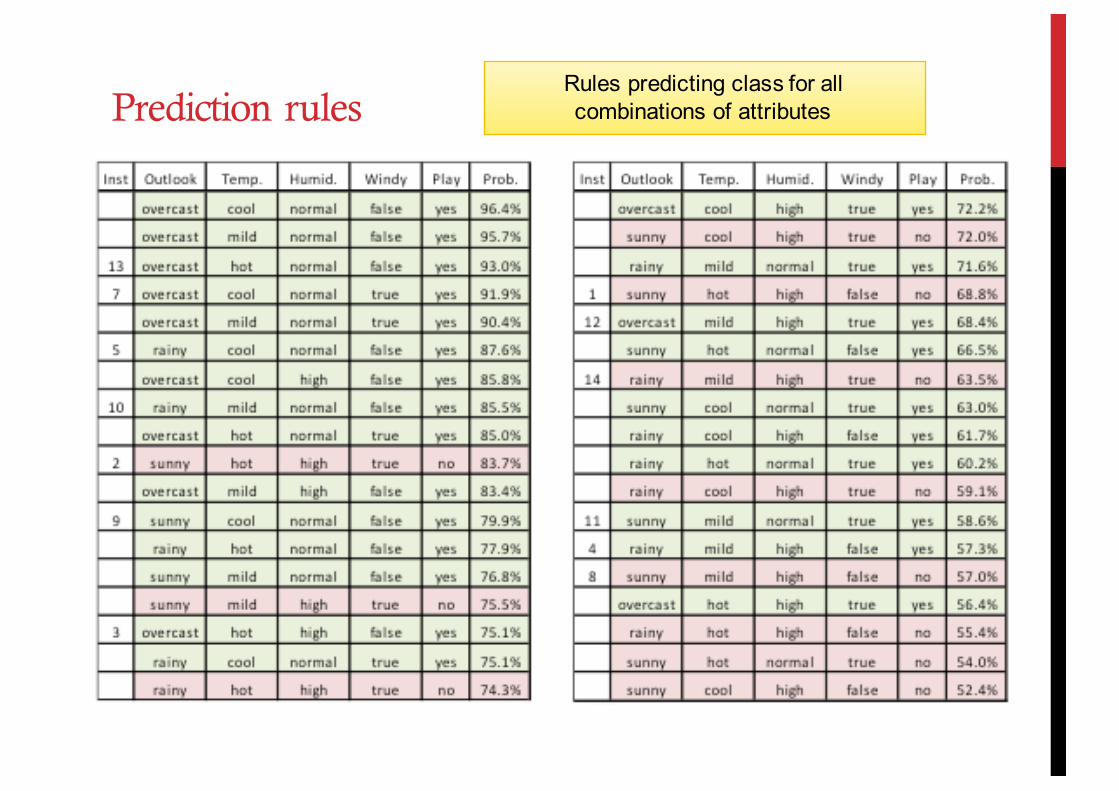
Rules predicting class for all combinations of attributes Prediction rules
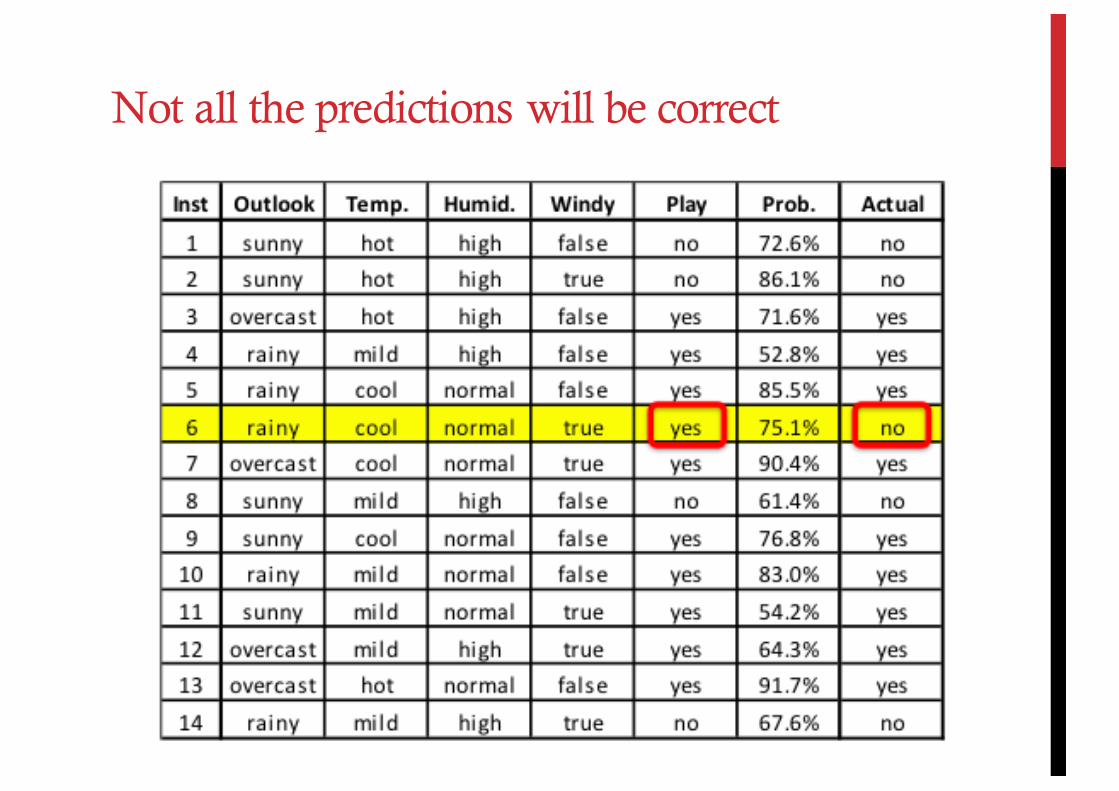
Not all the predictions will be correct
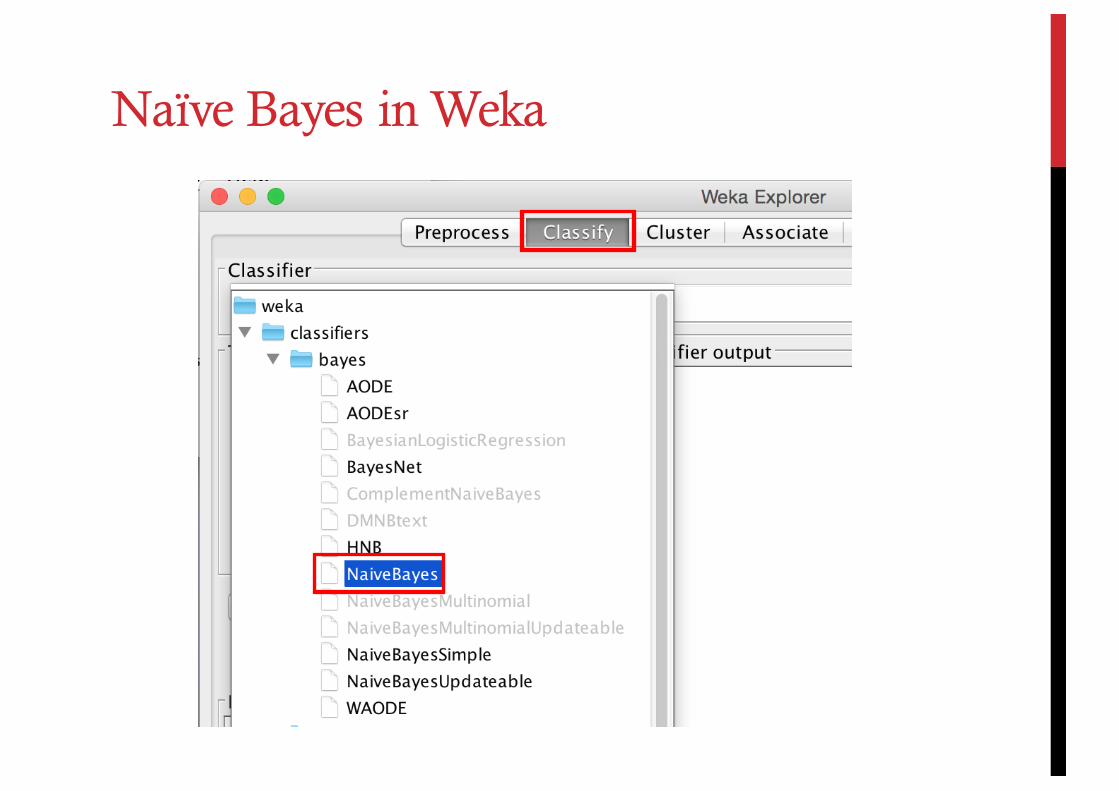
Naïve Bayes in Weka
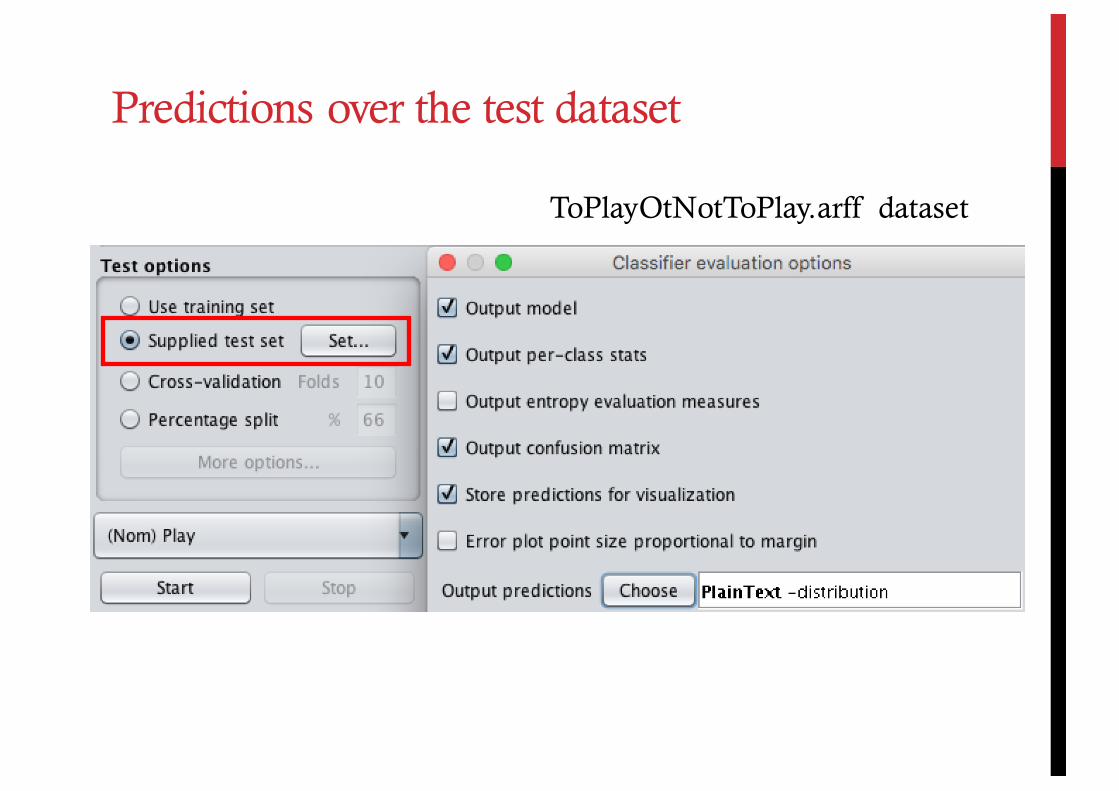
ToPlayOtNotToPlay.arff dataset
Predictions over the test dataset
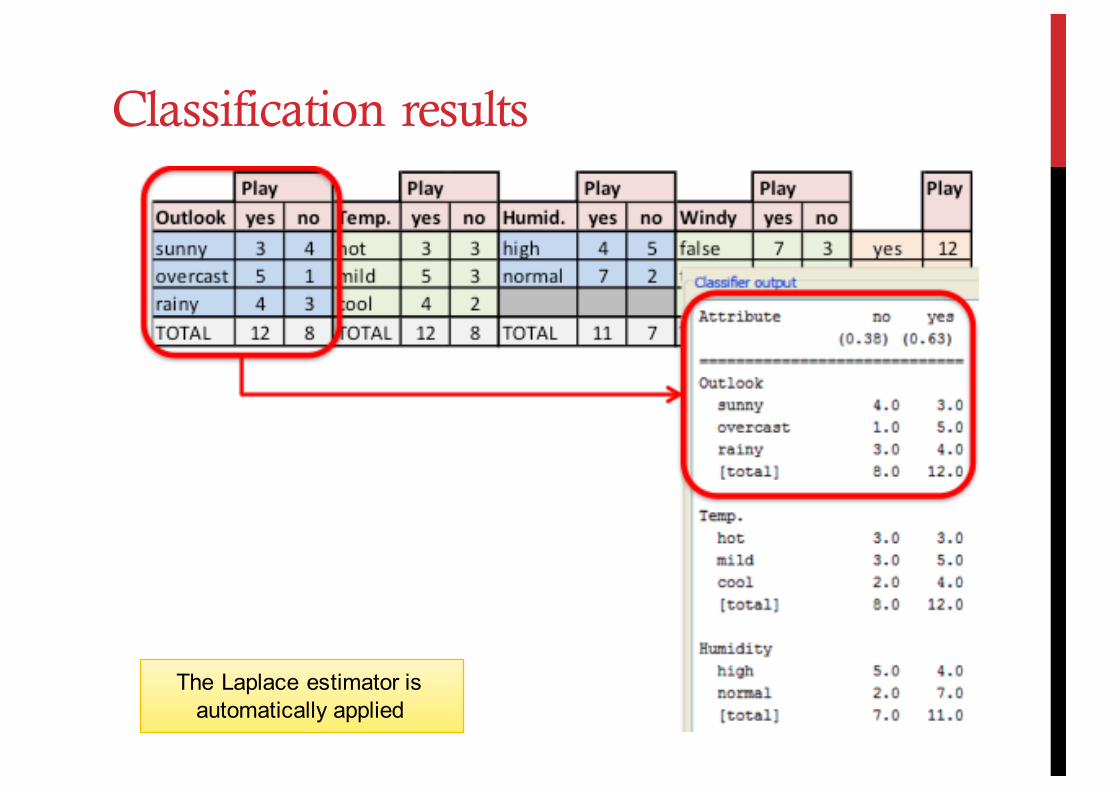
The Laplace estimator is automatically applied
Classification results
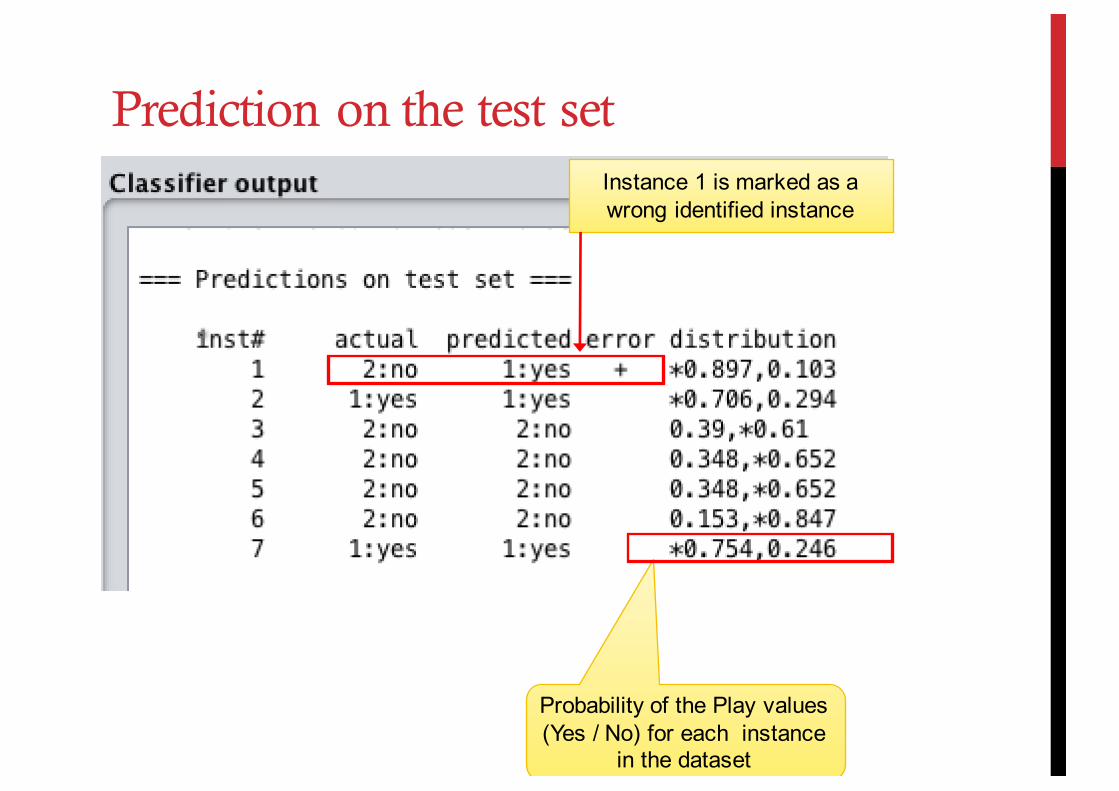
Instance 1 is marked as a wrong identified instance
Probability of the Play values (Yes / No) for each instance
in the dataset
Prediction on the test set
Naïve Bayes features
• Typically used with nominal attributes
• In case of a numeric attribute:
• Use the probability distribution of the attribute to estimate probabilities for the attribute’s values (Normal distribution is often used)
• Discretize the attribute
Baseline classifier

Baseline classifier
• There are total of 768 instances (500 negative, 268 positive)
• A priori probabilities for negative and positive classes are
• Baseline classifier classifies every instances to the dominant class,
the most represented class in the training set
• In Weka, the implementation of baseline classifier is the ZeroR
Java class
!"#$%&'" = 500768 = 0.651
!"#$%$&' = 268768 = 0.349
diabetes.arff
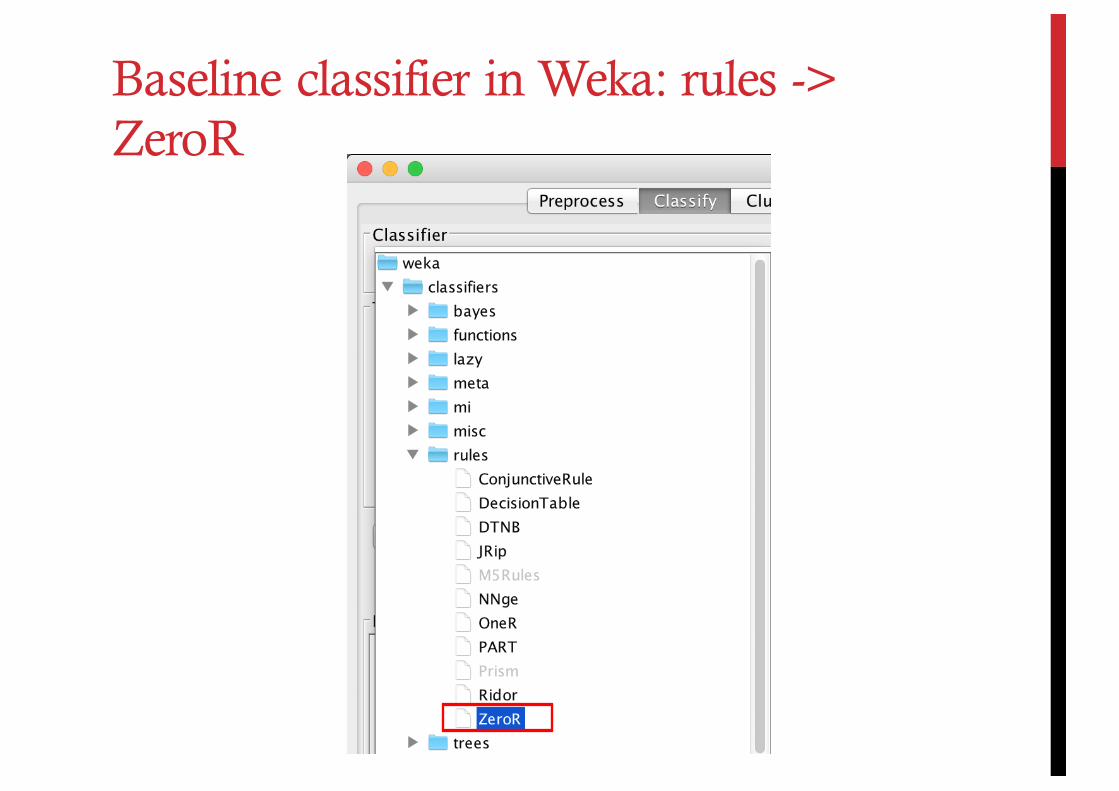
Baseline classifier in Weka: rules -> ZeroR
Baseline classifier
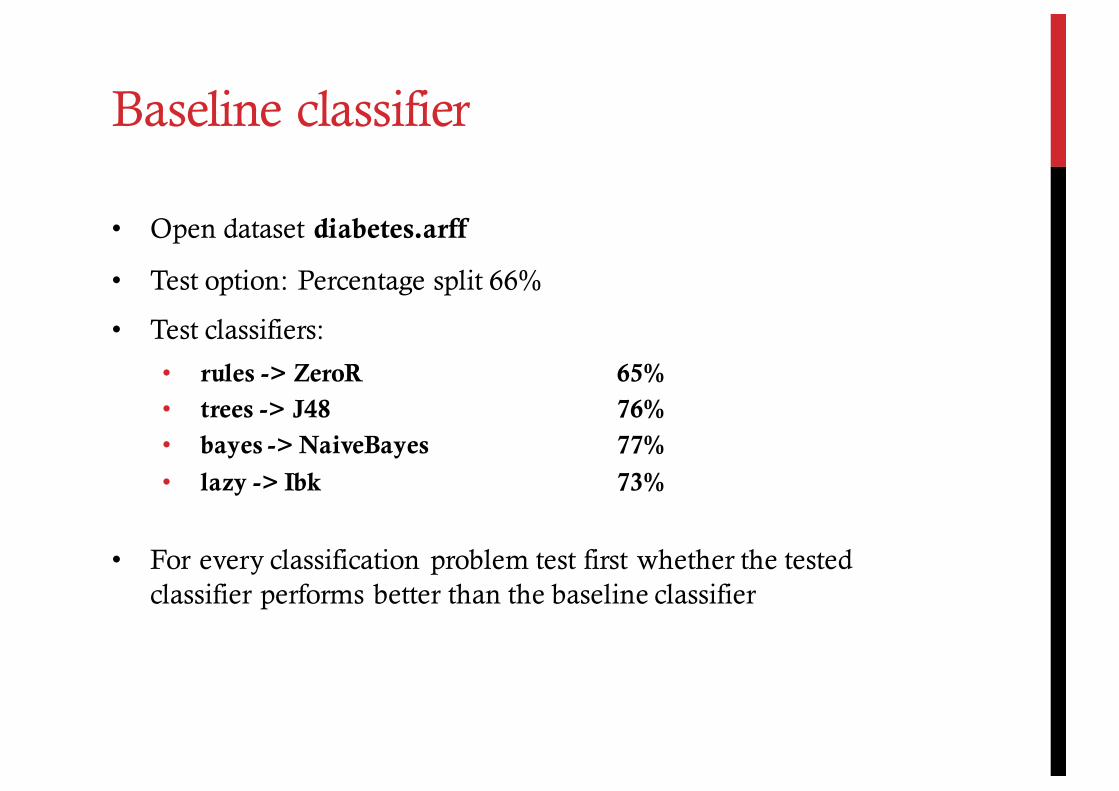
• Open dataset diabetes.arff
• Test option: Percentage split 66%
• Test classifiers:
• rules -> ZeroR 65%• trees -> J48 76%• bayes -> NaiveBayes 77%
• lazy -> Ibk 73%
• For every classification problem test first whether the tested classifier performs better than the baseline classifier
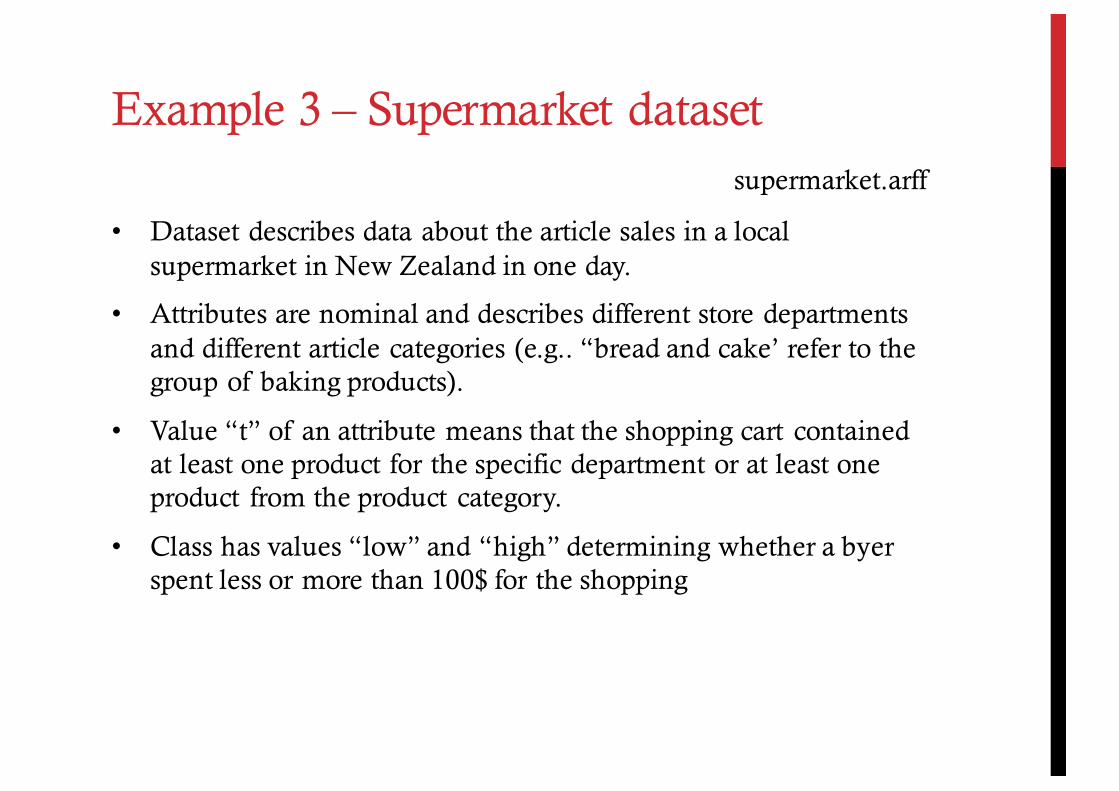
Example 3 – Supermarket dataset
• Dataset describes data about the article sales in a local supermarket in New Zealand in one day.
• Attributes are nominal and describes different store departments and different article categories (e.g.. “bread and cake’ refer to the group of baking products).
• Value “t” of an attribute means that the shopping cart contained at least one product for the specific department or at least one product from the product category.
• Class has values “low” and “high” determining whether a byer spent less or more than 100$ for the shopping
supermarket.arff
"Data Mining with Weka" and "More Data Mining with Weka": MOOCs from the University of Waikato.
• Link: https://www.youtube.com/user/WekaMOOC/
Recommendations and credits

(Anonymous) survey for your comments and suggestions:
http://goo.gl/cqdp3I