Embed Size (px)
Citation preview
Classification and Recognition of Fingerprints using Self
Organizing Maps(SOM)
J.B Hayfron-Acquah1, Mavis Sarah Gyimah2
1Kwame Nkrumah University of Science & Technology
Department of Computer Science,
Kumasi / Ghana.
2Kwame Nkrumah University of Science & Technology
Department of Computer Science,
Kumasi / Ghana
Abstract
Feature extraction and matching are important in automatic
fingerprint identification systems(AFIS) in the field of
biometric technology. In this work, a filter-based algorithm
uses a bank of Gabor filters to capture local and global
features in a fingerprint as a compact fixed length
FingerCode. These fingercodes are matched using Self
Organizing Maps (SOM). Promising results of
classification of fingerprints in research works using
neural network has pushed us to exploit another version of
neural networks, SOM and to develop codes and
recognition algorithms which are associated to this system.
Our Experimental results demonstrate the robustness of
our algorithm in terms of Total Acceptance Rate (TSR),
False Rejection Rate (FRR) and False Acceptance
Rate(FAR).
Keywords: Fingerprints, Biometrics, Fingercodes, Gabor
Filters, Self Organising Maps (SOM).
1. Introduction
Biometrics, the ability to identify an individual based on
his or her physiological, behavioral, chemical and
biological characteristics, has the potential to reliably
distinguish between an authorized person and an imposter.
Biometrics is used in two major ways: Identification and
Verification.
Identification is determining who a person is. It involves
taking the measured characteristic and trying to find a
match in a database containing records of people and that
characteristic.
Verification is determining if a person is who they say
they are. It involves taking the measured characteristic and
comparing it to the previously recorded data for that
person.
Biometrics can be divided into three branches namely
physiological (e.g. face, fingerprint, hand, iris), Behavioral
(e.g. keystroke, gait, signature, voice), and Chemical and
Biological (eg. DNA, blood glucose, skin Spectrograph).
Among all the biometrics, fingerprint-based identification
is one of the most mature and well known technique
because fingerprint contains the following significant
characteristics:
Acceptability: this is the degree of approval of a
technology.
Uniqueness: is how well the biometric separates
individually from another.
Collectability: ease of acquisition for
measurement.
Permanence: measures how well a biometric
resists aging.
Performance: accuracy, speed, and robustness of
technology used.
IJCSI International Journal of Computer Science Issues, Vol. 11, Issue 1, No 1, January 2014 ISSN (Print): 1694-0814 | ISSN (Online): 1694-0784 www.IJCSI.org 153
Copyright (c) 2014 International Journal of Computer Science Issues. All Rights Reserved.
Circumvention: ease of use of a substitute.
The finger tip surface is covered by a pattern of ridges and
valleys. These ridges and valleys contain information
(minutiae) that is very important in fingerprint recognition. According to Rao and Jain (1992), the pattern of ridges
and valleys in a fingerprint can be viewed as an oriented
texture field, whose height and direction vary
continously.Therefore points on a fingerprint image have a
dominant local orientation and a local measure of
coherence from their flow pattern. The uniqueness of a
fingerprint is exclusively determined by the local ridge
characteristics and their relationships, Hong et al (1998).
These unique characteristics heavily depend on the quality
of the impression conditions and quality of the fingerprint
image.
Anomalies in ridge flow pattern are characterized as
Minutiae points which consists of ridge ending; the point at
which a ridge terminates and Bifurcations; the points at
which a single ridge splits into two ridges. Some
researchers classify fingerprints by using algorithms to
detect the presence of Singular Points (SP) which are the
cores and deltas on the fingerprint surface, Kalle karu and
Anil K.Jain (1996).
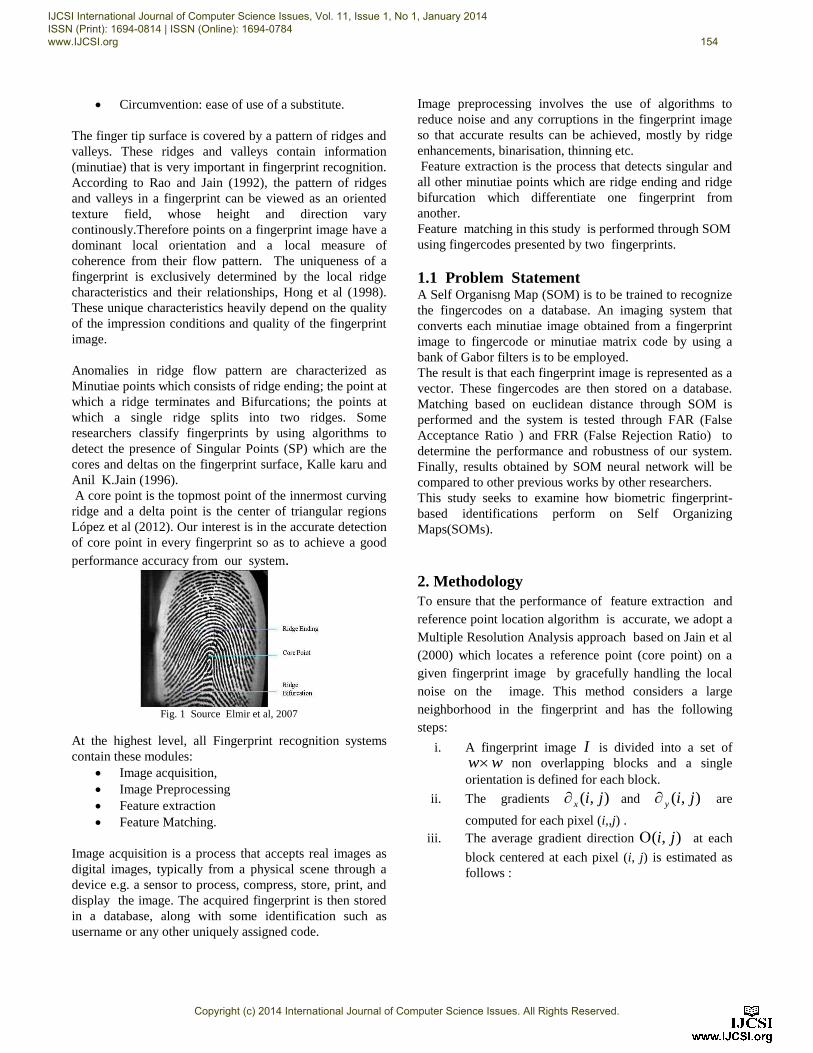
A core point is the topmost point of the innermost curving
ridge and a delta point is the center of triangular regions
López et al (2012). Our interest is in the accurate detection
of core point in every fingerprint so as to achieve a good
performance accuracy from our system.
Fig. 1 Source Elmir et al, 2007
At the highest level, all Fingerprint recognition systems
contain these modules:
Image acquisition,
Image Preprocessing
Feature extraction
Feature Matching.
Image acquisition is a process that accepts real images as
digital images, typically from a physical scene through a
device e.g. a sensor to process, compress, store, print, and
display the image. The acquired fingerprint is then stored
in a database, along with some identification such as
username or any other uniquely assigned code.
Image preprocessing involves the use of algorithms to
reduce noise and any corruptions in the fingerprint image
so that accurate results can be achieved, mostly by ridge
enhancements, binarisation, thinning etc.
Feature extraction is the process that detects singular and
all other minutiae points which are ridge ending and ridge
bifurcation which differentiate one fingerprint from
another.
Feature matching in this study is performed through SOM
using fingercodes presented by two fingerprints.
1.1 Problem Statement A Self Organisng Map (SOM) is to be trained to recognize
the fingercodes on a database. An imaging system that
converts each minutiae image obtained from a fingerprint
image to fingercode or minutiae matrix code by using a
bank of Gabor filters is to be employed.
The result is that each fingerprint image is represented as a
vector. These fingercodes are then stored on a database.
Matching based on euclidean distance through SOM is
performed and the system is tested through FAR (False
Acceptance Ratio ) and FRR (False Rejection Ratio) to
determine the performance and robustness of our system.
Finally, results obtained by SOM neural network will be
compared to other previous works by other researchers.
This study seeks to examine how biometric fingerprint-
based identifications perform on Self Organizing
Maps(SOMs).
2. Methodology
To ensure that the performance of feature extraction and
reference point location algorithm is accurate, we adopt a
Multiple Resolution Analysis approach based on Jain et al
(2000) which locates a reference point (core point) on a
given fingerprint image by gracefully handling the local
noise on the image. This method considers a large
neighborhood in the fingerprint and has the following
steps:
i. A fingerprint image I is divided into a set of
w w non overlapping blocks and a single
orientation is defined for each block.
ii. The gradients ( , )x i j and ( , )y i j are
computed for each pixel (i,,j) .
iii. The average gradient direction ( , )i j at each
block centered at each pixel (i, j) is estimated as
follows :
IJCSI International Journal of Computer Science Issues, Vol. 11, Issue 1, No 1, January 2014 ISSN (Print): 1694-0814 | ISSN (Online): 1694-0784 www.IJCSI.org 154
Copyright (c) 2014 International Journal of Computer Science Issues. All Rights Reserved.
2 2
2 2
( , ) 2 ( , ) ( , )
w wi j
x x yw w
u i v j
V i j u v u v
(1)
2 22 2
2 2
( , ) ( ( , ) ( , ))
w wi j
y x yw w
u i v j
V i j u v u v
(2)
1 ( , )1( , ) tan
2 ( , )
x
y
V i ji j
V i j
(3)
Local ridge orientation is usually specified for a block
rather than at every pixel;
( , )i j , is the least square estimate of the local ridge
orientation of the block centered at pixel ( i, j ).
Orientation of a local ridge may not always be correct
because of the presence of noise. We smooth the
orientation field in the local neighbourhood. To enable us
to perform smoothing (low pass filtering), the orientation
image is converted into a continuous vector field through
the following. A unit integral filter with size
w w is adopted to smooth the orientation field:
( , ) cos(2 ( , )),x i j i j (4)
( , ) sin(2 ( , )),y i j i j (5)
Where x and y are the x and y components of the
vector field, respectively. A low-pass filter below is
applied to the continuous vector field.
2 2'
2 2
( , ) ( , ). ( , )
w w
x xw w
u v
i j W u v i uw j vw
(6)
2 2'
2 2
( , ) ( , ). ( , )
w w
y yw w
u v
i j W u v i uw j vw
(7)
W is a two-dimensional low-pass filter with unit integral.
The smoothed orientation field of the fingerprint image at
each pixel (i, j) is computed using:
'
' 1
'
( , )1( , ) tan
2 ( , )
y
x
i ji j
i j
(8)
We compute , an image containing only the sine
component of ' .
'( , ) sin( ( , ))i j i j (9)
iv) Initialize A , a label image used to indicate the
reference point.
v) For every pixel ( , )i j in , we integrate pixel
intensities and assign the corresponding pixels in A the
value of their difference
1
( , ) ( , ) ( , )IIR R
A i j i j i j (10)
where IR and
IIR are Regions for integrating E pixel intensities
for A(i; j). vi) We find the maximum value and assign its coordinate
to the core, i.e., the reference point
vii) For a fixed number of times, we repeat steps (i) – (vi)
by using a window size of ' 'w w , where
'w w and
restrict the search for the reference point in step (vi) in a
local neighborhood of the detected reference point.
2.1 Tessellation of the Region of Interest
Our region of interest is defined as the collection of all the
sectors is , where the ith sector is is computed in terms
of parameters ( , )r as follows:
1( , ) ( 2), ,1 ,1i i i iS x y b T x N y M (11)
where,
iT idivk (12)
2( mod ) ( )i i k
k
(13)
2 2( ) ( )c cr x x y y (14)
1 ( )tan ( )
( )
c
c
y y
x x
(15)
b is the width of each band, k is the number of sectors
considered in each band, 0...( 1)i B k , where B is
the number of concentric bands considered around the
reference point for feature extraction. These parameters
depend on the image size and resolution. Before we filter
the fingerprint image, we normalize the region of interest
in each sector separately to a constant mean and variance.
IJCSI International Journal of Computer Science Issues, Vol. 11, Issue 1, No 1, January 2014 ISSN (Print): 1694-0814 | ISSN (Online): 1694-0784 www.IJCSI.org 155
Copyright (c) 2014 International Journal of Computer Science Issues. All Rights Reserved.
Let ( , )I x y denote the gray value at pixel (x,y), iM and
iV , the estimated mean and variance of sector is ,
respectively, and ( , )iN x y , the normalized gray-level
value at pixel (x,y), For all the pixels in sector is , the
normalized image is given by:
2
2
( ( , ) ) ), ( , )
( , )
( ( , ) ) )
O io i
i
i
O io
i
V I x y MM ifI x y M
VN x y
V I x y MM
V
(16)
MO and Vo are the desired mean and variance values
respectively.
A properly tuned Gabor filters is used to remove noise,
preserve information contained in a particular orientation
in the image Jain et al (2000).
' '
'2 '2'
2 2
1( , : , ) exp cos(2 )
2x y
x yG x y f fx
(17)
' sin cosx x y (18)
' cos siny x y (19)
where f is the frequency of the sinusoidal plane wave
along the direction from the x -axis, 'x and 'y
and are
the space constants of the Gaussian envelope
along'x and
'y axes, respectively.
0 0 0 0 0 0 0 00 ,22.5 ,45 ,67.5 ,90 ,112.5 ,135 157.5 with
respect to the x-axis.
Let ( , )iF x y be the -direction filtered image for a
sector. Now, {0,1,.....,79}i and
0 0 0 0 0 0 0 0{0 ,22.5 ,45 ,67 ,90 ,112.5 ,135 ,157.5 } , the
feature value, iV , is the average absolute deviation from
the mean defined as
1
( , )i
i i i
ni
V F x y Pn
(20)
where in is the number of pixels in iS and iP is the mean
of pixel values of ( , )iF x y in sector iS . The average
absolute deviation of each sector in each of the eight
filtered images defines the components of our feature
vector.
Feature values are collected based on two different
rotations, The feature value is composed of an ordered
enumeration of the features extracted from the (local)
information contained in each sub image (sector) specified
by the tessellation.
Fingerprint Verification Competition (FVC) 2004 database
consisting of 110 fingers with eight impressions per finger
totaling 880 fingerprints is used for this work. Our
experiment is run on MATLAB R2012a with windows
application running on 64-bit operating system having the
following specifications:
Intel(R) Core (Tm) i5-3210M CPU (Processor)
6 GB of RAM (Memory)
750 GB (Hard Disk)
Windows 7 Home Premium installed as the
Operating System (OS). SOM downloaded free
from http://www.cis.hut.fi/projects/somtoolbox
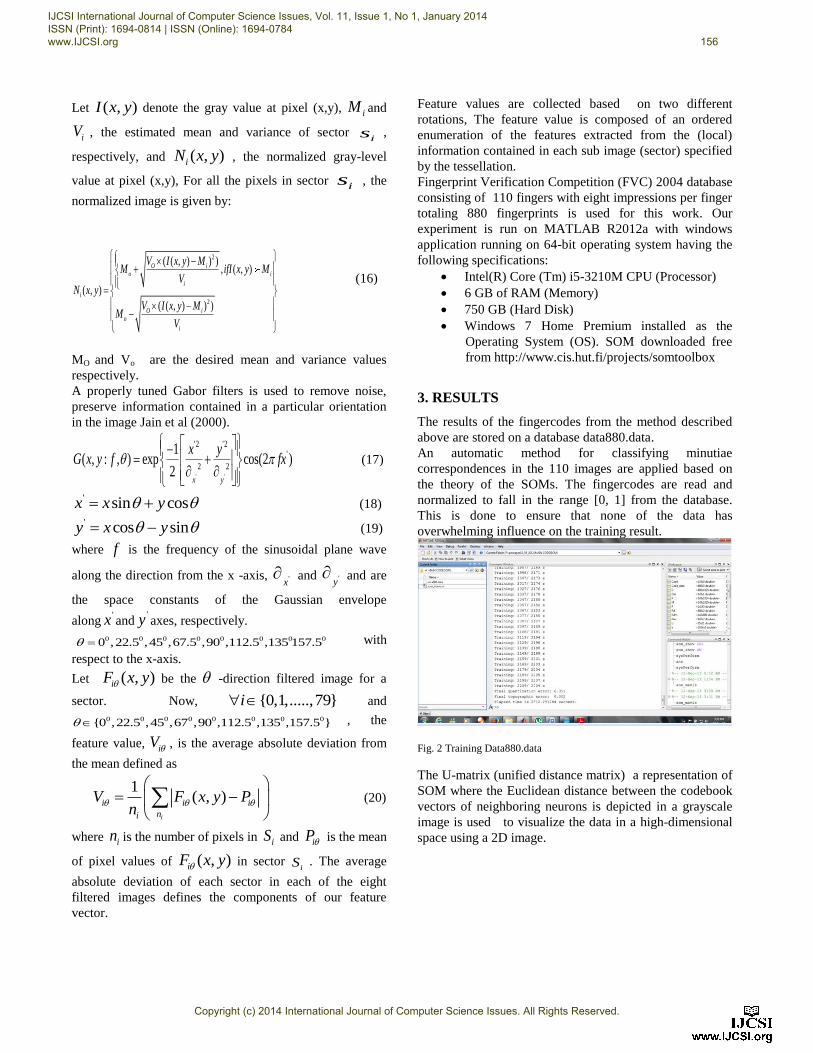
3. RESULTS
The results of the fingercodes from the method described
above are stored on a database data880.data.
An automatic method for classifying minutiae
correspondences in the 110 images are applied based on
the theory of the SOMs. The fingercodes are read and
normalized to fall in the range [0, 1] from the database.
This is done to ensure that none of the data has
overwhelming influence on the training result.
Fig. 2 Training Data880.data
The U-matrix (unified distance matrix) a representation of
SOM where the Euclidean distance between the codebook
vectors of neighboring neurons is depicted in a grayscale
image is used to visualize the data in a high-dimensional
space using a 2D image.
IJCSI International Journal of Computer Science Issues, Vol. 11, Issue 1, No 1, January 2014 ISSN (Print): 1694-0814 | ISSN (Online): 1694-0784 www.IJCSI.org 156
Copyright (c) 2014 International Journal of Computer Science Issues. All Rights Reserved.
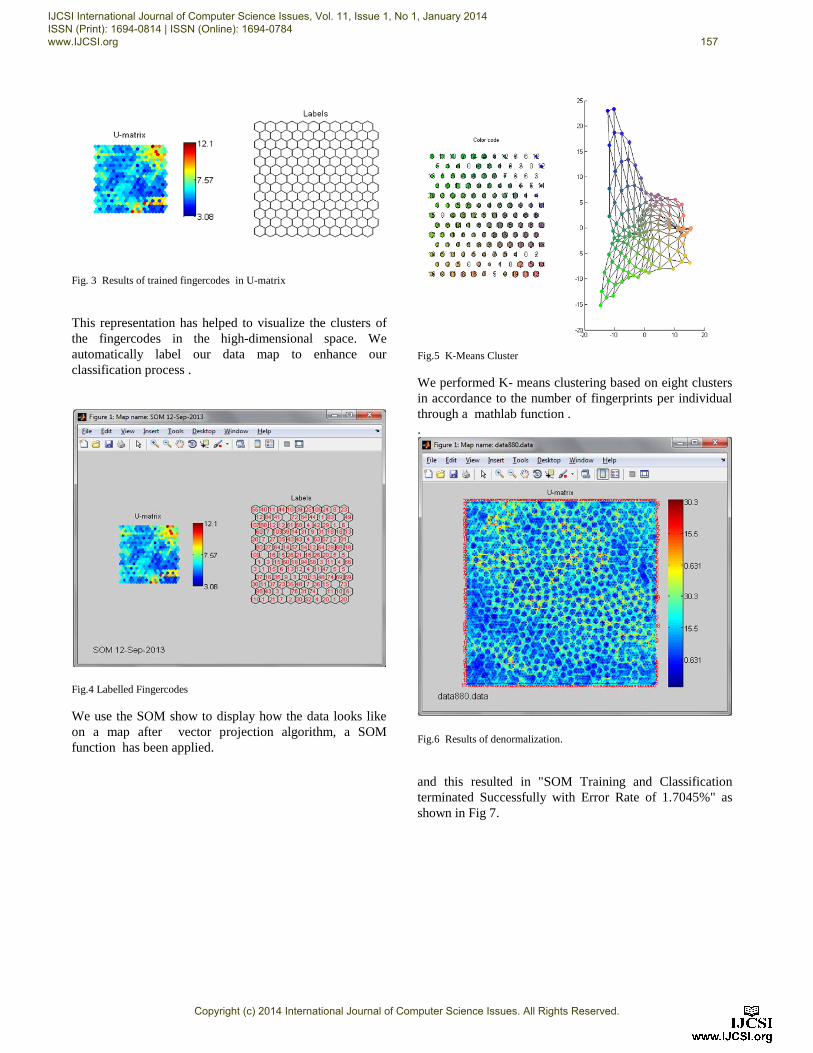
Fig. 3 Results of trained fingercodes in U-matrix
This representation has helped to visualize the clusters of
the fingercodes in the high-dimensional space. We
automatically label our data map to enhance our
classification process .
Fig.4 Labelled Fingercodes
We use the SOM show to display how the data looks like
on a map after vector projection algorithm, a SOM
function has been applied.
Fig.5 K-Means Cluster
We performed K- means clustering based on eight clusters
in accordance to the number of fingerprints per individual
through a mathlab function .
.
Fig.6 Results of denormalization.
and this resulted in "SOM Training and Classification
terminated Successfully with Error Rate of 1.7045%" as
shown in Fig 7.
IJCSI International Journal of Computer Science Issues, Vol. 11, Issue 1, No 1, January 2014 ISSN (Print): 1694-0814 | ISSN (Online): 1694-0784 www.IJCSI.org 157
Copyright (c) 2014 International Journal of Computer Science Issues. All Rights Reserved.

Fig. 7 Results of SOM classification
This result pushed us to exploit SOM for biometric
recognition Testing, using the FAR (false Acceptance
Ratio) and FRR (False Rejection Ratio) performance
ratios.
FAR is the fraction of times the system incorrectly
identifies two fingercodes representing the same finger.
FAR is given by:
number of falsely accepted imagesFAR=
Total number of persons out of the database
A database FAR.data was created by taking the last 80
generated fingercodes from the 880 fingerprints in
data880.data.
.
FRR (False Rejection Ratio) is given by :
number of falsely rejected imagesFRR=
Total number of persons in the database
FRR.data is created by taking 100 fingercodes out of
data880.data.. These are the fingercodes of the eighth
fingerprint image of each individual.
The remaining 700 fingercodes are stored in a different file
data880Attempt.data.The data in FAR.data is untrained
and the 700 fingercodes are trained on SOM. Matches
between the FAR.data and data880Attempt.data generated
0% error. However matches between the FRR.data and
data880Attempt.data generated an 18% error.
This means we have achieved a Total success Rate of
82%.The FAR was implemented by testing FAR.data
against data880.com collected. The FRR was implemented
by collecting the eighth fingercode of each individual
numbering 100 fingercodes against the remaining 700
fingercodes.
In ideal case FAR and FRR should be zero. In practice this
is not so because a given biometric application will dictate
the FAR and FRR requirements. For instance access to
ATM needs a small FRR whilst military installation
requires a very small FAR. The overall total success rate of
82 % is acceptable when compared to the performances
achieved by other researchers in the biometric field as
shown in fig 8.
Fig. 8 Results of FAR, FRR,TSR
3.1 COMPARISON OF WORK:
We compare our work by looking at other research works
with the results obtained. Elmir et al, 2007 "Personal
Identification by Fingerprints based on Gabor Filters"
using Spike Neural Network achieved 73.68% recognition
rate on FVC2004 DB3 A.
Other research works we looked at were performed using
different database , but we observed their recognition rates.
Zhou et al, 2004 on FVC 2000, "Singular Points Analysis
in Fingerprints Based on Topological Structure and
Orientation Field". The percentages for correct, missing,
and false detection are :
Correct Missing False
Detection
Percentage 80.6% 14.6% 4.8% Table 1 The performance of the proposed algorithm Source:
4. Conclusion
We have demonstrated the power of computational
neuroscience in areas as diverse as artificial intelligence.
We have achieved an identification accuracy with a
performance level of TSR of 82% which is comparable to
results obtained by other methods on minutiae-based
fingerprint. The prime advantage of our method is with
decreasing time cost of matching saliently. However,
because reference point cannot be accurately located in a
noisy image and since the generation of fingercodes
IJCSI International Journal of Computer Science Issues, Vol. 11, Issue 1, No 1, January 2014 ISSN (Print): 1694-0814 | ISSN (Online): 1694-0784 www.IJCSI.org 158
Copyright (c) 2014 International Journal of Computer Science Issues. All Rights Reserved.
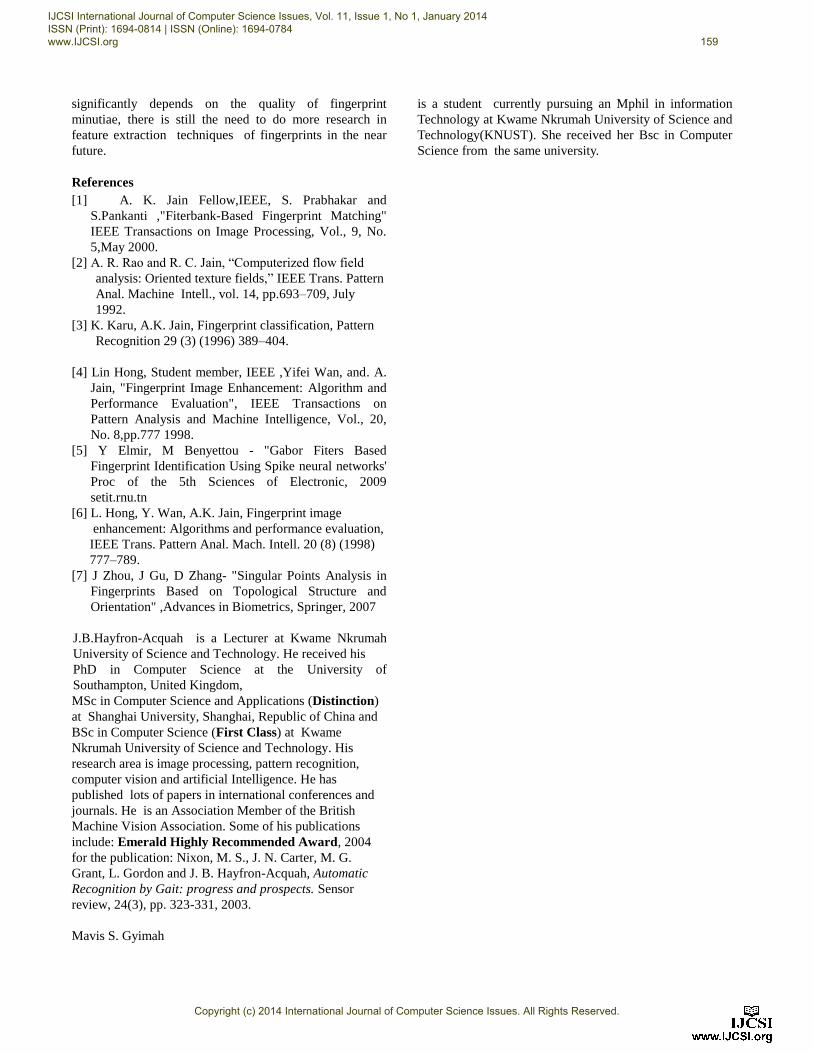
significantly depends on the quality of fingerprint
minutiae, there is still the need to do more research in
feature extraction techniques of fingerprints in the near
future.
References
[1] A. K. Jain Fellow,IEEE, S. Prabhakar and
S.Pankanti ,"Fiterbank-Based Fingerprint Matching"
IEEE Transactions on Image Processing, Vol., 9, No.
5,May 2000.
[2] A. R. Rao and R. C. Jain, “Computerized flow field
analysis: Oriented texture fields,” IEEE Trans. Pattern
Anal. Machine Intell., vol. 14, pp.693–709, July
1992.
[3] K. Karu, A.K. Jain, Fingerprint classification, Pattern
Recognition 29 (3) (1996) 389–404.
[4] Lin Hong, Student member, IEEE ,Yifei Wan, and. A.
Jain, "Fingerprint Image Enhancement: Algorithm and
Performance Evaluation", IEEE Transactions on
Pattern Analysis and Machine Intelligence, Vol., 20,
No. 8,pp.777 1998.
[5] Y Elmir, M Benyettou - "Gabor Fiters Based
Fingerprint Identification Using Spike neural networks'
Proc of the 5th Sciences of Electronic, 2009
setit.rnu.tn
[6] L. Hong, Y. Wan, A.K. Jain, Fingerprint image
enhancement: Algorithms and performance evaluation,
IEEE Trans. Pattern Anal. Mach. Intell. 20 (8) (1998)
777–789.
[7] J Zhou, J Gu, D Zhang- "Singular Points Analysis in
Fingerprints Based on Topological Structure and
Orientation" ,Advances in Biometrics, Springer, 2007
J.B.Hayfron-Acquah is a Lecturer at Kwame Nkrumah
University of Science and Technology. He received his
PhD in Computer Science at the University of
Southampton, United Kingdom,
MSc in Computer Science and Applications (Distinction)
at Shanghai University, Shanghai, Republic of China and
BSc in Computer Science (First Class) at Kwame
Nkrumah University of Science and Technology. His
research area is image processing, pattern recognition,
computer vision and artificial Intelligence. He has
published lots of papers in international conferences and
journals. He is an Association Member of the British
Machine Vision Association. Some of his publications
include: Emerald Highly Recommended Award, 2004
for the publication: Nixon, M. S., J. N. Carter, M. G.
Grant, L. Gordon and J. B. Hayfron-Acquah, Automatic
Recognition by Gait: progress and prospects. Sensor
review, 24(3), pp. 323-331, 2003.
Mavis S. Gyimah
is a student currently pursuing an Mphil in information
Technology at Kwame Nkrumah University of Science and
Technology(KNUST). She received her Bsc in Computer
Science from the same university.
IJCSI International Journal of Computer Science Issues, Vol. 11, Issue 1, No 1, January 2014 ISSN (Print): 1694-0814 | ISSN (Online): 1694-0784 www.IJCSI.org 159
Copyright (c) 2014 International Journal of Computer Science Issues. All Rights Reserved.


![Handwritten Arabic Digits Recognition Using Bézier Curves · classification and recognition. 1-NN classifier was used for classification and recognition. S. Impedove et al. [2] developed](https://img.pdfslide.us/doc/110x75/5f09e1ba7e708231d428f302/handwritten-arabic-digits-recognition-using-bzier-curves-classification-and-recognition.jpg)