Embed Size (px)
Citation preview
CLASSIFICATION ANALYSIS OF TRAFFIC
IMPROVEMENT SITES
By Wilfred W. Recker/ M. ASCE, Gregory S. Root,2
and Michael G. McNally3
(Reviewed by the Urban Transportation Division)
ABSTRACT: Results of an application of the case study approach to the evaluation of alternate TSM strategies is presented. The procedure is useful in the classification of potential sites relative to their expected performance following implementation of specific TSM strategies designed to improve flow conditions. The specific focus of the paper is on the use of classification analysis as a means of transferring analysis results drawing from a small number of representative case studies to a broader range of alternate applications. This approach is shown to provide a reasonable and less costly alternative to individual site-by-site analyses.
INTRODUCTION
Use of case studies to draw inferences regarding potential generalizations has been used successfully in all branches of scientific research. Its application to the actual planning and design of engineering systems has, however, been very restricted. If employed at all, its use has been limited, in the great majority of cases, to demonstrat ing the feasibility of a concept rather than as an integral tool of analysis. This is explained in part by the generally great ratio of capital construction costs to engineering design/analysis costs associated with typical engineering projects. In such cases, cost savings associated with the design/analysis phase which are coupled to a corresponding loss in precision are not warranted.
This situation is changing, particularly in the area of transportation engineering. The combination of shrinking transportation dollars and an existing transportation infrastructure that is literally "cast in concrete" has led to increasing reliance on non-capital intensive TSM strategies for improving the performance of the transportation network. The relative costs of the engineering design/analysis phase of these projects often are greater than the actual implementation of the design. Such is the case, for example, in coordinated traffic signalization. In addition, because TSM improvements typically not only impact but are also dependent on the existing traffic system environment, evaluation of potential strategies often involves extensive and costly traffic simulation that is replicated over a broad range of alternate sites. Under these conditions,
'Prof., Dept. of Civ. Engrg., and Dir., Inst, of Transportation Studies, Univ. of California, Irvine, CA..
zAsst. Prof., Dept. of Civ. Engrg., Univ. of South Florida, Tampa, FL. 3Asst. Prof., Dept. of Civ. Engrg., Univ. of Southern California, Los Angeles,
CA. Note.—Discussion open until August 1, 1986. To extend the closing date one
month, a written request must be filed with the ASCE Manager of Journals. The manuscript for this paper was submitted for review and possible publication on August 9, 1985. This paper is part of the Journal of Transportation Engineering, Vol. 112, No. 2, March, 1986. ©ASCE, ISSN 0733-947X/86/0002-0184/$01.00, Paper No. 20458.
184
the case study approach may prove to be a useful tool at the sketch planning level to identify those sites which warrant detailed engineering analysis and evaluation relative to the particular TSM strategy proposed.
Of particular importance in the case study approach is the transferability of analysis results to a broad range of alternate applications. Only with such transferability can the case study results provide a reasonable and less costly alternative to individual site-by-site analysis.
Some results of an application of the case study approach to the evaluation of potential sites for implementation of specific TSM strategies are presented. The particular strategy which formed the basis for the study involved the use of flyovers at congested arterial intersections as a means of "unlocking" signal optimization strategies to produce a network of "continuous flow boulevards" or "super streets."
Flyovers, which are prefabricated low-cost grade separation bridges, have been used extensively and successfully in both Europe and the Middle East (Byington, 1981; Pleasants, 1980). The rapid construction time for the prefabricated flyover structures offers considerable advantage over conventional bridge construction at locations where the adjacent property is fully developed. The disruption to traffic caused by a conventional bridge construction schedule of 18-24 months would create serious impacts for surrounding businesses. The 30-day construction time schedule offered through use of prefabricated structures greatly minimizes this disruption. In addition, typical cost of a flyover is ap-proximtely $3,000,000 for a four-lane bridge which requires 100-120 ft of right-of-way.
Based on results obtained in a previous investigation (Recker, et al. 1985), several applications of flyovers are being planned in the southern California region. The Orange County Transportation Commission has initiated a "Super Streets Demonstration Project" which will include the placement of one or more flyovers along one of the busier major arterials in Orange County, CA. Construction of the first of these flyovers is scheduled for Mar., 1987. In addition, the city of Irvine, CA, has proposed using a series of flyovers on one of its major thoroughfares feeding its largest industrial complex. Also, using the methodology described in this paper, the Southern California Association of Governments has commissioned a major study to identify potential locations of a number of strategically-placed flyovers in the Greater Los Angeles area to establish a network of regional high flow arterials.
Case Study Approach.—The particular location of the study area for this demonstration of the procedure is Orange County, CA. This area has experienced unprecedented growth during the past decade, and projections for the year 1990, if realized, indicate a complete operational collapse of the traffic network because of congestion. As indicated, the High Flow Arterial concept involving selected placement of flyovers is currently being implemented by the Orange County Transportation Commission (OCTC) as a possible solution to this problem (OCTC, 1982). The procedures developed and reported herein represent a portion of that study effort.
To demonstrate the potential for application of the High Flow Arterial Concept using flyovers within Orange County, case studies were selected which are of sufficient diversity to encompass the full range of
185
alternate functions of the arterials on which the flyovers are placed, as well as the impacts resulting from implementation of the concept. For major arterials, three primary functions were identified:
1. Feeder to freeway, i.e., major arterials that intersect existing free-way(s).
2. Alternative to freeway, i.e., major arterials that parallel existing freeway(s).
3. Local traffic, i.e., major arterials that connect traffic generators.
Within these broad functional categories, impacts were classified into two general groups:
1. User impacts, i.e., primarily those impacting traffic flow characteristics.
2. Non-user impacts, i.e., primarily those impacting adjacent land use.
Unlike user impacts, non-user impacts associated with the implementation of the High Flow Arterial Concept are highly dependent on the nature of adjacent land use. As such, two categories of adjacent land use were identified to further divide the major functional categories:
1. Adjacent commercial development. 2. Adjacent residential development.
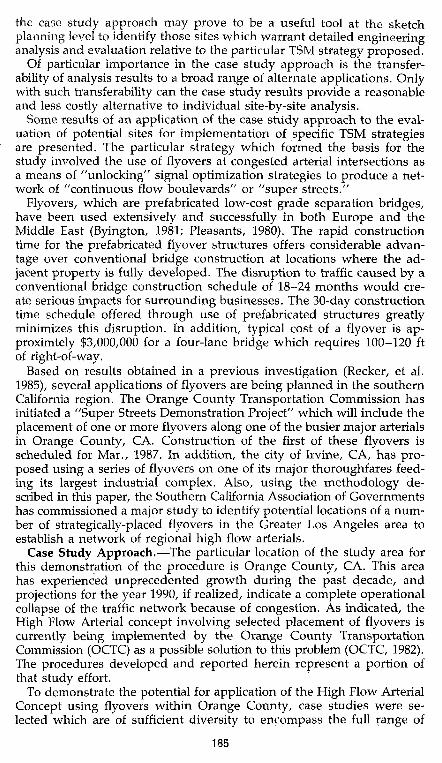
A final consideration in the selection of case study applications of the concept was the potential impact of high flow arterials on the integrity of the public transit network, particularly the ability to transfer at grade-separated intersections. Within these broad categories, arterial segments were selected in a manner that ensured that all cells of the classification array contained in Table 1 were represented.
Each arterial consists of a series of links and intersections; the latter element being the point of application of the "high flow" improvement. The provision of high flow capability, as well as its impacts at any location, are highly dependent on the flow conditions that exist at the intersection. Intersections with relatively high flows only in the arterial direction compared to cross flow pose one set of problems, while those with equally high or even greater cross flows compared to that along
TABLE 1 .—Arterial Case Study Selection Matrix
Arterial function (1)
Freeway feeder Freeway alternative Local
NON-USER IMPACT SCALE
Adjacent Residential Development
Transit sensitive
(2)
X X X
Non-transit sensitive
(3)
X X X
Adjacent Commercial Development
Transit sensitive
(4)
X X X
Non-transit sensitive
(5)
X X X
186
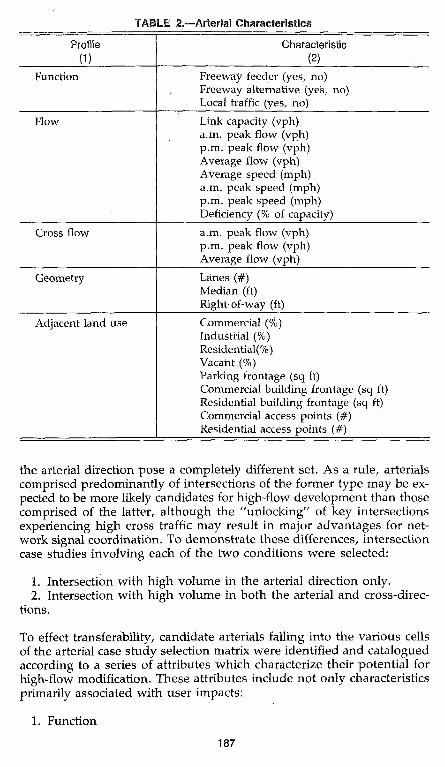
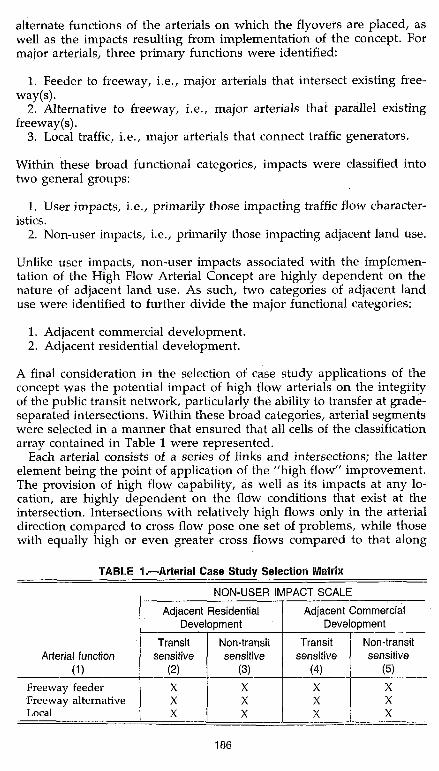
TABLE 2.—Arterial Characteristic^
Profile
(D Function
Flow
Cross flow
Geometry
Adjacent land use
Characteristic (2)
Freeway feeder (yes, no) Freeway alternative (yes, no) Local traffic (yes, no)
Link capacity (vph) a.m. peak flow (vph) p.m. peak flow (vph) Average flow (vph) Average speed (mph) a.m. peak speed (mph) p.m. peak speed (mph) Deficiency (% of capacity)
a.m. peak flow (vph) p.m. peak flow (vph) Average flow (vph)
Lanes (#) Median (ft) Right-of-way (ft)
Commercial (%) Industrial (%) Residential(%) Vacant (%) Parking frontage (sq ft) Commercial building frontage (sq ft) Residential building frontage (sq ft) Commercial access points (#) Residential access points (#)
the arterial direction pose a completely different set. As a rule, arterials comprised predominantly of intersections of the former type may be expected to be more likely candidates for high-flow development than those comprised of the latter, although the "unlocking" of key intersections experiencing high cross traffic may result in major advantages for network signal coordination. To demonstrate these differences, intersection case studies involving each of the two conditions were selected:
1. Intersection with high volume in the arterial direction only. 2. Intersection with high volume in both the arterial and cross-direc
tions.
To effect transferability, candidate arterials falling into the various cells of the arterial case study selection matrix were identified and catalogued according to a series of attributes which characterize their potential for high-flow modification. These attributes include not only characteristics primarily associated with user impacts:
1. Function
187
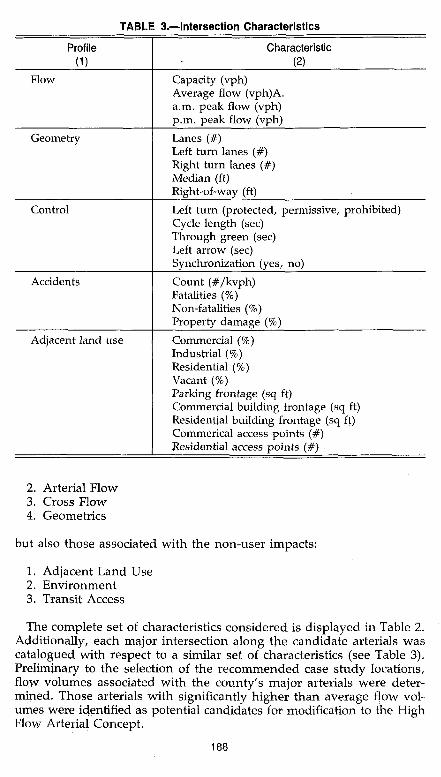
TABLE 3.—Intersection Characteristics
Profile (1)
Flow
Geometry
Control
Accidents
Adjacent land use
Characteristic (2)
Capacity (vph) Average flow (vph)A. a.m. peak flow (vph) p.m. peak flow (vph)
Lanes (#) Left turn lanes (#) Right turn lanes (#) Median (ft) Right-of-way (ft)
Left turn (protected, permissive, prohibited) Cycle length (sec) Through green (sec) Left arrow (sec) Synchronization (yes, no)
Count (#/kvph) Fatalities (%) Non-fatalities (%) Property damage (%)
Commercial (%) Industrial (%) Residential (%) Vacant (%) Parking frontage (sq ft) Commercial building frontage (sq ft) Residential building frontage (sq ft) Commerical access points (#) Residential access points (#)
2. Arterial Flow 3. Cross Flow 4. Geometries
but also those associated with the non-user impacts:
1. Adjacent Land Use 2. Environment 3. Transit Access
The complete set of characteristics considered is displayed in Table 2. Additionally, each major intersection along the candidate arterials was catalogued with respect to a similar set of characteristics (see Table 3). Preliminary to the selection of the recommended case study locations, flqw volumes associated with the county's major arterials were determined. Those arterials with significantly higher than average flow volumes were identified as potential candidates for modification to the High Flow Arterial Concept.
188
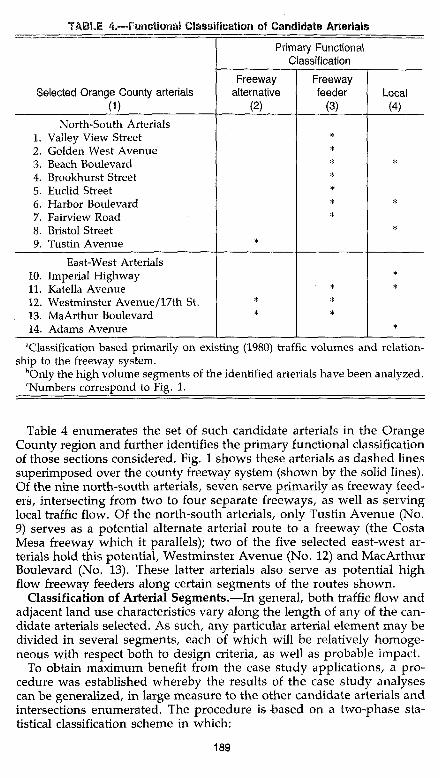
TABLE 4.™Funetiona! Classification of Candidate ArteMals
Selected Orange County arterials (1)
North-South Arterials 1. Valley View Street 2. Golden West Avenue 3. Beach Boulevard 4. Brookhurst Street 5. Euclid Street 6. Harbor Boulevard 7. Fairview Road 8. Bristol Street 9. Tustin Avenue
East-West Arterials 10. Imperial Highway 11. Katella Avenue 12. Westminster Avenue/17th St. 13. Ma Arthur Boulevard 14. Adams Avenue
Primary Functional Classification
Freeway alternative
(2)
*
* *
Freeway feeder
(3)
* * * * * * *
* * *
Local (4)
*
*
*
* *
*
"Classification based primarily on existing (1980) traffic volumes and relationship to the freeway system.
bOnly the high volume segments of the identified arterials have been analyzed. 'Numbers correspond to Fig. 1.
Table 4 enumerates the set of such candidate arterials in the Orange County region and further identifies the primary functional classification of those sections considered. Fig. 1 shows these arterials as dashed lines superimposed over the county freeway system (shown by the solid lines). Of the nine north-south arterials, seven serve primarily as freeway feeders, intersecting from two to four separate freeways, as well as serving local traffic flow. Of the north-south arterials, only Tustin Avenue (No. 9) serves as a potential alternate arterial route to a freeway (the Costa Mesa freeway which it parallels); two of the five selected east-west arterials hold this potential, Westminster Avenue (No. 12) and MacArthur Boulevard (No. 13). These latter arterials also serve as potential high flow freeway feeders along certain segments of the routes shown.
Classification of Arterial Segments.—In general, both traffic flow and adjacent land use characteristics vary along the length of any of the candidate arterials selected. As such, any particular arterial element may be divided in several segments, each of which will be relatively homogeneous with respect both to design criteria, as well as probable impact.
To obtain maximum benefit from the case study applications, a procedure was established whereby the results of the case study analyses can be generalized, in large measure to the other candidate arterials and intersections enumerated. The procedure is -based on a two-phase statistical classification scheme in which:
189
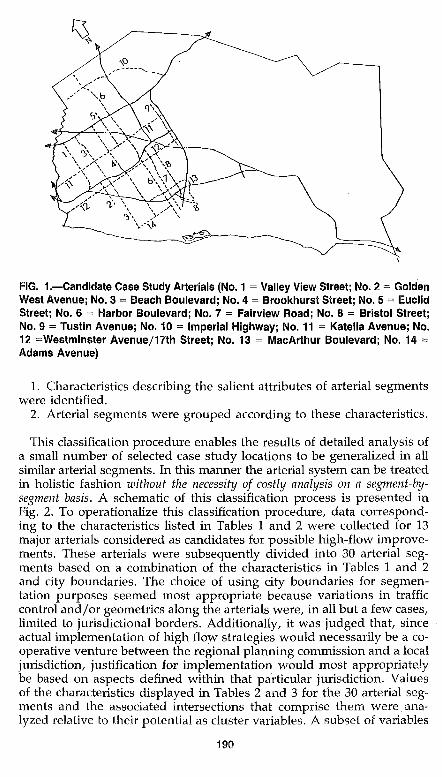
FIG. 1.—Candidate Case Study Arterials (No. 1 = Valley View Street; No. 2 = Golden West Avenue; No. 3 = Beach Boulevard; No. 4 = Brookhurst Street; No. 5 = Euclid Street; No. 6 = Harbor Boulevard; No. 7 = Fairview Road; No. 8 = Bristol Street; No. 9 = Tustin Avenue; No. 10 = Imperial Highway; No. 11 = Katella Avenue; No. 12 =Westminster Avenue/17th Street; No. 13 = MacArthur Boulevard; No. 14 = Adams Avenue)
1. Characteristics describing the salient attributes of arterial segments were identified.
2. Arterial segments were grouped according to these characteristics.
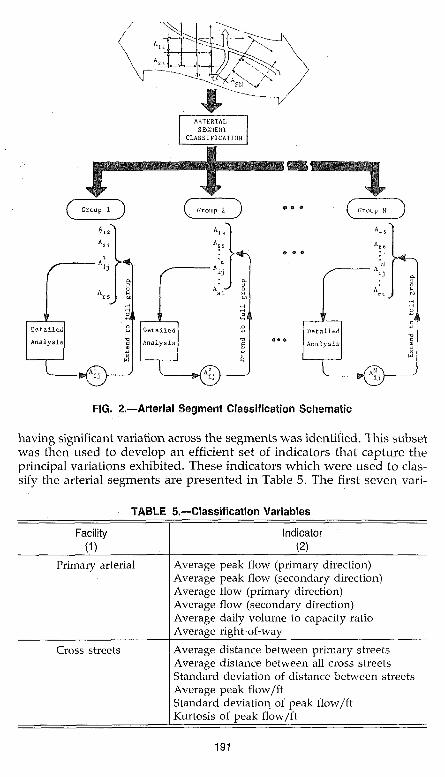
This classification procedure enables the results of detailed analysis of a small number of selected case study locations to be generalized in all similar arterial segments. In this manner the arterial system can be treated in holistic fashion without the necessity of costly analysis on a segment-by-segment basis. A schematic of this classification process is presented in Fig. 2. To operationalize this classification procedure, data corresponding to the characteristics listed in Tables 1 and 2 were collected for 13 major arterials considered as candidates for possible high-flow improvements. These arterials were subsequently divided into 30 arterial segments based on a combination of the characteristics in Tables 1 and 2 and city boundaries. The choice of using city boundaries for segmentation purposes seemed most appropriate because variations in traffic control and/or geometries along the arterials were, in all but a few cases, limited to jurisdictional borders. Additionally, it was judged that, since actual implementation of high flow strategies would necessarily be a cooperative venture between the regional planning commission and a local jurisdiction, justification for implementation would most appropriately be based on aspects defined within that particular jurisdiction. Values of the characteristics displayed in Tables 2 and 3 for the 30 arterial segments and the associated intersections that comprise them were analyzed relative to their potential as cluster variables. A subset of variables
190
( Group N )
><—, c
1f
Detailed Analysis
^
i j
"-J
J^V-
t
3 -
\
FIG. 2.—Arterial Segment Classification Schematic
having significant variation across the segments was identified. This subset was then used to develop an efficient set of indicators that capture the principal variations exhibited. These indicators which were used to classify the arterial segments are presented in Table 5. The first seven vari-
TABLE 5.—Classification Variables
Facility (1)
Primary arterial
Cross streets
Indicator (2)
Average peak flow (primary direction) Average peak flow (secondary direction) Average flow (primary direction) Average flow (secondary direction) Average daily volume to capacity ratio Average right-of-way
Average distance between primary streets Average distance between all cross streets Standard deviation of distance between streets Average peak flow/ft Standard deviation of peak flow/ft Kurtosis of peak flow/ft
191
ables were associated with the primary arterial and included average total flows, average peak flows, average peak volume to capacity ratio and average right of way length. The average total flow and average peak flow were calculated for both directions. To establish a consistent nomenclature, the direction containing the larger value was designated as the primary direction, while the direction containing the smaller value was designated the secondary direction. These variables allow the classification procedure to distinguish arterials on the basis of the magnitude of the difference between traffic volumes in each direction along the arterial.
The remaining six variables were associated with the cross streets located along the arterial segments. Included in these variables were the mean and standard deviation of the distance between cross streets, the mean, standard deviation and kurtosis of the peak cross flow/foot and the average peak volume to capacity ratio of the cross streets. The mean and standard deviation of the peak cross flow were calculated to yield an indication of how the cross-traffic was distributed along the arterial. The kurtosis was calculated to determine the relative peakedness or flatness of this distribution. A positive value of kurtosis indicates that the distribution is highly peaked, i.e., several cross streets have much larger volumes than others, while a negative value indicates that the distribution is flat, i.e., all of the cross streets have approximately the same traffic volumes.
The arterial classification algorithm cluster analyzes each arterial segment relative to the 13 descriptive features listed in Table 5. From a range of potential categories, the program selects that classification which is statistically most homogeneous. The clustering procedure is modeled after the ISODATA algorithm (Ball and Hall, 1967). For a given number of clusters k, the program seeks to partition the input data into k disjoint clusters with the property that each point within a cluster is closer to its cluster centroid than it is to any other cluster centroid. While this type of clustering usually does not achieve minimum sum of squares partition, the result is usually very close.
Formally, if X = {xi, . . . , xp} is the collection of p arterial segments defined by n classification attributes, and {y-i, . . . , yk) is an arbitrarily chosen collection of cluster centers, the program proceeds by iterating on the following two steps:
1. Sort the points of X by assigning point i to cluster ;' if k
\\%i - yj\\ = min {\\x{ - yh\\} (1)
where ||x,- - yh\\ is the Euclidean distance between xt and yh. 2. Once the points are sorted, compute new cluster centers by setting
yj equal to the centroid of the points assigned to that cluster. Suppose the points xtl, ..., xt comprise the set assigned to cluster ;', then
1 ' ft = -£*<» (2)
These two steps are repeated until there are no changes in cluster assignments.
192
The "best" number of categories N (i.e., the selection of the optimal value of "K"), as well as the "best" set of distinguishing characteristics Xi, are determined by a ratio based on the between-group variance and the pooled within-group variance.
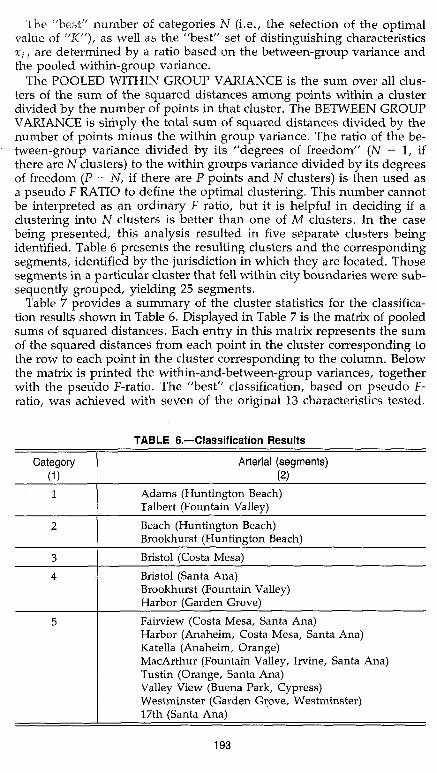
The POOLED WITHIN GROUP VARIANCE is the sum over all clusters of the sum of the squared distances among points within a cluster divided by the number of points in that cluster. The BETWEEN GROUP VARIANCE is simply the total sum of squared distances divided by the number of points minus the within group variance. The ratio of the between-group variance divided by its "degrees of freedom" (N - 1, if there are N clusters) to the within groups variance divided by its degrees of freedom (P - N, if there are P points and N clusters) is then used as a pseudo F RATIO to define the optimal clustering. This number cannot be interpreted as an ordinary F ratio, but it is helpful in deciding if a clustering into N clusters is better than one of M clusters. In the case being presented, this analysis resulted in five separate clusters being identified. Table 6 presents the resulting clusters and the corresponding segments, identified by the jurisdiction in which they are located. Those segments in a particular cluster that fell within city boundaries were subsequently grouped, yielding 25 segments.
Table 7 provides a summary of the cluster statistics for the classification results shown in Table 6. Displayed in Table 7 is the matrix of pooled sums of squared distances. Each entry in this matrix represents the sum of the squared distances from each point in the cluster corresponding to the row to each point in the cluster corresponding to the column. Below the matrix is printed the within-and-between-group variances, together with the pseudo F-ratio. The "best" classification, based on pseudo F-ratio, was achieved with seven of the original 13 characteristics tested.
TABLE 6.—Classification Results
Category (D 1
2
3
4
5
Arterial (segments) (2)
Adams (Huntington Beach) Talbert (Fountain Valley)
Beach (Huntington Beach) Brookhurst (Huntington Beach)
Bristol (Costa Mesa)
Bristol (Santa Ana) Brookhurst (Fountain Valley) Harbor (Garden Grove)
Fairview (Costa Mesa, Santa Ana) Harbor (Anaheim, Costa Mesa, Santa Ana) Katella (Anaheim, Orange) MacArthur (Fountain Valley, Irvine, Santa Ana) Tustin (Orange, Santa Ana) Valley View (Buena Park, Cypress) Westminster (Garden Grove, Westminster) 17th (Santa Ana)
193
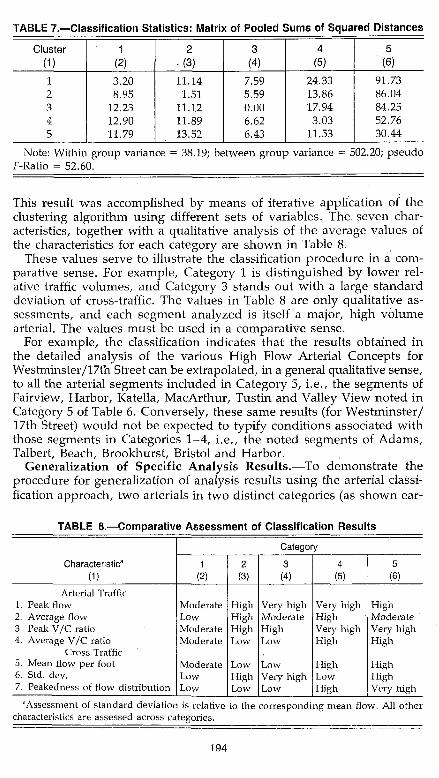
TABLE 7.—Classification Statistics: Matrix of Pooled Sums of Squared Distances
Cluster (1)
1 2 3 4 5
1 (2)
3.20 8.95
12.23 12.90 11.79
2 (3)
11.14 1.51
11.12 11.89 13.52
3 (4)
7.59 5.59 0.00 6.62 6.43
4 (5)
24.33 13.86 17.94 3.03
11.53
5 (6)
91.73 86.04 84.25 52.76 30.44
Note: Within group variance = 38.19; between group variance = 502.20; pseudo F-Ratio = 52.60.
This result was accomplished by means of iterative application of the clustering algorithm using different sets of variables. The seven characteristics, together with a qualitative analysis of the average values of the characteristics for each category are shown in Table 8.
These values serve to illustrate the classification procedure in a comparative sense. For example, Category 1 is distinguished by lower relative traffic volumes, and Category 3 stands out with a large standard deviation of cross-traffic. The values in Table 8 are only qualitative assessments, and each segment analyzed is itself a major, high volume arterial. The values must be used in a comparative sense.
For example, the classification indicates that the results obtained in the detailed analysis of the various High Flow Arterial Concepts for Westminster/17th Street can be extrapolated, in a general qualitative sense, to all the arterial segments included in Category 5, i.e., the segments of Fairview, Harbor, Katella, MacArthur, Tustin and Valley View noted in Category 5 of Table 6. Conversely, these same results (for Westminster/ 17th Street) would not be expected to typify conditions associated with those segments in Categories 1-4, i.e., the noted segments of Adams, Talbert, Beach, Brookhurst, Bristol and Harbor.
Generalization of Specific Analysis Results.—To demonstrate the procedure for generalization of analysis results using the arterial classification approach, two arterials in two distinct categories (as shown ear-
TABLE 8.—Comparative Assessment of Classification Results
Characteristic" (1)
Arterial Traffic 1. Peak flow 2. Average flow 3. Peak V/C ratio 4. Average V/C ratio
Cross Traffic 5. Mean flow per foot 6. Std. clev. 7. Peakedness of flow distribution
Category
1 (2)
Moderate Low Moderate Moderate
Moderate Low Low
2 (3)
High High High Low
Low High Low
3 (4)
Very high Moderate High Low
Low Very high Low
4 (5)
Very high High Very high High
High Low High
5 (6)
High Moderate Very high High
High High Verj' high
"Assessment of standard deviation is relative to the corresponding mean flow. All other characteristics are assessed across categories.
194
Iter in Table 6) were analyzed in detail relative to their sensitivity to high flow improvements (see Recker, et al., 1985). The section of Harbor Blvd. falling in Category 4 and the Westminster/17th sections falling in Category 5 were selected for this test principally because recent corridor studies had provided detailed data on traffic conditions along those ar-terials. A version of the TRANSYT (Robertson, 1969; Robertson and Gower, 1977; Jovanis, et al. 1977) traffic simulation model, modified to incorporate flyover-type intersections, was used to investigate the probable impact of installing flyovers at heavily congested intersections. Details of this analysis are provided in Recker, et al. (1985) and will not be repeated here. Specifically, separate traffic simulations were performed on the two segments (Westminster and Harbor) with flyovers placed at all intersections experiencing greater than 90% saturation levels. Traffic signalization along these arterial segments was then optimized relative to the flyover placements.
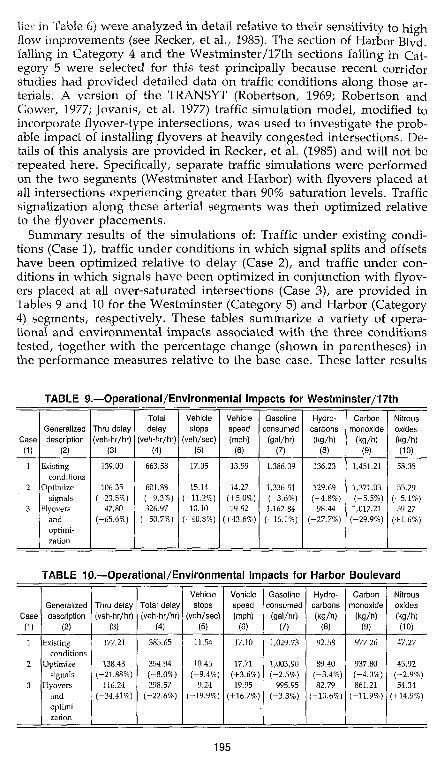
Summary results of the simulations of: Traffic under existing conditions (Case 1), traffic under conditions in which signal splits and offsets have been optimized relative to delay (Case 2), and traffic under conditions in which signals have been optimized in conjunction with flyovers placed at all over-saturated intersections (Case 3), are provided in Tables 9 and 10 for the Westminster (Category 5) and Harbor (Category 4) segments, respectively. These tables summarize a variety of operational and environmental impacts associated with the three conditions tested, together with the percentage change (shown in parentheses) in the performance measures relative to the base case. These latter results
TABLE 9.—Operational/Environmental Impacts for Westminster/17th
Case
(1)
1
2
3
Generalized description
(2)
Existing conditions
Optimize signals
Flyovers and optimization
Thru delay (veh-hr/hr)
(3)
139.00
106.35 (-23.5%)
47.80 (-65.6%)
Total delay
(veh-hr/hr)
(4)
663.58
601.88 (-9.3%) 326.97
(-50.7%)
Vehicle stops
(veh/sec)
(5)
17.05
15.14 (-11.2%)
10.10 (-40.8%)
Vehicle speed
(mph)
(6)
13.59
14.27 (+5.0%) 19.52
(+43.6%)
Gasoline consumed
(gal/hr)
(7)
1,386.39
1,336.51 (-3.6%) 1,162.84
(-16.1%)
Hydrocarbons (kg/h)
(8)
136.23
129.69 (-4.8%)
98.44 (-27.7%)
Carbon monoxide
(kg/h)
(9)
1,451.21
1,371.03 (-5.5%) 1,017.21
(-29.9%)
Nitrous oxides
(kg/h) (10)
58.35
55.29 (-5.1%)
59.27 (+1.6%)
TABLE 10.—Operational/Environmental Impacts for Harbor Boulevard
Case
(D 1
2
3
Generalized description
(2)
Existing conditions
Optimize signals
Flyovers and optimization
Thru delay (veh-hr/hr)
(3)
177.21
138.43 (-21.88%)
116.24 (-34.41%)
Total delay (veh-hr/hr)
(4)
385.65
354.94
(-8.0%) 298.57
(-22.6%)
Vehicle stops
(veh/sec)
(5)
11.54
10.45 (-9.4%)
9.24 (-19.9%)
Vehicle speed (mph)
(6)
17.10
17.71 (+3.6%) 19.95
(+16.7%)
Gasoline consumed
(gal/hr)
(7)
1,029.73
1,003.90 (-2.5%)
995.95 (-3.3%)
Hydrocarbons (kg/h)
(8)
92.58
89.40 (-3.4%) 82.79
(-10.6%)
Carbon monoxide
(kg/h)
(9)
977.26
937.80 (-4.0%) 861.21
(-11.9%)
Nitrous oxides (kg/h)
(10)
47.27
45.92 (-2.9%) 54.34
(+14.9%)
195
are useful in determining the relative impacts of signal optimization and flyovers on the overall performance measures.
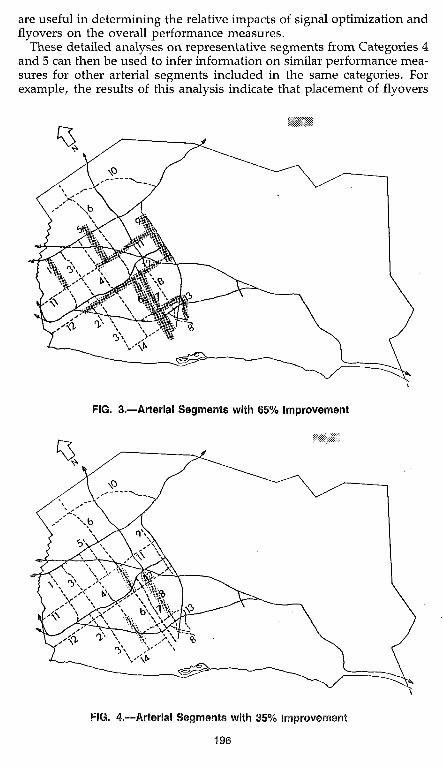
These detailed analyses on representative segments from Categories 4 and 5 can then be used to infer information on similar performance measures for other arterial segments included in the same categories. For example, the results of this analysis indicate that placement of flyovers
FIG. 3.—Arterial Segments with 65% Improvement
FIG. 4.™Arterial Segments with 35% Improvement
196
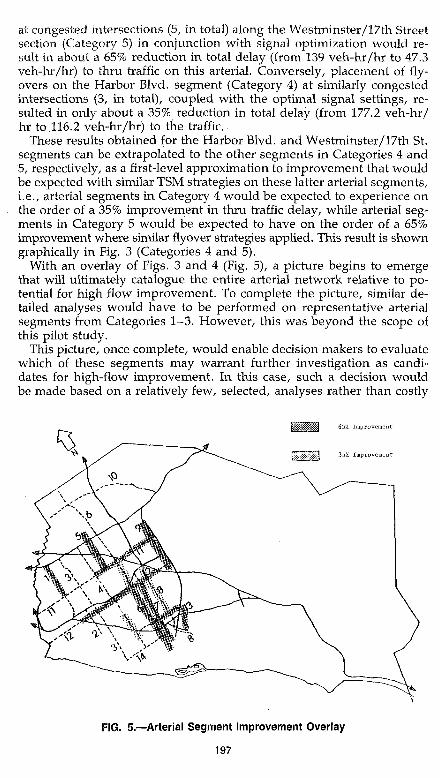
at congested intersections (5, in total) along the Westminster/17th Street section (Category 5) in conjunction with signal optimization would result in about a 65% reduction in total delay (from 139 veh-hr/hr to 47.3 veh-hr/hr) to thru traffic on this arterial. Conversely, placement of flyovers on the Harbor Blvd. segment (Category 4) at similarly congested intersections (3, in total), coupled with the optimal signal settings, resulted in only about a 35% reduction in total delay (from 177.2 veh-hr/ hr to.116.2 veh-hr/hr) to the traffic.
These results obtained for the Harbor Blvd. and Westminster/17th St. segments can be extrapolated to the other segments in Categories 4 and 5, respectively, as a first-level approximation to improvement that would be expected with similar TSM strategies on these latter arterial segments, i.e., arterial segments in Category 4 would be expected to experience on the order of a 35% improvement in thru traffic delay, while arterial segments in Category 5 would be expected to have on the order of a 65% improvement where similar flyover strategies applied. This result is shown graphically in Fig. 3 (Categories 4 and 5).
With an overlay of Figs. 3 and 4 (Fig. 5), a picture begins to emerge that will ultimately catalogue the entire arterial network relative to potential for high flow improvement. To complete the picture, similar detailed analyses would have to be performed on representative arterial segments from Categories 1-3. However, this was beyond the scope of this pilot study.
This picture, once complete, would enable decision makers to evaluate which of these segments may warrant further investigation as candidates for high-flow improvement. In this case, such a decision would be made based on a relatively few, selected, analyses rather than costly
FIG. 5.—Arterial Segment Improvement Overlay
197
detailed analysis of all arterial segments in the study area. Finally, a word of caution is in order. Confidence placed on the results
of the procedures advanced in this paper depends on the robustness of the cluster analysis. To some extent, this can be evaluated using data contained in the matrix of pooled sums of squared distances (Table 7) and the pseudo F-ratio. Additionally, the stability of the clusters should be tested through perturbations on initial cluster centers. In cases, in which the procedures yield well-defined clusters, information can be extracted which purportedly will significantly narrow the selection of promising alternatives for detailed analysis.
CONCLUDING REMARKS
Results of a pilot study involving the development of a case study approach incorporating classification analysis to the evaluation of network-level TSM strategies have been presented. The procedure facilitates an initial screening of candidate locations for traffic improvements without costly, repetitive analyses.
APPENDIX.—REFERENCES
1. Ball, G. H., and Hall, D. J. (1967). "A Clustering Technique for Summarizing Multivariate Data," Behavioral Science, 12, 153-155.
2. Byington, S. R. (1981). "The Fly-Over: A View from Both Sides," Transportation Engr.J., ASCE, Vol. 107, No. TE6, 667-680.
3. Jovanis, P., May, A. D., and Yip, W. (1977). "Further Analysis and Evaluation of Selected Impacts of Traffic Management Strategies on Surface Streets," Research Report UCB-ITS, RR. 77-79, Inst, of Transportation Studies, Univ. of California, Berkeley, CA.
4. Orange County Transportation Commission. (1982). High Flow Arterial Concept Feasibility Study, Final Report, prepared by JEF Engineering and Hollinden Recker and Associates.
5. Pleasants, W. W. (1980). "The Fly-Over: It Unclogs Urban Traffic in a Hurry," Civil Engineering, Vol. 52, No. 5, 71-75.
6. Recker, W. R., McNally, M. G., Root, G. S. (1985). "Fly-Overs and the High Flow Arterial Concept," Transportation Engrg. J., ASCE, Vol. I l l , No. 2, 139-154.
7. Robertson, D I. (1969). "TRANSYT: A Network Study Tool," Report LR 253, Road Research Lab., Crowthorne, Berkshire, England.
8. Robertson, D. I., and Gower, P. (1977). "USU's Guide to Transyt Version 6," Supplemental Report 255, Transport and Road Research Lab., Crowthorne, Berkshire, England.
198