Embed Size (px)
Citation preview

Value Ventures: April 2020 Long-term thinking in a world of short-term orientation.
Classical Charting Case Study & Preferred Stock
Discounts by Brandon Beylo on 17 April 2020
Table of Contents Classical Charting Case Study & Preferred Stock Discounts 1
Table of Contents 1
How To Spot Bottoms with Classical Charting: Case Study 3 Setting Up The Sample Data 4
Recording Chart Pattern Frequency 5 Top 20 Stocks of Decade (2009 - 2019) 5
Netflix (NFLX) 6 MarketAxess Holdings, Inc. (MKTX) 6 Abiomed, Inc. (ABMD) 7
1

April 11th, 2020
TransDigm Group, Inc. (TDG) 8 Align Technologies, Inc. (ALGN) 8 United Rentals, Inc. (URI) 9 Regeneron Pharmaceuticals (REGN) 10 Ulta Beauty (ULTA) 10 Amazon, Inc. (AMZN) 11 Extra Space Storage, Inc. (EXR) 12 Constellation Brands, Inc. (STZ) 12 Nvidia, Inc. (NVDA) 13 Take Two Interactive Software (TTWO) 14 Ross Stores, Inc. (ROST) 14 Mastercard, Inc. (MA) 15 O'Reilly Automotive, Inc. (ORLY) 16 Cintas Corp. (CTAS) 16 Apple, Inc. (AAPL) 17 Domino’s Pizza (DPZ) 18 Walt Disney Company (DIS) 18
Country-Specific ETF Chart Analysis 19 Australia (EWA) 19 Brazil (EWZ) 20 Canada (EWC) 21 China (GXC) 21 France (EWQ) 22 Germany (EWG) 23 India (EPI) 24 Italy (EWI) 24 Japan (EWJ) 25 Mexico (EWW) 25 Russia (RSX) 26 South Korea (EWY) 26 United Kingdom (EWU) 27
Cliff-Notes: Dumpster Diving For Preferred Stocks 28
Deep Dive: All About Preferred Stocks 29 How To Play The Preferred Game 29 What Are Preferred Stocks? 30 The Big Difference Difference Between Preferred Stocks 30 My Preferred Stock Research Process 31 My Preferred Stock Wishlist 31
Brookfield Property Partners LP 6.50% Class A Cumulative Redeemable Perpetual Preferred Units, Series 1 (BPYPP)31 Safe Bulkers 8% Cumulative Preferred (SB-D) 37 New York Mortgage Trust (NYMTP) Series B 7.75% Cumulative 38
Value Ventures Portfolio Review 39
2
April 11th, 2020
THIS MONTH’S
PHILOSOPHY CORNER
How To Spot Bottoms with Classical Charting: Case
Study Classical charting is one arrow in my investment philosophy quiver. In a prior newsletter, I highlighted why I use charts in my investment process. For those that don’t remember:
● Identify periods of consolidation ● Prevent falling knife investments ● Find optimal reward-to-risk entry points ● Identify clear levels of support and resistance ● Identify where to get out
Now, we’re in the midst of an aggressive bear/bull volatile market. Many investors don’t know what it’s like to survive a bear market -- let alone invest in one. In fact, the recent decline happened so fast, nobody alive has witnessed anything similar.
Some of you may be thinking … “This is the best time for value investors to scoop up bargains!”
Personally, my watchlist has never been this long. With that said, I’m treading with caution. What looks like a bargain today could very well become a better bargain tomorrow.
3

April 11th, 2020
So we’re faced with two problems:
1. There’s a lot of stocks that look very cheap at the moment, yet you’re worried they’ll decline further after you buy them.
2. Bear markets are known for face-ripping rallies to the upside. This further exacerbates the FOMO of not buying into the decline.
What do you do?
The best remedy for these two problems is classical charting.
We’re diving deep into droves of charts during the Great Financial Crisis. The goal? To understand how prices move and charts form during bear markets. Also, we’ll gain insight into the bottoming patterns of various bell-weather stocks. Do we notice any patterns? Are there any similarities?
We’ll answer these questions by the end of the section.
Before we continue, I’ll address the elephant in the room. Yes, the chart patterns are drawn after the fact and after the pattern completed its formation. But, I can assure you that the patterns drawn (and their subsequent basing periods) are simple. I am not extracting complex lines and patterns out of random data.
Setting Up The Sample Data We’re going to look at two separate data sets. First, the top 20 performing stocks since 2009. We found this via MarketWatch. Here’s the list:
There’s a couple stocks that didn’t trade during the GFC. We swapped those out with other well-known companies. We’ll go through each stock, highlight its 2008-2009 chart pattern, and identify any similarities between them.
Then, we’ll look at major country ETFs. Did countries form bullish set-ups and/or basing patterns before their major launches?
Here’s the list of country-specific ETFs:
● Australia (EWA) ● Brazil (EWZ) ● Canada (EWC) ● China (GXC) ● France (EWQ) ● Germany (EWG) ● Greece (GREK)
4
April 11th, 2020
● India (EPI) ● Italy (EWI) ● Japan (EWJ) ● Mexico (EWW) ● Poland (PLND) ● Russia (RSX) ● South Korea (EWY) ● United Kingdom (EWU)
Recording Chart Pattern Frequency
To record chart pattern frequency, I’m using this spreadsheet (you can access it here). The spreadsheet documents the name of the company, the type of chart pattern, and the length (in days) it took to form.
From this information, we’ll form a baseline for assessing today’s bear market environment.
Remember, chart patterns don’t tell us where prices will go in the future. All they do is offer possibilities on future movements.
Top 20 Stocks of Decade (2009 - 2019) No doubt this is a relatively small sample size of potential chart patterns during the Great Financial Recession. Yet they paint a picture on the types of patterns one could see during market bottoms. You’ll see common themes throughout these breakouts. These themes can be applied to today’s market.
But remember, chart patterns are not predictive of future price direction. It’s the same as past company data not predicting future operating success. Let’s dive in!
Netflix (NFLX)
Chart pattern: Double Bottom & Complex Head-and-Shoulders Reversal
Number of Days to Complete: Double Bottom (70), H&S Reversal (280)
5

April 11th, 2020
Analysis: There are a few things to note about this chart. First, the H&S pattern takes almost a full year to complete. But when it does, it breaks the neckline on a solid weekly candle. The stock also breaks out above its 200MA and 50MA (further bullish momentum. After a brief pullback, the stock takes off. Never testing the new support level. In fact, it doesn’t breach the 50MA until 2011.
MarketAxess Holdings, Inc. (MKTX)
Chart pattern: Head-and-Shoulders Reversal
Number of Days to Complete: 483 (1.32 years)
Analysis: This is our second H&S reversal pattern in two charts. Sign of more to come? Anyways, a couple of things to note here. First, MKTX’s H&S reversal took almost 1.5 years to develop. That’s a long time for investors trying to “catch the bottom”.
6
April 11th, 2020
Second, the breakout from the H&S happens above the 50MA but below the 200MA. You can see the 200MA acting as resistance during the first few weeks post-breakout. Once price breaks past the 200MA it’s smooth sailing.
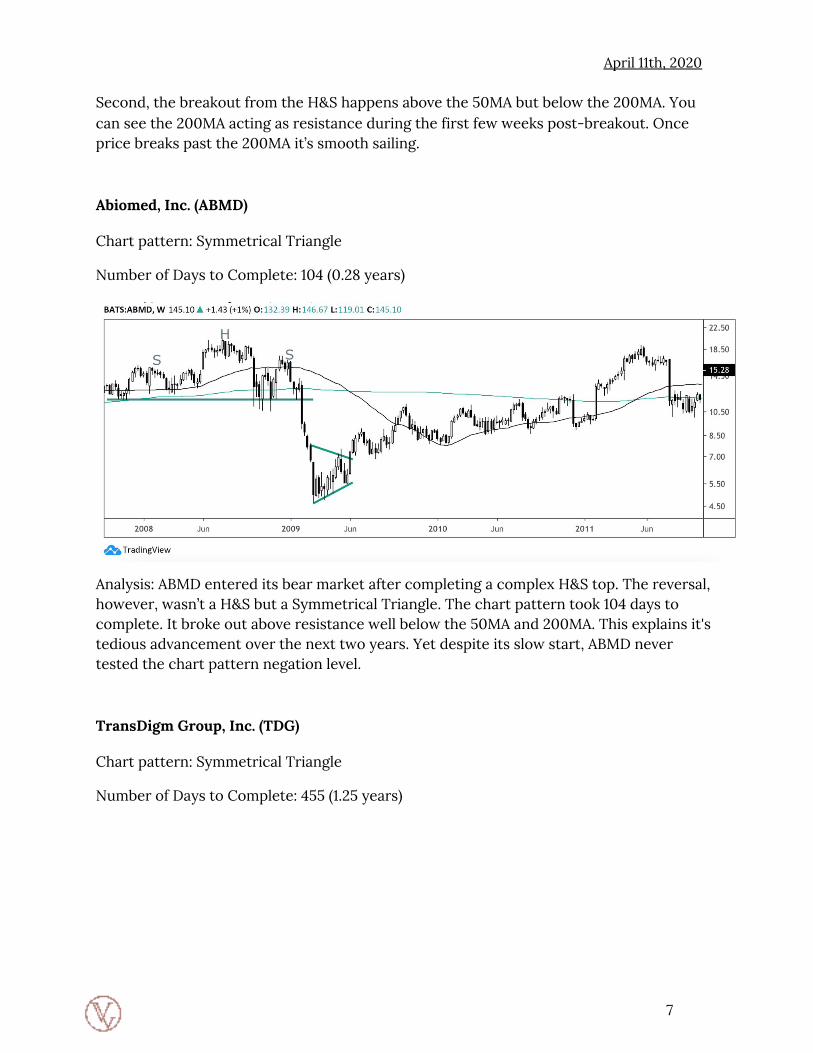
Abiomed, Inc. (ABMD)
Chart pattern: Symmetrical Triangle
Number of Days to Complete: 104 (0.28 years)
Analysis: ABMD entered its bear market after completing a complex H&S top. The reversal, however, wasn’t a H&S but a Symmetrical Triangle. The chart pattern took 104 days to complete. It broke out above resistance well below the 50MA and 200MA. This explains it's tedious advancement over the next two years. Yet despite its slow start, ABMD never tested the chart pattern negation level.
TransDigm Group, Inc. (TDG)
Chart pattern: Symmetrical Triangle
Number of Days to Complete: 455 (1.25 years)
7

April 11th, 2020
Analysis: TDG formed a 455 day long Symmetrical Triangle. The breakout took place above the 50MA. Notice that prices tested the previous resistance level. This shouldn’t surprise us as breakouts from diagonal boundary lines are weaker in nature. They don’t provide as strong a signal.
Align Technologies, Inc. (ALGN)
Chart pattern: Head-and-Shoulders Reversal w/ Double Bottom
Number of Days to Complete: 608 (1.66 years)
Analysis: ALGN took almost two years to complete its H&S reversal pattern. But as you can see, the pattern is well-defined. It’s clean. Also, notice the breakout takes place above the 200MA and the 50MA. The old resistance line was tested in July 2010, but 200MA acted as support.
8

April 11th, 2020
United Rentals, Inc. (URI)
Chart pattern: Complex Head-and-Shoulders Reversal
Number of Days to Complete: 287 ( 0.79 years)
Analysis: You’re beginning to see a pattern with these reversals. Many took the form of H&S reversals. This isn’t a surprise as H&S patterns normally take longer to develop, and often offer the strongest buy (or sell) opportunities. Notice the downward sloping neckline of the H&S pattern. This isn’t optimal. We prefer breakouts from horizontal chart patterns. But, URI’s breakout never re-tested the chart pattern boundary. After breaking out above the 50MA, the stock never looked back.
Regeneron Pharmaceuticals (REGN)
Chart pattern: Rectangle
Number of Days to Complete: 1,339 (3.68 years)
9

April 11th, 2020
Analysis: REGN completed a 3 ½ year rectangle pattern as it came out of the GFC. Remember, we started the GFC around 2007, so it's no surprise consolidation began that early. There are two things to keep in mind with this chart pattern. First, prices broke out above the 200MA and 50MA. Second, prices never tested the new support line.
Ulta Beauty (ULTA)
Chart pattern: Head-and-Shoulders Reversal
Number of Days to Complete: 322 (0.88 years)
Analysis: ULTA completed a 322-day H&S reversal pattern, marking the bottom in its stock price. Notice the upward sloping neckline. This is the first time we’ve seen an upward sloping neckline in our analysis. Unlike its downward sloping relative, upward sloping
10

April 11th, 2020
necklines are bullish signals. They signal an upward trend forming. The stock broke out above its 50MA and never retested the chart pattern boundary.
Amazon, Inc. (AMZN)
Chart pattern: Head-and-Shoulders Reversal
Number of Days to Complete: 117 (0.32 years)
Analysis: AMZN completed one of the shortest reversals in our dataset. The stock took 117 days to complete its H&S reversal pattern. So short, in fact, we had to switch to the daily charts to truly capture the chart pattern in action. There’s a couple of things to note about the pattern. First, it broke out above 50MA with 200MA acting as resistance. But, the chart pattern boundary line was never tested. Also, the stock gapped up into its breakout. Further cementing the bullish move.
Extra Space Storage, Inc. (EXR)
Chart pattern: Head-and-Shoulders Reversal
Number of Days to Complete: 294 (0.80 years)
11

April 11th, 2020
Analysis: Continuing with the trend, we see a downward sloping H&S reversal pattern. The right shoulder is usually lower than the left. It also tends to have lower volume (not shown). But again, notice the similarities in the breakouts. A breakout above the 50MA. A slight retest of the chart pattern boundary, and then no looking back. There’s a theme:
● Sell-off ● Re-test of the prior highs ● Failed breakout causes more selling ● Re-test with a breakout on the right shoulder
Constellation Brands, Inc. (STZ)
Chart pattern: Symmetrical Triangle
Number of Days to Complete: 301 (0.82 years)
12
April 11th, 2020
Analysis: STZ formed a beautiful 10-month long Symmetrical Triangle to confirm the bottom in its stock price. Again we see a confirmed breakout at (or above) the 50MA and no retest of the chart pattern boundary. From there, the 50MA acts as support for the stock price.
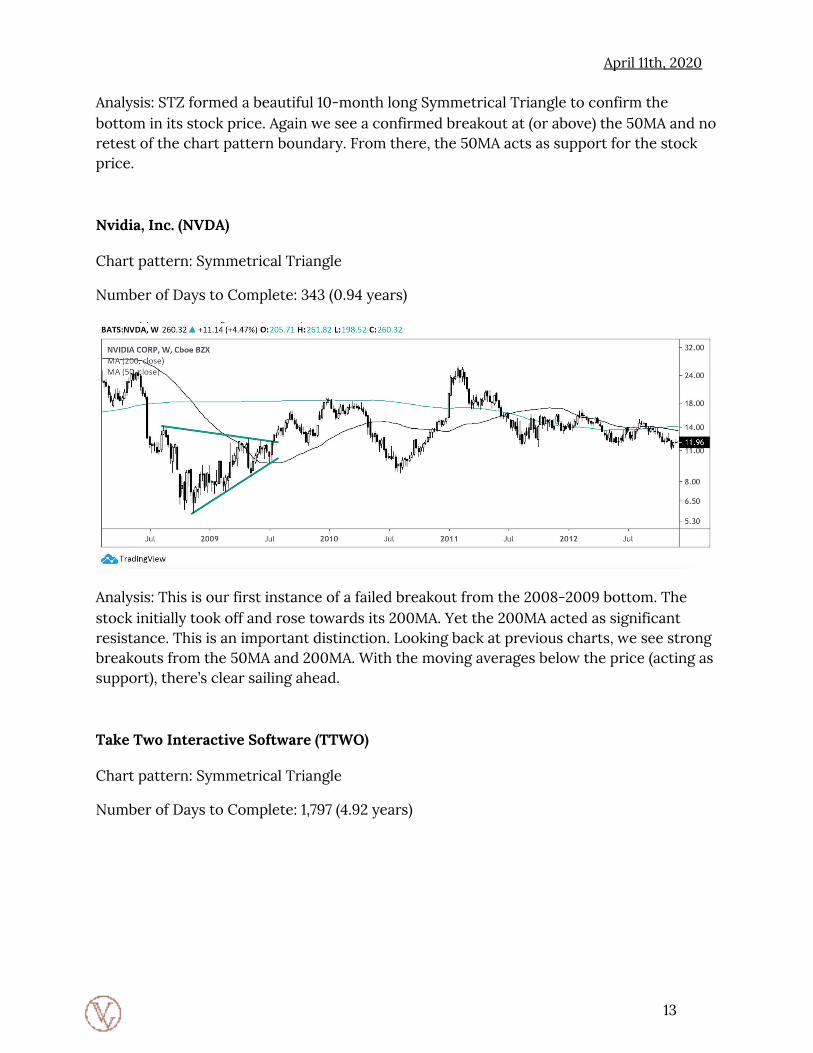
Nvidia, Inc. (NVDA)
Chart pattern: Symmetrical Triangle
Number of Days to Complete: 343 (0.94 years)
Analysis: This is our first instance of a failed breakout from the 2008-2009 bottom. The stock initially took off and rose towards its 200MA. Yet the 200MA acted as significant resistance. This is an important distinction. Looking back at previous charts, we see strong breakouts from the 50MA and 200MA. With the moving averages below the price (acting as support), there’s clear sailing ahead.
Take Two Interactive Software (TTWO)
Chart pattern: Symmetrical Triangle
Number of Days to Complete: 1,797 (4.92 years)
13

April 11th, 2020
Analysis: TTWO takes the lead as the longest chart pattern set-up in our dataset. The stock took almost five years to complete its symmetrical triangle bottoming set-up. Long-term chart pattern setups like this one are prone to explosive breakouts (when they happen). Notice the breakout above the 50MA and 200MA. Also, after the breakout there was no retest of the chart pattern boundary.
Ross Stores, Inc. (ROST)
Chart pattern: Head-and-Shoulders Reversal
Number of Days to Complete: 161 (0.44 years)
Analysis: We’re back with more H&S reversal patterns. ROST completed a close-knit H&S lasting 161 days. The stock broke through its horizontal boundary (and the 50MA). Prices didn’t test the chart pattern boundary again. This was a textbook breakout from a
14

April 11th, 2020
horizontal chart pattern. We’re starting to see some similarities and patterns with the best of breed breakouts.
Mastercard, Inc. (MA)
Chart pattern: Cup with Handle
Number of Days to Complete: 301 (0.82 years)
Analysis: This is our first cup-with-handle (CWH) pattern in the dataset. CWH patterns have clear, horizontal resistance boundaries. Notice that the stock broke out above its 50MA and didn’t retest that line for over a year. And if you draw the horizontal line out to mid-2010, you see that price never fell below that line again. CWH patterns take longer to develop, as they resemble more of a H&S pattern.
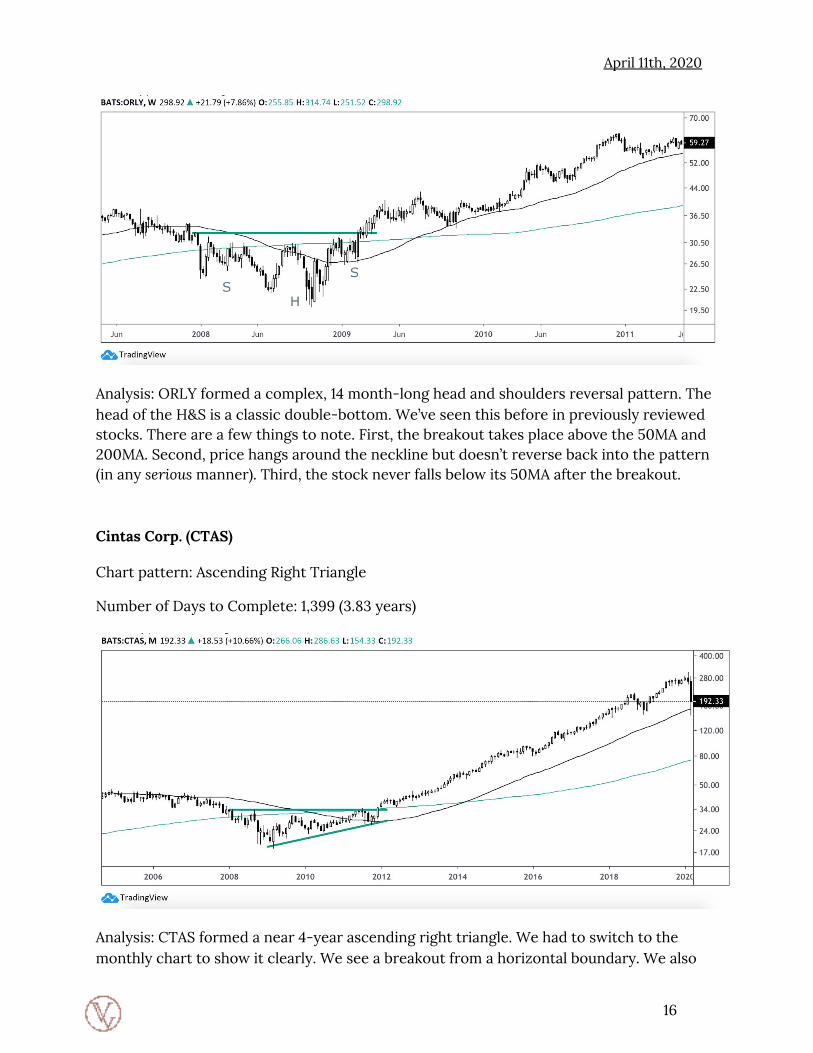
O'Reilly Automotive, Inc. (ORLY)
Chart pattern: Head-and-Shoulders Reversal w/ Double Bottom
Number of Days to Complete: 441 (1.21 years)
15
April 11th, 2020
Analysis: ORLY formed a complex, 14 month-long head and shoulders reversal pattern. The head of the H&S is a classic double-bottom. We’ve seen this before in previously reviewed stocks. There are a few things to note. First, the breakout takes place above the 50MA and 200MA. Second, price hangs around the neckline but doesn’t reverse back into the pattern (in any serious manner). Third, the stock never falls below its 50MA after the breakout.
Cintas Corp. (CTAS)
Chart pattern: Ascending Right Triangle
Number of Days to Complete: 1,399 (3.83 years)
Analysis: CTAS formed a near 4-year ascending right triangle. We had to switch to the monthly chart to show it clearly. We see a breakout from a horizontal boundary. We also
16
April 11th, 2020
see periods of lower highs and a price ceiling. Once the ceiling broke, it was smooth sailing. Notice how the chart pattern completed its breakout above the 200MA and 50MA. The stock didn’t touch its MA on the monthly chart until this month (crazy!).
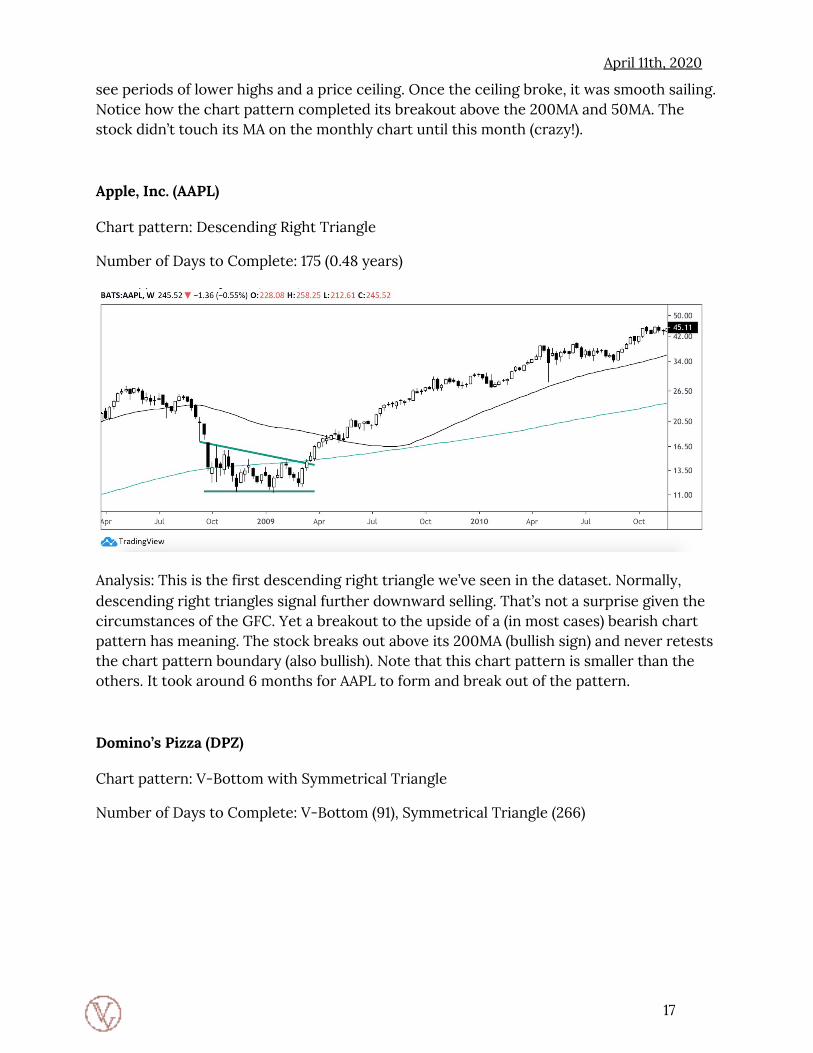
Apple, Inc. (AAPL)
Chart pattern: Descending Right Triangle
Number of Days to Complete: 175 (0.48 years)
Analysis: This is the first descending right triangle we’ve seen in the dataset. Normally, descending right triangles signal further downward selling. That’s not a surprise given the circumstances of the GFC. Yet a breakout to the upside of a (in most cases) bearish chart pattern has meaning. The stock breaks out above its 200MA (bullish sign) and never retests the chart pattern boundary (also bullish). Note that this chart pattern is smaller than the others. It took around 6 months for AAPL to form and break out of the pattern.
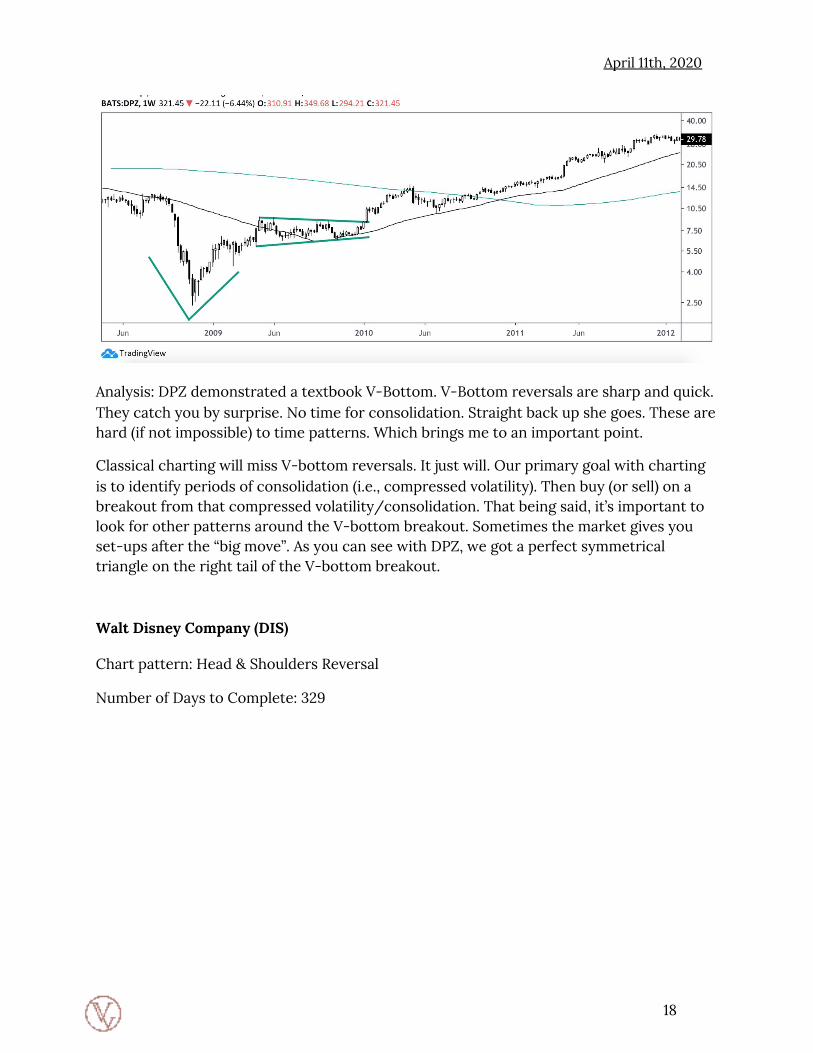
Domino’s Pizza (DPZ)
Chart pattern: V-Bottom with Symmetrical Triangle
Number of Days to Complete: V-Bottom (91), Symmetrical Triangle (266)
17
April 11th, 2020
Analysis: DPZ demonstrated a textbook V-Bottom. V-Bottom reversals are sharp and quick. They catch you by surprise. No time for consolidation. Straight back up she goes. These are hard (if not impossible) to time patterns. Which brings me to an important point.
Classical charting will miss V-bottom reversals. It just will. Our primary goal with charting is to identify periods of consolidation (i.e., compressed volatility). Then buy (or sell) on a breakout from that compressed volatility/consolidation. That being said, it’s important to look for other patterns around the V-bottom breakout. Sometimes the market gives you set-ups after the “big move”. As you can see with DPZ, we got a perfect symmetrical triangle on the right tail of the V-bottom breakout.
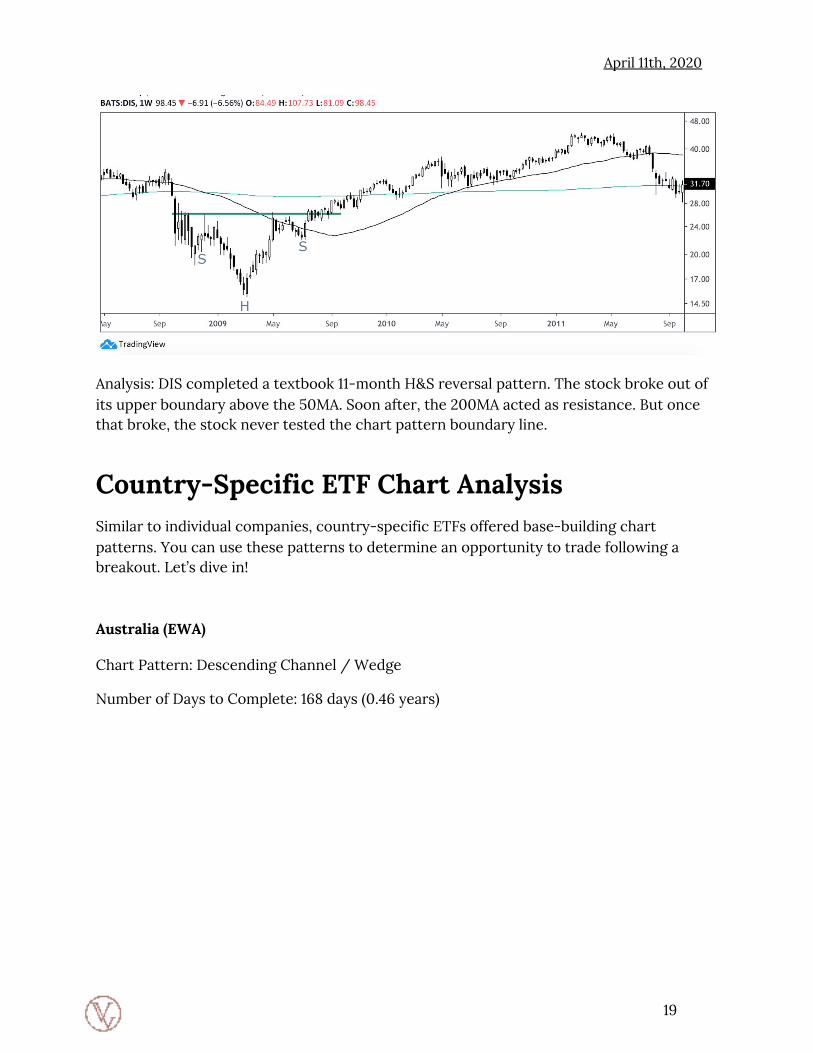
Walt Disney Company (DIS)
Chart pattern: Head & Shoulders Reversal
Number of Days to Complete: 329
18
April 11th, 2020
Analysis: DIS completed a textbook 11-month H&S reversal pattern. The stock broke out of its upper boundary above the 50MA. Soon after, the 200MA acted as resistance. But once that broke, the stock never tested the chart pattern boundary line.
Country-Specific ETF Chart Analysis Similar to individual companies, country-specific ETFs offered base-building chart patterns. You can use these patterns to determine an opportunity to trade following a breakout. Let’s dive in!
Australia (EWA)
Chart Pattern: Descending Channel / Wedge
Number of Days to Complete: 168 days (0.46 years)
19

April 11th, 2020
Analysis: EWA formed a 5 ½ month-long falling wedge pattern. These patterns act as bullish reversals should the stock break to the upside. Notice that the ETF doesn’t test the chart pattern boundary after breaking out of downward consolidation.
Brazil (EWZ)
Chart Pattern: Symmetrical Triangle
Number of Days to Complete: 175 (0.48 years)
Analysis: EWZ completed a 6-month long textbook symmetrical triangle to mark the bottom in its recession. This is a well-defined chart pattern. The pattern breaks out below the 200MA and 50MA, which isn’t the strongest signal. Yet price pierces both moving averages with strength. The ETF never retests the chart pattern boundary.
20

April 11th, 2020
Canada (EWC)
Chart Pattern: Descending Channel
Number of Days to Complete: 175 (0.48 years)
Analysis: EWC completed a 6-month long descending channel/wedge formation. This pattern is almost identical to the above Australia chart. Notice the similarities. Lower highs and lower lows. Then all of a sudden a breakout above the channel. The price never retests the chart pattern boundary.
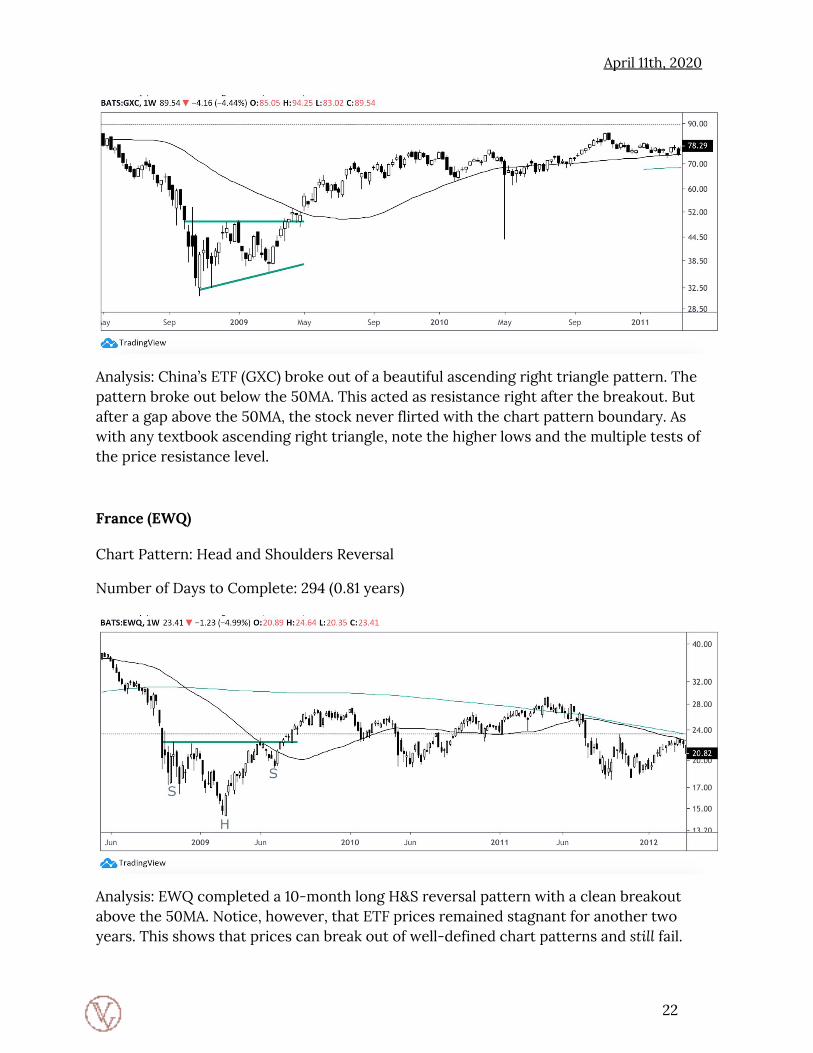
China (GXC)
Chart Pattern: Ascending Right Triangle
Number of Days to Complete: 196 (0.54 years)
21
April 11th, 2020
Analysis: China’s ETF (GXC) broke out of a beautiful ascending right triangle pattern. The pattern broke out below the 50MA. This acted as resistance right after the breakout. But after a gap above the 50MA, the stock never flirted with the chart pattern boundary. As with any textbook ascending right triangle, note the higher lows and the multiple tests of the price resistance level.
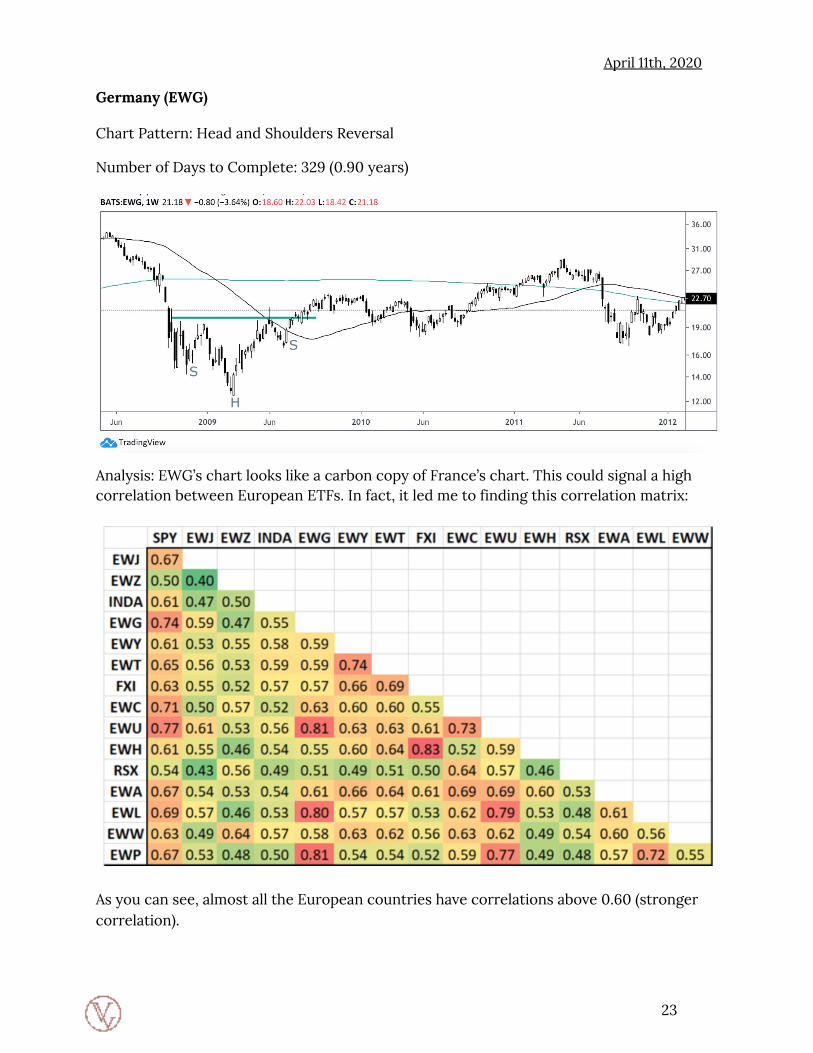
France (EWQ)
Chart Pattern: Head and Shoulders Reversal
Number of Days to Complete: 294 (0.81 years)
Analysis: EWQ completed a 10-month long H&S reversal pattern with a clean breakout above the 50MA. Notice, however, that ETF prices remained stagnant for another two years. This shows that prices can break out of well-defined chart patterns and still fail.
22
April 11th, 2020
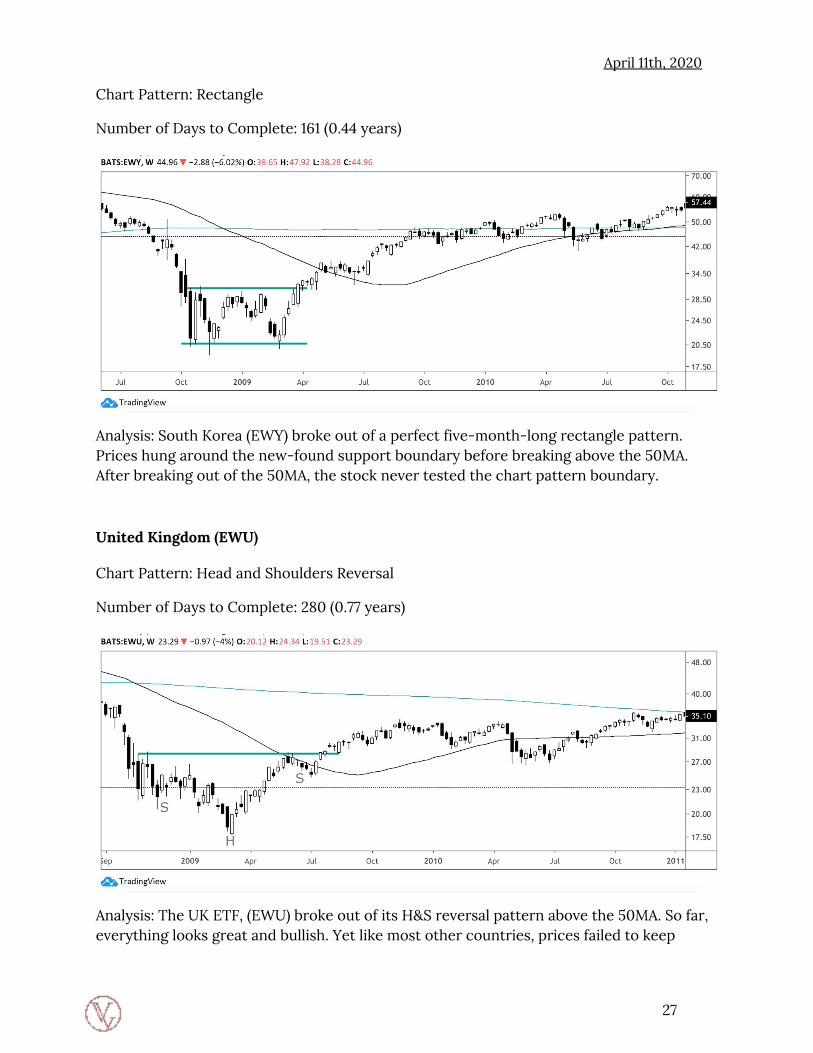
Germany (EWG)
Chart Pattern: Head and Shoulders Reversal
Number of Days to Complete: 329 (0.90 years)
Analysis: EWG’s chart looks like a carbon copy of France’s chart. This could signal a high correlation between European ETFs. In fact, it led me to finding this correlation matrix:
As you can see, almost all the European countries have correlations above 0.60 (stronger correlation).
23

April 11th, 2020
India (EPI)
Chart Pattern: Descending Right Triangle
Number of Days to Complete: 175 (0.48 years)
Analysis: EPI completed a five-month-long descending right triangle. Note that the stock never retested the chart pattern boundary. Prices gapped up above the 50MA and never looked back. This looks similar to China’s chart pattern.
Italy (EWI)
Chart Pattern: Head and Shoulders Reversal
Number of Days to Complete: 301 (0.82 years)
24

April 11th, 2020
Analysis: EWI completed a ten-month long Head and Shoulders reversal pattern coming out of the GFC. Like many (Ex-US) countries, prices of their ETFs stagnated -- failing to take off. It took less than a year for the price to break through the chart pattern boundary.
Japan (EWJ)
Chart Pattern: Head and Shoulders Reversal
Number of Days to Complete: 294 (0.81 years)
Analysis: EWJ completed a ten-month long H&S reversal pattern but failed to take off past its chart pattern boundary. Japan followed the likes of many developed economies we’ve seen in this dataset.
Mexico (EWW)
Chart Pattern: Rectangle
Number of Days to Complete: 280 (0.77 years)
25

April 11th, 2020
Analysis: EWW formed a beautiful nine-month rectangle pattern. The stock broke out above the 50MA and never tested the chart pattern boundary.
Russia (RSX)
Chart Pattern: Descending Right Triangle
Number of Days to Complete: 161 (0.44 years)
Analysis: Russia’s ETF, RSX had one of the cleanest breakouts from a descending triangle in our dataset. After breaking out of its five-month chart pattern, the stock never retested the pattern boundary. It was met with resistance at the 50MA. But after a brief pullback, the stock reaches new highs and traded above the 50MA.
South Korea (EWY)
26
April 11th, 2020
Chart Pattern: Rectangle
Number of Days to Complete: 161 (0.44 years)
Analysis: South Korea (EWY) broke out of a perfect five-month-long rectangle pattern. Prices hung around the new-found support boundary before breaking above the 50MA. After breaking out of the 50MA, the stock never tested the chart pattern boundary.
United Kingdom (EWU)
Chart Pattern: Head and Shoulders Reversal
Number of Days to Complete: 280 (0.77 years)
Analysis: The UK ETF, (EWU) broke out of its H&S reversal pattern above the 50MA. So far, everything looks great and bullish. Yet like most other countries, prices failed to keep
27

April 11th, 2020
momentum. It took around a full year for prices to break below the H&S chart pattern boundary.
THIS MONTH’S
DEEP DIVE
Cliff-Notes: Dumpster Diving For Preferred Stocks
- What We’re Looking For: - Large discount to book value with above-average (>6%) yield - Underlying company has strong balance with loads of cash - Manageable debt (EBIT/Interest Expense > 4-5)
- The Opportunity: - Many preferred stocks trade at fractions of book value with high yields - By creating a basket of predetermined preferred stocks, we can create a
preferred stock ETF on steroids
- The Risk: - Blow-up risk is real with some preferreds - Management might not respect the covenants or rights of preferred holders - Many preferreds have already risen 30-50% from their lows - Balance sheets are highly levered, bringing into question solvency issues
28
April 11th, 2020
Deep Dive: All About Preferred Stocks
It seems like every asset class has had their trip behind the woodshed. The last month has destroyed a lot of paper value from the stock market. In fact, it’s wiped out all of Trump’s gains since taking office.
One such asset class that’s feeling the sting of the decline is preferred stock.
Many preferred stocks (or “preferreds”) trade at >50% discounts to tangible book value while offering above-average yields (>6%).
There are two reasons I wanted to discuss preferreds in this month’s issue:
1. I didn’t have much experience working with preferreds prior to writing this newsletter.
2. I don’t know how long this discount will last and I want you, my subscribers, to take advantage of the severe value dislocation.
I went through this list and picked out a handful of my favorite ideas.
How To Play The Preferred Game For those with dry powder on the sidelines, a basket approach to preferreds is, well, preferred. There’s a few ways I’m thinking of playing this:
● Four positions, each risking 50bps of capital with stops ● Four positions, 1% of total capital in each, no stop loss ● Four positions, each risking 25bps of capital with wide stops
29

April 11th, 2020
I’ll leave it to you to decide which method works best but will offer four potential candidates for investment.
Think of these preferreds as a set-it-and-forget-it investment. You’re not monitoring them closely. You’re allocating a set (small) amount of your portfolio to these names, knowing full-well the high positive asymmetric skew.
What Are Preferred Stocks? Preferred stock is a cross between a bond and a stock. They trade similar to common stock in that you can buy individual shares. But there’s a few differences:
Preferred stockholders have priority on their dividends over common stockholders. For example, if company XYZ pays a 2% dividend on its common stock and a 5% dividend on its preferred stock, the 5% preferred would take precedent on the payment hierarchy.
When a company files for bankruptcy, preferred stockholders receive payments ahead of common shareholders, but after creditors, senior secured debt and bondholders.
Most preferred stockholders have no voting rights, whereas common shareholders do.
It’s more difficult to realize capital gains from a rise in a preferred stock than common stock.
The Big Difference Difference Between Preferred Stocks Not all preferred stocks are created equal.
Companies issue preferred stocks in “Series”. These series come with varying covenants and dividend policies. Most notably: cumulative vs. non-cumulative.
Cumulative preferreds: Dividends not paid to owners of cumulative preferred stock are kept in a separate account. These should get paid out to the owner of those preferreds over time (read: in arrears).
Here’s why cumulative preferreds are great. These dividends that gather in the separate account must be paid before common shareholders receive their dividends.
Common Differences Between Preferred Stock Issuances
1. Voting vs. Non-voting 2. Adjustable-Rate Dividends 3. Convertible
30

April 11th, 2020
4. Participating
My Preferred Stock Research Process My preferred stock research process mirrors that of my common stock process. The exception being I pay less attention to the income statement and cash flow statement, and more attention on the balance sheet. Basic questions like:
● Will the company make enough money to service its debt? ● How leveraged are they? ● What is their EBIT/Interest Expense? ● How reliable is their earnings stream?
I’m not looking for growth, but stability. With preferred stocks, I don’t care if the company grows its earnings 10% a year for the next five years. I want to know if they can pay the yield on my preferred stock over that time frame.
From there, I look at the preferred stock issuance documents. You can find the docs for any preferred stock here.
Then, I’ll use the above references at my guideposts. I’ll look for cumulative vs. non-cumulative. I’ll check for management incentives to pay (i.e., honor) their preferred holders. Are there voting rights for this series of preferred?
I’ll also see if there’s other preferred series that offer what I want. Differences within a series include cumulative or non-cumulative, dividend yield and redeemability.
My Preferred Stock Wishlist Brookfield Property Partners LP 6.50% Class A Cumulative Redeemable Perpetual Preferred Units, Series 1 (BPYPP)
31

April 11th, 2020
Business Description: Brookfield Property Partners owns, operates, and invests in commercial and other income-producing property on a global basis. Co. has three segments: Core Office, which consists of interests in office properties located in New York, Los Angeles, Washington, D.C., United States, London, United Kingdom, Sydney, Australia, Toronto, Canada and Berlin, Germany, as well as active office and multifamily developments; Core Retail, which consists of retail properties located throughout the United States; and LP Investments, which has interests in real estate sectors worldwide including office, retail, multifamily, logistics, hospitality, triple net lease, self-storage, and student housing.
Discount to Face Value: 30%
Preferred Specifications: Cumulative 6.50% annual dividend. BPY does not have to redeem the preferreds in the event of a change of control or liquidation scenario. Also, the preferreds have no voting rights.
Balance Sheet & Earnings Analysis: BPY is levered to the gills. The company’s net debt/EBITDA stands at 9.5x. Looking further, total debt/equity is 132%. That being said, preferred shareholders aren’t liable for the company’s recourse debt.
Dividend Coverage: BPY generates enough EBIT to coverage interest expenses twice over. Granted, we’re about to enter an environment with (arguably) substantial operating losses. But, given the current price of the preferred shares, I think the worst-case is already baked in. For example, the current preferred share price at the original yield gets us $1.17/year in annual dividends. Should BPY be able to pay out a little over $1/share to their preferred holders until 2024? I think so.
The Risks: Most of BPY’s investments are shopping malls and office buildings. And as we’ve seen, many companies simply aren’t paying rent. The next couple of years will be rough. I wouldn’t be surprised to see dividends halted. But then again, that’s why cumulative dividends provide protection. At some point, those will get paid, at least before BPY pays common stock dividends.
Tsakos Energy Navigation Preferred Series D
32

April 11th, 2020
Business Description: Tsakos Energy Navigation is a holding company. Through its subsidiaries, Co. is a provider of international seaborne crude oil and petroleum product transportation services, as well as transporting liquefied natural gas. Co. operates a fleet of modern crude oil and petroleum product tankers that provide world-wide marine transportation services for national, primary and other independent oil companies and refiners under long, medium and short-term charters. Co.'s fleet also includes liquefied natural gas carriers and Suezmax shuttle tankers with advanced dynamic positioning technology.
Discount to Face Value: 30%
Preferred Specifications:
● Cumulative dividends with no redeemable or conversion rights. 8.750% annual dividend rate.
● Series D is senior to all common shares and Senior A Junior Preferred Shares. ● Series D preferred shares are redeemable on April 29th, 2020 at a redemption price
of $25.00 per share. ● TNP offers a fixed liquidation price. In other words, in the event of any liquidation
(voluntary or involuntary), holders of Series D preferred have the right to full redemption at $25/share.
● TNP has no obligation to redeem any of the Series D preferreds at any time. So, management would likely only redeem if they believe in further interest rate cuts.
Balance Sheet & Earnings Analysis:
Here’s a look at the last five years of earnings:
● 2015: $158M ● 2016: $56.5M ● 2017: $9.2M ● 2018: $-101M ● 2019: $14M
33
April 11th, 2020
As of last year, TNP generated enough EBITDA to cover interest expenses 3.4x over. And enough EBIT to cover interest 1.5x over.
Let’s move on to the balance sheet.
TNP has nearly $200M in cash and $2.6B in vessel value. Add in $300M in other assets and you’ve got total asset value around $3.1B.
Against those assets, TNP has $1.5B in long-term debt (along with $147M other liabilities) for total liabilities of $1.7B.
Net Debt/EBITDA remains at a respectable 5.8x.
Catalyst: As we look at shipping from 30,000ft, we see the obvious bullish thesis. Oil is in contango, charter rates are through the roof. Shippers are about to make a crap-load of money. This won’t last forever. It never does with the shipping industry. But it wouldn’t surprise me to see TNP generate gobs of cash, redeem their preferreds and pay all dividends.
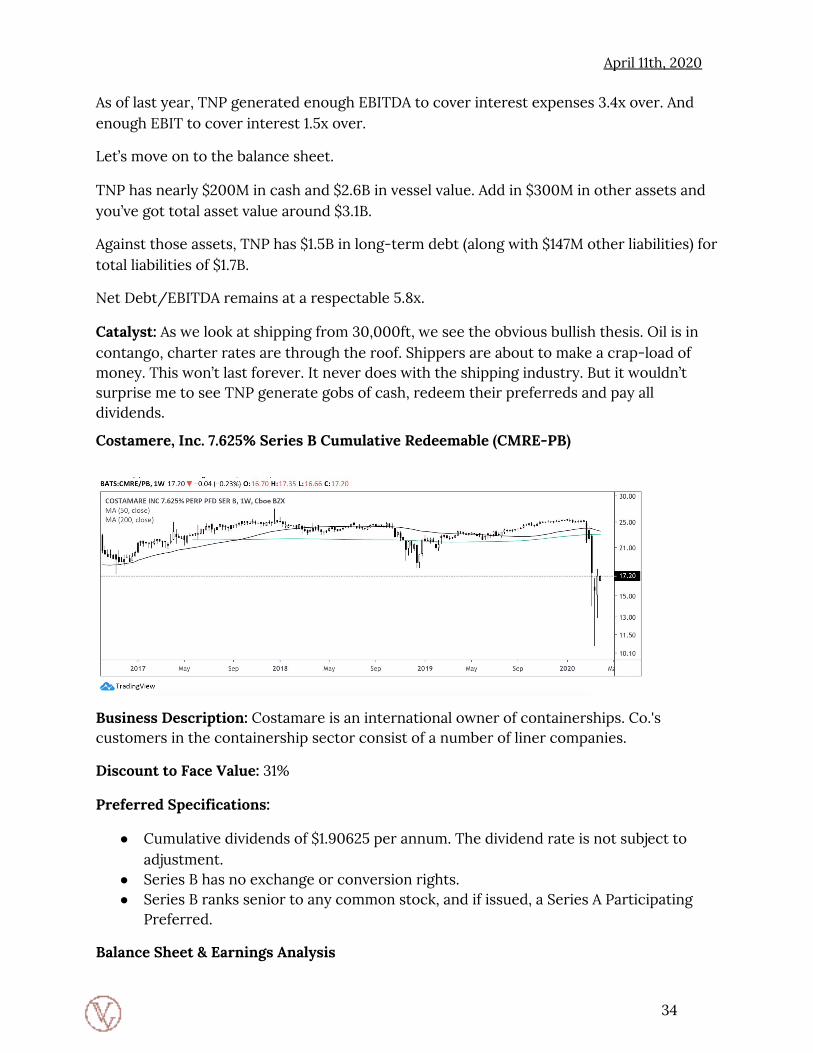
Costamere, Inc. 7.625% Series B Cumulative Redeemable (CMRE-PB)
Business Description: Costamare is an international owner of containerships. Co.'s customers in the containership sector consist of a number of liner companies.
Discount to Face Value: 31%
Preferred Specifications:
● Cumulative dividends of $1.90625 per annum. The dividend rate is not subject to adjustment.
● Series B has no exchange or conversion rights. ● Series B ranks senior to any common stock, and if issued, a Series A Participating
Preferred.
Balance Sheet & Earnings Analysis
34
April 11th, 2020
CMRE’s recorded positive net income for 13 consecutive years. That streak, especially in the shipping industry, is incredible.
Over the last five years, CMRE’s Earnings/Preferred Payout Ratio is over 3x.
Also, given the runway for earnings growth within the shipping industry, we’re confident CMRE will pay its dividend for the next few years.
Even during the GFC, CMRE’s Earnings/Fixed Charges & Preferred Payouts were: 2.54, 2.41 and 2.18. Plenty of overhead during our last recession.
Moving on to the balance sheet.
CMRE sports a strong balance sheet. They have about $200M in current assets ($148M is cash) and $2.6B in vessel value. Add in other long-term investments and you get over $3B in total assets.
On the liabilities side, CMRE owes $1.2B in long-term debt and has $266M in current liabilities ($211M from current portion of LT debt).
This gives CMRE a NAV of $1.41B (compare to current market cap of $515M).
Net Debt / EBITDA is 4.5x, low for the shipping industry.
CMRE is trading around 50% discount to NAV with 13 consecutive years of net income profitability. You’re getting 7.625% in annual dividends from a company with 13 years of consecutive net income profits and industry tailwinds. Not bad.
Golar LNG Ltd | 8.75% Series A Cumulative Redeemable Preferred Units (GMLPP)
Business Description: Golar LNG is a holding company. Through its subsidiaries, Co. is a midstream liquefied natural gas (LNG) company engaged in the transportation and regasification of LNG and the liquefaction of natural gas. Co. has three segments: Vessel Operations, which operates and charters out vessels on fixed terms to customers; floating liquefaction natural gas vessel (FLNG), which involves the conversion of its existing LNG carrier for the charter of a FLNG; and Power, in which Golar Power Limited, its joint venture, provides LNG based downstream solutions, through the ownership and operation
35
April 11th, 2020
of floating storage and regasification units and associated terminal and power generation infrastructure.
Golar is one of only five companies in the world that have owned and operated FSRUs and is only one of two companies to date to have retrofitted LNG carriers into FSRUs.
They also have no direct exposure to commodity prices and limited exposure to foreign currency exchange rates.
Discount to Face Value: 52%
Preferred Specifications:
● 8.75% Cumulative Dividend ($2.18/share) ● No conversion or exchange rights ● Call date is October 2022
Balance Sheet & Earnings Analysis:
GMLP has experienced 11 consecutive years of positive net income. But, net income declined over the last 11 years. This is in large part due to the shipping cycle, which should see renewed tailwinds over the next couple of years. Take a look at their earnings/fixed costs and preferred expense ratio:
● 2012: 3.83x ● 2013: 3.80x ● 2014: 3.98x ● 2015: 3.40x ● 2016: 3.71x ● 2017: 3.25x
Like all shippers, earnings are a top-line problem. Declining revenues reduce earnings and cash flow. At the same time, any increase in revenues flows directly to increased earnings and cash flow.
Now onto the balance sheet.
GMLP has $133M in current assets and $1.47B in PP&E. Add in another $190M in long-term investments and other assets and you get $2.1B in total assets.
Against those assets, GMLP has $991M in long-term debt, $120M in capital leases and around $100M in other liabilities for a total of $1.42B.
That gives GMLP a NAV around $653M (versus $229M market cap).
Net Debt / EBITDA is 6x (which is about the extent that I’m comfortable).
36

April 11th, 2020
Safe Bulkers 8% Cumulative Preferred (SB-D)
Business Description: Safe Bulkers is an international provider of marine dry bulk transportation services, transporting bulk cargoes, particularly coal, grain, and iron ore, along worldwide shipping routes for consumers of marine dry bulk transportation services. Co.'s principal business is the ownership and operation of dry bulk vessels. Co.'s vessels operate worldwide, carrying dry bulk cargo for the consumers of marine dry bulk transportation services.
Discount to Face Value: 40%
Preferred Specifications:
● 8% Cumulative Dividend ($2/share) ● In March 2020, SB instituted a buyback program for its Series C and D stock. This is
a positive sign as the company could if they wanted to, redeem the Series D preferreds the same way they did the Series B.
● Not convertible into common stock and are not redeemable at the option of the holder.
Balance Sheet & Earnings Analysis:
Let’s start with the balance sheet.
Average interest rate, including margin for all bank loan and credit facilities was 1.73% as of 2014.
SB’s reduced its total long-term debt over the last five years by $30M. They’ve also reduced total liabilities by $50M during that same time.
The company has $134M in current assets ($104M in cash) and $944M in PP&E. In total, they sport 1.1B in asset value.
SB also has $86M in current liabilities (with $64M from current portion of LT debt). Add to that another $537M in long-term debt for total liabilities of $624M.
37

April 11th, 2020
This gives us a NAV of $490M (versus $121M market cap).
Their EBIT covers its interest expense 1.53x over, and they leveraged 5.24x on a net debt / EBITDA basis.
Now onto earnings.
They’ve paid the annual dividend each of the last five years. Over the last two years, SB’s returned to profitability, earning $27M in 2018 and $16M in 2019. And they maintain >20% 3YR average EBIT margin.
New York Mortgage Trust (NYMTP) Series B 7.75% Cumulative
Business Description: New York Mortgage Trust is a real estate investment trust engaged in acquiring, investing in, financing and managing mortgage-related and residential housing-related assets.
Co.'s investment portfolio includes structured multi-family property investments such as multi-family commercial mortgage-backed securities and preferred equity in, and mezzanine loans to, owners of multi-family properties; residential mortgage loans, including distressed residential mortgage loans, non- qualified mortgage loans, second mortgages, and other residential mortgage loans, non-Agency residential mortgage-backed securities (RMBS), Agency RMBS and other mortgage-related and residential housing-related assets.
49% of their assets are single-family residential. The remaining portion focuses on multi-family residential.
Discount to Face Value: 62%
Preferred Specifications:
● 7.75% Cumulative Dividend ($1.93/year)
38

April 11th, 2020
● Trading post-call date ● Convertible into common stock upon occurrence of Change of Control
A. The ability to convert the preferred into common rests in the hands of the shareholder -- this is obviously shareholder-friendly.
● No stated maturity date ● If NYMT liquidates, dissolves or winds up, Series B holders have the right to receive
$25/share for their preferred stock.
Balance Sheet & Earnings Analysis:
We’ll start with the balance sheet. NYMT has $18B in long-term debt, with $3B currently due. That makes up all their liabilities. We should take a look at the interest expense on that debt. NYMT’s Residential CDO debt averages 2.64% - 3.12%Their convertible notes average 8.24%. The convertible notes mature in January 2022. Finally, their subordinated debentures average 3-month LIBOR + 3.75%. The debentures mature in March 2035.
On the asset side of the balance sheet, the company sports $134M in current assets, most of it cash. They also have $20B loans and loan receivables for total current assets of around $21B.
Add to that $2.4B in long-term investments and you’ve got $23.5B in asset value.
NYMT’s NAV is around $2.5B (or $6.63/share).
Now onto the earnings analysis.
The company generates 77% net income margins and trades for 3x current earnings. Of course, this year’s earnings mean nothing, and next year's earnings could also be non-indicative of the future.
But even if we average the last five years’ earnings ($84M/year) NYMT trades at a mere 4x.
Also, NYMT hasn’t had a net income loss in eleven years (going back to GFC, they lost $55M and $24M).
We can average the last five years or Earnings/Preferred Share Distributions and get over 5x. That’s a healthy margin on their preferred distributions. Like BPY, things will get a lot worse before they get better. If there is a silver lining, it’s that most of NYMT’s mortgages are single-family homes or multi-family properties.
39
April 11th, 2020
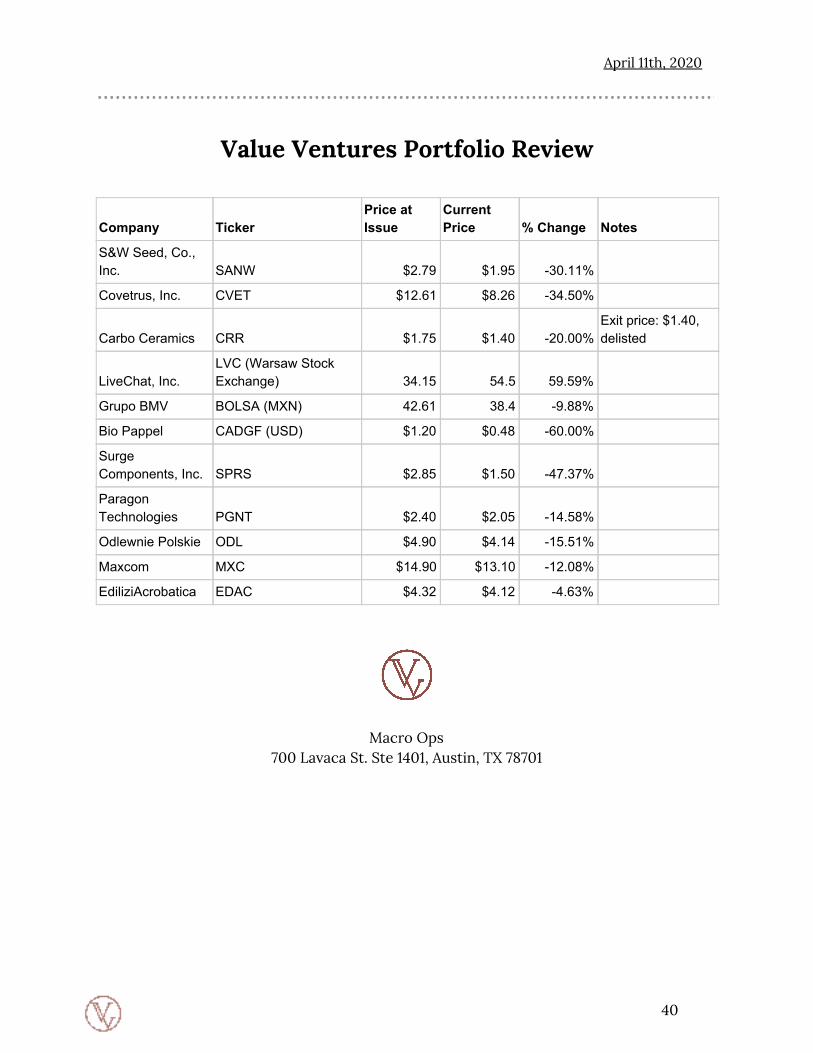
Value Ventures Portfolio Review
Company Ticker Price at Issue
Current Price % Change Notes
S&W Seed, Co., Inc. SANW $2.79 $1.95 -30.11%
Covetrus, Inc. CVET $12.61 $8.26 -34.50%
Carbo Ceramics CRR $1.75 $1.40 -20.00% Exit price: $1.40, delisted
LiveChat, Inc. LVC (Warsaw Stock Exchange) 34.15 54.5 59.59%
Grupo BMV BOLSA (MXN) 42.61 38.4 -9.88%
Bio Pappel CADGF (USD) $1.20 $0.48 -60.00%
Surge Components, Inc. SPRS $2.85 $1.50 -47.37%
Paragon Technologies PGNT $2.40 $2.05 -14.58%
Odlewnie Polskie ODL $4.90 $4.14 -15.51%
Maxcom MXC $14.90 $13.10 -12.08%
EdiliziAcrobatica EDAC $4.32 $4.12 -4.63%
Macro Ops 700 Lavaca St. Ste 1401, Austin, TX 78701
40